

Abstract
The antidiabetes effects of Roux-en-Y gastric bypass (RYGB) are well-known, but the underlying mechanisms remain unclear. Isolating the proximal small intestine, and in particular its luminal glucose sensors, from the nutrient stream has been proposed as a critical change, but the pathways involved are unclear. In a rodent model, we tested the effects of isolating and then stimulating a segment of proximal intestine using glucose analogs to examine their impact on glucose absorption (Gabsorp) and hormone secretion after a glucose bolus into the distal jejunum. Analogs selective for sodium-glucose cotransporter (SGLT) family members and the sweet taste receptor were tested, and measurements of the portosystemic gradient were used to determine Gabsorp and hormone secretion, including GLP-1. Proximal intestinal isolation reduced Gabsorp and GLP-1 secretion. Stimulation of the glucose-sensing protein SGLT3 increased Gabsorp and GLP-1 secretion. These effects were abolished by vagotomy. Sweet taste receptor stimulation only increased GLP-1 secretion. This study suggests a novel role for SGLT3 in coordinating intestinal function, as reflected by the concomitant modulation of Gabsorp and GLP-1 secretion, with these effects being mediated by the vagus nerve. Our findings provide potential mechanistic insights into foregut exclusion in RYGB and identify SGLT3 as a possible antidiabetes therapeutic target.
Introduction
The worldwide epidemic of type 2 diabetes (T2D) and obesity calls for safer and more effective treatments that can be made available globally. Roux-en-Y gastric bypass (RYGB) is the most effective treatment currently available for T2D (1), but, despite the fact that it has superior efficacy compared with the best medical treatment alone, offering this procedure on a global scale is not feasible. A less invasive alternative with similar metabolic benefits is urgently needed.
Animal studies have highlighted a role for proximal intestinal exclusion in RYGB (2), and our laboratory has previously shown that this reduces the rate of glucose absorption (Gabsorp) by the small intestine (3). These effects have sparked interest in an endoscopically placed barrier, the endoluminal sleeve (ELS), to prevent nutrients from contacting the proximal intestinal wall, with early clinical data showing a promising antidiabetes effect (4). Though these intriguing results suggest a critical role for the proximal intestine in the antidiabetes effects of RYGB, the molecular details of the pathway and the identity of the nutrient sensors involved remain elusive.
Putative glucose-sensing proteins include the sweet taste receptor (5) and members of the sodium-glucose cotransporter (SGLT) family, including SGLT1 and SGLT3 (6). In intact rats, we previously showed that stimulation of the intestinal sweet taste receptor upregulated SGLT1 activity distally (5). However, we later observed that stimulating the sweet taste receptor in the isolated biliopancreatic limb post-RYGB did not increase Roux limb Gabsorp, suggesting that bypassing this receptor is unlikely to account for the effect of RYGB on Gabsorp (7). We have thus turned our attention to assessing the sensing roles of other potential receptors in regulating intestinal function and the impact of foregut exclusion.
In addition to the foregut, evidence is emerging for a sensory function of the portal vein (8,9). Situated as a conduit for blood and nutrients between the intestine and liver, the portal vein is a potentially important signaling point to integrate the absorptive and endocrine functions of the intestine (and pancreas) with hepatic metabolic functions. Intestinal nutrient absorption and incretin secretion into the portal blood make it a key contributor to the portal milieu. However, changes in this milieu during the absorptive phase before or after foregut exclusion have not been studied. The aim of this study was to characterize the role of the foregut in modulating the absorptive and endocrine functions of the small intestine and its effect on the portal milieu.
Research Design and Methods
Surgical Procedures
Animal studies were performed in accordance with protocols prospectively approved by the Harvard Medical Area Standing Committee on Animals. Male Sprague-Dawley rats (220–240 g; Harlan Laboratories, Harlan, IN) were acclimatized for 7 days under a 12:12 light:dark cycle (lights on at 7:00 a.m.) with ad libitum access to standard rat chow. After an overnight fast, they were anesthetized using isoflurane (1–2% in oxygen). Experiments were consistently started at 9:00 a.m. to minimize diurnal variation in intestinal absorptive function as a confounding factor.
Portal and systemic venous blood was sampled before and during an intestinal glucose infusion to measure glucose and hormone levels, from which portosystemic gradients were used to calculate intestinal Gabsorp and hormone secretion. For systemic sampling, a silastic catheter (0.02 inch; Dow Corning) was advanced through the right jugular vein into the right atrium, allowing sampling of mixed systemic venous blood, and then secured with a silk suture. For portal sampling, a silastic catheter (0.012 inch; Dow Corning) was inserted through the superior mesenteric vein (SMV) into the portal vein. For this, a short length of SMV was controlled using curved vascular clamps (Fine Science Tools), the SMV punctured (27 gauge needle), and the catheter inserted and advanced to the portal vein. The portal vein diameter is ∼2.2 mm, and the portal catheter outer diameter is 0.64 mm, so the catheter will occupy <10% of the portal vein area. After each blood sample was taken, the catheter was flushed with heparinized saline (20 units/mL) to maintain patency throughout the experiment. The control group underwent whole intestinal (WI) infusion, where the intestinal catheter was placed directly in the duodenum and secured with a silk suture. A glucose bolus of 2 g/kg glucose (25%; dissolved in water), an amount equivalent to that given to rats in an oral glucose tolerance test, was then administered directly to the small bowel lumen over 5 min.
Proximal Intestinal Exclusion and Stimulation
In the remaining groups of rats, the jejunum was divided so that glucose analogs could be infused proximally into the duodenum/proximal jejunum (DJ segment) (at time −30 min) (Fig. 1) and a glucose bolus given distally into the remaining jejunum (2 g/kg at time 0 min). Isosmotic solutions (0.5 mL of 240 mmol/L solution in distilled water) were used as follows: DJ SAL (saline infusion: control infusion to control for the effects of intestinal distension and solution osmolarity; N = 6), DJ SAC (240 mmol/L saccharin infusion, sweet taste receptor agonist; N = 5), DJ 3-OMG (240 mmol/L 3-O-methyl-d-glucopyranoside infusion, SGLT1 substrate; N = 6), DJ αMG (240 mmol/L α-d-methylglucoside infusion, SGLT1 substrate and SGLT3 agonist, N = 5), and DJ αMG+PZ (addition of phlorizin 0.5 mmol/L, antagonist of SGLT1 and SGLT3; N = 4). A final group of rats was vagotomized (N = 5) to assess the role of the vagus, as described in detail below. The level of jejunal division was 16 cm distal to the ligament of Treitz (LOT), as this corresponds with the length of bypassed small intestine in our rat RYGB model (3,7). Portal and systemic blood was sampled at 0 min and then 10, 30, and 60 min after the start of the glucose bolus (200 μL from each catheter at each time point) and analyzed for glucose and hormone levels.
Figure 1.
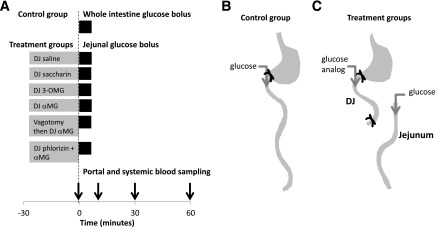
Experimental design. A: Time line of intestinal infusion and blood sampling. Gray bars indicate the substances infused into the DJ segment prior to the sampling period. Black bars indicate the 5-min glucose bolus into whole intestine (control) or jejunum (treatment). B: Whole intestine glucose bolus controls, in which glucose was infused into the duodenum. C: Treatment groups, in which agonists were infused into the DJ segment followed by a glucose bolus into the jejunum. See Research Design and Methods for details.
In the vagotomy group, vagotomy was performed at −30 min. An operating microscope was used to identify and divide the anterior and posterior vagal trunks at the subdiaphragmatic level, as we previously described (10).
At the end of each experiment, the intestine was harvested. Mucosal samples were taken from four intestinal segments: proximal jejunum (LOT to 16 cm distally), distal jejunum (16–26 cm from the LOT), proximal ileum (26–36 cm from LOT), and distal ileum (0–10 cm proximal to cecum). Samples were stored at −80°C.
Blood Analysis
Portal and systemic blood glucose levels were measured at each time point using a glucometer (LifeScan OneTouch). For hormonal analysis, blood was centrifuged at 4°C, 4,000g, for 15 min, the plasma aspirated, and stored at −80°C. Plasma GLP-1 (active), glucose-dependent insulinotropic peptide (GIP) (total), insulin, and peptide YY (PYY) levels were measured in duplicate using the Milliplex rat metabolic hormone panel (cat. no. RMHMAG-84K; Millipore, Darmstadt, Germany). Coefficient of variation was <20% for all samples.
Real-Time PCR for mRNA Expression
Intestinal expression of Sglt1 and Sglt3b mRNA was determined relative to β-actin (internal reference). RNA was extracted from tissue samples using the mirVana mRNA Isolation kit (Ambion) and quantified (Spectramax M5; Molecular Devices). RNA (2 μg) was reverse transcribed (Superscript III and oligo-dT; Invitrogen) to generate cDNA. Real-time PCR was then performed (ABI 7900HT; Applied Biosystems) on a 384-well plate using SYBR Green (Life Technologies). The primers used were as follows: Sglt3b, forward 5′-GAACATGTCCCACGTGAAGGC-3′ and reverse 5′-TGCAGAAGATGGCAAGCAAGAAC-3′; Sglt1, forward 5′-CCAAGCCCATCCCAGACGTACACC-3′ and reverse 5′-CTTCCTTAGTCATCTTCGGTCCTT-3′; and β-actin forward 5′-GGAGATTACTGCCCTGGCTCCTA-3′ and reverse 5′-GACTCATCGTACTCCTGCTTGCTG-3′.
Calculation of Intestinal Glucose Fluxes
The portosystemic glucose gradient (GPS) was calculated as follows: GPS = GP − GS, where GP is portal glucose level and GS is systemic glucose level at a given time point. At baseline (0 min), before the intestinal glucose infusion was started, GPS was negative (i.e., GP < GS) reflecting the net use of glucose by the intestine in the fasting state. After the intestinal glucose infusion was started, GPS became positive, indicating Gabsorp by the intestine into the portal bloodstream. The area under the GPS curve (11), corrected for baseline gradient (Fig. 2), was used to estimate intestinal Gabsorp (milligrams per hour) as follows: Gabsorp = GPS(AUC) × PBF × 10−2, where GPS(AUC) is area under the curve of GPS from 0 to 60 min (in milligrams per deciliter per minute) and PBF is portal blood flow (in milliliters per minute).
Figure 2.

Portal and systemic glucose excursions after intestinal glucose bolus in experimental groups. A: Control group. WI infusion. B: GPS gradient, which was calculated as the difference between the portal and systemic glucose levels. The gray AUC was used to calculate intestinal Gabsorp. C: Effect of DJ stimulation on intestinal Gabsorp. D: Effect of DJ stimulation on systemic incremental AUC (iAUC) from 0 to 60 min. VAG, vagotomy; PZ, phlorizin. #P < 0.05 vs. WI; *P < 0.05 vs. DJ SAL; **P < 0.05 vs. DJ αMG.
Portal Flow Measurement
PBF was measured using transabdominal ultrasound Doppler (Vevo 2100; VisualSonics). Under anesthesia, the upper abdomen of the rat was shaved and depilated. The portal vein, which runs from the splenic vein-SMV confluence to its bifurcation into left and right branches, was identified. The diameter was measured in the transverse section view at two points along its course and the mean calculated. The mean flow velocity was measured in the sagittal section view. PBF was calculated as the product of vein area and mean velocity. Portal vein diameter was 2.2 ± 0.1 mm. Portal flow was 8.4 ± 0.3 mL/min, which is consistent with previous reports (12). Because the portal catheterization prevented measurement of portal flow during intestinal infusions, we used this value for all of our calculations.
Calculation of Hormone Secretion
Hormone levels in portal and systemic blood were determined at 0, 10, 30, and 60 min. The portosystemic hormone gradient was calculated as follows: GLP-1PS = GLP-1P − GLP-1S, where GLP-1P and GLP-1S are portal and systemic GLP-1 levels (pg/mL), respectively. GLP-1PS was positive at baseline, as expected, and increased after glucose infusion, indicating GLP-1 secretion by the intestine into the portal blood. The area under the GLP-1PS curve was used to calculate intestinal GLP-1 secretion (GLP-1secrete [nanograms per hour]) as follows: GLP-1secrete = GLP-1PS(AUC) × PBF × 10−3, where GLP-1PS(AUC) is AUC of GLP-1PS from 0 to 60 min (picograms per milliliter per minute).
Similar calculations were used for GIP, insulin, and PYY. For facilitation of the interpretation of the GLP-1 data, portal and systemic levels at 0 min and AUC from 0 to 60 min were compared in addition to the calculated secretion.
Statistical Analysis
Data analysis was performed using Excel. The two-tailed unpaired t test was used for planned comparison of two groups. For comparing several agonists to a single control group, ANOVA with post hoc analysis was used. Data are presented as means ± SEM.
Results
Gabsorp
Baseline systemic glucose was 128 mg/dL and after WI glucose administration, it reached a peak of 353 mg/dL at 60 min (Fig. 2A). The GPS gradient became positive after the intestinal glucose bolus, reaching a peak gradient of 71 mg/dL at 30 min (Fig. 2B), and Gabsorp was 278 mg/h. DJ exclusion reduced peak systemic glucose (271 mg/dL; P < 0.05), incremental AUC (7,894 vs. 4,512 mg/dL min; P < 0.01) (Fig. 2D), and Gabsorp (DJ SAL, 115 mg/h; P < 0.05) (Fig. 2C) and peak GPS gradient (31 mg/dL; P < 0.05). DJ stimulation with glucose analogs showed that stimulation of SGLT3 using αMG, but not of SGLT1 alone (DJ 3-OMG) or the sweet taste receptor (DJ SAC), significantly increased Gabsorp (DJ αMG = 226 mg, DJ 3-OMG = 119 mg, and DJ SAC = 126 mg vs. DJ SAL = 116 mg). Importantly, αMG stimulated Gabsorp approximately twofold, whereas Gabsorp was unchanged by either 3-OMG or saccharin. Despite the increased Gabsorp in DJ αMG and increased peak portosystemic gradient (48 mg/dL), the systemic glucose level at 60 min remained lower than WI (258 vs. 353 mg/dL; P < 0.05), as did incremental AUC (7,894 vs. 4,401 mg/dL min; P < 0.01). The effect of αMG on Gabsorp was abolished by vagotomy as well as by the coadministration of phlorizin into the DJ segment, where Gabsorp was reduced to 128 mg/h and 95 mg/h, respectively. Portal and systemic curves for each group can be found in Supplementary Fig. 1.
GLP-1 Secretion
The baseline portosystemic GLP-1 gradient was positive (5.6 pg/mL) (Fig. 3), indicative of low basal GLP-1 secretion. After WI glucose infusion, GLP-1PS became more positive, reaching a peak gradient of 1,284 pg/mL and a peak systemic GLP-1 level of 130 pg/mL at 30 min (Fig. 3). GLP-1secrete was 356 ng/h. DJ exclusion tended to reduce GLP-1secrete (DJ SAL 113 ng/h; P = 0.07) with corresponding decreases in peak portal level (449 pg/mL) and peak PS gradients (348 pg/mL). DJ SAC led to an increase in portal and systemic GLP-1 levels at time 0 (Fig. 4), even before the jejunal glucose bolus. DJ αMG led to an increase in portal GLP-1 levels, and this effect was abolished by vagotomy. Portal AUCs in the DJ αMG and DJ SAC groups were significantly higher than that in the DJ SAL group. There were no differences in systemic AUC among the groups, highlighting the efficiency of the liver in clearing this hormone. Over the 60-min period, GLP-1 secretion was increased in both DJ αMG (222 ng/h; P < 0.05) and DJ SAC (244 ng/h; P < 0.05) groups compared with DJ SAL, with the effects of αMG again abolished by vagotomy (Fig. 3). Portal and systemic hormone level curves for each group can be found in Supplementary Figs. 2–7.
Figure 3.
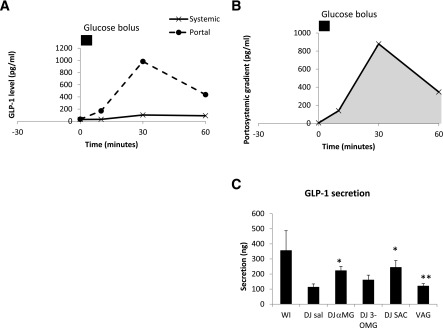
Portal and systemic GLP-1 excursions after intestinal glucose bolus in experimental groups. A: Control group. WI infusion. B: Portosystemic GLP-1 gradient, which was calculated as the difference between the portal and systemic GLP-1 levels. The gray AUC was used to calculate GLP-1 secretion. C: Effect of DJ stimulation on intestinal GLP-1 secretion and effect of vagotomy (VAG). *P < 0.05 vs. DJ SAL; **P < 0.05 vs. DJ αMG.
Figure 4.

GLP-1 levels in the indicated treatment groups in the systemic and portal circulations at 0 min (A and B, respectively) and AUC of the systemic and portal GLP-1 levels (C and D, respectively). *P < 0.05 vs. DJ SAL; #P < 0.05 vs. DJ αMG. VAG, vagotomy.
Insulin Secretion
The portosystemic insulin gradient corresponds to insulin newly secreted into portal blood as it leaves the pancreas. The baseline portosystemic insulin gradient was positive (829 pg/mL). After WI glucose infusion, insulin portosystemic gradient increased (Fig. 5), reflecting higher secretion. Insulin secretion by this measure did not differ significantly among the experimental groups. This result is consistent with the lack of effect of the glucose analog infusions on systemic levels of glucose (Fig. 2) as well as systemic GLP-1 levels (Fig. 4B). We note that insulin secretion trended lower in the DJ 3-OMG group and, while not statistically significant, may reflect an effect of 3-OMG on β-cells (discussed below).
Figure 5.
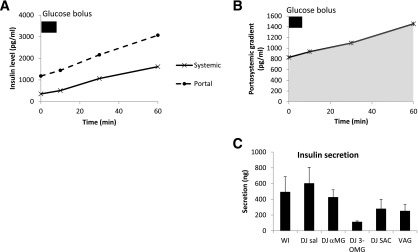
Portal and systemic insulin excursions after glucose infusion in experimental groups. A: Control group. WI infusion. B: Portosystemic insulin gradient, which was calculated as the difference between the portal and systemic insulin levels. The AUC was used to calculate insulin secretion. C: Effect of DJ stimulation on intestinal insulin secretion and effect of vagotomy (VAG).
Secretion of GIP and PYY
Secretion of both GIP and PYY were reduced by exclusion of the DJ segment (Fig. 6A and B, respectively). Stimulation of the DJ segment with the glucose analogs did not markedly affect secretion of either hormone (Fig. 6C and D).
Figure 6.

GIP and PYY secretion. Portal and systemic excursions of GIP (A) and PYY (B) in the WI infusion group. Secretion of GIP (C) and PYY (D), which was calculated using AUC of the portosystemic gradient. #P < 0.05 vs. WI. VAG, vagotomy.
Topography of Sglt3 and Sglt1 Expression
In the native intestine, the abundance of Sglt3b mRNA was similar in the jejunum and proximal ileum but significantly lower in the terminal ileum (P < 0.05) (Fig. 7). Sglt1 mRNA abundance was relatively similar throughout the intestine with a tendency toward lower expression in the terminal ileum. DJ αMG administration led to a twofold increase in distal jejunal Sglt1 expression (P < 0.05), and this effect was abolished by vagotomy.
Figure 7.

SGLT1 and SGLT3 expression in proximal jejunum (Prox jej), distal jejunum (Dist jej), proximal ileum (Prox ile), and distal ileum (Dist ile). A: Topography of Sglt3 mRNA expression. B: Topography of Sglt1 mRNA expression, and the effect of αMG. C: Distal jejunal Sglt1 expression, and effects of DJ exclusion, DJ αMG, and vagotomy (VAG). #P < 0.05 vs. distal ileum; *P < 0.05 vs. DJ SAL; **P < 0.05 vs. DJ αMG.
Discussion
The small intestine is the largest endocrine organ in the body along with its essential role in nutrient absorption. This study was designed to identify changes in both of these functions after foregut exclusion. Our goal was to evaluate the downstream effects of proximal intestinal exclusion and identify the factors that contribute to improved glucose homeostasis observed after RYGB surgery. Specifically, we measured portal glucose and hormone levels relative to systemic levels in response to independent stimulation of the proximal bowel with various agonists while administering glucose into the jejunum, thus replicating the nutrient flow after RYGB. Our results show that 1) in a model resembling RYGB in terms of foregut exclusion, intraluminal glucose is detected by the glucose-sensing protein SGLT3 in the proximal intestine; 2) this stimulation mediates an increase in Gabsorp more distally, with an associated increase in GLP-1 secretion; and 3) an intact vagus nerve is necessary for this pathway to function. Furthermore, this work shows that the sweet taste receptor also has a role in the regulation of GLP-1 secretion.
SGLT3 triggers a sodium-dependent membrane depolarization in the presence of glucose or αMG. It is expressed in the small intestine, though its precise location, whether on the intestinal lumen (13) or in the enteric plexuses (6), has yet to be determined. In our study, stimulation of SGLT3 almost doubled Gabsorp from 115 mg/h to 226 mg/h, the latter value being equivalent to 3.3 nmol · min−1 · mg of intestine−1. This in vivo rate is comparable with that previously obtained in our laboratory using the everted sleeve technique ex vivo (3).
We found that SGLT3 expression exhibits a cranio-caudal gradient, with levels higher in the jejunum and proximal ileum and lower in the distal ileum. This distribution would be expected for a nutrient sensor, in which expression abates in parallel with the typical levels of ingested nutrients. We have also shown that stimulation of proximal intestinal SGLT3 leads to a twofold increase in distal jejunal SGLT1 expression via a vagally mediated pathway. Our previous work showed that vagotomy alone did not alter intestinal glucose absorptive capacity (10) but that the vagus is important in mediating nutrient sensing (5).
Several previous studies by us and others have demonstrated a role for the sweet taste receptor in modulating Gabsorp. In wild-type mice, 2 weeks’ ingestion of the artificial sweetener sucralose increased SGLT1 mRNA and protein expression as well as glucose absorptive capacity but not in knockout mice lacking the sweet taste receptor (14). Our group showed that a 3-h infusion of saccharin in rats increased SGLT1 protein expression (5). In pigs, 3 days of saccharin ingestion increased SGLT1 mRNA and protein expression (15). However, the incomplete blockage of this effect after their administration of the sweet taste receptor antagonist lactisole suggested the presence of another glucose sensor. This is consistent with our recent report, showing that stimulating the excluded bilio-pancreatic limb with saccharin after RYGB did not increase Gabsorp in the Roux limb (7). Moreover, changes in SGLT3 expression suggested that it and/or other nutrient sensors may play a greater role after the intestinal division of RYGB. Taken together, these latter two studies suggest that, although a proximal intestinal glucose sensor is being excluded after RYGB, the critical sensor may not be the sweet taste receptor. Our current study suggests that SGLT3 is the critical sensor in foregut exclusion.
Our work also highlights a role for SGLT3 in regulating GLP-1 secretion. Previous studies have colocalized the sweet taste receptor and GLP-1 in rodent and human small intestine (16,17), and mice lacking components of the taste receptor showed deficient GLP-1 secretion (18). Glucose and sucralose stimulated GLP-1 secretion by human L -cells, and this was blocked by the sweet receptor antagonist lactisole. Lactisole also reduced GLP-1 secretion in response to intragastric glucose infusion in human subjects (16). These studies are consistent with the elevated portal and systemic GLP-1 levels that we observed after pretreatment with saccharin. However, a further study showed that lactisole did not suppress GLP-1 secretion after either an intraduodenal infusion or a mixed meal, concluding that another sensor was involved (19). Our data identify SGLT3 as the additional sensor in modulating GLP-1 secretion. This conclusion is also supported by in vitro and ex vivo studies by others. GLP-1 secretion was stimulated by αMG in the GLUTag enteroendocrine cell line, an effect that was blocked by phlorizin (20). αMG also stimulated GLP-1 secretion in an ex vivo perfused rat intestine model (21).
Our finding that saccharin stimulated GLP-1 secretion contrasts with the lack of GLP-1 response observed by Fujita et al. (22). However, distinctions in our models may provide an explanation. They measured GLP-1 secretion immediately after saccharin gavage, whereas we measured GLP-1 secretion induced by glucose infusion after saccharin stimulation. We propose that the combination of proximal saccharin and distal glucose was effective in increasing GLP-1 secretion, even though saccharin did not alter Gabsorp itself. Further studies will be necessary to clarify this phenomenon.
There were significant changes in GLP-1 secretion and portal GLP-1 levels (as assessed by AUC) after stimulation of either SGLT3 or the sweet taste receptor. We also noted differences at time = 0 min between the groups. However, fasting blood samples were not taken prior to the intervention (at time = −30 min), so we cannot unambiguously attribute these differences to the effects of the agonist, as baseline values were not measured. There were no differences in AUC of the systemic GLP-1 excursion among the groups. This may reflect GLP-1 breakdown by the enzyme dipeptidyl peptidase-4 in the liver, which would blunt the impact of GLP-1 secretion into the portal vein on systemic GLP-1 levels. This raises the question as to whether changes in portal GLP-1 levels alone may have physiological effects. There is growing evidence that portal GLP-1 levels may be detected by a portal GLP-1 sensor. GLP-1 receptor is expressed in the portal vein wall (23). Portal GLP-1 infusion triggers firing in afferent fibers of the hepatic branch of the vagus nerve (24) and in efferent fibers to the pancreas to cause insulin secretion (25). Sixty percent of insulin secretion may occur by this pathway in what has been termed the “neuro-incretin effect,” rather than by GLP-1 acting directly on the pancreas (26). An insulin-independent metabolic effect of portal GLP-1 has also been demonstrated in a canine study, where insulin levels were held constant and portal GLP-1 infusion increased hepatic glucose uptake and peripheral glucose disposal (27). Our data may support an insulin-independent mechanism for portal GLP-1 because SGLT3 stimulation increased Gabsorp and GLP-1 secretion without causing an increase in systemic glucose levels and without an increase in insulin secretion. Measuring hepatic and systemic glucose fluxes would be required to define these processes conclusively. As a final note on insulin secretion, we observed a marked trend toward lower secretion in the DJ 3-OMG group. We suggest that this reduction was caused by competitive inhibition of β-cell GLUT2 and glucose metabolism by absorbed 3-OMG, thereby diminishing glucose-stimulated insulin secretion.
Secretion of the other intestinal hormones, GIP and PYY, was reduced by foregut exclusion. GIP is secreted by K cells, which are predominantly proximally located (28), and PYY by L cells, located throughout the intestine (29). Proximal exclusion would therefore be expected to reduce hormone secretion. However, none of the glucose analogs tested altered secretion of GIP or PYY. Thus, the sensing mechanisms for these hormones appear to differ from that for GLP-1. It may be that glucose entry into the entero-endocrine cells is required. Indeed, SGLT1 and GLUT2, which both transport glucose, have been shown to mediate GIP secretion (30,31). Similarly, though L cells secrete both PYY and GLP-1, our data suggest that the secretion of these two hormones is regulated independently.
This in vivo model was designed to investigate the acute effects of proximal intestinal exclusion on intestinal function and the portal milieu. Gabsorp was calculated using the portosystemic gradient and portal flow measurements (11). While ex vivo methods such as everted sleeves or perfused intestinal preparations could have been used, our approach allowed us to measure responses in vivo, including, importantly, systemic interactions. This model enabled us to gain new insights into the regulation of intestinal function under physiological conditions. However, this model cannot fully explain some of the effects seen after RYGB and ELS, where foregut exclusion increases systemic GLP-1 levels (4,32). This contrasts with the decrease in GLP-1 levels that we have demonstrated in this acute model of foregut exclusion. It is possible that RYGB and ELS have longer-term effects on GLP-1 metabolism. Though these effects cannot be detected in an acute model such as this, we have demonstrated that rapid entry of nutrients to the distal part of the small intestine by direct infusion of glucose into the jejunum leads to a decrease rather than an increase in GLP-1 levels. Our ongoing work has focused on changes in GLP-1 dynamics after RYGB to characterize this discrepancy and explain the rise in systemic GLP-1 levels seen.
In summary, we demonstrate that two of the key functions of the small intestine, Gabsorp and GLP-1 secretion, are likely regulated by SGLT3 in the proximal intestine in a vagally mediated pathway. This SGLT3-dependent modulation of intestinal function coordinates an increased influx of glucose into the portal bloodstream with an increased GLP-1 secretion, with its subsequent effects on glucose metabolism. This work helps explain the role of foregut exclusion in the antidiabetes effect of RYGB and ELS, in particular the exclusion of SGLT3 and the consequent reduction in Gabsorp rate. We therefore identify SGLT3 as a novel therapeutic target. This work also provides insight into postprandial portal physiology and lays the foundation for future work, using portal infusions of glucose and glucose analogs, to investigate the role of portal sensors in postprandial glucose homeostasis.
Article Information
Acknowledgments. The authors thank Jan Rounds and Amy Blass (Brigham and Women's Hospital) for their managerial support.
Funding. This study was funded by National Institutes of Healthhttp://dx.doi.org/10.13039/100000002 grant 1R01-DK-084064 (to A.T.).
Duality of Interest. A.T. has an equity interest in Avaxia Biologics, a company that is developing oral antibodies for treatment of intestinal disorders, with potential applications for treatment of diabetes and obesity. No other potential conflicts of interest relevant to this article were reported.
Author Contributions. A.P. was responsible for study design and conduct; data collection, analysis, and interpretation; and writing of the manuscript. D.B.R. was responsible for data interpretation, writing of the manuscript, and manuscript review and approval. A.T. was responsible for study design, data analysis and interpretation, writing of the manuscript, and manuscript review and approval. A.T. is the guarantor of this work and, as such, had full access to all the data in the study and takes responsibility for the integrity of the data and the accuracy of the data analysis.
Prior Presentation. Parts of this study were presented in abstract form at the Society of Academic and Research Surgery Annual Meeting, Cambridge, U.K., 8–9 January 2014.
Footnotes
This article contains Supplementary Data online at http://diabetes.diabetesjournals.org/lookup/suppl/doi:10.2337/db14-1578/-/DC1.
References
- 1.Schauer PR, Bhatt DL, Kirwan JP, et al.; STAMPEDE Investigators . Bariatric surgery versus intensive medical therapy for diabetes--3-year outcomes. N Engl J Med 2014;370:2002–2013 [DOI] [PMC free article] [PubMed] [Google Scholar]
- 2.Rubino F, Forgione A, Cummings DE, et al. The mechanism of diabetes control after gastrointestinal bypass surgery reveals a role of the proximal small intestine in the pathophysiology of type 2 diabetes. Ann Surg 2006;244:741–749 [DOI] [PMC free article] [PubMed] [Google Scholar]
- 3.Stearns AT, Balakrishnan A, Tavakkolizadeh A. Impact of Roux-en-Y gastric bypass surgery on rat intestinal glucose transport. Am J Physiol Gastrointest Liver Physiol 2009;297:G950–G957 [DOI] [PMC free article] [PubMed] [Google Scholar]
- 4.de Jonge C, Rensen SS, Verdam FJ, et al. Endoscopic duodenal-jejunal bypass liner rapidly improves type 2 diabetes. Obes Surg 2013;23:1354–1360 [DOI] [PubMed] [Google Scholar]
- 5.Stearns AT, Balakrishnan A, Rhoads DB, Tavakkolizadeh A. Rapid upregulation of sodium-glucose transporter SGLT1 in response to intestinal sweet taste stimulation. Ann Surg 2010;251:865–871 [DOI] [PMC free article] [PubMed] [Google Scholar]
- 6.Diez-Sampedro A, Hirayama BA, Osswald C, et al. A glucose sensor hiding in a family of transporters. Proc Natl Acad Sci U S A 2003;100:11753–11758 [DOI] [PMC free article] [PubMed] [Google Scholar]
- 7.Bhutta HY, Deelman TE, le Roux CW, Ashley SW, Rhoads DB, Tavakkoli A. Intestinal sweet-sensing pathways and metabolic changes after Roux-en-Y gastric bypass surgery. Am J Physiol Gastrointest Liver Physiol 2014;307:G588–G593 [DOI] [PMC free article] [PubMed] [Google Scholar]
- 8.Burcelin R, Dolci W, Thorens B. Portal glucose infusion in the mouse induces hypoglycemia: evidence that the hepatoportal glucose sensor stimulates glucose utilization. Diabetes 2000;49:1635–1642 [DOI] [PubMed] [Google Scholar]
- 9.Delaere F1, Duchampt A, Mounien L, et al. The role of sodium-coupled glucose co-transporter 3 in the satiety effect of portal glucose sensing. Mol Metab 2012;2:47–53 [DOI] [PMC free article] [PubMed]
- 10.Stearns AT, Balakrishnan A, Radmanesh A, Ashley SW, Rhoads DB, Tavakkolizadeh A. Relative contributions of afferent vagal fibers to resistance to diet-induced obesity. Dig Dis Sci 2012;57:1281–1290 [DOI] [PMC free article] [PubMed] [Google Scholar]
- 11.Bach Knudsen KE, Jørgensen H, Canibe N. Quantification of the absorption of nutrients derived from carbohydrate assimilation: model experiment with catheterised pigs fed on wheat- or oat-based rolls. Br J Nutr 2000;84:449–458 [PubMed] [Google Scholar]
- 12.Mithieux G, Misery P, Magnan C, et al. Portal sensing of intestinal gluconeogenesis is a mechanistic link in the diminution of food intake induced by diet protein. Cell Metab 2005;2:321–329 [DOI] [PubMed] [Google Scholar]
- 13.Freeman SL, Bohan D, Darcel N, Raybould HE. Luminal glucose sensing in the rat intestine has characteristics of a sodium-glucose cotransporter. Am J Physiol Gastrointest Liver Physiol 2006;291:G439–G445 [DOI] [PubMed] [Google Scholar]
- 14.Margolskee RF, Dyer J, Kokrashvili Z, et al. T1R3 and gustducin in gut sense sugars to regulate expression of Na+-glucose cotransporter 1. Proc Natl Acad Sci U S A 2007;104:15075–15080 [DOI] [PMC free article] [PubMed] [Google Scholar]
- 15.Moran AW, Al-Rammahi MA, Arora DK, et al. Expression of Na+/glucose co-transporter 1 (SGLT1) is enhanced by supplementation of the diet of weaning piglets with artificial sweeteners. Br J Nutr 2010;104:637–646 [DOI] [PubMed] [Google Scholar]
- 16.Steinert RE, Gerspach AC, Gutmann H, Asarian L, Drewe J, Beglinger C. The functional involvement of gut-expressed sweet taste receptors in glucose-stimulated secretion of glucagon-like peptide-1 (GLP-1) and peptide YY (PYY). Clin Nutr 2011;30:524–532 [DOI] [PubMed] [Google Scholar]
- 17.Sutherland K, Young RL, Cooper NJ, Horowitz M, Blackshaw LA. Phenotypic characterization of taste cells of the mouse small intestine. Am J Physiol Gastrointest Liver Physiol 2007;292:G1420–G1428 [DOI] [PubMed] [Google Scholar]
- 18.Jang HJ, Kokrashvili Z, Theodorakis MJ, et al. Gut-expressed gustducin and taste receptors regulate secretion of glucagon-like peptide-1. Proc Natl Acad Sci U S A 2007;104:15069–15074 [DOI] [PMC free article] [PubMed] [Google Scholar]
- 19.Gerspach AC, Steinert RE, Schönenberger L, Graber-Maier A, Beglinger C. The role of the gut sweet taste receptor in regulating GLP-1, PYY, and CCK release in humans. Am J Physiol Endocrinol Metab 2011;301:E317–E325 [DOI] [PubMed] [Google Scholar]
- 20.Gribble FM, Williams L, Simpson AK, Reimann F. A novel glucose-sensing mechanism contributing to glucagon-like peptide-1 secretion from the GLUTag cell line. Diabetes 2003;52:1147–1154 [DOI] [PubMed] [Google Scholar]
- 21.Kuhre RE , Frost CR, Svendsen B, Holst JJ. Molecular mechanisms of glucose-stimulated GLP-1 secretion from perfused rat small intestine. Diabetes 2015;64:370–382 [DOI] [PubMed] [Google Scholar]
- 22.Fujita Y, Wideman RD, Speck M, et al. Incretin release from gut is acutely enhanced by sugar but not by sweeteners in vivo. Am J Physiol Endocrinol Metab 2009;296:E473–E479 [DOI] [PubMed] [Google Scholar]
- 23.Vahl TP, Tauchi M, Durler TS, et al. . Glucagon-like peptide-1 (GLP-1) receptors expressed on nerve terminals in the portal vein mediate the effects of endogenous GLP-1 on glucose tolerance in rats. Endocrinology 2007;148:4965–4973 [DOI] [PubMed] [Google Scholar]
- 24.Nishizawa M, Nakabayashi H, Uchida K, Nakagawa A, Niijima A. The hepatic vagal nerve is receptive to incretin hormone glucagon-like peptide-1, but not to glucose-dependent insulinotropic polypeptide, in the portal vein. J Auton Nerv Syst 1996;61:149–154 [DOI] [PubMed] [Google Scholar]
- 25.Nakabayashi H, Nishizawa M, Nakagawa A, Takeda R, Niijima A. Vagal hepatopancreatic reflex effect evoked by intraportal appearance of tGLP-1. Am J Physiol 1996;271:E808–E813 [DOI] [PubMed] [Google Scholar]
- 26.Nishizawa M, Nakabayashi H, Uehara K, Nakagawa A, Uchida K, Koya D. Intraportal GLP-1 stimulates insulin secretion predominantly through the hepatoportal-pancreatic vagal reflex pathways. Am J Physiol Endocrinol Metab 2013;305:E376–E387 [DOI] [PubMed] [Google Scholar]
- 27.Nishizawa M, Moore MC, Shiota M, et al. Effect of intraportal glucagon-like peptide-1 on glucose metabolism in conscious dogs. Am J Physiol Endocrinol Metab 2003;284:E1027–E1036 [DOI] [PubMed]
- 28.Damholt AB, Kofod H, Buchan AM. Immunocytochemical evidence for a paracrine interaction between GIP and GLP-1-producing cells in canine small intestine. Cell Tissue Res 1999;298:287–293 [DOI] [PubMed] [Google Scholar]
- 29.Hansen CF, Vrang N, Sangild PT, Jelsing J. Novel insight into the distribution of L-cells in the rat intestinal tract. Am J Transl Res 2013;5:347–358 [PMC free article] [PubMed]
- 30.Mace OJ, Schindler M, Patel S. The regulation of K- and L-cell activity by GLUT2 and the calcium-sensing receptor CasR in rat small intestine. J Physiol 2012;590:2917–2936 [DOI] [PMC free article] [PubMed] [Google Scholar]
- 31.Gorboulev V, Schürmann A, Vallon V, et al. Na(+)-D-glucose cotransporter SGLT1 is pivotal for intestinal glucose absorption and glucose-dependent incretin secretion. Diabetes 2012;61:187–196 [DOI] [PMC free article] [PubMed] [Google Scholar]
- 32.Muñoz R, Carmody JS, Stylopoulos N, Davis P, Kaplan LM. Isolated duodenal exclusion increases energy expenditure and improves glucose homeostasis in diet-induced obese rats. Am J Physiol Regul Integr Comp Physiol 2012;303:R985–R993 [DOI] [PMC free article] [PubMed] [Google Scholar]