

Abstract
Objective
Coronary artery disease (CAD), including myocardial infarction (MI), is the main cause of death in the world. Genome-wide association studies (GWAS) have identified dozens of single nucleotide polymorphisms (SNPs) associated with CAD/MI. One of the most robust CAD/MI genetic associations is with intronic SNPs in the gene PHACTR1 on chromosome 6p24. How these PHACTR1 SNPs influence CAD/MI risk, and whether PHACTR1 itself is the causal gene at the locus, is currently unknown.
Approach and results
Using genetic fine-mapping and DNA re-sequencing experiments, we prioritized an intronic SNP (rs9349379) in PHACTR1 as causal variant.We showed that this variant is an expression quantitative trait locus (eQTL) for PHACTR1 expression in human coronary arteries. Experiments in endothelial cell extracts confirmed that alleles at rs9349379 are differentially bound by the transcription factors MEF2. We engineered a deletion of this MEF2 binding site using CRISPR/Cas9 genome-editing methodology. Heterozygous endothelial cells carrying this deletion express 35% less PHACTR1. Finally, we found no evidence that PHACTR1 expression levels are induced when stimulating human endothelial cells with VEGF, TNFα or shear stress.
Conclusions
Our results establish a link between intronic SNPs in PHACTR1, MEF2 binding and transcriptional functions at the locus, PHACTR1 expression levels in coronary arteries and CAD/MI risk. Because PHACTR1 SNPs are not associated with the traditional risk factors for CAD/MI (e.g. blood lipids or pressure, diabetes), our results suggest that PHACTR1 may influence CAD/MI risk through as yet unknown mechanisms in the vascular endothelium.
Keywords: PHACTR1, genetic association study, eQTL, myocardial infarction, coronary artery disease
Introduction
Coronary artery disease (CAD), including myocardial infarction (MI), remains the main cause of death and disability worldwide despite a large number of efficient drugs to manage the traditional risk factors (e.g. blood lipids, blood pressure, heart rate)1. Recently, several new drugs have failed to show efficacy in large-scale clinical trials2-4, emphasizing the need for new therapeutic targets. CAD/MI is heritable and the functional study of its genetic determinants could yield new biological pathways important for disease etiology. Genome-wide association studies (GWAS) have already identified 45 single nucleotide polymorphisms (SNPs) robustly associated with CAD, including several markers that are not associated with the CAD epidemiological risk factors such as hypertension, dyslipidemia and type 2 diabetes5. One of these CAD/MI loci is located on chromosome 6p24 and is defined by a group of SNPs in linkage disequilibrium (LD) within the third intron of the gene PHACTR1. In addition to the genetic association between PHACTR1 SNPs and MI6 or CAD5, 7-9, these 6p24 SNPs have also been robustly associated with coronary artery calcification10, coronary artery stenosis11, migraine12, hemodynamic indexes13, and cervical artery dissection14.
It is currently unknown if PHACTR1 is the causal gene at the locus, and if causal, what are the mechanisms underlying its effect on CAD/MI. The protein encoded by PHACTR1 was initially identified in a yeast two-hybrid screen as a protein phosphatase 1 (PP1) interactor15. It is abundantly expressed in the nervous system, modulates PP1 phosphatase activity in vitro and also interacts with actin15. In human umbilical vein endothelial cells (HUVEC), it has been reported that PHACTR1 expression is induced upon treatment with vascular endothelial growth factor (VEGF)16 and that PHACTR depletion induces apoptosis and decreases tube formation17. In NIH3T3 fibroblasts, ectopically expressed PHACTR1 translocates to the nucleus following serum stimulation and this translocation depends on the competition of PP1 and G-actin for the PHACTR1 RPEL motifs and C-terminal domain18. Disruption of these domains inhibits the cytoplasmic/nuclear localization of PHACTR1 and impairs actomyosin assembly18. Recently, it was shown that PHACTR1 acts downstream of TGF-β to mediate actin reorganization and migration of breast cancer cells19.
The aim of our study was to determine if PHACTR1 is a good biological candidate for a role in CAD/MI. Here, we show that CAD/MI-associated SNPs at 6p24 correlate with PHACTR1 expression levels in coronary arteries. This result suggests that changes in PHACTR1 expression levels may modulate CAD/MI risk. We fine-mapped the association signal to a SNP in the third intron of PHACTR1, and showed that its alleles disrupt binding of the transcription factors MEF2. Deleting this MEF2 binding site using CRISPR/Cas9 reduces PHACTR1 expression in endothelial cells. Our findings support a possible role for PHACTR1 in the vascular endothelium and provide a framework to further understand how PHACTR1 SNPs, which are not associated with the epidemiological risk factors of cardiovascular diseases, can influence CAD/MI risk.
Materials and Methods
Materials and methods are available in the online-only Data Supplement.
Results
SNPs at PHACTR1 associate with MI in French Canadians
To characterize the genetic risk factors of CAD/MI in French Canadians, we genotyped SNPs previously associated with MI or CAD in 1176 MI cases and 1996 controls selected from the Montreal Heart Institute (MHI) Biobank (Supplemental Table I)5. Of the 45 SNPs that we genotyped successfully, 35 had an odds ratio (OR) consistent with the literature (binomial P=1.2×10⁻⁴) and 12 of these 35 SNPs were nominally significant (one-tailed P<0.05, binomial P=1.5×10⁻⁶)(Supplemental Table II). The strongest genetic association with MI risk that we observed was with rs12526453, a SNP located in the third intron of PHACTR1 (G-allele OR=0.79, P=8.4×10⁻⁴)6. To fine-map the genetic association between the PHACTR1 locus and MI risk in our population, we selected and genotyped 13 additional SNPs that cover common genetic variation at the locus based on genetic variation patterns in European-ancestry individuals from the 1000 Genomes Project (Supplemental Table III)20, 21. We also imputed ungenotyped markers using reference haplotypes from the 1000 Genomes Project21, 22. After filtering on imputation quality, we analyzed association between MI and genotypes for 387 DNA sequence variants (Supplemental Table IV). The strongest association with MI was with a genotyped SNP, rs9349379, located ~24 kilobases (kb) downstream of rs12526453 but still in intron 3 of PHACTR1 (G-allele OR=1.37, P=8.4×10⁻⁶)(Figure 1 and Table 1)23. When we conditioned on genotypes at rs9349379, no additional DNA markers were significantly associated with MI at the PHACTR1 locus (P>0.10).
Figure 1.
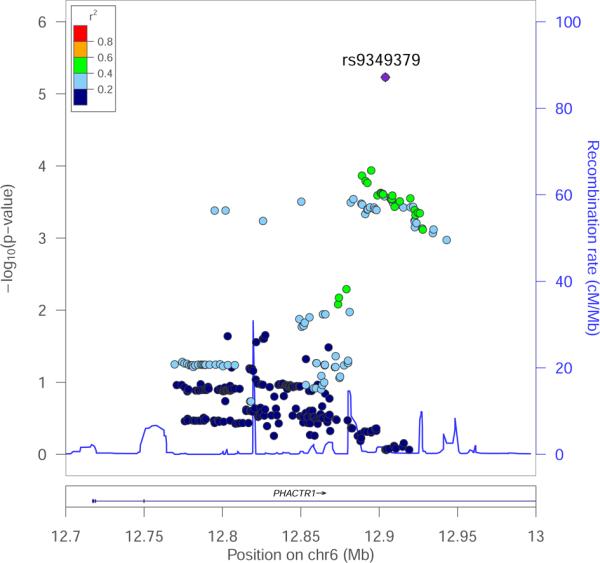
Association results between 387 genotyped or imputed DNA markers in PHACTR1 and myocardial infarction status in 3,172 French Canadians from the Montreal Heart Institute Biobank. rs9349379 has the strongest association signal (P=8.4×10⁻⁶). We used the LocusZoom tool to plot association results.
Table 1.
Association results between rs9349379 and myocardial infarction (MI) in the Montreal Heart Institute (MHI) Biobank. Genetic associations were also tested between rs9349379 and several MI risk factors: hypertension, type 2 diabetes, smoking, systolic and diastolic blood pressure, and LDL- and HDL-cholesterol levels. For dichotomous traits (MI, hypertension, type 2 diabetes), odds ratios (OR) and 95% confidence intervals (95% CI) are provided. For blood pressure measures and cholesterol levels, effect sizes (Beta) and standard errors (SE) are in mmHg and mmol/L, respectively. The direction of effect is given for the G-allele on the positive strand (NCBI build 37.1). The rs9349379 G-allele frequency in the MHI Biobank is 37%.
| Phenotype | N | rs9349379 (chr6:12903957) | |
|---|---|---|---|
| OR (95% CI) or Beta (SE) | P-value | ||
| Myocardial infarction | 1176 cases / 1996 controls | 1.37 (1.19-1.57) | 8.4×10⁻⁶ |
| Hypertension | 1543 cases / 1534 controls | 0.93 (0.83-1.05) | 0.25 |
| Type 2 diabetes | 473 cases / 2604 controls | 0.95 (0.81-1.10) | 0.49 |
| Smoking | 2018 cases / 1075 controls | 0.96 (0.86-1.07) | 0.46 |
| Systolic blood pressure | 3060 | −1.08 (0.51) | 0.035 |
| Diastolic blood pressure | 3058 | −0.37 (0.32) | 0.25 |
| LDL-cholesterol | 1668 | −0.013 (0.031) | 0.67 |
| HDL-cholesterol | 1679 | 0.0002 (0.012) | 0.99 |
We tested association between genotypes at PHACTR1 rs9349379 and several risk factors for MI in the MHI Biobank samples: hypertension and blood pressure, type 2 diabetes, LDL- and HDL-cholesterol levels, and smoking24. After accounting for the number of phenotypes tested, none of the associations were significant (Table 1), consistent with results from large meta-analyses of genome-wide association results for these traits25-27. This suggests that genetic variation at the PHACTR1 locus may influence MI risk through an unanticipated risk factor.
Coding variants in PHACTR1 are not associated with MI
We tried to link genetic variation at the PHACTR1 locus with a specific gene, focusing initially on the PHACTR1 gene itself. Identification of rare and functional DNA sequence variants by exon re-sequencing can be used to establish gene causality28, 29. As part of a parallel study, we re-sequenced all 14 exons of PHACTR1 in 500 early-onset MI cases and 500 matched controls from the MHI Biobank (Supplemental Table V)30. We identified four novel rare exonic variants: two missense variants (ss836901033 (p.Ser190Pro) and ss836901061 (p.Glu196Lys)), as well as a 3’ splice site variant (exon 12, ss836901074) and a 3’UTR variant (ss836901090)(Supplemental Table III). We also queried data from the 1000 Genomes Project and found three additional rare non-synonymous DNA sequence variants: one frameshift indel (rs36000655) and two missense variants (rs61746695 (p.Arg94Pro) and rs17602409 (p.Ile247Met)).
We genotyped six of these markers (the 3’ splice site variant ss836901074 failed assay design) in the MHI Biobank MI panel. The three 1000 Genomes Project variants were monomorphic in our DNA collection. After excluding the re-sequenced samples, the carrier frequencies for the remaining three PHACTR1 variants (ss836901033, ss836901061, ss836901090) were 1.0% in MI cases and 0.7% in controls (0.3% and 0.1% in cases and controls, respectively, when restricting to missense variants only). The gene-based MI association results for the three coding variants or only the two missense variants were, respectively, P=0.38 and P=0.089 (Materials and Methods). We also genotyped the same three rare PHACTR1 coding variants in an additional subset of the MHI Biobank (870 MI cases and 1494 controls). The carrier frequencies were 1.4% in cases and 1.3% in controls for the three variants (P=0.95) and 0.2% in cases and 0.3% in controls for the two missense variants alone (P=0.51). Consistent with our results, rare coding variants in PHACTR1 were not associated with MI risk in a recent large-scale whole-exome sequencing project carried out in 4,703 MI cases and 5,090 controls (gene-based P>0.3, Supplemental Table VI)31. Thus, we cannot conclude that rare coding genetic variation implicates PHACTR1 in MI.
PHACTR1 rs9349379 is an eQTL in human coronary arteries
Correlation between SNP genotypes and gene expression levels has also been used to identify causal genes involved in complex human diseases32. PHACTR1 was originally identified as a gene highly expressed in the nervous system15. We screened several human tissues and cell lines and detected PHACTR1 expression in the heart, aorta, and primary endothelial cells (HUVEC)(Figure 2A).
Figure 2.

PHACTR1 gene expression in human tissues. (A) PHACTR1 expression levels were measured by quantitative PCR (experiment done in quadruplicates). Results were normalized on the housekeeping gene HPRT and calibrated on the expression in the heart (post-infarct). Error bars represent standard deviations. (B) rs9349379 is an expression quantitative trait locus (eQTL) for PHACTR1 in human right coronary arteries (total n=25). The dashed line represents the best-fit regression line for PHACTR1 expression levels.
Based on these expression results and the reported association between PHACTR1 SNPs and CAD/MI, we obtained and extracted RNA from 25 human right coronary arteries to measure PHACTR1 transcript levels. These samples were from patients undergoing heart transplant at the MHI (Supplemental Table VII). We also genotyped PHACTR1 rs9349379 in the DNA of the same patients. We detected an association between genotypes at rs9349379 and PHACTR1 expression levels in this tissue (r2=0.21, P=0.018)(Figure 2B). We also measured in the same coronary artery samples the expression of all coding genes located 1 megabase on either side of rs9349379 and found no association with genotypes at this marker (Supplemental Figure I). Thus, the association between genotypes and expression levels seems to be specific to PHACTR1 within this locus in human coronary arteries.
We genotyped and imputed PHACTR1 SNPs in the DNA extracted from the 25 right coronary artery donors, as described above (Materials and Methods, Supplemental Table III). When we conditioned on genotypes at rs9349379, no other markers were significantly associated with PHACTR1 expression levels, consistent with the MI genetic association results (Supplemental Table VIII). This suggests that rs9349379 is an expression quantitative trait locus (eQTL) for PHACTR1 in human right coronary arteries, providing an argument in favor of PHACTR1 being at least one of the genes at the 6p24 locus implicated in CAD/MI development. Because we could not identify an independent collection of human coronary arteries to replicate this eQTL effect, we turned to functional characterization to understand how genotypes at rs9349379 may modulate PHACTR1 expression levels.
rs9349379 alleles modulate MEF2 binding at the PHACTR1 locus
There are no genetic variants in the 1000 Genomes Project European populations in strong LD with rs9349379 (no variants with r2≥0.8). We queried data from the ENCODE and Roadmap Epigenomics Projects to identify how genotypes at rs9349379 can influence PHACTR1 expression33. There is no functional annotation in ENCODE for rs9349379. In the Roadmap Epigenomics data, chromatin state predictions based on histone tail modifications suggest that rs9349379 is located in a transcriptional enhancer in skeletal and stomach smooth muscle. However, we could not measure PHACTR1 expression in intestine smooth muscle, highlighting the importance to validate these bioinformatic predictions by direct biological experiments (Figure 2A). Although the Roadmap Epigenomics Project plans on testing several relevant human tissues for CAD/MI, notably the heart and aorta, these results are not yet publicly available.
Additional in silico searches revealed that rs9349379 lies within a predicted binding site for the transcription factors myocyte enhancer factor-2 (MEF2). MEF2 is a family of transcription factors encoded by four genes in humans (MEF2A-D) and is important for cellular differentiation and stress response34. A previous report suggested that genetic variation in MEF2A might predispose to CAD risk 35, although this result is controversial36, 37. In the presence of the A-allele at rs9349379, the DNA sequence matches perfectly the canonical MEF2 binding site except for a C-to-A change at the 5’ end of the motif (Figure 3). The G-allele at rs9349379, associated with lower PHACTR1 expression in right coronary arteries, disrupts the MEF2 binding motif (Figure 3). To determine if rs9349379 is bound by MEF2, we performed electromobility shift assays (EMSA) with HUVEC nuclear extracts. These experiments showed that the probe with the A-allele at rs9349379, but not the G-allele, is shifted by proteins in the nuclear extract (Figure 3). When we added an antibody that recognizes either MEF2A or MEF2C, we observed a supershift of Probe A, indicating that MEF2 is one of the binding proteins (Figure 3). Furthermore, the interaction is specific as addition of excess unlabeled Probe A, but not Probe G, could efficiently disrupt the shift (Figure 3). Although we cannot completely rule out a role for MEF2C in the observed supershift, siRNA-mediated knockdowns indicate that MEF2A is the most abundant MEF2 transcription factor in HUVEC that is recognized by the anti-MEF2 antibody (Supplemental Figure II). When we reduced the expression of MEF2A or MEF2C using siRNA in HUVEC, we did not detect a reduction in PHACTR1 expression levels. However, the incomplete knockdowns of MEF2A and MEF2C (Supplemental Figure II), or other compensatory mechanisms, might explain the lack of effect on PHACTR1 expression.
Figure 3.

PHACTR1-rs9349379 is differentially bound by MEF2. Electrophoretic mobility shift assays (EMSA) with human umbilical vein endothelial cell (HUVEC) nuclear extract. Probe C contains the canonical MEF2 binding site and acts as positive control. Probes A and G differ by their respective allele at rs9349379 : the G-allele disrupts the MEF2 consensus binding site. Only Probe A shifts in the presence of nuclear extract (arrow, left panel), and the complex supershifts when an antibody against MEF2 is added (arrowhead, left panel). The binding between Probe A and MEF2 is specific: excess unlabeled (cold) Probe A, but not unlabeled Probe G, competes and disrupts the interaction between labeled Probe A and MEF2 (star, right panel).
The MEF2 binding site at rs9349379 controls PHACTR1 expression in vivo
To provide further in vivo evidence that the MEF2 binding site that overlaps with rs9349379 is important to modulate the expression of PHACTR1 in endothelial cells, we engineered its deletion using the CRISPR/Cas9 system (Figure 4A). Starting with human embryonic stem cells (hESCs), we introduced a guide RNA that specifically targets rs9349379. After screening, we identified a clone that carries a heterozygous 34-base pairs (bp) deletion that removes rs9349379 as well as all but one bp of the MEF2 binding site (Figure 4A). We then differentiated wild-type and heterozygous hESCs into endothelial cells using an established protocol (Materials and Methods)38, 39. Endothelial cells that carry the 34-bp deletion at rs9349379 express 35% less PHACTR1 than cells homozygous for the high-expressing A-allele at rs9349379 (Figure 4B). This represents a promising in vivo validation of the potential regulatory role of rs9349379 in the control of PHACTR1 expression in the vascular endothelium. This result is also consistent with our eQTL result.
Figure 4.

A CRISPR/Cas9-induced deletion that encompasses rs9349379 and the MEF2 binding site reduces PHACTR1 expression in endothelial cells. (A) Schematic representation of the PHACTR1 locus. The star (bold, underline) corresponds to rs9349379 in intron 3 of PHACTR1 and the box highlights the DNA sequence targeted by the CRISPR guide RNA. We isolated a heterozygous clone that carries a 34-bp deletion (KO allele) that removes rs9349379 (bold) and most of the MEF2 binding site (underline). (B) Human endothelial cells that are heterozygous for the PHACTR1 34-bp deletion (HET) express 35% less PHACTR1 than wild-type cells (WT)(t-test P=0.03). Data shown is mean ± standard deviations. The experiment was done in triplicate.
No ectopic induction of PHACTR1 expression in HUVEC
In a previous report, VEGF treatment was shown to induce PHACTR1 expression in HUVEC17. We attempted to reproduce this result using a similar protocol. First, we confirmed that our HUVEC can respond to VEGF by demonstrating the phosphorylation of the mitogen-activated protein kinase (MAPK) ERK upon VEGF treatment (Supplemental Figure III). However, we could not measure by quantitative PCR a significant difference in PHACTR1 expression levels using different VEGF concentrations and induction times (Figure 5A). We also tested the effect of tumor necrosis factor (TNF)-α, an inflammatory molecule that can trigger endothelial dysfunction, and shear stress, a stimulus known to protect blood vessels from atherosclerosis, on PHACTR1 expression levels in HUVEC. In both cases, we showed induction of the positive controls, NFKB1 for TNFα and KLF2 for shear stress. However, we again did not measure a significant change in PHACTR1 expression levels (Figures 5B-C).
Figure 5.
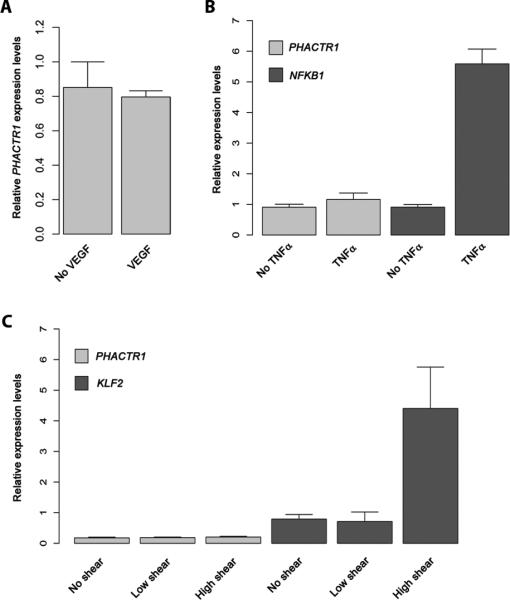
Different endothelial cell stimuli do not induce PHACTR1 expression levels as measured by quantitative PCR. (A) Serum-starved HUVEC were treated with VEGF (20ng/mL) for five minutes before RNA was extracted and PHACTR1 transcript levels measured. See Supplemental Figure III for the positive control of this experiment. (B) HUVEC were treated with TNFα (10ng/mL) for 16 hours. RNA was extracted and the levels of PHACTR1 and NFKB1 (positive control) were quantified by quantitative PCR. (C) HUVEC were treated with no, low or high shear stress. RNA was extracted six hours after the beginning of the experiments, and PHACTR1 and KLF2 (positive control) expression levels were measured by quantitative PCR. The same results were observed after 24 hours of shear stress. For all panels, data shown is mean ± standard deviations. The VEGF and TNFα experiments were done in triplicates; we had four replicates for the shear stress experiment. All comparisons are non-significant (t-test P>0.05), except for NFKB1 without and with TNFα treatment (P=7.8×10⁻⁵) and for KLF2 without and with high shear stress (P=0.0012).
Discussion
The genetic association between intronic SNPs in PHACTR1 and CAD/MI is robust, relatively strong for a GWAS finding (odds ratio for the risk allele at rs9349379 is 1.37 in the MHI Biobank) and pleiotropic (the same SNPs are also associated with coronary artery calcification and stenosis, migraine, hemodynamic indexes, and cervical artery dissection). It is different from many of the known CAD/MI-associated SNPs because it is not associated with the traditional risk factors such as lipid levels, blood pressure or diabetes. This observation is promising, inasmuch as understanding how this genetic variation influences CAD/MI risk may yield new insights into the biology of atherosclerosis and potentially, in the long-term, new therapeutic strategies.
To translate this genetic discovery, we first need to connect genetic variants with genes. Our own DNA re-sequencing project and a large whole-exome sequencing effort failed to identify coding variants in PHACTR1 that might directly implicate this gene in MI30, 31. Previous eQTL experiments to link CAD/MI-associated PHACTR1 SNPs with its expression levels have equally been unsuccessful despite large sample sizes and a wide variety of tissues tested (leukocytes (including monocytes), liver, fat, skin, omentum, aortic media and adventitia, mammary artery, and lymphoblastoid cell lines)5, 40. Reasoning that the transcriptional effect might be tissue-specific, we measured an association between genotypes at rs9349379 and PHACTR1 expression levels in human coronary arteries. This is an important result because it supports PHACTR1 as a potential causal gene at the locus and suggests that low PHACTR1 expression levels in coronary arteries increase CAD/MI risk. Although coronary artery is not a homogenous tissue, the lack of PHACTR1 expression in smooth muscle and of eQTL effect in leukocytes support the idea that the vascular endothelium may be the most relevant tissue to study how PHACTR1 functions influence CAD/MI.
A recent report showed that the G-allele at PHACTR1-rs9349379 is associated with lower risk of cervical artery dissection14. The same G-allele is also associated with reduced migraine risk12, a known risk factor for cervical artery dissection41. These results are in sharp contrast with the reported association between the G-allele at rs9349379 and increased risk of CAD or MI. This is not the first report of a genome-wide genetic association of opposite effects of the same SNP on two diseases42. We will need to understand PHACTR1 biological activities to explain its opposite roles in cervical artery dissection and CAD/MI. Maybe PHACTR1 modulates a downstream pathway differently in carotid or cervical arteries than in coronary arteries? Or maybe it affects different biological pathways in these different artery tissues? Although to our knowledge it has not been tested, we would predict that rs9349379 would be an eQTL for PHACTR1 expression levels in human carotid and/or cervical arteries.
High-density genotyping and bioinformatic analyses pinpointed rs9349379 as a potential causal variant at the locus. Using in vitro assays, we showed that alleles at this intronic PHACTR1 SNP bind differentially members of the MEF2 transcription factor family. Furthermore, deletion of the MEF2 binding site that overlaps with rs9349379 reduced PHACTR1 expression in endothelial cells. A small exonic 21-bp deletion in MEF2A was originally described to cause familial CAD, although this result has not been widely replicated35-37. It is important to emphasize that our results are not invalidated by the lack of consistent association between genetic variation at MEF2A and CAD. First, we do not know if MEF2A or MEF2C (or both) recognize in vivo the binding motif that we characterized at rs9349379. Second, we do not need variation in MEF2 expression levels or activities to explain the variation in PHACTR1 expression levels. Changes in PHACTR1 expression levels are controlled, at least in part, by genotypes at rs9349379. MEF2 transcription factors remain good candidates for a role in atherosclerosis as they are present in the endothelium and are involved in maintaining vascular integrity34.
A previous report suggested that PHACTR1 expression levels in HUVEC can be induced upon VEGF treatment, but we were not able to reproduce this result despite trying different VEGF concentrations and induction times17. More generally, we explored if “classic” endothelial stimuli (VEGF, TNFα, and shear stress) can induce PHACTR1 expression. Under our stimulation protocols, we failed to ectopically change PHACTR1 expression levels in HUVEC. These negative observations are informative in guiding future experiments to determine if other endothelial stresses, potentially through MEF2 activation, may act synergistically with genotypes at rs9349379 to influence CAD/MI risk. In conclusion, our results provide an initial model (CAD/MI-associated SNPs at 6p24 affects MEF2 binding and consequently PHACTR1 expression levels) and a candidate tissue (vascular endothelium) to further characterize how PHACTR1 influences atherosclerosis independently of the traditional CAD/MI risk factors.
Supplementary Material
Significance.
Despite having efficient therapies and prevention strategies, coronary artery diseases remain one of the main causes of death in the World. Recent failed or futile clinical trials have highlighted the need to identify new therapeutic targets. Unbiased human genetic studies can provide such new entry points into disease pathophysiology. Genome-wide association studies for coronary artery disease risk have identified a robust signal for DNA polymorphisms within the PHACTR1 gene on chromosome 6. PHACTR1 single nucleotides polymorphisms are not associated with traditional atherosclerosis risk factors, such as blood lipids, hypertension or diabetes. Our work establishes a link between these genetic variants and PHACTR1 expression levels in human coronary arteries through a potential effect on the binding of the transcription factors MEF2 at the locus. These results set the stage to explore how PHACTR1 functions in the vascular endothelium influence coronary artery disease risk.
Acknowledgments
We thank all participants and staff of the Montreal Heart Institute (MHI) Biobank. We acknowledge the technical support of the Beaulieu-Saucier MHI Pharmacogenomic Center for DNA sequencing and genotyping. We thank Chantal St-Cyr from the “Réseau d’échange de tissus et d’échantillons biologiques (RÉTEB)” for providing human coronary artery samples.
Sources of funding
This work was funded by the Centre of Excellence in Personalized Medicine (CEPMed), the “Fonds de Recherche Santé Québec” (FRQS), the Canadian Institute of Health Research (CIHR-MOP136979) and the MHI Foundation (to G.L.), and the CIHR-MOP102489 (to S. Lehoux). S. Lehoux, J.C.T. and G.L. are Canada Research Chair holders. Sequencing of PHACTR1 was performed by the Myocardial Infarction Genetics Exome Sequencing Consortium with support from the National Heart, Lung, and Blood Institute (NHLBI) and the National Human Genome Research Institute (NHGRI) of the U.S. National Institutes of Health (NIH). Grant support included RC2 HL-103010, RC2 HL-102923, RC2 HL-102924, RC2 HL-102925, RC2 HL-102926 and 5U54HG003067-11. S.K. is supported by a Research Scholar award from the Massachusetts General Hospital (MGH), the Howard Goodman Fellowship from MGH, the Donovan Family Foundation, R01HL107816, and a Transatlantic Networks of Excellence award from Fondation Leducq. R.D. is supported by a Banting Fellowship from the CIHR. K.M. is supported by Grant R01-GM104464 from the United States National Institutes of Health (NIH) and a Cardiovascular Program Pilot Grant from the Harvard Stem Cell Institute. R.G. is supported by the LaDue Fellowship at Harvard University and the Sarnoff Foundation Scholar Award. H.-H. Won is supported by a postdoctoral award from the American Heart Association (15POST23280019).
Abbreviations
- bp
base pairs
- CAD
coronary artery disease
- CEU
Utah Residents with Northern and Western European Ancestry
- EMSA
electromobility shift assay
- eQTL
expression quantitative trait locus
- GWAS
genome-wide association study
- gDNA
genomic DNA
- HDL
high-density lipoprotein
- HRM
high-resolution melting
- hESC
human embryonic stem cell
- HUVEC
human umbilical vein endothelial cells
- KLF2
kruppel-like factor-2
- LDL
low-density lipoprotein
- MAF
minor allele frequency
- MAPK
mitogen activated protein kinase
- MHI
Montreal Heart Institute
- MI
myocardial infarction
- MEF2
myocyte enhancer factor-2
- NFKB1
nuclear factor of kappa light polypeptide gene enhancer in B-cells 1
- PHACTR1
phosphatase and actin regulator-1
- siRNA
short interfering RNA
- SKAT
sequence kernel association test
- SNP
single nucleotide polymorphism
- TBP
TATA-box binding protein
- TGF-β
transforming growth factor-β
- TNFα
tumor necrosis factor-α
- VEGF
vascular endothelial growth factor
Footnotes
Disclosures
None.
References
- 1.Lopez AD, Mathers CD, Ezzati M, Jamison DT, Murray CJ. Global and regional burden of disease and risk factors, 2001: Systematic analysis of population health data. Lancet. 2006;367:1747–1757. doi: 10.1016/S0140-6736(06)68770-9. [DOI] [PubMed] [Google Scholar]
- 2.Barter PJ, Caulfield M, Eriksson M, et al. Effects of torcetrapib in patients at high risk for coronary events. The New England journal of medicine. 2007;357:2109–2122. doi: 10.1056/NEJMoa0706628. [DOI] [PubMed] [Google Scholar]
- 3.Nissen SE, Tardif JC, Nicholls SJ, Revkin JH, Shear CL, Duggan WT, Ruzyllo W, Bachinsky WB, Lasala GP, Tuzcu EM. Effect of torcetrapib on the progression of coronary atherosclerosis. The New England journal of medicine. 2007;356:1304–1316. doi: 10.1056/NEJMoa070635. [DOI] [PubMed] [Google Scholar]
- 4.Schwartz GG, Olsson AG, Abt M, et al. Effects of dalcetrapib in patients with a recent acute coronary syndrome. The New England journal of medicine. 2012;367:2089–2099. doi: 10.1056/NEJMoa1206797. [DOI] [PubMed] [Google Scholar]
- 5.Deloukas P, Kanoni S, Willenborg C, et al. Large-scale association analysis identifies new risk loci for coronary artery disease. Nature genetics. 2013;45:25–33. doi: 10.1038/ng.2480. [DOI] [PMC free article] [PubMed] [Google Scholar]
- 6.Kathiresan S, Voight BF, Purcell S, et al. Genome-wide association of early-onset myocardial infarction with single nucleotide polymorphisms and copy number variants. Nature genetics. 2009;41:334–341. doi: 10.1038/ng.327. [DOI] [PMC free article] [PubMed] [Google Scholar]
- 7.Schunkert H, Konig IR, Kathiresan S, et al. Large-scale association analysis identifies 13 new susceptibility loci for coronary artery disease. Nature genetics. 2011;43:333–338. doi: 10.1038/ng.784. [DOI] [PMC free article] [PubMed] [Google Scholar]
- 8.Peden JF, Hopewell JC, Saleheen D, Chambers JC, Hager J, Soranzo N. A genome-wide association study in europeans and south asians identifies five new loci for coronary artery disease. Nature genetics. 2011;43:339–344. doi: 10.1038/ng.782. [DOI] [PubMed] [Google Scholar]
- 9.Lu X, Wang L, Chen S, et al. Genome-wide association study in han chinese identifies four new susceptibility loci for coronary artery disease. Nature genetics. 2012;44:890–894. doi: 10.1038/ng.2337. [DOI] [PMC free article] [PubMed] [Google Scholar]
- 10.O'Donnell CJ, Kavousi M, Smith AV, et al. Genome-wide association study for coronary artery calcification with follow-up in myocardial infarction. Circulation. 2011;124:2855–2864. doi: 10.1161/CIRCULATIONAHA.110.974899. [DOI] [PMC free article] [PubMed] [Google Scholar]
- 11.Hager J, Kamatani Y, Cazier JB, et al. Genome-wide association study in a lebanese cohort confirms phactr1 as a major determinant of coronary artery stenosis. PloS one. 2012;7:e38663. doi: 10.1371/journal.pone.0038663. [DOI] [PMC free article] [PubMed] [Google Scholar]
- 12.Freilinger T, Anttila V, de Vries B, et al. Genome-wide association analysis identifies susceptibility loci for migraine without aura. Nature genetics. 2012;44:777–782. doi: 10.1038/ng.2307. [DOI] [PMC free article] [PubMed] [Google Scholar]
- 13.Patel RS, Morris AA, Ahmed Y, Kavtaradze N, Sher S, Su S, Zafari AM, Din-Dzietham R, Waddy SP, Vaccarino V, Alexander RW, Gibbons G, Quyyumi AA. A genetic risk variant for myocardial infarction on chromosome 6p24 is associated with impaired central hemodynamic indexes. American journal of hypertension. 2012;25:797–803. doi: 10.1038/ajh.2012.41. [DOI] [PMC free article] [PubMed] [Google Scholar]
- 14.Debette S, Kamatani Y, Metso TM, et al. Common variation in phactr1 is associated with susceptibility to cervical artery dissection. Nature genetics. 2015;47:78–83. doi: 10.1038/ng.3154. [DOI] [PMC free article] [PubMed] [Google Scholar]
- 15.Allen PB, Greenfield AT, Svenningsson P, Haspeslagh DC, Greengard P. Phactrs 1-4: A family of protein phosphatase 1 and actin regulatory proteins. Proceedings of the National Academy of Sciences of the United States of America. 2004;101:7187–7192. doi: 10.1073/pnas.0401673101. [DOI] [PMC free article] [PubMed] [Google Scholar]
- 16.Allain B, Jarray R, Borriello L, Leforban B, Dufour S, Liu WQ, Pamonsinlapatham P, Bianco S, Larghero J, Hadj-Slimane R, Garbay C, Raynaud F, Lepelletier Y. Neuropilin-1 regulates a new vegf-induced gene, phactr-1, which controls tubulogenesis and modulates lamellipodial dynamics in human endothelial cells. Cellular signalling. 2011;24:214–223. doi: 10.1016/j.cellsig.2011.09.003. [DOI] [PubMed] [Google Scholar]
- 17.Jarray R, Allain B, Borriello L, Biard D, Loukaci A, Larghero J, Hadj-Slimane R, Garbay C, Lepelletier Y, Raynaud F. Depletion of the novel protein phactr-1 from human endothelial cells abolishes tube formation and induces cell death receptor apoptosis. Biochimie. 2011;93:1668–1675. doi: 10.1016/j.biochi.2011.07.010. [DOI] [PubMed] [Google Scholar]
- 18.Wiezlak M, Diring J, Abella J, Mouilleron S, Way M, McDonald NQ, Treisman R. G-actin regulates the shuttling and pp1 binding of the rpel protein phactr1 to control actomyosin assembly. Journal of cell science. 2012;125:5860–5872. doi: 10.1242/jcs.112078. [DOI] [PubMed] [Google Scholar]
- 19.Fils-Aime N, Dai M, Guo J, El-Mousawi M, Kahramangil B, Neel JC, Lebrun JJ. Microrna-584 and the protein phosphatase and actin regulator 1 (phactr1), a new signaling route through which transforming growth factor-beta mediates the migration and actin dynamics of breast cancer cells. The Journal of biological chemistry. 2013;288:11807–11823. doi: 10.1074/jbc.M112.430934. [DOI] [PMC free article] [PubMed] [Google Scholar]
- 20.1000 Genomes Project Consortium A map of human genome variation from population-scale sequencing. Nature. 2010;467:1061–1073. doi: 10.1038/nature09534. [DOI] [PMC free article] [PubMed] [Google Scholar]
- 21.1000 Genomes Project Consortium An integrated map of genetic variation from 1,092 human genomes. Nature. 2012;491:56–65. doi: 10.1038/nature11632. [DOI] [PMC free article] [PubMed] [Google Scholar]
- 22.Li Y, Willer CJ, Ding J, Scheet P, Abecasis GR. Mach: Using sequence and genotype data to estimate haplotypes and unobserved genotypes. Genetic epidemiology. 2010;34:816–834. doi: 10.1002/gepi.20533. [DOI] [PMC free article] [PubMed] [Google Scholar]
- 23.Pruim RJ, Welch RP, Sanna S, Teslovich TM, Chines PS, Gliedt TP, Boehnke M, Abecasis GR, Willer CJ. Locuszoom: Regional visualization of genome-wide association scan results. Bioinformatics. 2010;26:2336–2337. doi: 10.1093/bioinformatics/btq419. [DOI] [PMC free article] [PubMed] [Google Scholar]
- 24.Thomas J, Thomas DJ, Pearson T, Klag M, Mead L. Cardiovascular disease in african american and white physicians: The meharry cohort and meharry-hopkins cohort studies. Journal of health care for the poor and underserved. 1997;8:270–283. doi: 10.1353/hpu.2010.0526. discussion 284. [DOI] [PubMed] [Google Scholar]
- 25.Teslovich TM, Musunuru K, Smith AV, et al. Biological, clinical and population relevance of 95 loci for blood lipids. Nature. 2010;466:707–713. doi: 10.1038/nature09270. [DOI] [PMC free article] [PubMed] [Google Scholar]
- 26.Ehret GB, Munroe PB, Rice KM, et al. Genetic variants in novel pathways influence blood pressure and cardiovascular disease risk. Nature. 2011;478:103–109. doi: 10.1038/nature10405. [DOI] [PMC free article] [PubMed] [Google Scholar]
- 27.Morris AP, Voight BF, Teslovich TM, et al. Large-scale association analysis provides insights into the genetic architecture and pathophysiology of type 2 diabetes. Nature genetics. 2012;44:981–990. doi: 10.1038/ng.2383. [DOI] [PMC free article] [PubMed] [Google Scholar]
- 28.Nejentsev S, Walker N, Riches D, Egholm M, Todd JA. Rare variants of ifih1, a gene implicated in antiviral responses, protect against type 1 diabetes. Science. 2009;324:387–389. doi: 10.1126/science.1167728. [DOI] [PMC free article] [PubMed] [Google Scholar]
- 29.Galarneau G, Palmer CD, Sankaran VG, Orkin SH, Hirschhorn JN, Lettre G. Fine-mapping at three loci known to affect fetal hemoglobin levels explains additional genetic variation. Nature genetics. 2010;42:1049–1051. doi: 10.1038/ng.707. [DOI] [PMC free article] [PubMed] [Google Scholar]
- 30.Beaudoin M, Lo KS, N'Diaye A, Rivas MA, Dube MP, Laplante N, Phillips MS, Rioux JD, Tardif JC, Lettre G. Pooled DNA resequencing of 68 myocardial infarction candidate genes in french canadians. Circulation. Cardiovascular genetics. 2012;5:547–554. doi: 10.1161/CIRCGENETICS.112.963165. [DOI] [PubMed] [Google Scholar]
- 31.Do R, Stitziel NO, Won HH, et al. Exome sequencing identifies rare ldlr and apoa5 alleles conferring risk for myocardial infarction. Nature. 2015;518:102–106. doi: 10.1038/nature13917. [DOI] [PMC free article] [PubMed] [Google Scholar]
- 32.Musunuru K, Strong A, Frank-Kamenetsky M, et al. From noncoding variant to phenotype via sort1 at the 1p13 cholesterol locus. Nature. 2010;466:714–719. doi: 10.1038/nature09266. [DOI] [PMC free article] [PubMed] [Google Scholar]
- 33.Ward LD, Kellis M. Haploreg: A resource for exploring chromatin states, conservation, and regulatory motif alterations within sets of genetically linked variants. Nucleic Acids Res. 2012;40:D930–934. doi: 10.1093/nar/gkr917. [DOI] [PMC free article] [PubMed] [Google Scholar]
- 34.Potthoff MJ, Olson EN. Mef2: A central regulator of diverse developmental programs. Development. 2007;134:4131–4140. doi: 10.1242/dev.008367. [DOI] [PubMed] [Google Scholar]
- 35.Wang L, Fan C, Topol SE, Topol EJ, Wang Q. Mutation of mef2a in an inherited disorder with features of coronary artery disease. Science. 2003;302:1578–1581. doi: 10.1126/science.1088477. [DOI] [PMC free article] [PubMed] [Google Scholar]
- 36.Liu Y, Niu W, Wu Z, Su X, Chen Q, Lu L, Jin W. Variants in exon 11 of mef2a gene and coronary artery disease: Evidence from a case-control study, systematic review, and meta-analysis. PloS one. 2012;7:e31406. doi: 10.1371/journal.pone.0031406. [DOI] [PMC free article] [PubMed] [Google Scholar]
- 37.Weng L, Kavaslar N, Ustaszewska A, Doelle H, Schackwitz W, Hebert S, Cohen JC, McPherson R, Pennacchio LA. Lack of mef2a mutations in coronary artery disease. The Journal of clinical investigation. 2005;115:1016–1020. doi: 10.1172/JCI24186. [DOI] [PMC free article] [PubMed] [Google Scholar]
- 38.White MP, Rufaihah AJ, Liu L, Ghebremariam YT, Ivey KN, Cooke JP, Srivastava D. Limited gene expression variation in human embryonic stem cell and induced pluripotent stem cell-derived endothelial cells. Stem cells. 2013;31:92–103. doi: 10.1002/stem.1267. [DOI] [PMC free article] [PubMed] [Google Scholar]
- 39.Rufaihah AJ, Huang NF, Jame S, Lee JC, Nguyen HN, Byers B, De A, Okogbaa J, Rollins M, Reijo-Pera R, Gambhir SS, Cooke JP. Endothelial cells derived from human ipscs increase capillary density and improve perfusion in a mouse model of peripheral arterial disease. Arteriosclerosis, thrombosis, and vascular biology. 2011;31:e72–79. doi: 10.1161/ATVBAHA.111.230938. [DOI] [PMC free article] [PubMed] [Google Scholar]
- 40.Zhang X, Johnson AD, Hendricks AE, Hwang SJ, Tanriverdi K, Ganesh SK, Smith NL, Peyser PA, Freedman JE, O'Donnell CJ. Genetic associations with expression for genes implicated in gwas studies for atherosclerotic cardiovascular disease and blood phenotypes. Human molecular genetics. 2013;23:782–795. doi: 10.1093/hmg/ddt461. [DOI] [PMC free article] [PubMed] [Google Scholar]
- 41.Debette S, Leys D. Cervical-artery dissections: Predisposing factors, diagnosis, and outcome. The Lancet. Neurology. 2009;8:668–678. doi: 10.1016/S1474-4422(09)70084-5. [DOI] [PubMed] [Google Scholar]
- 42.Smyth DJ, Plagnol V, Walker NM, et al. Shared and distinct genetic variants in type 1 diabetes and celiac disease. The New England journal of medicine. 2008;359:2767–2777. doi: 10.1056/NEJMoa0807917. [DOI] [PMC free article] [PubMed] [Google Scholar]
Associated Data
This section collects any data citations, data availability statements, or supplementary materials included in this article.