

ABSTRACT
Disability after childhood diarrhea is an important burden on global productivity. Recent studies suggest that gut bacterial communities influence how humans recover from infectious diarrhea, but we still lack extensive data and mechanistic hypotheses for how these bacterial communities respond to diarrheal disease and its treatment. Here, we report that after Vibrio cholerae infection, the human gut microbiota undergoes an orderly and reproducible succession that features transient reversals in relative levels of enteric Bacteroides and Prevotella. Elements of this succession may be a common feature in microbiota recovery from acute secretory diarrhea, as we observed similar successional dynamics after enterotoxigenic Escherichia coli (ETEC) infection. Our metagenomic analyses suggest that multiple mechanisms drive microbial succession after cholera, including bacterial dispersal properties, changing enteric oxygen and carbohydrate levels, and phage dynamics. Thus, gut microbiota recovery after cholera may be predictable at the level of community structure but is driven by a complex set of temporally varying ecological processes. Our findings suggest opportunities for diagnostics and therapies targeting the gut microbiota in humans recovering from infectious diarrhea.
IMPORTANCE
Disability after diarrhea is a major burden on public health in the developing world. Gut bacteria may affect this recovery, but it remains incompletely understood how resident microbes in the digestive tract respond to diarrheal illness. Here, we observed an orderly and reproducible succession of gut bacterial groups after cholera in humans. Genomic analyses associated the succession with bacterial dispersal in food, an altered microbial environment, and changing phage levels. Our findings suggest that it may one day be feasible to manage resident bacterial populations in the gut after infectious diarrhea.
INTRODUCTION
Diarrheal diseases are a global health problem, especially among children. On average, a child under the age of 5 years in the developing world experiences three diarrheal episodes per year (1). These episodes are dangerous: diarrhea kills 1.9 million children annually, making it the second leading cause of child death (2). Survival also carries risks. Frequent cases of diarrhea before age 2 years are linked with a subsequent average growth shortfall of 3.6 cm, elevated heart rate after exercise, a loss of 10 IQ points, and roughly a year’s delay in starting school (3–6). Disability from childhood diarrhea may even outweigh the global productivity cost of diarrheal mortality (7). Thus, it is important to understand not only the causes of diarrheal disease episodes, but also how humans convalesce after them.
The microbial community residing in the gastrointestinal tract (the gut microbiota) is a potentially important, but still incompletely understood, factor in the recovery from diarrheal infections. The gut microbiota has been shown to influence host health, particularly with regard to pathogen suppression (8), host nutrition (9, 10), and even neurodevelopment (11). Yet, while the ecology of gut microbes in human diarrhea has been studied for decades via culture-based methods (12–16), more recent metagenomic techniques have largely ignored diarrhea, especially in developing world settings. To date, most studies of gut microbiota and disease have focused on maladies common to the developed world, such as obesity (17, 18), type 1 diabetes (19), and inflammatory disorders (20, 21).
Still, two sequencing-based surveys of the human gut microbiota following cholera in Bangladesh have been published recently (22, 23). In one survey among children, Vibrio cholerae infection led to marked reductions in Bacteroidetes and Firmicutes in the gut and an altered microbial community structure that persisted for weeks (22). In another survey, recovery from cholera was found to resemble infant gut microbial colonization (23). This recovery also involved growth of a bacterial species that could protect mice against V. cholerae. Together, these studies suggest that gut microbiota are dynamic communities after cholera infection. Yet, it remains poorly understood what kinds of ecological models can be used to explain microbial dynamics after infectious diarrhea in the developing world and whether these models are generalizable across diarrheal pathogens.
Here, we provide information relevant to these questions after longitudinally studying gut microbiota in adults and children hospitalized with infectious diarrhea in Dhaka, Bangladesh, along with healthy controls. We also conducted metagenomic sequencing of microbial community DNA over the course of V. cholerae infection, which allowed us to directly measure microbial gene content (the microbiome). Our data suggest that gut microbial dynamics after cholera resemble an orderly succession. Most components of this succession could be reproduced in an additional longitudinal study of patients with enterotoxigenic Escherichia coli (ETEC) infection. Using conceptual frameworks from ecological theory, we identified several potentially critical factors that shape microbial succession in the human gut. These factors suggest testable hypotheses for how host-microbe interactions influence the recovery from infectious diarrhea.
RESULTS
We first studied 13 individuals hospitalized with culture-confirmed cholera in Dhaka, Bangladesh (cholera cohort 1; see Fig. S1 in the supplemental material). Patients’ household members who shared a cooking pot were defined as contacts (n = 27). Each cholera patient was treated with a single dose of azithromycin on the day of presentation. Initially, stool samples for metagenomic analysis were collected on the day following presentation (1 day past presentation [dpp]). To obtain samples prior to antibiotic treatment, we enrolled a second cohort of cholera patients (cholera cohort 2; n = 10) and collected stool samples immediately upon presentation to the hospital, prior to azithromycin treatment (0 dpp). These individuals denied previous antibiotic use. Follow-up patient and household contact samples were collected by rectal swab, which we found to capture similar microbiota as stool samples (see Materials and Methods; also see Text S1 in the supplemental material). Samples were characterized by 16S rRNA gene sequencing (n = 114, median of 14,220 mapped reads per sample [see Table S1 in the supplemental material]) and metagenomic shotgun sequencing (n = 47, median of 3,058,075 reads per sample [see Table S2 in the supplemental material]). A third cohort of patients with ETEC infection (ETEC cohort) was comprised of 18 patients from Dhaka, Bangladesh (see Fig. S1D and E). ETEC cohort members were tracked for up to 6 months after hospitalization. Samples from the ETEC cohort were analyzed by 16S rRNA sequencing (n = 74 samples, median of 132,667 mapped reads per sample [see Table S1]).
Ecological statistical tests support time-dependent recovery from infection and treatment.
Principal coordinates analyses (PCoA) of pairwise distances between samples provided qualitative support that gut bacterial communities were structured temporally in patients with cholera (Fig. 1). For a variety of community dissimilarity measures, samples early in infection and treatment (i.e., 0 and 1 dpp) clustered distinctly from samples collected afterward (i.e., 7 and 30 dpp). Moreover, 30-dpp samples appeared to cluster near communities taken from healthy subjects, suggesting that patients’ gut microbiota recovered roughly 1 month after infection.
FIG 1 .
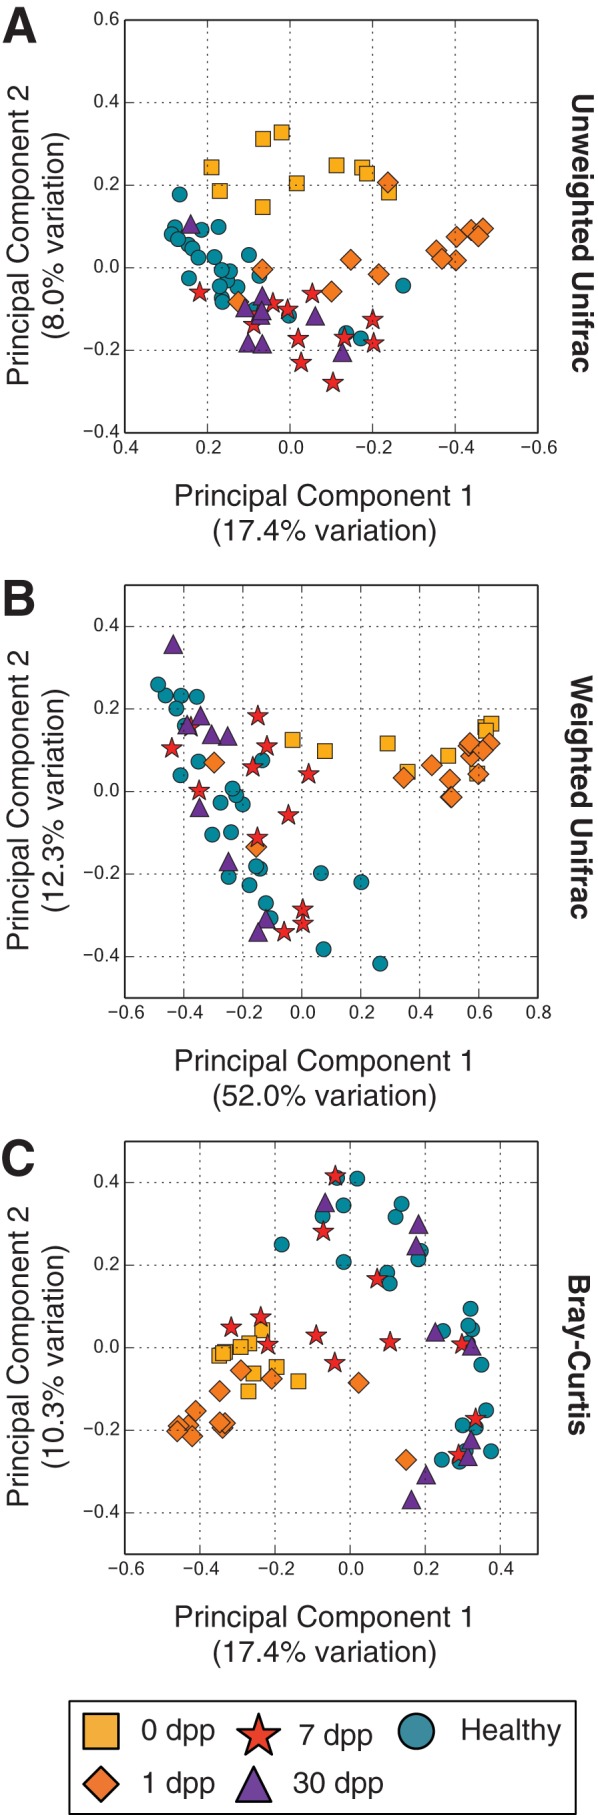
Principal coordinates analyses of gut microbiota similarities. The similarities of gut microbiota samples from cholera patients and healthy household contacts over time were projected onto a two-dimensional space by using principal coordinates analysis (76). Shown are projections made using the unweighted Unifrac (A) and weighted Unifrac (B) distances, as well as the Bray-Curtis dissimilarity (C).
We performed a semiparametric version of an analysis of variance (PERMANOVA) (24) to quantitatively measure temporal patterns in subjects’ gut microbiota at the operational taxonomic unit (OTU) level. We considered two model terms: subject identity (random effect) and time after infection (fixed effect). Running the PERMANOVA associated both variables with community dynamics (P < 0.001; R2 = 0.37, 0.14 for identity and time, respectively). Thus, recovery of gut microbiota after cholera may reflect both temporal and subject-specific patterns.
We ran a similar analysis on the metagenomic data to investigate how microbial functional profiles recovered from cholera. This analysis only identified a temporal component to cholera recovery (P < 0.001). A separate clustering analysis also showed that the metagenomic data could be separated more clearly by time point than the taxonomic data (see Fig. S2 in the supplemental material), suggesting that gut microbial functional profiles are less subject specific than taxonomic ones in patients following cholera.
Microbial taxonomic and functional succession after cholera.
To further visualize the dynamics of specific microbial taxa following cholera, we grouped bacteria at the genus level and then clustered genera exhibiting similar temporal patterns (see Materials and Methods). This technique reduced the number of variables to plot while still preserving taxonomic information (25). Our clustering yielded 5 major groups of bacteria (defined as accounting for more than 10% of subjects’ 16S rRNA reads for at least one sampling point [see Table S3 in the supplemental material]). These groups accounted for a median of 65.8% of 16S sequences from each sample (minimum, 19.7%; maximum, 97.1%). Groups exhibited unique temporal patterns, which we used to assign each group a name (Fig. 2A and B). The Infection-Stage group appeared only at 0 dpp; the Early-Stage group bloomed at 0 to 7 dpp but receded by the last time point; the Mid-Stage group appeared at only 7 dpp; the Late-Stage group dominated guts of healthy household contacts and the microbiota of recovering cholera patients at 30 dpp; and, the All-Swab group was only observed in rectal swab samples (i.e., absent from 0- and 1-dpp patient samples, which were whole stool samples). At 30 dpp, significant differences in group abundances relative to healthy household contacts were not observed.
FIG 2 .

Gut microbial succession in the weeks following V. cholerae infection. (A) Abundance of gut bacteria from the two cohorts over time. To simplify analysis, bacterial OTUs were collapsed at the genus level. Highly correlated genera were further grouped and named according to their dynamics. Cholera patients are shown at 0 dpp (cohort 2; labeled by subject ID) or from 1 dpp onwards (cohort 1; labeled by household ID). Microbiota from healthy household contacts in cohort 1 are shown in the healthy contacts group and distinguished by numbers following their household IDs; these samples were collected at the same time as patient 1-dpp samples. Absent samples are labeled with an X. The percentages of 16S rRNA reads associated with V. cholerae among subjects at 0 dpp are shown in boxes (median, 25%). (B) Median group abundances across subjects. Abundance values are also shown next to the bars. Significant differences relative to controls are labeled with an asterisk (P < 0.05; two-sided Mann-Whitney U test). (C) Microbial gene abundances, grouped using the COG hierarchy of functions (82). Gene levels are shown relative to median values in healthy subjects and are organized by subject (columns) and COG category (rows). Red boxes indicate gene functions enriched in subjects, relative to healthy controls, while blue boxes denote gene functions that are rarer. Categories labeled with asterisks to the right of a given recovery stage have significantly different abundances at that stage compared to controls (q < 0.05, Mann-Whitney U test). Rare COG categories (median fractional abundance, <0.0001 in healthy controls) are not shown here but are provided in Table S4 in the supplemental material, along with median COG abundances and full COG category names.
To evaluate if the groups’ dynamics after cholera could be observed with another secretory infectious diarrhea, we applied the same taxonomic model to gut microbiota from patients tracked longitudinally after infection with ETEC. To account for the causal pathogen in the ETEC cohort, we modified our taxonomic model by moving Escherichia from the Early-Stage group to the Infection-Stage group; this likely overestimated the number of infection-related bacteria at later time points, as pathogenic and commensal E. coli cannot be distinguished by 16S rRNA sequencing. With these groupings, we observed dynamics similar to the ones observed with V. cholerae infection (Fig. 3A and B). Infection-Stage and Early-Stage group bacteria were both common at 0 and 1 dpp. Late-Stage bacteria were dominant at 30 dpp. At the OTU level, there was a significant correlation between taxon abundance at 0, 1, and 30 dpp with ETEC or V. cholerae (Fig. 3C). However, we did not observe a correlation between cholera and ETEC patients’ gut microbiota at 7 dpp, midway through recovery. Although 3 of the 18 ETEC patients exhibited sizable populations of Mid-Stage group microbes at 7 dpp, this bacterial group’s median abundance was near 0 at 7 dpp. Cholera and ETEC infection therefore yielded similar microbial dynamics during the initial and late stages of recovery, but intermediate time points were pathogen specific.
FIG 3 .

Gut microbial succession after ETEC infection. (A) To test the generalizability of the clustering model used for cholera infection (Fig. 2), a similar model was applied to longitudinal gut microbiota surveys from subjects infected with ETEC. The original Fig. 2 model was slightly modified to reflect Escherichia coli as the causal pathogen. Absent samples are labeled with an X. (B) Median group abundance levels across subjects. (C) Individual OTU abundances at each sampling date (x axis), compared to their abundances in cholera patients at corresponding times. OTUs are colored by group, with taxa that were not assigned to groups shown in gray. Spearman correlations (ρ) are shown and labeled with asterisks if P was <0.05. A pseudocount of 1e−6 has been added so that OTUs with 0 abundance can be seen.
In addition to tracking the dynamics of bacterial taxa across diarrheal infections, we also measured how microbial gene functions changed during patient recovery from cholera (Fig. 2C; see also Table S4 in the supplemental material). At 0 and 1 dpp, 17 of the 25 tracked functional categories showed significant abundance changes relative to healthy controls (q < 0.05, Mann-Whitney U test). This fraction trended downwards with time. By 30 dpp, only 2 functional groups still exhibited altered abundances. Thus, as in the case of the taxonomic groups, microbial gene function is initially altered by cholera but recovers by 30 dpp to a profile resembling that of healthy subjects. Yet, unlike the taxonomic groupings, there was less apparent interindividual variation in the abundance of each functional group (Fig. 2C). This finding was consistent with our PERMANOVA and clustering analyses (see Fig. S2 in the supplemental material), suggesting subject-specific components to microbial community structures, but not to microbial gene content.
Succession mechanisms.
To attempt to elucidate the mechanisms underlying the observed microbial succession after cholera, we first investigated bacterial group taxonomy . The Late-Stage group was primarily composed of Prevotella, which previous studies have found to dominate healthy human gut samples in the developing world (26, 27). Observations that Late-Stage group bacteria accumulated in patients 30 dpp support the hypothesis that diarrheal recovery ends with a return of bacteria associated with a healthy gut microbiota. High levels of Infection-Stage bacteria at 0 dpp were also explained by genus membership. The Infection-Stage group included the parent genus of V. cholerae, the causal pathogen. Notably, we observed a wide variation in V. cholerae levels among 0-dpp samples, ranging from 0.033% to 88% of sequenced reads, with a median of 25% among patients who gave no self-report of antibiotic use (Fig. 2A). Lastly, the taxonomy of All-Swab microbes and their absence at 0 and 1 dpp suggested that the group may be associated with epithelia obtained as part of the swabbing process. All-Swab microbes were only present in samples taken by rectal swab and included Corynebacterium and Staphylococcus species, which abound in the gluteal crease (28). The taxonomy of All-Swab bacteria also overlapped with a putative consortium of mucosa-associated microbes (29).
Still, group membership does not provide explanations for other succession features: why do Early-Stage microbes appear before, and eventually give way to, Mid- and Late-Stage microbes? What triggers the arrival of Mid-Stage microbes? Can Late-Stage microbes colonize the gut without the prior arrival of the Early-Stage group? To address these questions, we considered four ecological processes that have been proposed to influence microbial succession: dispersal potential, resource availability, changes in environmental stresses, and phage predation (30).
Dispersal potential.
We initially investigated if microbial dispersal traits could influence the order in which microbes colonized the gut after V. cholerae infection. It has been hypothesized that easily dispersed bacteria will predominate early in microbial succession because they are more likely to inoculate new habitats (30). If dispersal traits contributed to the microbiota recovery process, Early-Stage microbes would be more easily disseminated than Late-Stage ones. In support of this prediction, we observed that the most enriched major gene function in the early stages of cholera infection and recovery involved bacterial migration (cell motility) (Fig. 2C). We also examined how commonly Early-Stage microbes could be found on foods, which are often hypothesized to be a vector of microbial transmission (25, 31). We chose as a reference a recent 16S rRNA gene sequencing-based survey of diet items commonly consumed in Dhaka, Bangladesh (e.g., rice, lentils, fruits, and vegetables) (25). In agreement with the hypothesis that Early-Stage microbes are more easily dispersed, 24% of Early-Stage taxa were found in at least one sampled food item, whereas none of the Late-Stage taxa were found in the sampled foods (P < 0.001, two-sided Fisher’s exact test). Thus, gene functional biases early in succession and bacterial frequencies in previously studied foods are supportive of a model where more easily dispersed microbes enjoy an advantage in recolonizing the gut.
Oxygen as an environmental stress.
The presence of facultative anaerobes among the Early-Stage microbes led us next to examine whether oxygen levels play a role in gut microbial succession. Oxygen diffuses into the gut lumen from host epithelial cells (32). Facultative anaerobes (e.g., Gammaproteobacteria and Bacilli) respire oxygen and are therefore thought to establish and maintain enteric anoxia (29, 33–36). Our data are consistent with a model where oxygen levels are abnormally elevated after infection, as Early-Stage bacteria are composed of Escherichia (a member of the Gammaproteobacteria), as well as Streptococcus and Enterococcus species (members of the Bacilli). Still, estimating enteric oxygen levels from microbial taxonomic data is challenging due to the lack of quantitative oxygen tolerance data for many gut bacterial species.
We therefore turned to microbial genes with known oxygen affinities to infer changes to enteric oxygen levels following cholera infection. Recent analyses suggest that low- and high-affinity cytochrome oxidases may be environmentally distributed according to oxygen availability, with high-affinity oxidases found in more anoxic environments and low-affinity oxidases associated with more oxygenated environments (37). To test for a cytochrome signature of changing oxygen levels during the succession, we tracked catalytic subunits from both low-affinity (bo3) and high-affinity (bd and cbb3) cytochrome oxidases. Abundance levels for these cytochrome subunits within our metagenomic data sets varied significantly over time (P < 0.05, Kruskal-Wallis test) and in a manner consistent with a transient increase in enteric oxygen levels following cholera infection (Fig. 4). The subunit from the low-affinity oxidase peaked in abundance 1 dpp at a level 19× higher than the healthy contacts (P < 0.01, two-sided Mann-Whitney U test). Four genera were associated with at least 4% of bo3 subunit reads from this time point (Escherichia, Shigella, Klebsiella, and Citrobacter), suggesting that multiple bacterial taxa contribute to increased levels of low-affinity oxidases 1 dpp. In contrast, the subunit from the high-affinity oxidase bd was at its lowest concentrations 1 to 7 dpp, with levels roughly half those seen in healthy contacts (P < 0.01, two-sided Mann-Whitney U test). The subunit from another high-affinity cytochrome oxidase, cbb3, was also less abundant during the recovery dates 1 to 30 dpp. Notably, this subunit’s levels did not appear depleted during acute infection (0 dpp), which reflects its carriage by V. cholerae (38) (82.4% of the subunit’s reads 0 dpp were linked to Vibrio genomes). Overall, results from cytochrome oxidase analyses support a model in which oxygen levels in the gut lumen transiently increase after infectious diarrhea and treatment.
FIG 4 .
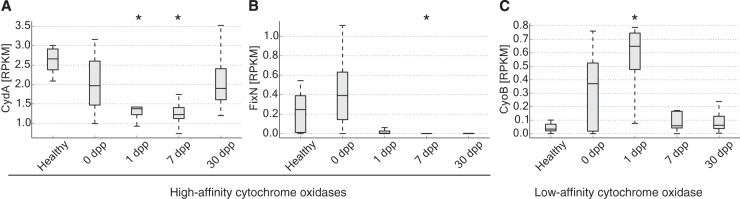
Cytochrome oxidases with low or high affinities for oxygen show diverging dynamics after infection. (A) CydA, the catalytic subunit of the high-affinity, bd-type cytochrome oxidase, exhibits decreasing abundance after infection. (B) FixN, the catalytic subunit for high-affinity cbb3-type cytochrome oxidases, is also lower in abundance during recovery compared to healthy controls. (C) CyoB, a catalytic subunit for low-affinity bo3-type terminal oxidases, increases immediately after infections but returns to control levels 7 dpp. Values significantly different from healthy ones are indicated with an asterisk (P < 0.01, two-sided Mann-Whitney U test), and all genes exhibit differential abundance over time (P < 0.05, Kruskal-Wallis test). Abundances are shown normalized to reads per kilobase per million mapped (RPKM). Box inner bands indicate median RPKM levels, tops and bottoms span the first and third quartiles, and whiskers denote 1.5 times the interquartile range.
Genomic evidence for changing carbohydrate availability.
Next, we explored our metagenomic data for signals of changing microbial resource availability after cholera. We focused on the 7-dpp samples, in an effort to better understand the transience of the Mid-Stage group. We searched for enzymes with significant abundance differences at 7 dpp, relative to healthy samples (193 enzymes identified; q < 0.1, two-sided Mann-Whitney U test [see Table S5 in the supplemental material]). Most of these enzymes exhibited the same log fold change sign when a paired analysis was done with index patients’ 7-dpp and 30-dpp samples (188 of 193 enzymes; P < 0.001, chi-square test). We generated hypotheses for changing resources by grouping enzymes into EC sub-subclasses and then ranking sub-subclasses by the number of member enzymes that were significantly enriched or reduced (see Table S6 in the supplemental material).
The three most highly enriched enzyme sub-subclasses at 7 dpp shared a common theme of carbohydrate metabolism. These sub-subclasses were glycosidases (EC 3.2.1.-), phosphotransferases with an alcohol group as acceptor (EC 2.7.1.-), and oxidoreductases acting on the CH−OH group of donors and that use NAD+ or NADP+ as an acceptor (EC 1.1.1.-). Review of the functions of the 34 enzymes with significant abundance changes in these groups revealed that 27 were linked to carbohydrate processing (Fig. 5). In contrast, of the 24 enzymes found in the three least-enriched enzyme sub-subclasses at 7 dpp (EC 6.1.1.-, EC 6.3.4.-, and EC 2.7.7.-), only 3 were linked to carbohydrates. We note that because enzyme enrichments were measured relative to healthy contacts (and not diseased samples), our data suggest that the gut microbiome at 7 dpp features even higher polysaccharide degradation potential than in normal subjects.
FIG 5 .

Carbohydrate-associated enzymes are enriched at 7 dpp. Shown are enzymes with significant differences in abundance between healthy and 7-dpp samples (q < 0.1, two-sided Mann-Whitney U test). Labeled enzymes belong to the three enzyme sub-subclasses that were most enriched at 7 dpp: glycosidases (EC 3.2.1.-, red EC number), phosphotransferases with an alcohol group as acceptor (EC:2.7.1-, orange), and oxidoreductases with CH−OH donors and NAD+ or NADP+ as acceptors (EC:1.1.1.-, green). Enzymes labeled on the left have significantly lower abundances in 7-dpp microbiomes relative to healthy ones, whereas enzymes labeled on the right have significantly higher abundances. Names in black are enzymes associated with carbohydrate metabolism, while those in gray are not associated with carbohydrates. To improve legibility, some enzyme names have been listed with more compact alternative names. Abundances are shown with log-transformed RPKM values (reads per kilobase per million mapped).
Most enriched carbohydrate-associated genes were associated with the genus Bacteroides, with 70% of these genes having at least 40% of their metagenomic reads mapping to the genus. Indeed, several of the carbohydrate-associated genes encoded functions known to help Bacteroides colonize the gut. Xyloglucans, common hemicelluloses from ingested plant matter, are metabolized by Bacteroides glycosidase genes from enzyme sub-subclass EC 3.2.1.- (39). Bacteroides may also derive nutrients from mucins, which are host-secreted epithelial proteins that have been glycosylated (40). We observed that one of the most enriched enzymes was an arylsulfatase (EC 3.1.6.8; see Table S5 in the supplemental material), which is related to a family of mucin-desulfating sulfatases used by Bacteroides to degrade mucins (41). Another enriched enzyme sub-subclass, hexosaminidases [EC 3.2.1.52; see Fig. 5 and Table S5 in the supplemental material), shares an EC identification number with chitobiases, which enable Bacteroides to penetrate gut mucous layers and colonize the human gut (42). Thus, inferring a burst of carbohydrate metabolism 7 dpp was consistent with Bacteroides membership in the Mid-Stage group. Still, some non-Bacteroides microbes may also have contributed to increased carbohydrate metabolism at 7 dpp, as a subset of significantly enriched carbohydrate-associated genes (22%) had less than 5% of its corresponding metagenomic reads map to the genus Bacteroides.
Phage succession.
Finally, we examined the notion that phage predation influences microbiota succession after V. cholerae infection (30, 43). We used a previously constructed reference database of 2,809 viral genomes to identify and quantify bacteriophages in our metagenomic data (25). We observed a significant change in the total levels of phage-associated reads over time (P < 0.001, Kruskal-Wallis test), with median phage abundances on the first day of infection 88.9× higher than among healthy contacts (P < 0.001, two-sided Mann-Whitney U test) (Fig. 6A). Increased abundances were distributed across multiple phages, with 76 phage taxa exhibiting increased mean abundance relative to healthy contacts; only 22 phages were relatively less abundant. Increased abundances were also consistent across patients. The lowest phage concentration observed in a patient at 0 dpp (0.043% of reads) was still greater than the highest phage concentration measured in a healthy subject (0.033%). Phage concentrations at 1 dpp remained significantly elevated, but at slightly lower levels (22.8× higher than healthy controls; P < 0.01). Thus, blooms in phages may be an early and reproducible feature of microbial succession following cholera.
FIG 6 .
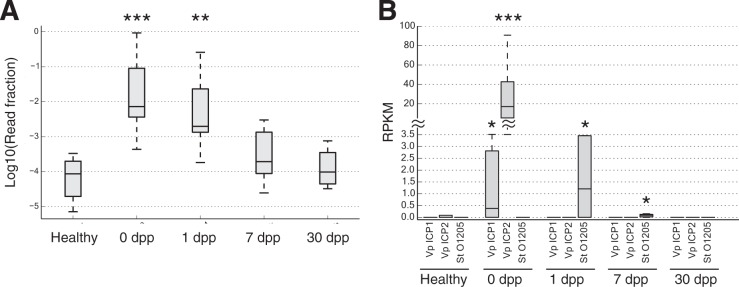
Phage succession following cholera recovery. (A) Box plots showing distributions of metagenomic reads mapping solely to viral genomes at each stage of infection. Viral levels are elevated by nearly 2 orders of magnitude in acute cholera infection (0 dpp), relative to healthy samples (***, P < 0.001, two-sided Mann-Whitney U test). Viral DNA levels remain significantly elevated at 1 dpp (**, P < 0.01) but return to normal levels 7 dpp after infection (P > 0.05). Box inner bands indicate median enzyme abundances, tops and bottoms span the first and third quartiles, and whiskers denote 1.5 times the interquartile range. (B) Specific phage levels. Three phage taxa showed significant temporal variation (q < 0.1, Kruskal-Wallis test): Vibrio phage ICP1 (Vp ICP1), Vibrio phage ICP2 (Vp ICP2), and Streptococcus thermophilus temperate bacteriophage O1205 (St O1205). The vibriophage peaked in abundance at 0 dpp, while the streptococcus phage peaked a day later. Box plots show medians and upper/lower quartile reads normalized to reads per kilobase per million mapped (RPKM). Time points where phage abundances were significantly different from healthy controls are denoted by asterisks (two-sided Mann-Whitney U test): *, P < 0.05; **, P < 0.01; ***, P < 0.001.
We next performed a strain-level analysis to see if specific phages were changing in abundance over time. We found three phage strains that showed significantly changing temporal dynamics: Streptococcus thermophilus temperate bacteriophage O1205, Vibrio phage ICP1, and Vibrio phage ICP2 (q < 0.1, Kruskal-Wallis test) (Fig. 6B). Phages targeting Infection-Stage and Early-Stage microbial taxa therefore exhibit dynamic temporal abundances.
FIG 7 .

A model of gut microbial succession after cholera. Our analyses suggest three groups of bacteria colonize the gut after cholera: an Early-Stage, a Mid-Stage, and a Late-Stage group. Initially, diarrheal infection and antibiotic treatment clear bacteria from the gut, allowing host-secreted oxygen and carbohydrates to accumulate (boxes around variables indicate elevated levels) (step 1). Early-Stage facultative anaerobes tolerate the elevated oxygen levels and are the first bacteria to recolonize; these bacteria are also likely to be introduced by ingested foods (step 2). Aerobic respiration by the Early-Stage microbes lowers oxygen tensions to the point where Mid- and Late-Stage obligate anaerobes can begin recolonizing the gut and better exploit built-up levels of carbohydrates. Phages targeting Early-Stage bacteria may hasten decreases in these bacteria (step 3). After several weeks, resource competition between Mid- and Late-Stage microbes for resources returns carbohydrates to normal levels and leads to the decline of the Mid-Stage group (step 4).
To estimate whether these dynamics were caused by increases among free viral particles, we examined the rates of phage-assigned sequencing reads, relative to reads assigned to their host bacteria. The Streptococcus phage can exist in a lysogenic state (44) and was observed at a rate of 0.0152 reads per Streptococcus thermophilus read. That rate is roughly half the ratio expected if the phage was integrated into its host genome in single copy (0.0273). Thus, the levels of the Streptococcus phage at 1 dpp could be explained by Streptococcus thermophilus carrying lysogenic phage on average one in every two bacteria. Similarly, the observed read rate of phage ICP1 relative to its expected rate (0.0162:0.0326) suggested that one ICP1 phage existed per two V. cholerae bacteria at 0 dpp. In contrast, phage ICP2 was observed 30 times more frequently than expected by chance at 0 dpp (read ratio of 0.4094:0.0135). The ability of this phage to become lysogenic was not described when it was first identified (45). Yet, even if ICP2 could integrate into the V. cholerae genome at levels similar to common Vibrio prophage (i.e., double copy [46]), free ICP2 viral particles still were an order of magnitude more abundant that V. cholerae itself. After cholera, select viral species may therefore generate blooms of free phage.
DISCUSSION
Our results suggest that microbial succession follows secretory diarrheal illness in humans. We observed a rapid, reproducible, and reversible change in microbial community structure and gene abundance after cholera in children and adults, despite wide variation in pathogen colonization levels between subjects. Gut microbial succession of the same major bacterial groups was also seen among a separate cohort of patients with secretory diarrhea due to ETEC. Among cholera patients, taxonomic abundance over time was idiosyncratic whereas functional abundance was not, supporting the emerging paradigm that gut microbial gene abundance is less subject specific than community structure (25, 47, 48).
By integrating ecological theory and metagenomics, we have developed a four-step model for the observed succession (Fig. 7). In step 1, diarrheal infection and/or antibiotics clear both obligate and oxygen-consuming facultative anaerobes from the gut, allowing oxygen and dietary/host substrates to accumulate. In step 2, facultative anaerobes recolonize the gut, potentially due to their rapid dispersal from dietary sources and their tolerance of elevated oxygen levels. In step 3, aerobic respiration by the early colonizers lowers oxygen tensions to the point where obligate anaerobes can begin recolonizing the gut to exploit the readily available substrates. Bacteriophages targeting the early colonizers may hasten their departure. In step 4, competition for dietary and host substrates promotes return to the original state.
Our model is supported by prior culture- and sequencing-based microbiota studies of infectious bacterial diarrhea and also offers new insights into the mechanisms of recovery. The hypothesized decline in commensal microbial populations during step 1 has been estimated to be between 100- and 100,000-fold, according to culture-based measures of anaerobic bacteria during infectious or antibiotic-associated diarrhea (13–15). Inverse dynamics among facultative anaerobes in the days after infection, a feature characteristic of step 2 of our model, have also been observed in earlier studies of diarrhea in children (13, 22). However, our study used functional genomic data, specifically, bacterial cytochrome oxidase levels, as evidence for increased gut oxygen levels after diarrhea.
Step 3, which we propose as a middle stage in the microbial succession, has not been explicitly identified in prior diarrheal studies. However, several earlier observations support the underlying dynamics and proposed mechanisms of this step. For example, the sharp increase among enteric Bacteroides at 7 dpp is consistent with the findings of a culture-based longitudinal study of cholera infection in Kolkata (15). That study reported Bacteroides levels in stool increasing by roughly 9 orders of magnitude, 4 to 8 days after infection. Data from a recent metagenomic survey similarly suggest that Bacteroides species exhibit transient increases in abundance approximately 1 week after cholera infection (23). There is also prior evidence for changing levels of carbohydrate utilization after diarrhea. The recent metagenomic survey showing transient Bacteroides levels after cholera identified carbohydrate metabolism genes as the most altered functional group during infection recovery (23). A study of antibiotic-associated diarrhea in Japanese patients found that short-chain fatty acids, a common byproduct of microbial polysaccharide fermentation, decreased 10-fold during acute diarrhea (14). Finally, while phage predation of commensal gut microbes was not previously reported after diarrhea, it is now established that pathogen-targeting vibriophages are common and important features of cholera infection (50–53). Given these prior observations, why was step 3 not identified before? One possibility is that its clearest taxonomic feature, an unusual reversal of the Bacteroides-to-Prevotella ratio, may not have been apparent in studies prior to 1990 (12, 13, 15), the year in which Prevotella was proposed to be a distinct genus among the Bacteroides (54).
In contrast to the preceding stage, step 4 of our model has analogues in the preceding literature, but our data provide new clarity to the fullness of gut microbial recovery after diarrheal infection. Prevotella levels in children 30 dpp with cholera have been observed to resemble those of healthy subjects (22), and levels of anaerobic bacteria a month after antibiotic-associated diarrhea have also been shown to be indistinguishable from levels in healthy controls (14). Still, examination of whether major bacterial groups return to normal levels in prior studies has been precluded by the lack of within-study healthy controls (22) or been limited to only cultivable microbes (14). In addition, our use of metagenomic sequencing suggests that microbial gene content, and therefore likely microbial metabolism, returns to normal 30 days after infectious diarrhea.
Yet, despite the genomic evidence presented here, our model of microbial succession after infectious diarrhea will still need to be refined by future studies. For example, we only investigated V. cholerae and ETEC infections, which share several characteristics: a noninvasive bacterial pathogen, a toxin mediated by ADP-ribosylation, and a resulting diarrhea that is severe and watery (55). Infectious diarrheas with alternative etiologies may yield distinct gut microbiota recovery dynamics. For example, even between cholera and ETEC infection, we observed heterogeneity in the microbial succession at 7 dpp. This was unlikely to be caused by sampling artifacts, as field workers used similar collection techniques for both the cholera and ETEC cohorts. Instead, differences in virulence factors or toxins between ETEC and V. cholerae may have limited Mid-Stage microbes from colonizing ETEC patients through mechanisms that remain to be elucidated. Patients with ETEC infection usually also exhibit longer diarrheal histories than cholera patients, meaning the middle stages of recovery from cholera and ETEC could occur during different date ranges (56). In support of this hypothesis, we observed patients 7 dpp with ETEC who exhibited significantly correlated OTU abundances with patients 30 dpp with cholera (ρ = 0.23; P < 0.001, Spearman correlation). A Mid-Stage recovery to ETEC infection similar to the one seen in cholera patients therefore may have occurred prior to 7 dpp in ETEC patients. Future studies of these two diarrheal pathogens with larger cohorts and finer longitudinal sampling may resolve the midrecovery discrepancy.
Another outstanding question in our model is what forces cause the Mid-Stage microbes to ultimately give way to Late-Stage bacteria. The primary members of these groups, the Bacteroides and the Prevotella, have been previously thought to partition according to host demographics: the Prevotella are common among developing world inhabitants, and the Bacteroides are more plentiful in residents of developed nations (26, 27). Understanding what causes the decline of Mid-Stage bacteria in patients after cholera may therefore help elucidate global patterns of gut microbial ecology. One potential mechanism may be that although both the Prevotella and Bacteroides can degrade dietary fiber, the Prevotella are more efficient at consuming the carbohydrates eaten in the developing world (27, 57). When cholera and antibiotic treatment clear Prevotella populations, sugars accumulate at elevated levels and provide transient opportunities for less efficient carbohydrate utilizers (i.e., the Bacteroides) to colonize the gut (58). After carbohydrate levels ultimately decline to normal levels, the Prevotella once again outcompete the Bacteroides for now-scarce resources.
Another potential reason for the Mid- to Late-Stage switch may involve the gut mucosa, whose composition is known to affect microbiota structure (59). We have observed that levels of maltase-glucoamylase, one of the enzymes comprising gut mucus layers (60), increase in human intestinal epithelia during convalescence from acute cholera (83). Recent work in mice also suggested that infection causes the host to decorate the gut mucosa with fucose, stimulating microbial metabolism and promoting the recovery of host body weight (61). Additional studies in humans and gnotobiotic animal models will be necessary to explore the interplay between gut microbiota and gut mucin profiles after infectious diarrhea.
Ultimately, our studies of cholera infection and gut microbial ecology should inform future efforts to monitor and manage recovery from disease. There is an increasing appreciation that repeated incidents of diarrheal infections predispose children in the developing world to malnutrition and enteric dysfunction (62, 63). The ecological model we propose here suggests new lines of therapeutic and diagnostic research for diarrheal illness. For example, host mucin profiles across infection could be investigated for their roles in guiding resident Late-Stage microbes to colonize the gut (64). Enteric oxygen levels could also be explored as a patient characteristic to be both managed, as well as monitored, following treatment. These potential lines of medical research, inspired by theories of microbial ecology, may help alleviate the persistent worldwide burden of diarrheal disease.
MATERIALS AND METHODS
Sample collection. (i) Cohort recruitment.
Samples were collected at the Dhaka Hospital of the International Centre for Diarrhoeal Disease Research, Bangladesh (ICDDR,B) as part of a previously described study (65). Eligible patients for cholera cohort 1 were recruited at the ICDDR,B after presenting with acute secretory diarrhea, age of ≥6 months, culture-positive stool for V. cholerae O1, and no significant comorbidities. Field workers discussed enrollment with household contacts within 6 h of index case presentation. Household contacts in cholera cohort 1 were defined as individuals who shared a cooking pot with an index patient for the previous 3 days. Contacts were excluded if they were already participating in other studies, if they had been patients at the ICDDR,B in the previous 2 months, or if they had significant comorbidities. Subjects in cholera cohort 2 and the ETEC infection cohort were also enrolled from patients at the ICDDR,B hospital. In the case of cholera cohort 2, eligible patients satisfied the criteria for cholera cohort 1 index cases but had not yet been treated with antibiotics at Dhaka Hospital. These patients also self-reported that they had not taken antibiotics prior to presentation. Patients eligible for the ETEC infection cohort also satisfied the criteria for cholera cohort 1, except their stool was culture negative for V. cholerae and was confirmed by multiplex PCR and immunodiagnostic methods positive for ETEC (66).
(ii) Subject tracking.
Contacts and index cases in cholera cohort 1 were observed longitudinally for approximately 1 month, beginning the day index case stool cultures were confirmed (1 dpp). Gut microbiota were sampled using both fecal samples and rectal swabs. Rectal swabs were collected by field workers during home visits 1 dpp (contacts only), between 6 and 10 dpp (grouped into the category “7 dpp”) and between 27 and 32 dpp (grouped into the category “30 dpp”). Rectal swabs were placed on ice and immediately transported to the ICDDR,B, where they were stored at −80°C until shipment on dry ice to Massachusetts General Hospital, Boston, MA. We used rectal swabs to sample gut microbiota during home visits due to the challenges of reliably collecting fecal samples in this setting. A pilot, high-throughput sequencing-based comparison study (see Text S1 in the supplemental material) indicated that paired rectal swabs and fecal samples (i) exhibited similar phylum-level bacterial profiles, (ii) segregated by health status, not sampling mode, and (iii) captured similar interindividual microbiota variations (P = 0.001, Mantel test). Thus, rectal swab results were used in this study.
Single time point samples from cholera cohort 2 subjects were collected via rectal swab at Dhaka Hospital. The ETEC cohort index patients were tracked longitudinally using methods similar to the ones used for cholera cohort 1, but for longer periods of time. Rectal swabs were collected from these patients 0 and 1 dpp at Dhaka Hospital and on home visits between 6 and 9 dpp (“7 dpp”), 30 to 32 dpp (“30 dpp”), 88 to 98 dpp (“90” dpp), and between 180 and 309 dpp (“>180 dpp”).
The study was approved by the Ethical and Research Review Committees of the ICDDR,B and the Institutional Review Board of Massachusetts General Hospital.
DNA sequencing. (i) Sequencing and processing of bacterial 16S rRNA.
Bacterial DNA for sequencing was isolated using the PowerSoil DNA extraction kit (MoBio). Published protocols and custom barcoded primers were used to amplify, clean, and quantify the V4 region of bacterial 16S rRNA (67–69). Raw sequence data were processed using scripts from QIIME versions 1.2.1 to 1.4.0 (70). To minimize the effects of sequencing errors, we kept only high-quality, full-length reads (max_bad_run_length was set to 0 in the split_libraries_illumina.py script). OTUs were picked at 97% sequence similarity against a reference database constructed from the Greengenes database (71) by the QIIME developers (nested_gg_workflow.py, accessed on 4 February 2011). The FASTA file associated with the reference database was trimmed to span only the 16S region amplified by primers.
(ii) Shotgun sequencing and processing of bacterial genomic DNA.
A total of 47 samples were characterized using metagenomic sequencing. Samples from all index patients in cohort 1 at the 1-, 7-, and 30-dpp time points were selected for sequencing. Additionally, all samples from cohort 2 were chosen for sequencing. Finally, a subset of healthy contact samples from cohort 1 with abundant extracted DNA was picked for metagenomic library preparation.
Extracted bacterial DNA was prepared for shotgun sequencing in two batches. The first batch of samples was sequenced on an Illumina HiSeq system using a modified version of a previous protocol (69). DNA from these samples was sheared into roughly 300-bp fragments by using a Covaris S220 (duty cycle, 10%; intensity, 4; number of cycles per burst, 200; time, 80 s). Sequencing libraries were prepared from the fragments by using the NEBNext DNA Library prep master mix set for Illumina (E6040S; New England Biolabs). Library size and quality were assessed using an HS-DNA chip on an Agilent Bioanalyzer 2100. To increase sample power, a second batch of samples was prepared for shotgun sequencing. These samples were prepared using a higher-throughput library preparation protocol that relied on an automated liquid handling robot (IngentX Apollo 324). DNA was sheared using a Covaris S220 set to parameters optimized for the Apollo robot (duty cycle, 10%; intensity, 4; number of cycles per burst, 200; time per cycle, 9; number of cycles, 8; time, 72 s). DNA was then concentrated before being placed on the Apollo apparatus using a column (DCC-5; Zymo). Libraries were prepared using the Apollo PrepX ILM kit and a customized version of the robot’s ILM DNA protocol (IntegeneX). NEXTflex-96 DNA barcodes (BioO Scientific) were substituted for the IntegeneX adapters; these were loaded at 5 µM, except in the case of low starting DNA concentrations (<5 ng/µl), in which case the barcodes were loaded at 1.7 µM. Library sizes were then measured using the Bioanalyzer 2100, and DNA concentrations were measured by quantitative PCR (qPCR; ABsolute SYBR green qPCR mix; Thermo Scientific) on a Stratagene MX3000p machine.
Functional analyses between two samples run in duplicate across the two library preparations suggested that technical differences between the protocols did not introduce significant bias. Instead, Spearman correlations for gene profiles partitioned using either the COG, EC, KO, Pfam, or the TIGR databases were nearly all >0.9 for matched samples. Moreover, PERMANOVA analysis on metagenomic data from all samples taken from index patients in cohort 1 (including duplicates) did not report a significant effect of library preparation method (P > 0.05). Given the reproducibility of the sequencing protocols and to simplify later metagenomic analyses, samples sequenced in duplicate were represented in the data analysis by using a single sequencing run (the run with a higher read count).
Taxonomic and functional associations with the metagenomic reads were obtained using a previously developed pipeline (25). Briefly, reads were matched using the Bowtie 2 sequence alignment program to a reference survey of 2,809 viral, 1,813 bacterial, and 66 eukaryotic genomes from version 3.5 of the Integrated Microbial Genomes system (72). We used the system’s annotations to the COG, KEGG, and EC databases for functional analyses (73–75). To perform taxonomic analyses more precisely, reads that mapped to more than 1 reference genome were discarded. For functional analyses, however, reads that mapped to multiple reference genomes were still counted. Taxonomic data within functional analyses (i.e., identifying species associated with cytochrome and carbohydrate processing genes) included counts that mapped to multiple genomes. Fractional abundances of reads associated with a given taxon were computed by averaging normalizing read counts across subjects. Samples with fewer than 10,000 mapped reads were not included in downstream processing.
Data analysis. (i) PCoA of 16S rRNA data.
PCoA analysis was performed using the make_2d_plots.py and beta_diversity.py scripts in QIIME version 1.4.0 (70). Beta diversity was computed using the Bray-Curtis, weighted Unifrac, and unweighted Unifrac measures (84).
(ii) PERMANOVA.
We performed PERMANOVA analysis using RStudio (version 0.98.551) and the adonis function in the R package vegan (version 2.0-9) (79, 80). Pairwise distances were calculated using the Bray-Curtis dissimilarity function, and significance values were computed over 10,000 permutations. To treat subject identity as a random effect, we used an approach suggested by the vegan developers (81). Namely, we defined identity as a blocking variable (via the “strata” argument), and we evaluated the effects of identity before testing the effects of time with the function call adonis(vegdist(16S_data,method=“bray”) ~ identity + time, strata=identity, perm=10000). For the taxonomic analyses, only samples from index patients in cohort 1 were used. Bacteria abundances were measured at the OTU level and normalized to unity. Subject ID and the day past presentation (sampling day) were provided as metadata factors. For the metagenomic analyses, samples were again used from index patients in cohort 1, and subject ID and sampling day were the given metadata factors. Metagenomic reads were grouped either by EC category (n = 1,532) or KO category (n = 5,200) and run with function call adonis(vegdist(metagenomic_data, method=“bray”) ~ identity + time, strata=identity, perm=10000); both functional groupings yielded a significant association (P < 0.001) only with sampling day.
(iii) Clustering of 16S rRNA data.
Taxonomic clustering was performed in a manner similar to a previously published method (25). Briefly, OTUs were first grouped at the genus level, to simplify interpreting cluster makeup. Taxa not assigned at the genus level were discarded; these taxa comprised 5.45% of reads. Rare genera (defined as those observed in 5 or fewer samples) were also excluded from clustering. Rare genera comprised 319 of 439 total observed genera, but accounted for only 0.3% of reads. All remaining genera (n = 120) were ultimately assigned to a cluster. Pairwise correlations between genera were estimated using SparCC, a statistic appropriate for fractional microbiota abundances (77). A pairwise dissimilarity matrix was computed as (1 − correlation between genera) and was subsequently analyzed with the hierarchical clustering toolbox in SciPy version 0.11 (78). Clustering was performed with the “linkage” function (method = weighted), and taxa were split into clusters by using the fcluster function (criterion = distance). Selection of a clustering threshold involves choosing between model simplicity (i.e., building clusters with an interpretable number of genera) and fidelity (i.e., capturing the dynamics of more genera). We balanced these goals by choosing a clustering threshold of 1/2 the maximum distance between any 2 genera. Nearby threshold values yielded similar numbers of highly abundant clusters and taxonomic groupings. Cluster abundances are reported as the fraction of total 16S reads for each sample.
In the healthy subjects group, we included only one time point per subject (1 dpp) to avoid biasing the group by the availability of samples per subject. Including only the 1-dpp samples also minimized the chances that household cholera transmission would influence the composition of microbiota included in the healthy group. Still, contacts F_2 and I_1 suffered from diarrhea on that day and were therefore excluded from the healthy control group. The 1 dpp group of contact samples was used as reference healthy controls in subsequent 16S rRNA analyses.
(iv) Dispersal analysis.
Correlations between OTU presence/absence frequencies in healthy and 7-dpp samples were computed using the Spearman correlation. OTUs with zero frequency in both healthy and 7-dpp samples were not included, to avoid potential artifacts of significance. Bacterial dispersal in food was measured using data from a 16S rRNA-based survey of dietary items commonly consumed in the developing world (25). Only foods from the study region’s plant-based diet were analyzed, which included fresh produce and cooked meals consisting of rice, lentils, and vegetables.
(v) Cytochrome analysis.
We identified cytochrome oxidases in our metagenomic data based on their catalytic subunits. We mapped subunits to KO IDs within the KEGG database (74), accessed in December 2013. The subunits CtaD and CyoB (KO IDs K02274 and K02298, respectively) are associated with low-affinity cytochromes, while the subunits FixN, CbaA, and CydA (K00404, K02274, and K00425, respectively) are associated with high-affinity cytochromes (37). The CtaD and CbaA subunits were excluded from metagenomic analysis because they were assigned the same KO ID and therefore could not be distinguished in our data set.
(vi) Resource availability.
To generate hypotheses for microbial resources with changing availability 7 dpp with cholera, we first identified all enzymes whose abundance on that date was different from that of healthy controls. We restricted statistical testing to enzymes observed in at least four samples from the 7-dpp and healthy groups combined. Altered abundances were observed for 193 of 1,195 tested enzymes (q < 0.1, Mann-Whitney U test). To help interpret functional changes associated with changing gene abundances, we grouped enzymes into sub-subclasses by using their first three EC digits. Sub-subclasses were then ranked by enrichment or depletion of enzymes, with significant abundance differences calculated by using the chi-squared test statistic.
(vii) Phage analysis.
To investigate potential levels of phage particles, we computed the expected ratio of phage to bacterial reads, assuming one phage integration per host genome. We then compared that value to the observed ratio of phage to host bacterium reads. In the case of multiple potential bacterial hosts for a given phage, host genome size was estimated using the median.
Nucleotide sequence accession numbers.
The 16S and metagenomic nucleotide sequences generated in this study can be downloaded from the European Nucleotide Archive under study accession number PRJEB9150.
SUPPLEMENTAL MATERIAL
Comparison of microbiota collected by rectal swab and feces. Analysis and discussion of a pilot study demonstrating feasibility of rectal swabs for capturing gut microbiota in Dhaka, Bangladesh. Download
Longitudinal cohort study design. Three cohorts were enrolled, two with cholera cases (A to C) and one with ETEC cases (D and E). (A) Cholera cohort 1 recruited 13 cholera cases exhibiting diarrhea and immunological symptoms (defined as 0 days past presentation [dpp]). These index cases (underlined in orange), along with their household contacts, were tracked over 1 month. (B) Cholera cohort 2 was assembled from 10 cholera cases distinct from cholera cohort 1. (C) Gut microbial communities were sampled at 0 dpp and subsequently over 1 month. Cholera cases were treated between 0 and 1 dpp with azithromycin. Cholera cohort 2 cases were sampled on day 0, prior to antibiotic treatment. Cholera cohort 1 cases and contacts were sampled roughly 1 dpp, 7 dpp, and 30 dpp. Gut samples consisted of stool samples from active cholera cases (0 and 1 dpp) or rectal swabs otherwise. (D) The ETEC infection cohort was composed of 18 ETEC patients who were tracked longitudinally. (E) ETEC cases were tracked in a manner similar to cholera cases (C), except they were followed for an additional 6 to 12 months and sampled at roughly 90 and 180 dpp. All gut samples from ETEC patients were collected via rectal swab. Download
Hierarchical clustering of 16S rRNA and metagenome sequencing data. Subject samples across cholera infection were clustered according to pairwise Jensen-Shannon distance (16S rRNA) and Spearman correlation (metagenomes decomposed into EC profiles). Samples are labeled by household ID, and dates are shown both in parentheses and by label color: 0 dpp in red; 1 dpp in orange; 7 dpp in purple; 30 dpp in blue. Metagenome profiles subdivided more strongly by succession stage than 16S rRNA profiles, as slicing the metagenome tree at the arrowed edge, nearly partitioned all 0- and 1-dpp samples from 7- and 30-dpp samples. In contrast, samples could not be partitioned as neatly on the 16S rRNA tree. Download
Paired rectal swabs and fecal samples were compared by sequencing. (A) Gut microbiota from both diseased rectal swabs and fecal samples were segregated on a UPGMA tree constructed from a sample similarity matrix. Samples are labeled by health status, subject number, and sampling method. The UPGMA tree was constructed using the QIIME script upgma_cluster.py, applied to microbiota whose β-diversity profiles were computed using the weighted Unifrac distance. (B to D) Principal coordinates analyses of pilot study gut microbiota overlaid with samples from cohorts 1 and 2. Shown are projections computed using the (B) unweighted and (C) weighted Unifrac distances, as well as the (D) Bray-Curtis dissimilarity. Download
16S rRNA gene sequencing metadata for cholera cohorts 1 and 2, the ETEC cohort, and a pilot study comparing rectal swabs to stool samples.
Metagenomic gene sequencing metadata. The median number of metagenomic reads per sample was 3,139,178 and 1,931,151 for cholera cohorts 1 and 2, respectively. The percentages of reads that “strictly” mapped to a reference set of genomes (mapped to only 1 genome) were 9.2% and 5.65%, respectively, and the percentages of reads that mapped to 1 or more reference genomes were 18.9% and 44.25%, respectively, for cholera cohorts 1 and 2.
Bacterial genus groupings. To simplify analysis, bacterial OTUs were initially grouped by genus. Next, genera with similar temporal dynamics were grouped by correlation. This process yielded a total of 92 OTU groups, each of whose median value at the sampled time points are shown. Groups whose median abundance exceeded 10% of reads in at least 1 point are highlighted in red and were included in the simplified model of postinfection succession (see Fig. 2).
Median functional abundances across subjects grouped by COG category and recovery stage. Asterisks denote categories whose abundance at a given stage differed from that of healthy subjects (q < 0.05, Mann-Whitney U test).
Enzymes whose abundance significantly changes 7 dpp. Shown are enzymes (and their EC identification numbers) whose abundance is significantly different from healthy subjects’ samples (q < 0.1; two-sided Mann-Whitney U test). Enzymes are ranked according to log2-ratios of mean abundance (>0.0 indicates higher among 7 dpp samples).
Enriched enzyme sub-subclasses at 7 dpp. To identify enzyme functions that were enriched at 7 dpp (relative to control samples), we counted the number of enzymes from each EC sub-subclass that were significantly enriched or reduced at 7 dpp (see Table S5 for a full list of enzymes enriched at 7 dpp). We then ranked sub-subclasses by using the chi-squared test statistic. Highlighted in green are sub-subclasses where more members are enriched than reduced at 7 dpp.
ACKNOWLEDGMENTS
This work was supported by the ICDDR,B and its donors, which provide unrestricted support to ICDDR,B for its operations and research. This study was also supported by grants from the National Institutes of Health, including the following National Institute of Allergy and Infectious Diseases grants: U01 AI058935 (S.B.C. and E.T.R.), U01 AI106878 (E.T.R. and F.Q.), R01 AI03055 (J.B.H.), P50 GM068763 (P.J.T.), and T32 AI070611976 (A.W.). Support for L.D. was provided by Harvard University’s William F. Milton Fund, Duke University’s Whitehead Scholars Program, and an Alfred P. Sloan Research Fellowship. R.C.L. was supported by a Physician-Scientist Early Career Award from the Howard Hughes Medical Institute. P.J.T. was supported by the Harvard Bauer Fellows program.
We thank John Rawls, Aspen Reese, and Jenny Tung for manuscript feedback and Kristofor Voss and Dean Urban for analytical suggestions. We also thank the David and Turnbaugh labs for their suggestions.
Footnotes
Citation David LA, Weil A, Ryan ET, Calderwood SB, Harris JB, Chowdhury F, Begum Y, Qadri F, LaRocque RC, Turnbaugh PJ. 2015. Gut microbial succession follows acute secretory diarrhea in humans. mBio 6(3):e00381-15. doi:10.1128/mBio.00381-15.
REFERENCES
- 1.Kosek M, Bern C, Guerrant RL. 2003. The global burden of diarrhoeal disease, as estimated from studies published between 1992 and 2000. Bull World Health Organ 81:197–204. doi: 10.1590/S0042-96862003000300010. [DOI] [PMC free article] [PubMed] [Google Scholar]
- 2.Bryce J, Boschi-Pinto C, Shibuya K, Black RE, WHO Child Health Epidemiology Group . 2005. WHO estimates of the causes of death in children. Lancet 365:1147–1152. doi: 10.1016/S0140-6736(05)71877-8. [DOI] [PubMed] [Google Scholar]
- 3.Lorntz B, Soares AM, Moore SR, Pinkerton R, Gansneder B, Bovbjerg VE, Guyatt H, Lima AM, Guerrant RL. 2006. Early childhood diarrhea predicts impaired school performance. Pediatr Infect Dis J 25:513–520. doi: 10.1097/01.inf.0000219524.64448.90. [DOI] [PubMed] [Google Scholar]
- 4.Moore SR, Lima AA, Conaway MR, Schorling JB, Soares AM, Guerrant RL. 2001. Early childhood diarrhoea and helminthiases associate with long-term linear growth faltering. Int J Epidemiol 30:1457–1464. doi: 10.1093/ije/30.6.1457. [DOI] [PubMed] [Google Scholar]
- 5.Niehaus MD, Moore SR, Patrick PD, Derr LL, Lorntz B, Lima AA, Guerrant RL. 2002. Early childhood diarrhea is associated with diminished cognitive function 4 to 7-years later in children in a northeast Brazilian shantytown. Am J Trop Med Hyg 66:590–593. [DOI] [PubMed] [Google Scholar]
- 6.Guerrant DI, Moore SR, Lima AA, Patrick PD, Schorling JB, Guerrant RL. 1999. Association of early childhood diarrhea and cryptosporidiosis with impaired physical fitness and cognitive function four-seven years later in a poor urban community in northeast Brazil. Am J Trop Med Hyg 61:707–713. [DOI] [PubMed] [Google Scholar]
- 7.Guerrant RL, Kosek M, Lima AA, Lorntz B, Guyatt HL. 2002. Updating the DALYs for diarrhoeal disease. Trends Parasitol 18:191–193. doi: 10.1016/S1471-4922(02)02253-5. [DOI] [PubMed] [Google Scholar]
- 8.Iwase T, Uehara Y, Shinji H, Tajima A, Seo H, Takada K, Agata T, Mizunoe Y. 2010. Staphylococcus epidermidis Esp inhibits Staphylococcus aureus biofilm formation and nasal colonization. Nature 465:346–349. doi: 10.1038/nature09074. [DOI] [PubMed] [Google Scholar]
- 9.Ridaura VK, Jeonju University, Faith, Rey FE, Cheng J, Duncan AE, Kau AL, Griffin NW, Lombard V, Henrissat B, Bain JR, Muehlbauer MJ, Ilkayeva O, Semenkovich CF, Funai K, Hayashi DK, Lyle BJ, Martini MC, Ursell LK, Clemente JC, Van Treuren W, Walters WA, Knight R, Newgard CB, Heath AC, Gordon JI. 2013. Gut microbiota from twins discordant for obesity modulate metabolism in mice. Science 341:1241214. doi: 10.1126/science.1241214. [DOI] [PMC free article] [PubMed] [Google Scholar]
- 10.Subramanian S, Huq S, Yatsunenko T, Haque R, Mahfuz M, Alam MA, Benezra A, DeStefano J, Meier MF, Muegge BD, Barratt MJ, VanArendonk LG, Zhang Q, Province MA, Petri WA Jr., Ahmed T, Gordon JI. 2014. Persistent gut microbiota immaturity in malnourished Bangladeshi children. Nature 510:417–421. doi: 10.1038/nature13421. [DOI] [PMC free article] [PubMed] [Google Scholar]
- 11.Hsiao EY, McBride SW, Hsien S, Sharon G, Hyde ER, McCue T, Codelli JA, Chow J, Reisman SE, Petrosino JF, Patterson PH, Mazmanian SK. 2013. Microbiota modulate behavioral and physiological abnormalities associated with neurodevelopmental disorders. Cell 155:1451–1463. doi: 10.1016/j.cell.2013.11.024. [DOI] [PMC free article] [PubMed] [Google Scholar]
- 12.Gorbach SL, Mahalanabis D, Brayton J, Jacobs B, Chatterjee BD, Neogy KN. 1970. Intestinal microflora in Asiatic cholera. 3. Studies in pediatric cholera. J Infect Dis 121:46–47. doi: 10.1093/infdis/121.1.46. [DOI] [PubMed] [Google Scholar]
- 13.Albert MJ, Bhat P, Rajan D, Maiya PP, Pereira SM, Baker SJ. 1978. Faecal flora of south Indian infants and young children in health and with acute gastroenteritis. J Med Microbiol 11:137–143. doi: 10.1099/00222615-11-2-137. [DOI] [PubMed] [Google Scholar]
- 14.Tazume S, Ozawa A, Yamamoto T, Takahashi Y, Takeshi K, Saidi SM, Ichoroh CG, Waiyaki PG. 1993. Ecological study on the intestinal bacteria flora of patients with diarrhea. Clin Infect Dis 16(Suppl 2):S77–S82. doi: 10.1093/clinids/16.Supplement_2.S77. [DOI] [PubMed] [Google Scholar]
- 15.Gorbach SL, Banwell JG, Jacobs B, Chatterjee BD, Mitra R, Brigham KL, Neogy KN. 1970. Intestinal microflora in Asiatic cholera. I. "Rice-water" stool. J Infect Dis 121:32–37. [DOI] [PubMed] [Google Scholar]
- 16.Monira S, Alam NH, Suau A, Magne F, Nair GB, Karmakar PC, Rahman M, Pochart P, Desjeux JF. 2009. Time course of bacterial diversity in stool samples of malnourished children with cholera receiving treatment. J Pediatr Gastroenterol Nutr 48:571–578. doi: 10.1097/MPG.0b013e3181831867. [DOI] [PubMed] [Google Scholar]
- 17.Turnbaugh PJ, Ley RE, Mahowald MA, Magrini V, Mardis ER, Gordon JI. 2006. An obesity-associated gut microbiome with increased capacity for energy harvest. Nature 444:1027–1031. doi: 10.1038/nature05414. [DOI] [PubMed] [Google Scholar]
- 18.Ley RE, Turnbaugh PJ, Klein S, Gordon JI. 2006. Microbial ecology: human gut microbes associated with obesity. Nature 444:1022–1023. doi: 10.1038/4441022a. [DOI] [PubMed] [Google Scholar]
- 19.Giongo A, Gano KA, Crabb DB, Mukherjee N, Novelo LL, Casella G, Drew JC, Ilonen J, Knip M, Hyöty H, Veijola R, Simell T, Simell O, Neu J, Wasserfall CH, Schatz D, Atkinson MA, Triplett EW. 2011. Toward defining the autoimmune microbiome for type 1 diabetes. ISME J 5:82–91. doi: 10.1038/ismej.2010.92. [DOI] [PMC free article] [PubMed] [Google Scholar]
- 20.Gevers D, Kugathasan S, Denson LA, Vázquez-Baeza Y, Van Treuren W, Ren B, Schwager E, Knights D, Song SJ, Yassour M, Morgan XC, Kostic AD, Luo C, González A, McDonald D, Haberman Y, Walters T, Baker S, Rosh J, Stephens M, Heyman M, Markowitz J, Baldassano R, Griffiths A, Sylvester F, Mack D, Kim S, Crandall W, Hyams J, Huttenhower C, Knight R, Xavier RJ. 2014. The treatment-naive microbiome in new-onset Crohn’s disease. Cell Host Microbe 15:382–392. doi: 10.1016/j.chom.2014.02.005. [DOI] [PMC free article] [PubMed] [Google Scholar]
- 21.Frank DN, St Amand AL, Feldman RA, Boedeker EC, Harpaz N, Pace NR. 2007. Molecular-phylogenetic characterization of microbial community imbalances in human inflammatory bowel diseases. Proc Natl Acad Sci U S A 104:13780–13785. doi: 10.1073/pnas.0706625104. [DOI] [PMC free article] [PubMed] [Google Scholar]
- 22.Monira S, Nakamura S, Gotoh K, Izutsu K, Watanabe H, Alam NH, Nakaya T, Horii T, Ali SI, Iida T, Alam M. 2013. Metagenomic profile of gut microbiota in children during cholera and recovery. Gut Pathog 5:1. doi: 10.1186/1757-4749-5-1. [DOI] [PMC free article] [PubMed] [Google Scholar]
- 23.Hsiao A, Ahmed AM, Subramanian S, Griffin NW, Drewry LL, Petri WA, Haque R, Ahmed T, Gordon JI. 2014. Members of the human gut microbiota involved in recovery from Vibrio cholerae infection. Nature 515:423–426. doi: 10.1038/nature13738. [DOI] [PMC free article] [PubMed] [Google Scholar]
- 24.Anderson MJ. 2001. A new method for non-parametric multivariate analysis of variance. Austral Ecol 26:32–46. doi: 10.1111/j.1442-9993.2001.01070.pp.x. [DOI] [Google Scholar]
- 25.David LA, Maurice CF, Carmody RN, Gootenberg DB, Button JE, Wolfe BE, Ling AV, Devlin AS, Varma Y, Fischbach MA, Biddinger SB, Dutton RJ, Turnbaugh PJ. 2014. Diet rapidly and reproducibly alters the human gut microbiome. Nature 505:559–563. doi: 10.1038/nature12820. [DOI] [PMC free article] [PubMed] [Google Scholar]
- 26.Yatsunenko T, Rey FE, Manary MJ, Trehan I, Dominguez-Bello MG, Contreras M, Magris M, Hidalgo G, Baldassano RN, Anokhin AP, Heath AC, Warner B, Reeder J, Kuczynski J, Caporaso JG, Lozupone CA, Lauber C, Clemente JC, Knights D, Knight R, Gordon JI. 2012. Human gut microbiome viewed across age and geography. Nature 486:222–227. doi: 10.1038/nature11053. [DOI] [PMC free article] [PubMed] [Google Scholar]
- 27.De Filippo C, Cavalieri D, Di Paola M, Ramazzotti M, Poullet JB, Massart S, Collini S, Pieraccini G, Lionetti P. 2010. Impact of diet in shaping gut microbiota revealed by a comparative study in children from Europe and rural Africa. Proc Natl Acad Sci U S A 107:14691–14696. doi: 10.1073/pnas.1005963107. [DOI] [PMC free article] [PubMed] [Google Scholar]
- 28.Grice EA, Kong HH, Conlan S, Deming CB, Davis J, Young AC, NISC Comparative Sequencing Program, Bouffard GG, Blakesley RW, Murray PR, Green ED, Turner ML, Segre JA. 2009. Topographical and temporal diversity of the human skin microbiome. Science 324:1190–1192. doi: 10.1126/science.1171700. [DOI] [PMC free article] [PubMed] [Google Scholar]
- 29.Albenberg L, Esipova TV, Judge CP, Bittinger K, Chen J, Laughlin A, Grunberg S, Baldassano RN, Lewis JD, Li H, Thom SR, Bushman FD, Vinogradov SA, Wu GD. 2014. Correlation between intraluminal oxygen gradient and radial partitioning of intestinal microbiota in humans and mice. Gastroenterology 147:1055–1063.e8. doi: 10.1053/j.gastro.2014.07.020. [DOI] [PMC free article] [PubMed] [Google Scholar]
- 30.Fierer N, Nemergut D, Knight R, Craine JM. 2010. Changes through time: integrating microorganisms into the study of succession. Res Microbiol 161:635–642. doi: 10.1016/j.resmic.2010.06.002. [DOI] [PubMed] [Google Scholar]
- 31.Hehemann J-H, Correc G, Barbeyron T, Helbert W, Czjzek M, Michel G. 2010. Transfer of carbohydrate-active enzymes from marine bacteria to Japanese gut microbiota. Nature 464:908–912. doi: 10.1038/nature08937. [DOI] [PubMed] [Google Scholar]
- 32.Marteyn B, West NP, Browning DF, Cole JA, Shaw JG, Palm F, Mounier J, Prévost M-C, Sansonetti P, Tang CM. 2010. Modulation of Shigella virulence in response to available oxygen in vivo. Nature 465:355–358. doi: 10.1038/nature08970. [DOI] [PMC free article] [PubMed] [Google Scholar]
- 33.Gillilland MG III, Erb-Downward JR, Bassis CM, Shen MC, Toews GB, Young VB, Huffnagle GB. 2012. Ecological succession of bacterial communities during conventionalization of germ-free mice. Appl Environ Microbiol 78:2359–2366. doi: 10.1128/AEM.05239-11. [DOI] [PMC free article] [PubMed] [Google Scholar]
- 34.Turnbaugh PJ, Turnbaugh PJ, Ridaura VK, Faith JJ, Rey FE, Knight R, Gordon JI. 2009. The effect of diet on the human gut microbiome: a metagenomic analysis in humanized gnotobiotic mice. Sci Transl Med 1:6ra14. doi: 10.1126/scitranslmed.3000322. [DOI] [PMC free article] [PubMed] [Google Scholar]
- 35.Palmer C, Bik EM, DiGiulio DB, Relman DA, Brown PO. 2007. Development of the human infant intestinal microbiota. PLoS Biol 5:e177. doi: 10.1371/journal.pbio.0050177. [DOI] [PMC free article] [PubMed] [Google Scholar]
- 36.LaTuga MS, Ellis JC, Cotton CM, Goldberg RN, Wynn JL, Jackson RB, Seed PC. 2011. Beyond bacteria: a study of the enteric microbial consortium in extremely low birth weight infants. PLoS One 6:e27858. doi: 10.1371/journal.pone.0027858. [DOI] [PMC free article] [PubMed] [Google Scholar]
- 37.Morris RL, Schmidt TM. 2013. Shallow breathing: bacterial life at low O(2). Nat Rev Microbiol 11:205-212. doi: 10.1038//nrmicro2970. [DOI] [PMC free article] [PubMed] [Google Scholar]
- 38.Braun M, Thöny-Meyer L. 2005. Cytochrome c maturation and the physiological role of c-type cytochromes in Vibrio cholerae. J Bacteriol 187:5996–6004. doi: 10.1128/JB.187.17.5996-6004.2005. [DOI] [PMC free article] [PubMed] [Google Scholar]
- 39.Larsbrink J, Rogers TE, Hemsworth GR, McKee LS, Tauzin AS, Spadiut O, Klinter S, Pudlo NA, Urs K, Koropatkin NM, Creagh AL, Haynes CA, Kelly AG, Cederholm SN, Davies GJ, Martens EC, Brumer H. 2014. A discrete genetic locus confers xyloglucan metabolism in select human gut Bacteroidetes. Nature 506:498–502. doi: 10.1038/nature12907. [DOI] [PMC free article] [PubMed] [Google Scholar]
- 40.Sonnenburg JL, Xu J, Leip DD, Chen CH, Westover BP, Weatherford J, Buhler JD, Gordon JI. 2005. Glycan foraging in vivo by an intestine-adapted bacterial symbiont. Science 307:1955–1959. doi: 10.1126/science.1109051. [DOI] [PubMed] [Google Scholar]
- 41.Xu J, Gordon JI. 2003. Honor thy symbionts. Proc Natl Acad Sci U S A 100:10452–10459. doi: 10.1073/pnas.1734063100. [DOI] [PMC free article] [PubMed] [Google Scholar]
- 42.Lee SM, Donaldson GP, Mikulski Z, Boyajian S, Ley K, Mazmanian SK. 2013. Bacterial colonization factors control specificity and stability of the gut microbiota. Nature 501:426–429. doi: 10.1038/nature12447. [DOI] [PMC free article] [PubMed] [Google Scholar]
- 43.Seed KD, Yen M, Shapiro BJ, Hilaire IJ, Charles RC, Teng JE, Ivers LC, Boncy J, Harris JB, Camilli A. 2014. Evolutionary consequences of intra-patient phage predation on microbial populations. Elife 3:e03497. doi: 10.7554/eLife.03497. [DOI] [PMC free article] [PubMed] [Google Scholar]
- 44.Stanley E, Fitzgerald GF, Le Marrec C, Fayard B, van Sinderen D. 1997. Sequence analysis and characterization of φO1205, a temperate bacteriophage infecting Streptococcus thermophilus CNRZ1205. Annu Rev Microbiol 143:3417–3429. [DOI] [PubMed] [Google Scholar]
- 45.Seed KD, Bodi KL, Kropinski AM, Ackermann H-, Calderwood SB, Qadri F, Camilli A. 2011. Evidence of a dominant lineage of Vibrio cholerae-specific lytic bacteriophages shed by cholera patients over a 10-year period in Dhaka, Bangladesh. mBio 2(1):e00334-10. doi: 10.1128/mBio.00334-10. [DOI] [PMC free article] [PubMed] [Google Scholar]
- 46.Trucksis M, Michalski J, Deng YK, Kaper JB. 1998. The Vibrio cholerae genome contains two unique circular chromosomes. Proc Natl Acad Sci U S A 95:14464–14469. doi: 10.1073/pnas.95.24.14464. [DOI] [PMC free article] [PubMed] [Google Scholar]
- 47.Human Microbiome Projet Consortium 2012. Structure, function and diversity of the healthy human microbiome. Nature 486:207–214. doi: 10.1038/nature11234. [DOI] [PMC free article] [PubMed] [Google Scholar]
- 48.Turnbaugh PJ, Hamady M, Yatsunenko T, Cantarel BL, Duncan A, Ley RE, Sogin ML, Jones WJ, Roe BA, Affourtit JP, Egholm M, Henrissat B, Heath AC, Knight R, Gordon JI. 2009. A core gut microbiome in obese and lean twins. Nature 457:480–484. doi: 10.1038/nature07540. [DOI] [PMC free article] [PubMed] [Google Scholar]
- 49.Beisner B, Haydon D, Cuddington K. 2003. Alternative stable states in ecology. Front Ecol Environ 1:376–382. doi: 10.1890/1540-9295(2003)001[0376:ASSIE]2.0.CO;2. [DOI] [Google Scholar]
- 50.Nelson EJ, Chowdhury A, Harris JB, Begum YA, Chowdhury F, Khan AI, Larocque RC, Bishop AL, Ryan ET, Camilli A, Qadri F, Calderwood SB. 2007. Complexity of rice-water stool from patients with Vibrio cholerae plays a role in the transmission of infectious diarrhea. Proc Natl Acad Sci U S A 104:19091–19096. doi: 10.1073/pnas.0706352104. [DOI] [PMC free article] [PubMed] [Google Scholar]
- 51.Waldor MK, Mekalanos JJ. 1996. Lysogenic conversion by a filamentous phage encoding cholera toxin. Science 272:1910–1914. doi: 10.1126/science.272.5270.1910. [DOI] [PubMed] [Google Scholar]
- 52.Faruque SM, Naser IB, Islam MJ, Faruque AS, Ghosh AN, Nair GB, Sack DA, Mekalanos JJ. 2005. Seasonal epidemics of cholera inversely correlate with the prevalence of environmental cholera phages. Proc Natl Acad Sci U S A 102:1702–1707. doi: 10.1073/pnas.0408992102. [DOI] [PMC free article] [PubMed] [Google Scholar]
- 53.Jensen MA, Faruque SM, Mekalanos JJ, Levin BR. 2006. Modeling the role of bacteriophage in the control of cholera outbreaks. Proc Natl Acad Sci U S A 103:4652–4657. doi: 10.1073/pnas.0600166103. [DOI] [PMC free article] [PubMed] [Google Scholar]
- 54.Shah HN, Collins DM. 1990. Prevotella, a new genus to include Bacteroides melaninogenicus and related species formerly classified in the genus Bacteroides. Int J Syst Bacteriol 40:205–208. doi: 10.1099/00207713-40-2-205. [DOI] [PubMed] [Google Scholar]
- 55.Spangler BD. 1992. Structure and function of cholera toxin and the related Escherichia coli heat-labile enterotoxin. Microbiol Rev 56:622–647. [DOI] [PMC free article] [PubMed] [Google Scholar]
- 56.Qadri F, Svennerholm A-M, Faruque AS, Sack RB. 2005. Enterotoxigenic Escherichia coli in developing countries: epidemiology, microbiology, clinical features, treatment, and prevention. Clin Microbiol Rev 18:465–483. doi: 10.1128/CMR.18.3.465-483.2005. [DOI] [PMC free article] [PubMed] [Google Scholar]
- 57.Wu GD, Chen J, Hoffmann C, Bittinger K, Chen YY, Keilbaugh SA, Bewtra M, Knights D, Walters WA, Knight R, Sinha R, Gilroy E, Gupta K, Baldassano R, Nessel L, Li H, Bushman FD, Lewis JD. 2011. Linking long-term dietary patterns with gut microbial enterotypes. Science 334:105–108. doi: 10.1126/science.1208344. [DOI] [PMC free article] [PubMed] [Google Scholar]
- 58.Ng KM, Ferreyra JA, Higginbottom SK, Lynch JB, Kashyap PC, Gopinath S, Naidu N, Choudhury B, Weimer BC, Monack DM, Sonnenburg JL. 2013. Microbiota-liberated host sugars facilitate post-antibiotic expansion of enteric pathogens. Nature 502:96–99. doi: 10.1038/nature12503. [DOI] [PMC free article] [PubMed] [Google Scholar]
- 59.Kashyap PC, Marcobal A, Ursell LK, Smits SA, Sonnenburg ED, Costello EK, Higginbottom SK, Domino SE, Holmes SP, Relman DA, Knight R, Gordon JI, Sonnenburg JL. 2013. Genetically dictated change in host mucus carbohydrate landscape exerts a diet-dependent effect on the gut microbiota. Proc Natl Acad Sci U S A 110:17059–17064. doi: 10.1073/pnas.1306070110. [DOI] [PMC free article] [PubMed] [Google Scholar]
- 60.Johansson ME, Phillipson M, Petersson J, Velcich A, Holm L, Hansson GC. 2008. The inner of the two Muc2 mucin-dependent mucus layers in colon is devoid of bacteria. Proc Natl Acad Sci U S A 105:15064–15069. doi: 10.1073/pnas.0803124105. [DOI] [PMC free article] [PubMed] [Google Scholar]
- 61.Pickard JM, Maurice CF, Kinnebrew MA, Abt MC, Schenten D, Golovkina TV, Bogatyrev SR, Ismagilov RF, Pamer EG, Turnbaugh PJ, Chervonsky AV. 2014. Rapid fucosylation of intestinal epithelium sustains host-commensal symbiosis in sickness. Nature 514:638–341. doi: 10.1038/nature13823. [DOI] [PMC free article] [PubMed] [Google Scholar]
- 62.Smith MI, Yatsunenko T, Manary MJ, Trehan I, Mkakosya R, Cheng J, Kau AL, Rich SS, Concannon P, Mychaleckyj JC, Liu J, Houpt E, Li JV, Holmes E, Nicholson J, Knights D, Ursell LK, Knight R, Gordon JI. 2013. Gut microbiomes of Malawian twin pairs discordant for kwashiorkor. Science 339:548–554. doi: 10.1126/science.1229000. [DOI] [PMC free article] [PubMed] [Google Scholar]
- 63.Ryan ET. 2013. The intestinal pathobiome: its reality and consequences among infants and young children in resource-limited settings. J Infect Dis 208:1732–1733. doi: 10.1093/infdis/jit509. [DOI] [PubMed] [Google Scholar]
- 64.Robbe C, Capon C, Coddeville B, Michalski JC. 2004. Structural diversity and specific distribution of O-glycans in normal human mucins along the intestinal tract. Biochem J 384:307–316. doi: 10.1042/BJ20040605. [DOI] [PMC free article] [PubMed] [Google Scholar]
- 65.Saha D, LaRocque RC, Khan AI, Harris JB, Begum YA, Akramuzzaman SM, Faruque AS, Ryan ET, Qadri F, Calderwood SB. 2004. Incomplete correlation of serum vibriocidal antibody titer with protection from Vibrio cholerae infection in urban Bangladesh. J Infect Dis 189:2318–2322. doi: 10.1086/421275. [DOI] [PubMed] [Google Scholar]
- 66.Rodas C, Iniguez V, Qadri F, Wiklund G, Svennerholm AM, Sjöling A. 2009. Development of multiplex PCR assays for detection of enterotoxigenic Escherichia coli colonization factors and toxins. J Clin Microbiol 47:1218–1220. doi: 10.1128/JCM.00316-09. [DOI] [PMC free article] [PubMed] [Google Scholar]
- 67.Caporaso JG, Lauber CL, Walters WA, Berg-Lyons D, Lozupone CA, Turnbaugh PJ, Fierer N, Knight R. 2011. Global patterns of 16S rRNA diversity at a depth of millions of sequences per sample. Proc Natl Acad Sci U S A 108(Suppl 1):4516–4522. doi: 10.1073/pnas.1000080107. [DOI] [PMC free article] [PubMed] [Google Scholar]
- 68.Caporaso JG, Lauber CL, Walters WA, Berg-Lyons D, Huntley J, Fierer N, Owens SM, Betley J, Fraser L, Bauer M, Gormley N, Gilbert JA, Smith G, Knight R. 2012. Ultra-high-throughput microbial community analysis on the Illumina HiSeq and MiSeq platforms. ISME J 6:1621–1624. doi: 10.1038/ismej.2012.8. [DOI] [PMC free article] [PubMed] [Google Scholar]
- 69.Maurice CF, Haiser HJ, Turnbaugh PJ. 2013. Xenobiotics shape the physiology and gene expression of the active human gut microbiome. Cell 152:39–50. doi: 10.1016/j.cell.2012.10.052. [DOI] [PMC free article] [PubMed] [Google Scholar]
- 70.Caporaso JG, Kuczynski J, Stombaugh J, Bittinger K, Bushman FD, Costello EK, Fierer N, Peña AG, Goodrich JK, Gordon JI, Huttley GA, Kelley ST, Knights D, Koenig JE, Ley RE, Lozupone CA, McDonald D, Muegge BD, Pirrung M, Reeder J, Sevinsky JR, Turnbaugh PJ, Walters WA, Widmann J, Yatsunenko T, Zaneveld J, Knight R. 2010. QIIME allows analysis of high-throughput community sequencing data. Nat Methods 7:335–336. doi: 10.1038/nmeth.f.303. [DOI] [PMC free article] [PubMed] [Google Scholar]
- 71.DeSantis TZ, Hugenholtz P, Larsen N, Rojas M, Brodie EL, Keller K, Huber T, Dalevi D, Hu P, Andersen GL. 2006. Greengenes, a chimera-checked 16S rRNA gene database and workbench compatible with ARB. Appl Environ Microbiol 72:5069–5072. doi: 10.1128/AEM.03006-05. [DOI] [PMC free article] [PubMed] [Google Scholar]
- 72.Markowitz VM, Chen IM, Palaniappan K, Chu K, Szeto E, Grechkin Y, Ratner A, Jacob B, Huang J, Williams P, Huntemann M, Anderson I, Mavromatis K, Ivanova NN, Kyrpides NC. 2012. IMG: the integrated microbial genomes database and comparative analysis system. Nucleic Acids Res 40:D115–D122. doi: 10.1093/nar/gkr1044. [DOI] [PMC free article] [PubMed] [Google Scholar]
- 73.Tatusov RL, Fedorova ND, Jackson JD, Jacobs AR, Kiryutin B, Koonin EV, Krylov DM, Mazumder R, Mekhedov SL, Nikolskaya AN, Rao BS, Smirnov S, Sverdlov AV, Vasudevan S, Wolf YI, Yin JJ, Natale DA. 2003. The COG database: an updated version includes eukaryotes. BMC Bioinformatics 4:41. doi: 10.1186/1471-2105-4-41. [DOI] [PMC free article] [PubMed] [Google Scholar]
- 74.Kanehisa M, Goto S. 2000. KEGG: Kyoto encyclopedia of genes and genomes. Nucleic Acids Res 28:27–30. doi: 10.1093/nar/28.1.27. [DOI] [PMC free article] [PubMed] [Google Scholar]
- 75.Webb EC. 1992. Enzyme nomenclature 1992. Recommendations of the Nomenclature Committee of the International Union of Biochemistry and Molecular Biology on the nomenclature and classification of enzymes. Academic Press, San Diego, CA. [Google Scholar]
- 76.Hamady M, Lozupone C, Knight R. 2010. Fast UniFrac: facilitating high-throughput phylogenetic analyses of microbial communities including analysis of pyrosequencing and PhyloChip data. ISME J 4:17–27. doi: 10.1038/ismej.2009.97. [DOI] [PMC free article] [PubMed] [Google Scholar]
- 77.Friedman J, Alm EJ. 2012. Inferring correlation networks from genomic survey data. PLOS Comput Biol 8:e1002687. doi: 10.1371/journal.pcbi.1002687. [DOI] [PMC free article] [PubMed] [Google Scholar]
- 78.Jones E, Oliphant T, Peterson P. 2001. SciPy: Open source scientific tools for python, http://www.scipy.org/.
- 79.Oksanen J. 2013. Multivariate analysis of ecological communities in R: vegan tutorial. http://cc.oulu.fi/~jarioksa/opetus/metodi/vegantutor.pdf.
- 80.Oksanen J, Guillaume Blanchet F, Kindt R, Legendre P, Minchin PR, O’Hara RB, Simpson GL, Solymos P, Stevens HH, Wagner H. 2013. vegan: Community Ecology package. R package version 2.0-9. R Development Core Team; http://www.r-project.org. [Google Scholar]
- 81.Oksanen J. 2013. vegan FAQ http://vegan-forge-r-project.org/FAQ-vegan.html.
- 82.Tatusov RL, Galperin MY, Natale DA, Koonin EV. 2000. The COG database: a tool for genome-scale analysis of protein functions and evolution. Nucleic Acids Res 28:33–36. doi: 10.1093/nar/28.1.33. [DOI] [PMC free article] [PubMed] [Google Scholar]
- 83.Ellis CN, LaRocque RC, Uddin T, Krastins B, Mayo-Smith LM, Sarracino D, Karlsson EK, Rahman A, Shirin T, Bhuiyan TR, Chowdhury F, Khan AI, Ryan ET, Calderwood SB, Qadri F, Harris JB. 2015. Comparative proteomic analysis reveals activation of mucosal innate immune signaling pathways during cholera. Infect Immun 83:1089–1103. doi: 10.1128/IAI.02765-14. [DOI] [PMC free article] [PubMed] [Google Scholar]
- 84.Lozupone C, Knight R. 2005. UniFrac: a new phylogenetic method for comparing microbial communities. 71:8228–8235. doi: 10.1128/AEM.71.12.8228-8235.2005. [DOI] [PMC free article] [PubMed] [Google Scholar]
Associated Data
This section collects any data citations, data availability statements, or supplementary materials included in this article.
Supplementary Materials
Comparison of microbiota collected by rectal swab and feces. Analysis and discussion of a pilot study demonstrating feasibility of rectal swabs for capturing gut microbiota in Dhaka, Bangladesh. Download
Longitudinal cohort study design. Three cohorts were enrolled, two with cholera cases (A to C) and one with ETEC cases (D and E). (A) Cholera cohort 1 recruited 13 cholera cases exhibiting diarrhea and immunological symptoms (defined as 0 days past presentation [dpp]). These index cases (underlined in orange), along with their household contacts, were tracked over 1 month. (B) Cholera cohort 2 was assembled from 10 cholera cases distinct from cholera cohort 1. (C) Gut microbial communities were sampled at 0 dpp and subsequently over 1 month. Cholera cases were treated between 0 and 1 dpp with azithromycin. Cholera cohort 2 cases were sampled on day 0, prior to antibiotic treatment. Cholera cohort 1 cases and contacts were sampled roughly 1 dpp, 7 dpp, and 30 dpp. Gut samples consisted of stool samples from active cholera cases (0 and 1 dpp) or rectal swabs otherwise. (D) The ETEC infection cohort was composed of 18 ETEC patients who were tracked longitudinally. (E) ETEC cases were tracked in a manner similar to cholera cases (C), except they were followed for an additional 6 to 12 months and sampled at roughly 90 and 180 dpp. All gut samples from ETEC patients were collected via rectal swab. Download
Hierarchical clustering of 16S rRNA and metagenome sequencing data. Subject samples across cholera infection were clustered according to pairwise Jensen-Shannon distance (16S rRNA) and Spearman correlation (metagenomes decomposed into EC profiles). Samples are labeled by household ID, and dates are shown both in parentheses and by label color: 0 dpp in red; 1 dpp in orange; 7 dpp in purple; 30 dpp in blue. Metagenome profiles subdivided more strongly by succession stage than 16S rRNA profiles, as slicing the metagenome tree at the arrowed edge, nearly partitioned all 0- and 1-dpp samples from 7- and 30-dpp samples. In contrast, samples could not be partitioned as neatly on the 16S rRNA tree. Download
Paired rectal swabs and fecal samples were compared by sequencing. (A) Gut microbiota from both diseased rectal swabs and fecal samples were segregated on a UPGMA tree constructed from a sample similarity matrix. Samples are labeled by health status, subject number, and sampling method. The UPGMA tree was constructed using the QIIME script upgma_cluster.py, applied to microbiota whose β-diversity profiles were computed using the weighted Unifrac distance. (B to D) Principal coordinates analyses of pilot study gut microbiota overlaid with samples from cohorts 1 and 2. Shown are projections computed using the (B) unweighted and (C) weighted Unifrac distances, as well as the (D) Bray-Curtis dissimilarity. Download
16S rRNA gene sequencing metadata for cholera cohorts 1 and 2, the ETEC cohort, and a pilot study comparing rectal swabs to stool samples.
Metagenomic gene sequencing metadata. The median number of metagenomic reads per sample was 3,139,178 and 1,931,151 for cholera cohorts 1 and 2, respectively. The percentages of reads that “strictly” mapped to a reference set of genomes (mapped to only 1 genome) were 9.2% and 5.65%, respectively, and the percentages of reads that mapped to 1 or more reference genomes were 18.9% and 44.25%, respectively, for cholera cohorts 1 and 2.
Bacterial genus groupings. To simplify analysis, bacterial OTUs were initially grouped by genus. Next, genera with similar temporal dynamics were grouped by correlation. This process yielded a total of 92 OTU groups, each of whose median value at the sampled time points are shown. Groups whose median abundance exceeded 10% of reads in at least 1 point are highlighted in red and were included in the simplified model of postinfection succession (see Fig. 2).
Median functional abundances across subjects grouped by COG category and recovery stage. Asterisks denote categories whose abundance at a given stage differed from that of healthy subjects (q < 0.05, Mann-Whitney U test).
Enzymes whose abundance significantly changes 7 dpp. Shown are enzymes (and their EC identification numbers) whose abundance is significantly different from healthy subjects’ samples (q < 0.1; two-sided Mann-Whitney U test). Enzymes are ranked according to log2-ratios of mean abundance (>0.0 indicates higher among 7 dpp samples).
Enriched enzyme sub-subclasses at 7 dpp. To identify enzyme functions that were enriched at 7 dpp (relative to control samples), we counted the number of enzymes from each EC sub-subclass that were significantly enriched or reduced at 7 dpp (see Table S5 for a full list of enzymes enriched at 7 dpp). We then ranked sub-subclasses by using the chi-squared test statistic. Highlighted in green are sub-subclasses where more members are enriched than reduced at 7 dpp.