

ABSTRACT
Because of recent advances in deep sequencing technology, detailed analysis of hepatitis C virus (HCV) quasispecies and their dynamic changes in response to direct antiviral agents (DAAs) became possible, although the role of quasispecies is not fully understood. In this study, to clarify the evolution of viral quasispecies and the origin of drug-resistant mutations induced by interferon (IFN)-based protease inhibitor therapy, the nonstructural-3 (NS3) region of genotype 1b HCV in 34 chronic hepatitis patients treated with telaprevir (TVR)/pegylated interferon (PEG-IFN)/ribavirin (RBV) was subjected to a deep sequencing study coupled with phylogenetic analysis. Twenty-six patients (76.5%) achieved a sustained viral response (SVR), while 8 patients did not (non-SVR; 23.5%). When the complexity of the quasispecies was expressed as the mutation frequency or Shannon entropy value, a significant decrease in the IFNL3 (rs8099917) TT group and a marginal decrease in the SVR group were found soon (12 h) after the introduction of treatment, whereas there was no decrease in the non-SVR group and no significant decrease in mutation frequency in the IFNL3 TG/GG group. In the analysis of viral quasispecies composition in non-SVR patients, major populations greatly changed, accompanied by the appearance of resistance, and the compositions were unlikely to return to the pretreatment composition even after the end of therapy. Clinically TVR-resistant variants were observed in 5 non-SVR patients (5/8, 62.5%), all of which were suspected to have acquired resistance by mutations through phylogenetic analysis. In conclusion, results of the study have important implications for treatment response and outcome in interferon-based protease inhibitor therapy.
IMPORTANCE In the host, hepatitis C virus (HCV) consists of a variety of populations (quasispecies), and it is supposed that dynamic changes in quasispecies are closely related to pathogenesis, although this is poorly understood. In this study, recently developed deep sequencing technology was introduced, and changes in quasispecies associated with telaprevir (TVR)/pegylated interferon (PEG-IFN)/ribavirin (RBV) triple therapy and their clinical significance were investigated extensively by phylogenetic tree analysis. Through this study, the associations among treatment response, changes in viral quasispecies complexity in the early stage of treatment, changes in the quasispecies composition, and origin of TVR-resistant variant HCV were elucidated.
INTRODUCTION
Recently, various novel small compounds with potent antiviral effects called direct antiviral agents (DAAs) have been developed for the treatment of chronic hepatitis C (1), and their significant antiviral activity is literally changing the world of anti-hepatitis C virus (HCV) therapy. Among these, nonstructural 3 (NS3) and NS4A protease inhibitors (PIs) were first approved for clinical use, and telaprevir (TVR) and simeprevir (SMV) became available for HCV infection in several countries, including Japan, in combination with pegylated interferon (PEG-IFN)/ribavirin (RBV) (2, 3). In high-titer genotype 1 patients refractory to conventional PEG-IFN/RBV therapy, a markedly higher sustained viral response (SVR) could be obtained with triple therapy by using these PIs combined with PEG-IFN/RBV (3–5).
One of the virological problems underlying DAA treatment is the appearance of drug-resistant HCV. In refractory patients, HCV variants with drug resistance become dominant populations in the host, eventually causing non-SVR. To date, V36, T54, R155, A156, D168, and V170 (6–8) have been identified as hot spot positions for PI resistance mutations, but the process by which HCV variants with resistance mutations appear has not been fully elucidated. On the other hand, it was recently reported that even DAA treatment-naive HCV might naturally have a substantial number of variants resistant to PIs, and this issue has been given attention (9). However, it was also reported that such naturally resistant HCV did not always exhibit treatment resistance (10, 11).
HCV is present as a mixed populations of closely related variant viruses, called quasispecies, in the host (12–14), and the quasispecies is speculated to modify the treatment response to antiviral agents, although detailed analysis of viral quasispecies has been technically difficult because of the necessity to obtain high-volume multiple viral sequences. Due to the recent development of deep sequencing techniques using next-generation sequencers (15–18), detailed analysis of quasispecies has become possible. Several deep sequencing studies have been undertaken to disclose the origin of DAA-resistant variants through analyzing DAA-resistant variant populations over time (10, 11, 16, 19, 20). On the other hand, previous investigations tended to focus on hot spots for specific mutations but lacked the phylogenetic analysis that is needed to determine the origins of certain viral populations.
To clarify the evolution of viral quasispecies and the origin of drug-resistant mutations induced by PIs combined with PEG-IFN/RBV, we chose patients who were undergoing TVR/PEG-IFN/RBV triple therapy and performed a deep sequencing study, including a phylogenetic analysis. We selected this strategy because TVR-included therapy was the first regimen that included a PI, which enabled us to analyze the influence of PIs on the viral quasispecies over a long period of time.
MATERIALS AND METHODS
Patients.
Subjects were 34 HCV genotype 1b patients who consecutively received TVR/PEG-IFN/RBV combination therapy at Yamanashi University Hospital. The 24-week regimen consisted of TVR/PEG-IFN/RBV triple therapy for 12 weeks followed by dual therapy with PEG-IFN and ribavirin for 12 weeks. All patients fulfilled the following criteria: (i) negative for hepatitis B surface antigen; (ii) no other forms of hepatitis, such as primary biliary cirrhosis, autoimmune liver disease, or alcoholic liver disease; (iii) free of coinfection with human immunodeficiency virus. Signed consent was obtained for participation in the study protocol, which had been approved by the Human Ethics Review Committee of Yamanashi University. The clinical backgrounds of the 34 patients are summarized in Table 1.
TABLE 1.
Patient characteristics according to response to TVR/PEG-IFN/RBV triple therapy
| Characteristica | SVR (n = 26) | Non-SVR (n = 8) | P value |
|---|---|---|---|
| Age (yrs; mean ± SD) | 55.8 ± 7.5 | 59.4 ± 9.0 | 0.393 |
| Sex (F/M) | 13/13 | 5/3 | 0.693 |
| Naive [no. (%)] | 16 (61.5) | 4 (50) | 0.689 |
| Albumin (g/dl; mean ± SD) | 4.1 ± 0.4 | 4.2 ± 0.4 | 0.403 |
| γ-GTP (IU/liter; mean ± SD) | 56.7 ± 61.9 | 35.3 ± 17.2 | 0.477 |
| AST (IU/liter; mean ± SD) | 67.5 ± 53.5 | 42.8 ± 23.7 | 0.155 |
| ALT (IU/liter; mean ± SD) | 88.5 ± 75.3 | 44.8 ± 24.9 | 0.071 |
| Platelets (104/ml; mean ± SD) | 15.2 ± 4.9 | 14.8 ± 5.2 | 0.745 |
| AFP (ng/ml; mean ± SD) | 8.6 ± 9.4 | 7.6 ± 4.1 | 0.477 |
| Core aa 70Q [no. (%)] | 6 (23.1) | 3 (37.5) | 0.649 |
| ISDR ≤ 2 [no. (%)] | 7 (26.9) | 1 (12.5) | 0.645 |
| IRRDR ≤ 5 [no. (%)] | 11 (42.3) | 5 (62.5) | 0.438 |
| IFNL3 TG/GG [no. (%)] | 4 (15.4) | 5 (62.5) | 0.017 |
| HCV RNA [log IU/ml; mean (range)] | 6.4 (4.7–74) | 6.9 (6.2–7.4) | 0.080 |
Abbreviations: AST, aspartate transaminase; ALT, alanine aminotransferase; AFP, α-fetoprotein.
Deep sequencing.
Deep sequencing of part of the viral NS3 region was performed for all 34 patients at 2 time points: baseline and 12 h after the introduction of therapy. For 8 non-SVR patients, deep sequencing was additionally performed at 2 other time points: at viral reelevation and at the last observation (Fig. 1). Briefly, RNA was extracted from stored sera and reverse transcribed to cDNA (21). Then, a 2-step nested PCR was carried out with primers specific for the NS3 region of the HCV genome. This PCR procedure amplified 454 viral nucleotides, including nucleotides 81 to 534 of the NS3 region. The primers for the second-round PCR had bar codes 10 nucleotides in length attached, and these differed for each sample, so that the PCR products from each sample were identifiable (see Table S1 in the supplemental material). After band densities of the PCR products were quantified using a Pico Green double-stranded DNA assay kit (Invitrogen, Tokyo, Japan), concentrations in the samples were adjusted to a common value and pooled samples were prepared.
FIG 1.
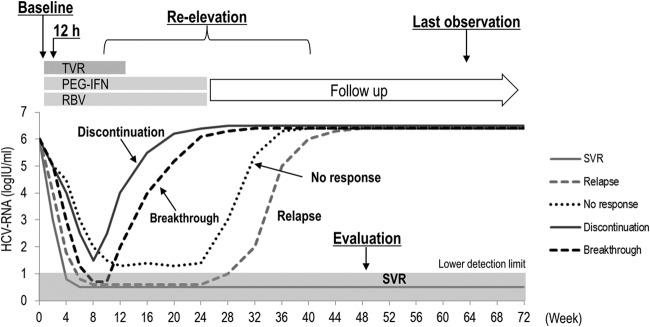
Clinical course of the patients and time points for serum sample collection for deep sequencing. NS3 deep sequence analysis at baseline and at 12 h was performed in all 34 patients, while that at reelevation and at the last observation was additionally performed in 8 non-SVR patients.
Libraries were then subjected to emulsion PCR, the enriched DNA beads were loaded onto a picotiter plate, and pyrosequencing was carried out with a Roche GS Junior/454 sequencing system using titanium chemistry (Roche, Branford, CT). The Roche Variant Analyzer version 2.5pl was used for the analysis.
Genetic analysis.
The complexity of the quasispecies population obtained by deep sequencing was analyzed at the nucleotide level by 2 different methods: (i) mutation frequency (Mf) and (ii) normalized Shannon entropy (Sn) (22–26). The Mf represents the proportion of mutant nucleotides in a genome population. Briefly, after determining the consensus nucleotide in each nucleotide position at each time point for each patient, the total number of nucleotides that differed from the consensus nucleotide was counted in each genome. Then that number was divided by the total number of genomes that were sequenced. The normalized Sn is the proportion of different genomes in a distribution of mutants, calculated as follows:
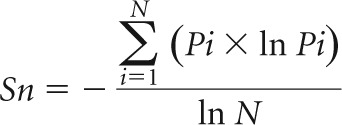 |
in which Pi is the frequency of each sequence in the population and N is the total number of sequences analyzed.
Phylogenetic trees were constructed with BioEdit and MEGA6.05 using the neighbor-joining method, and bootstrapping was performed with 1,000 replicates (27). To calculate the genetic distance, the top 10 most frequent isolates at each time point were selected for each patient. By calculating all the genetic distances between any 2 isolates belonging to 2 different time points, the average genetic distance between 2 different time points was determined for each patient. Likewise, all of these average genetic distances were determined in the 8 non-SVR patients, and the distance data were subjected to statistical analysis.
Detection of amino acid substitutions in core and NS5A regions of HCV-1b.
With the use of HCV-J (GenBank accession number D90208) as a reference, substitutions at amino acid (aa) 70 of arginine (70R) or glutamine (70Q) in the core of HCV-1b (28) were determined as described previously (29). Likewise, the sequence of aa 2,209 to 2,248 in the NS5A of HCV-1b (IFN sensitivity-determining region [ISDR]) (30) was determined by direct sequencing, and the numbers of amino acid substitutions in ISDR were counted in comparison with HCV-J (29). Furthermore, the sequence of aa 2,334 to 2,379 in the NS5A of HCV-1b (IFN-RBV resistance-determining region [IRRDR]) (31) was determined by direct sequencing, after which the numbers of amino acid substitutions in IRRDR were counted in comparison with the consensus sequence constructed in the previous study (29). From those studies, it was reported that HCV-1b with the core aa 70Q with ISDR of ≥1 or IRRDR of ≥4 was IFN resistant, while that with core aa 70R and ISDR of ≤2 or IRRDR of ≤5 was considered IFN sensitive.
IFNL3 SNP analysis.
Human genomic DNA was extracted from peripheral blood by using a blood DNA extraction kit (Qiagen, Tokyo, Japan) according to the manufacturer's protocol. The allele typing of each DNA sample was performed by real-time PCR with a model 7500 sequencer (ABI, Tokyo, Japan) using a 6-carboxyfluorescein-labeled single nucleotide polymorphism (SNP) primer for the locus rs8099917 at IFNL3 (interferon lambda 3) (ABI). For this analysis, TT was the major variant while TG and GG were minor variants.
Statistical analysis.
Data on the patients' backgrounds are expressed as mean or median values with standard deviations. Statistical differences in the parameters between the 2 groups (SVR and non-SVR) were determined by the Mann-Whitney U test and Fisher's exact test. Time-dependent changes in genomic complexity and genetic distance were analyzed statistically with the Wilcoxon rank sum test. All P values of <0.05 (two-tailed test) were considered significant.
RESULTS
Clinical characteristics of patients receiving TVR/PEG-IFN/RBV triple therapy.
Clinical backgrounds of 34 patients who received TVR/PEG-IFN/RBV triple therapy are reported separately for the SVR and non-SVR groups (Table 1). SVR was achieved in 26 patients (76.5%) and was not achieved in 8 (23.5%). The only factor that differed between the SVR and non-SVR groups was an IFNL3 SNP. The IFNL3 TG/GG SNP was observed in 15.4% of the SVR group patients, which was significantly lower than that in the non-SVR group (62.5%).
Early changes in genetic complexity after introduction of triple therapy.
Deep sequencing of part of the viral NS3 region was performed for all 34 patients at 2 time points (baseline and 12 h after the introduction of therapy) to examine early changes in the genetic complexity of viral quasispecies (Mf and Sn) after introduction of triple therapy (12 h) (Fig. 1). In terms of Mf, there was no apparent difference in genetic complexity between baseline and 12 h after introduction of the therapy in the 34 patients as a whole (P = 0.18) (Fig. 2A). However, when the patients were categorized into 2 groups according to treatment response, genetic complexity tended to decrease in the SVR group but not in the non-SVR group (P = 0.08 and P = 0.33, respectively). Furthermore, when the change in genetic complexity was compared according to the IFNL3 SNP, it was significantly decreased in the IFNL3 TT group but not in the IFNL3 TG/GG group (P = 0.03 and P = 0.14, respectively).
FIG 2.

Changes in the genetic complexity of the NS3 region 12 h after the introduction of TVR/PEG-IFN/RBV triple therapy are shown for all patients, patients divided by treatment outcome, and patients divided by IFNL3 SNPs. Changes were analyzed by mutation frequency (A) and by normalized Shannon entropy (B). Boxes represent the 25th to 75th percentiles, and horizontal lines within the boxes show the median values. Whisker ends show the minimum and maximum values of all data. P values were obtained using the Wilcoxon signed-rank test.
Similarly, changes in genetic complexity 12 h after the introduction of therapy were examined in terms of Sn (Fig. 2B). In this analysis, genetic complexity was significantly decreased 12 h after the introduction of therapy in the 34 patients as a whole (P < 0.01). In comparisons of treatment response, genetic complexity was significantly decreased in the SVR group but not in the non-SVR group (P < 0.01 and P = 0.4, respectively). In addition, with regard to the IFNL3 SNP, genetic complexity was significantly decreased in both the IFNL3 TT and TG/GG groups, with the phenomenon being more remarkable in the TT group than in the TG/GG group (P < 0.01 and P = 0.02, respectively).
Technically, comparison of viral genomic complexity in different samples should be done carefully when a PCR procedure is used and when viral titers are significantly different: a sample with a low viral titer with small amounts of PCR template might be erroneously interpreted as having lower genomic complexity (32). In this sense, it is possible that the decreased viral titer at 12 h might have influenced the Sn and Mf values. However, since the HCV RNA titers at each time point (at baseline and at 12 h) were not significantly different between SVR and non-SVR or between IFNL3 TT and TG/GG (Table 2), it is evident that patterns of changes in viral complexity are different between SVR versus non-SVR and between IFNL3 TT versus TG/GG.
TABLE 2.
HCV RNA titers at baseline and 12 h
| Time after introduction of triple therapy | Comparison of HCV RNA titer (range) for SVR vs non-SVR |
Comparison of HCV RNA titer (range) for IFNL3 SNP |
||||
|---|---|---|---|---|---|---|
| SVR (n = 26) | Non-SVR (n = 8) | P value | TT (n = 25) | TG/GG (n = 9) | P value | |
| Baseline | 6.4 (4.7–7.4) | 6.9 (6.2–7.4) | 0.08 | 6.7 (4.7–7.4) | 6.7 (5.5–7.4) | 0.74 |
| 12 h | 4.6 (2.6–5.8) | 5.2 (4.4–6.4) | 0.06 | 4.6 (2.6–5.8) | 5.1 (3.9–6.4) | 0.41 |
| Δ (baseline − 12 h) | 1.7 (1.2–3.4) | 1.7 (1.0–2.4) | 0.54 | 1.7 (1.2–3.4) | 1.7 (1.0–2.0) | 0.30 |
Clinical courses in non-SVR patients.
Next, changes in the genetic composition of viral populations (quasispecies) as well as the origin of TVR-resistant mutations of HCV were further analyzed with a particular focus on the 8 non-SVR patients. The causes of non-SVR were defined as follows: termination of drugs due to adverse effects (discontinuation); reappearance of HCV after it was undetected once and drug administration was completed (relapse); failure of elimination of HCV during drug administration (no response); reappearance of HCV during drug administration although HCV was once undetected (breakthrough). The distribution of the non-SVR patients according to cause was as follows: discontinuation, 3; relapse, 2; no response, 2; breakthrough, 1. Table 3 summarizes the viral profiles and treatment course for the 8 patients. The exact time points for the deep sequence analysis are shown in Fig. S1 in the supplemental material.
TABLE 3.
Telaprevir-resistant variants responsible for treatment failure in non-SVR patients and their time-dependent changes
| Patient no. | Outcome | Previous response | IFNL3 | Resistant variant |
% with variants at: |
|||||
|---|---|---|---|---|---|---|---|---|---|---|
| V36 | T54 | R155 | A156 | Baseline | Reelevation | Last observation (no. of wks after treatment) | ||||
| 1 | Discontinuation | Relapse | T/G | |||||||
| 2 | Discontinuation | Relapse | T/T | |||||||
| 3 | Discontinuation | Naive | T/G | A | 0.36 | 99.79 | 0.08 (26) | |||
| 4 | Breakthrough | No response | T/T | F | 0 | 98.19 | 0 (45) | |||
| 5 | Relapse | Naive | T/G | |||||||
| 6 | Relapse | No response | T/T | S | 0 | 99.48 | 1.27 (47) | |||
| 7 | No response | Naive | T/G | A | 0.28 | 99.84 | 0.04 (34) | |||
| 8 | No response | Naive | T/G | C | 0 | 98.11 | 96.05 (25) | |||
A clinically resistant mutation was observed in 5 of the 8 patients (62.5%) during treatment and during the follow-up after completion of treatment (V36C, 1; T54A, 2; A156F, 1; A156S, 1). The same mutation as the clinically resistant mutation was not observed at baseline in 3 of the 5 patients, even via deep sequencing, but a resistant HCV variant (T54A) was recognized at baseline as a minor population in 2 patients (patients 3 and 7). TVR-resistant HCV variants accounted for 98% or more when the viral titer was again elevated in all 5 patients, but the rate of a resistance mutation decreased in 4 patients (patients 3, 4, 6, and 7), and the wild type became the dominant form during the follow-up after the end of treatment.
Changes in the compositions of viral populations over time in non-SVR patients.
Next, changes in the compositions of HCV populations over time were investigated in all of the non-SVR patients by constructing phylogenetic trees from all isolates obtained at 3 time points, i.e., baseline, reelevation of the viral titer, and the last observation. The isolates obtained at the reelevation of the viral titer had clusters different from those at baseline (Fig. 3). Moreover, the isolates at the last observation were distinct from those at baseline but seemed to be close to the isolates obtained at reelevation except in patient 3 (Fig. 3). Since it was difficult to demonstrate bootstrap values in these large trees, small-scale trees using approximately the 10 most populated isolates at each point in each non-SVR patient were also constructed to demonstrate the interrelationship among isolates at different time points; bootstrap values of 50 or more were determined (see Fig. S2 in the supplemental material). As shown in these trees, isolates at the same time point tended to be separated from isolates at different time points by the branching nodes with high bootstrap values.
FIG 3.

Phylogenetic trees were constructed using all isolates at baseline, at reelevation, and at the last observation. Numbers at the top right of each phylogenic tree indicate the number of weeks after the end of treatment.
To clarify the changes in major viral populations, approximately 10 dominant populations were determined at 4 points (baseline, 12 h, reelevation of the viral titer, and the last observation) in each patient, and such changes were demonstrated. As shown in Fig. 4A, to H the composition of the dominant population at reelevation greatly changed compared with that at baseline and at 12 h after introduction of treatment except in patient 3. In addition, these compositional changes were maintained even at the last observation. For statistical analysis of the results, 10 dominant isolates determined at each time point were used for the calculation and comparison of the genetic distance between the isolates at any 2 time points (baseline, reelevation, and last observation). As a result, the genetic distance between the isolates at baseline and reelevation or between the isolates at baseline and the last observation was significantly larger than that between the isolates at baseline and at the viral titer reelevation (Fig. 5) (P = 0.01), demonstrating that the changes in population composition induced by triple therapy were unlikely to return to the pretreatment composition.
FIG 4.


Time-dependent changes in the top 10 most populated isolates at baseline, 12 h, reelevation, and last observation in each patient. To characterize viral sequences specific for each time point, only nucleotide positions with time-dependent nucleotide changes are shown. The most frequent isolate at reelevation was used as the reference sequence. Nucleotide positions in the figure indicate the nucleotide positions from the start nucleotide in genotype 1b NS3. An isolate closest to the most frequent isolate found at reelevation is indicated by the double ring for each time point. In patients with the appearance of resistance mutations, time courses in the changes of hot spot nucleotides and resultant changes in amino acids are demonstrated at the right (C, D, F, G, and H).
FIG 5.

Genetic distances in the NS3 region between baseline and reelevation, between reelevation and the last observation, and between the last observation and baseline were compared in 8 non-SVR patients. The top 10 HCV isolates for each time point were selected to calculate the genetic distance for each patient. After obtaining these genetic distances for all 8 patients, statistical analysis was performed with the Wilcoxon rank sum test.
Origin of HCV isolates showing clinical TVR resistance.
To investigate which population at baseline developed a TVR-resistant mutation, deep sequencing results at 4 time points (baseline, 12 h after therapy, at reelevation of the viral titer, and at the last observation) were reanalyzed in 5 patients in whom clinically resistant mutations appeared (patients 3, 4, 6, 7, and 8) (Table 3). Among them, 3 patients (patients 4, 6, and 8) did not have any resistant mutant at baseline, while 2 patients (patients 3 and 7) had T54A mutants (0.36% and 0.28%, respectively) at baseline (Table 3).
In patient 3, the isolates with T54A accounted for 0.36% at baseline but had increased to 99.79% at the time of reelevation of the viral titer (Fig. 4C). On the other hand, from comparison of their sequences it was evident that those T54A isolates at baseline were different from the major T54A isolate at reelevation. The isolate at baseline closest to the major T54A isolate at reelevation was the wild-type isolate of rank 1 that existed as a major population before treatment, and we speculated that the T54A resistance mutation was developed by acquisition of a mutation to the T54T wild type in the 1-ranked isolate. In patient 7, who had a mixture of T54A variants as a minor population at baseline, similar to patient 3, the analysis showed that the T54A isolate that had become the dominant population after treatment was considered to have developed by acquisition of a mutation to the T54T wild type (Fig. 4G).
DISCUSSION
In this study, with the focus on the HCV NS3 protease region, viral quasispecies and changes associated with TVR/PEG-IFN/RBV triple therapy were investigated extensively by deep sequencing along with phylogenetic analysis, as well as their clinical significance. As a result, the associations between treatment response and changes in the complexity of the viral quasispecies at the early stage of treatment, changes in quasispecies composition associated with treatment in non-SVR patients, and the origin of TVR-resistant HCV variants were demonstrated.
First, focusing on changes in the complexity of the viral population (quasispecies) at the very early stage, that is, 12 h after the introduction of triple therapy, we observed that these early changes in viral complexity were correlated with the final treatment outcome or IFNL3 status of the host. Previously, through the analysis of all HCV genomic fragments or E2-HVR-1 (hypervariable region 1), it was also indicated that an early decrease in the complexity of the quasispecies was associated with an early rapid viral response as well as an SVR after introduction to PEG-IFN/RBV dual therapy or IFN monotherapy (15, 33–35). However, it remained to be elucidated how the quasispecies was related to the final treatment outcome or an IFNL3 SNP after TVR/PEG-IFN/RBV triple therapy. Employing Sn and Mf, we elucidated that the complexity of the quasispecies significantly decreased in Sn and marginally decreased in Mf as early as 12 h after the introduction of treatment in SVR patients but not in non-SVR patients and that changes in the complexity of the quasispecies were dependent on the host factor of the IFNL3 SNP. Since the IFNL3 SNP is a host factor regulating the IFN response (27, 36, 37), we speculated that the IFN response was greatly involved as a factor stipulating the change in the complexity of quasispecies at the early stage.
Next, dynamic changes in the composition of the viral population were examined in the non-SVR patients. First, a phylogenetic tree was constructed for all 8 patients with non-SVR using all determined viral isolates (Fig. 3). It was found that the composition of the population differed greatly between the time of treatment introduction and reelevation of the viral titer. Interestingly, the altered composition induced by the triple therapy did not return to the pretreatment status even after the end of therapy at the time of the last observation, except in patient 3 (Fig. 3). Successively, dominant populations were extracted and compared at baseline, at 12 h after treatment, at the reelevation of the viral titer, and at the last observation in all non-SVR patients (Fig. 4). Though the major population showed no marked change from before treatment to 12 h after the introduction of treatment, they greatly changed at the time of reelevation of the viral titer (time of appearance of TVR resistance), and a TVR-resistant mutation returned to the wild type after the end of treatment, whereas the compositional change in the population was maintained and the composition did not return to the pretreatment status (Fig. 4). The result was further confirmed statistically since genetic distances between baseline and reelevation were significantly longer than between reelevation and the last observation (Fig. 5). The influence of this compositional change in the viral population (quasispecies) on the future clinical course is unknown. However, it is possible that resistance may develop more easily during new therapies, since these compositions induced by TVR/PEG-IFN/RBV triple therapy were considered advantageous for viral proliferation in the environment of the triple therapy, although the TVR-resistant hot spot mutation itself returned to the wild type. Therefore, although clinical verification is necessary, we should be careful when introducing new therapies for these non-SVR patients.
Finally, analyses were performed to determine what pretreatment population gave birth to TVR-resistant HCV variants in the non-SVR patients. A clinically resistant mutation appeared in 5 of the 8 non-SVR patients (62.5%), and TVR resistance was considered to be acquired by a new mutation and not by selection of a preexisting variant during treatment in all 5 patients. For 3 of those 5 patients, deep sequencing showed no mixture of TVR-resistant populations at baseline, but 2 patients (patients 3 and 7) exhibited the T54A mutation (0.28% and 0.36%, respectively), which was thought to be the causal mutation for clinical resistance. However, these populations did not directly change into major populations exhibiting clinical resistance and disappeared at the reelevation of the viral titer, whereas it was likely that the population with wild-type T54T at baseline acquired clinical resistance by developing the T54A mutation. Previous reports demonstrated the possibility that a trace mixture of resistant mutations at baseline does not lead to clinical resistance (10, 11). The phenomenon was further clarified by the present study with the use of phylogenetic analysis, and it was considered difficult to predict TVR resistance at baseline. On the other hand, since the true depth needed to clarify the complete composition of quasispecies is unknown, it is still possible that deeper sequencing might identify a preexisting mutant variant that evolved into major clinically resistant populations, and this is one of the limitations of deep sequencing analysis. However, our study at least showed from phylogenetic analysis that preexisting mutant variants do not always evolve into clinically resistant populations.
It is unknown why a TVR-resistant hot spot mutation was undetected in patient 3 with relapse, even with deep sequencing. Although one possibility is that the TVR-resistant variants responsible for the development of TVR resistance had already disappeared at the time of analysis of relapse, it is also possible that some unknown mechanisms might exist that enable HCV to develop drug resistance even without drug-specific mutations, since the recent large-scale analysis of TVR resistance also detected mutants in only 77% of patients with non-SVR (38). In a recent in vitro study, it was reported that increased replication fitness through adaptation of the host's environment long after infection might lead to decreased drug sensitivity in HCV, even without specific mutations (39). Since various DAAs and various DAA combination regimens are still expected to appear, the mechanism of drug resistance lacking specific mutations should be clarified further.
What is the underlying mechanism for the association between the early change in quasispecies and the appearance of clinical TVR resistance? As shown in Fig. 2, genetic complexity 12 h after the introduction of therapy was decreased in the SVR group but not in the non-SVR group, demonstrating that viral populations disappeared vastly in the SVR patients but not in the SVR patients. Considering this result, it is possible that the non-SVR patients had a greater chance of developing TVR resistance since the larger number of various populations could function as a reservoir of drug-resistant HCV, though further study is needed.
In conclusion, focusing on the dynamic changes in quasispecies, this study demonstrated the association between treatment response and change in quasispecies of the virus at the early stage after the introduction of treatment, the origin of TVR-resistant HCV variants, and dynamic changes in virus populations after treatment by TVR/PEG-IFN/RBV triple therapy. These findings have important implications for responses to triple therapy and outcomes.
Supplementary Material
ACKNOWLEDGMENTS
This study was supported by grant-in-aid from the Ministry of Education, Science, Sports and Culture of Japan, 23390195 2459096 24590965 26670380, and grant- in-aid from the Ministry of Health, Labour, and Welfare of Japan, H25-kanen-001 H25-kanen-004 H25-kanen-006 H25-kanen-012.
Footnotes
Supplemental material for this article may be found at http://dx.doi.org/10.1128/JVI.03127-14.
REFERENCES
- 1.Asselah T, Marcellin P. 2012. Direct acting antivirals for the treatment of chronic hepatitis C: one pill a day for tomorrow. Liver Int 32(Suppl 1):88–102. doi: 10.1111/j.1478-3231.2011.02699.x. [DOI] [PubMed] [Google Scholar]
- 2.Hayashi N, Okanoue T, Tsubouchi H, Toyota J, Chayama K, Kumada H. 2012. Efficacy and safety of telaprevir, a new protease inhibitor, for difficult-to-treat patients with genotype 1 chronic hepatitis C. J Viral Hepat 19:e134–e142. doi: 10.1111/j.1365-2893.2011.01528.x. [DOI] [PMC free article] [PubMed] [Google Scholar]
- 3.Kumada H, Toyota J, Okanoue T, Chayama K, Tsubouchi H, Hayashi N. 2012. Telaprevir with peginterferon and ribavirin for treatment-naive patients chronically infected with HCV of genotype 1 in Japan. J Hepatol 56:78–84. doi: 10.1016/j.jhep.2011.07.016. [DOI] [PubMed] [Google Scholar]
- 4.Jacobson IM, McHutchison JG, Dusheiko G, Di Bisceglie AM, Reddy KR, Bzowej NH, Marcellin P, Muir AJ, Ferenci P, Flisiak R, George J, Rizzetto M, Shouval D, Sola R, Terg RA, Yoshida EM, Adda N, Bengtsson L, Sankoh AJ, Kieffer TL, George S, Kauffman RS, Zeuzem S. 2011. Telaprevir for previously untreated chronic hepatitis C virus infection. N Engl J Med 364:2405–2416. doi: 10.1056/NEJMoa1012912. [DOI] [PubMed] [Google Scholar]
- 5.Zeuzem S, Andreone P, Pol S, Lawitz E, Diago M, Roberts S, Focaccia R, Younossi Z, Foster GR, Horban A, Ferenci P, Nevens F, Mullhaupt B, Pockros P, Terg R, Shouval D, van Hoek B, Weiland O, Van Heeswijk R, De Meyer S, Luo D, Boogaerts G, Polo R, Picchio G, Beumont M. 2011. Telaprevir for retreatment of HCV infection. N Engl J Med 364:2417–2428. doi: 10.1056/NEJMoa1013086. [DOI] [PubMed] [Google Scholar]
- 6.Sarrazin C, Kieffer TL, Bartels D, Hanzelka B, Muh U, Welker M, Wincheringer D, Zhou Y, Chu HM, Lin C, Weegink C, Reesink H, Zeuzem S, Kwong AD. 2007. Dynamic hepatitis C virus genotypic and phenotypic changes in patients treated with the protease inhibitor telaprevir. Gastroenterology 132:1767–1777. doi: 10.1053/j.gastro.2007.02.037. [DOI] [PubMed] [Google Scholar]
- 7.Lange CM, Sarrazin C, Zeuzem S. 2010. Review article. Specifically targeted anti-viral therapy for hepatitis C: a new era in therapy. Aliment Pharmacol Ther 32:14–28. doi: 10.1111/j.1365-2036.2010.04317.x. [DOI] [PubMed] [Google Scholar]
- 8.Halfon P, Locarnini S. 2011. Hepatitis C virus resistance to protease inhibitors. J Hepatol 55:192–206. doi: 10.1016/j.jhep.2011.01.011. [DOI] [PubMed] [Google Scholar]
- 9.Shindo H, Maekawa S, Komase K, Sueki R, Miura M, Kadokura M, Shindo K, Amemiya F, Kitamura T, Nakayama Y, Inoue T, Sakamoto M, Okada SI, Asahina Y, Izumi N, Honda M, Kaneko S, Enomoto N. 2011. Characterization of naturally occurring protease inhibitor-resistance mutations in genotype 1b hepatitis C virus patients. Hepatol Int 6:482–490. doi: 10.1007/s12072-011-9306-7. [DOI] [PubMed] [Google Scholar]
- 10.Akuta N, Suzuki F, Seko Y, Kawamura Y, Sezaki H, Suzuki Y, Hosaka T, Kobayashi M, Hara T, Kobayashi M, Saitoh S, Arase Y, Ikeda K, Kumada H. 2013. Emergence of telaprevir-resistant variants detected by ultra-deep sequencing after triple therapy in patients infected with HCV genotype 1. J Med Virol 85:1028–1036. doi: 10.1002/jmv.23579. [DOI] [PubMed] [Google Scholar]
- 11.Akuta N, Suzuki F, Fukushima T, Kawamura Y, Sezaki H, Suzuki Y, Hosaka T, Kobayashi M, Hara T, Kobayashi M, Saitoh S, Arase Y, Ikeda K, Kumada H. 2013. Prediction of treatment efficacy and telaprevir-resistant variants after triple therapy in patients infected with hepatitis C virus genotype 1. J Clin Microbiol 51:2862–2868. doi: 10.1128/JCM.01129-13. [DOI] [PMC free article] [PubMed] [Google Scholar]
- 12.Martell M, Esteban JI, Quer J, Genesca J, Weiner A, Esteban R, Guardia J, Gomez J. 1992. Hepatitis C virus (HCV) circulates as a population of different but closely related genomes: quasispecies nature of HCV genome distribution. J Virol 66:3225–3229. [DOI] [PMC free article] [PubMed] [Google Scholar]
- 13.Okamoto H, Kojima M, Okada S, Yoshizawa H, Iizuka H, Tanaka T, Muchmore EE, Peterson DA, Ito Y, Mishiro S. 1992. Genetic drift of hepatitis C virus during an 8.2-year infection in a chimpanzee: variability and stability. Virology 190:894–899. doi: 10.1016/0042-6822(92)90933-G. [DOI] [PubMed] [Google Scholar]
- 14.Taniguchi S, Okamoto H, Sakamoto M, Kojima M, Tsuda F, Tanaka T, Munekata E, Muchmore EE, Peterson DA, Mishiro S. 1993. A structurally flexible and antigenically variable N-terminal domain of the hepatitis C virus E2/NS1 protein: implication for an escape from antibody. Virology 195:297–301. doi: 10.1006/viro.1993.1378. [DOI] [PubMed] [Google Scholar]
- 15.Nasu A, Marusawa H, Ueda Y, Nishijima N, Takahashi K, Osaki Y, Yamashita Y, Inokuma T, Tamada T, Fujiwara T, Sato F, Shimizu K, Chiba T. 2011. Genetic heterogeneity of hepatitis C virus in association with antiviral therapy determined by ultra-deep sequencing. PLoS One 6:e24907. doi: 10.1371/journal.pone.0024907. [DOI] [PMC free article] [PubMed] [Google Scholar]
- 16.Hiraga N, Imamura M, Abe H, Hayes CN, Kono T, Onishi M, Tsuge M, Takahashi S, Ochi H, Iwao E, Kamiya N, Yamada I, Tateno C, Yoshizato K, Matsui H, Kanai A, Inaba T, Tanaka S, Chayama K. 2011. Rapid emergence of telaprevir resistant hepatitis C virus strain from wild type clone in vivo. Hepatology 54:781–788. doi: 10.1002/hep.24460. [DOI] [PubMed] [Google Scholar]
- 17.Verbinnen T, Van Marck H, Vandenbroucke I, Vijgen L, Claes M, Lin TI, Simmen K, Neyts J, Fanning G, Lenz O. 2010. Tracking the evolution of multiple in vitro hepatitis C virus replicon variants under protease inhibitor selection pressure by 454 deep sequencing. J Virol 84:11124–11133. doi: 10.1128/JVI.01217-10. [DOI] [PMC free article] [PubMed] [Google Scholar]
- 18.Wang GP, Sherrill-Mix SA, Chang KM, Quince C, Bushman FD. 2010. Hepatitis C virus transmission bottlenecks analyzed by deep sequencing. J Virol 84:6218–6228. doi: 10.1128/JVI.02271-09. [DOI] [PMC free article] [PubMed] [Google Scholar]
- 19.Kosaka K, Imamura M, Hayes CN, Abe H, Hiraga N, Yoshimi S, Murakami E, Kawaoka T, Tsuge M, Aikata H, Miki D, Ochi H, Matsui H, Kanai A, Inaba T, Chayama K. 2015. Emergence of resistant variants detected by ultra-deep sequencing after asunaprevir and daclatasvir combination therapy in patients infected with hepatitis C virus genotype 1. J Viral Hepat 22:158–165. doi: 10.1111/jvh.12271. [DOI] [PubMed] [Google Scholar]
- 20.Akuta N, Suzuki F, Sezaki H, Suzuki Y, Hosaka T, Kobayashi M, Kobayashi M, Saitoh S, Ikeda K, Kumada H. 2014. Evolution of simeprevir-resistant variants over time by ultra-deep sequencing in HCV genotype 1b. J Med Virol 86:1314–1322. doi: 10.1002/jmv.23966. [DOI] [PubMed] [Google Scholar]
- 21.Miura M, Maekawa S, Takano S, Komatsu N, Tatsumi A, Asakawa Y, Shindo K, Amemiya F, Nakayama Y, Inoue T, Sakamoto M, Yamashita A, Moriishi K, Enomoto N. 2013. Deep-sequencing analysis of the association between the quasispecies nature of the hepatitis C virus core region and disease progression. J Virol 87:12541–12551. doi: 10.1128/JVI.00826-13. [DOI] [PMC free article] [PubMed] [Google Scholar]
- 22.Domingo E, Martin V, Perales C, Grande-Perez A, Garcia-Arriaza J, Arias A. 2006. Viruses as quasispecies: biological implications. Curr Top Microbiol Immunol 299:51–82. [DOI] [PMC free article] [PubMed] [Google Scholar]
- 23.Pawlotsky JM, Germanidis G, Neumann AU, Pellerin M, Frainais PO, Dhumeaux D. 1998. Interferon resistance of hepatitis C virus genotype 1b: relationship to nonstructural 5A gene quasispecies mutations. J Virol 72:2795–2805. [DOI] [PMC free article] [PubMed] [Google Scholar]
- 24.Cabot B, Martell M, Esteban JI, Sauleda S, Otero T, Esteban R, Guardia J, Gomez J. 2000. Nucleotide and amino acid complexity of hepatitis C virus quasispecies in serum and liver. J Virol 74:805–811. doi: 10.1128/JVI.74.2.805-811.2000. [DOI] [PMC free article] [PubMed] [Google Scholar]
- 25.Grande-Perez A, Sierra S, Castro MG, Domingo E, Lowenstein PR. 2002. Molecular indetermination in the transition to error catastrophe: systematic elimination of lymphocytic choriomeningitis virus through mutagenesis does not correlate linearly with large increases in mutant spectrum complexity. Proc Natl Acad Sci U S A 99:12938–12943. doi: 10.1073/pnas.182426999. [DOI] [PMC free article] [PubMed] [Google Scholar]
- 26.Gregori J, Salicru M, Domingo E, Sanchez A, Esteban JI, Rodriguez-Frias F, Quer J. 2014. Inference with viral quasispecies diversity indices: clonal and NGS approaches. Bioinformatics 30:1104–1111. doi: 10.1093/bioinformatics/btt768. [DOI] [PubMed] [Google Scholar]
- 27.Tamura K, Stecher G, Peterson D, Filipski A, Kumar S. 2013. MEGA6: Molecular Evolutionary Genetics Analysis version 6.0. Mol Biol Evol 30:2725–2729. doi: 10.1093/molbev/mst197. [DOI] [PMC free article] [PubMed] [Google Scholar]
- 28.Akuta N, Suzuki F, Sezaki H, Suzuki Y, Hosaka T, Someya T, Kobayashi M, Saitoh S, Watahiki S, Sato J, Matsuda M, Arase Y, Ikeda K, Kumada H. 2005. Association of amino acid substitution pattern in core protein of hepatitis C virus genotype 1b high viral load and non-virological response to interferon-ribavirin combination therapy. Intervirology 48:372–380. doi: 10.1159/000086064. [DOI] [PubMed] [Google Scholar]
- 29.Maekawa S, Sakamoto M, Miura M, Kadokura M, Sueki R, Komase K, Shindo H, Komatsu N, Shindo K, Kanayama A, Ohmori T, Amemiya F, Takano S, Yamaguchi T, Nakayama Y, Kitamura T, Inoue T, Okada S, Enomoto N. 2012. Comprehensive analysis for viral elements and interleukin-28B polymorphisms in response to pegylated interferon plus ribavirin therapy in hepatitis C virus 1B infection. Hepatology 56:1611–1621. doi: 10.1002/hep.25826. [DOI] [PubMed] [Google Scholar]
- 30.Enomoto N, Sakuma I, Asahina Y, Kurosaki M, Murakami T, Yamamoto C, Ogura Y, Izumi N, Marumo F, Sato C. 1996. Mutations in the nonstructural protein 5A gene and response to interferon in patients with chronic hepatitis C virus 1b infection. N Engl J Med 334:77–81. doi: 10.1056/NEJM199601113340203. [DOI] [PubMed] [Google Scholar]
- 31.El-Shamy A, Nagano-Fujii M, Sasase N, Imoto S, Kim SR, Hotta H. 2008. Sequence variation in hepatitis C virus nonstructural protein 5A predicts clinical outcome of pegylated interferon/ribavirin combination therapy. Hepatology 48:38–47. doi: 10.1002/hep.22339. [DOI] [PubMed] [Google Scholar]
- 32.Liu SL, Rodrigo AG, Shankarappa R, Learn GH, Hsu L, Davidov O, Zhao LP, Mullins JI. 1996. HIV quasispecies and resampling. Science 273:415–416. doi: 10.1126/science.273.5274.415. [DOI] [PubMed] [Google Scholar]
- 33.Pawlotsky JM, Germanidis G, Frainais PO, Bouvier M, Soulier A, Pellerin M, Dhumeaux D. 1999. Evolution of the hepatitis C virus second envelope protein hypervariable region in chronically infected patients receiving alpha interferon therapy. J Virol 73:6490–6499. [DOI] [PMC free article] [PubMed] [Google Scholar]
- 34.Polyak SJ, McArdle S, Liu SL, Sullivan DG, Chung M, Hofgartner WT, Carithers RL Jr, McMahon BJ, Mullins JI, Corey L, Gretch DR. 1998. Evolution of hepatitis C virus quasispecies in hypervariable region 1 and the putative interferon sensitivity-determining region during interferon therapy and natural infection. J Virol 72:4288–4296. [DOI] [PMC free article] [PubMed] [Google Scholar]
- 35.Farci P, Strazzera R, Alter HJ, Farci S, Degioannis D, Coiana A, Peddis G, Usai F, Serra G, Chessa L, Diaz G, Balestrieri A, Purcell RH. 2002. Early changes in hepatitis C viral quasispecies during interferon therapy predict the therapeutic outcome. Proc Natl Acad Sci U S A 99:3081–3086. doi: 10.1073/pnas.052712599. [DOI] [PMC free article] [PubMed] [Google Scholar]
- 36.Ge D, Fellay J, Thompson AJ, Simon JS, Shianna KV, Urban TJ, Heinzen EL, Qiu P, Bertelsen AH, Muir AJ, Sulkowski M, McHutchison JG, Goldstein DB. 2009. Genetic variation in IL28B predicts hepatitis C treatment-induced viral clearance. Nature 461:399–401. doi: 10.1038/nature08309. [DOI] [PubMed] [Google Scholar]
- 37.Suppiah V, Moldovan M, Ahlenstiel G, Berg T, Weltman M, Abate ML, Bassendine M, Spengler U, Dore GJ, Powell E, Riordan S, Sheridan D, Smedile A, Fragomeli V, Muller T, Bahlo M, Stewart GJ, Booth DR, George J. 2009. IL28B is associated with response to chronic hepatitis C interferon-alpha and ribavirin therapy. Nat Genet 41:1100–1104. doi: 10.1038/ng.447. [DOI] [PubMed] [Google Scholar]
- 38.Sullivan JC, De Meyer S, Bartels DJ, Dierynck I, Zhang EZ, Spanks J, Tigges AM, Ghys A, Dorrian J, Adda N, Martin EC, Beumont M, Jacobson IM, Sherman KE, Zeuzem S, Picchio G, Kieffer TL. 2013. Evolution of treatment-emergent resistant variants in telaprevir phase 3 clinical trials. Clin Infect Dis 57:221–229. doi: 10.1093/cid/cit226. [DOI] [PubMed] [Google Scholar]
- 39.Sheldon J, Beach NM, Moreno E, Gallego I, Pineiro D, Martinez-Salas E, Gregori J, Quer J, Esteban JI, Rice CM, Domingo E, Perales C. 2014. Increased replicative fitness can lead to decreased drug sensitivity of hepatitis C virus. J Virol 88:12098–12111. doi: 10.1128/JVI.01860-14. [DOI] [PMC free article] [PubMed] [Google Scholar]
Associated Data
This section collects any data citations, data availability statements, or supplementary materials included in this article.