


Abstract
Peroxisome proliferator-activated receptor β/δ (PPARβ/δ) is a lipid ligand-inducible transcription factor with established metabolic functions, whereas its anti-inflammatory function is poorly understood. To address this issue, we determined the global PPARβ/δ-regulated signaling network in human monocyte-derived macrophages. Besides cell type-independent, canonical target genes with metabolic and immune regulatory functions we identified a large number of inflammation-associated NFκB and STAT1 target genes that are repressed by agonists. Accordingly, PPARβ/δ agonists inhibited the expression of multiple pro-inflammatory mediators and induced an anti-inflammatory, IL-4-like morphological phenotype. Surprisingly, bioinformatic analyses also identified immune stimulatory effects. Consistent with this prediction, PPARβ/δ agonists enhanced macrophage survival under hypoxic stress and stimulated CD8+ T cell activation, concomitantly with the repression of immune suppressive target genes and their encoded products CD274 (PD-1 ligand), CD32B (inhibitory Fcγ receptor IIB) and indoleamine 2,3-dioxygenase 1 (IDO-1), as well as a diminished release of the immune suppressive IDO-1 metabolite kynurenine. Comparison with published data revealed a significant overlap of the PPARβ/δ transcriptome with coexpression modules characteristic of both anti-inflammatory and pro-inflammatory cytokines. Our findings indicate that PPARβ/δ agonists induce a unique macrophage activation state with strong anti-inflammatory but also specific immune stimulatory components, pointing to a context-dependent function of PPARβ/δ in immune regulation.
INTRODUCTION
Macrophages display an enormous degree of plasticity and react to their microenvironment by profoundly different phenotypes, with classically activated, pro-inflammatory macrophages [e.g. by tumor necrosis factor-α (TNFα) or interleukin-1β (IL-1β)] and anti-inflammatory macrophages [e.g. by interleukin 4 or 10 (IL-4 or IL-10)] as the extremes, originally designated as M1 and M2 macrophages (1). However, the macrophage phenotype is highly dynamic, depending on the precise environmental cues (2). Consequently, a spectrum of defined activation/polarization states has recently been proposed (3). A protein involved in the regulation of macrophage activation and polarization is the nuclear receptor peroxisome proliferator-activated receptor β/δ (PPARβ/δ). PPARβ/δ is a ligand-inducible transcription factor with established functions in intermediary metabolism and a less well-defined anti-inflammatory role in immune regulation (4–7). Thus, PPARβ/δ deficiency exacerbated the inflammatory response to topical O-tetradecanoylphorbol-13-acetate in mice (8). Furthermore, PPARβ/δ dampened the inflammatory response in a human model of dermal wound healing by stimulating the secretion of IL-1 receptor antagonist in dermal fibroblasts (9). Anti-inflammatory effects of PPARβ/δ agonists have also been observed in mouse models of intestinal inflammation (10) and experimental allergic encephalomyelitis, the latter involving an inhibition of interferon γ (IFNγ) and IL-17 production by Th1 and Th17 cells (11). An anti-inflammatory function of PPARβ/δ in macrophages has been demonstrated in two studies reporting that M2 polarization of murine macrophages in adipose tissue and liver is dependent on the induction of PPARβ/δ expression by IL-4 or IL-13 (12,13). The precise mechanism of anti-inflammatory macrophage polarization by PPARβ/δ remains, however, unclear. Moreover, inconsistent with a purely anti-inflammatory function, PPARβ/δ is overexpressed in human psoriasis (14) and ligand activation induces a proinflammatory psoriasis-like response in a mouse model (15,16), even though the molecular mechanisms underlying the latter observation and its relevance for the human system remain unclear.
PPARβ/δ regulates its direct target genes through binding to PPAR response elements (PPREs) as a heterodimer with a retinoid X receptor (RXR) (17). Genome-wide analyses have identified PPRE-mediated repression as a major mechanism of transcriptional regulation in the absence of a PPARβ/δ agonist and showed that an agonist-mediated switch induces a subset of these genes (18). PPRE-mediated repression is enhanced by inverse agonists, which establish a repressor complex that apparently is different from the unliganded receptor complex (19). Besides this canonical mechanism, agonist-bound PPARβ/δ can also repress genes by interacting with specific transcription factors without establishing direct DNA contact. For example, PPARβ/δ interacts with the p65 subunit of the nuclear factor kappa B (NFκB) dimer in different cell types (14,20,21), PPARβ/δ ligands decrease NFκB activity via crosstalk with other signaling pathways, including ERK in adipocytes (22) and BCL-6 in macrophages (23). BCL-6 is a transcriptional repressor of inflammatory genes, many of which are targets of NFκB (24). Deletion of Ppard or application of a PPARβ/δ ligand abolishes the sequestration of BCL-6 by PPARβ/δ, resulting in the repression of BCL-6 target genes (23).
PPARβ/δ serves as a receptor for a broad range of natural agonists with function in inflammatory processes, including unsaturated fatty acids (25) and 15-hydroxyeicosatetraenoic acid (15-HETE) (26). The function of prostaglandin I2 (prostacyclin) as a PPARβ/δ agonist is controversial (27,28), which might be due to its extreme instability at pH values below 7.8 (29), making the microenvironment an essential determinant in this context. Owing to the association of PPARβ/δ with major human diseases a number of PPARβ/δ-specific agonists have been developed, several of which are well characterized and have been used in numerous preclinical studies (30,31). Furthermore, several synthetic inhibitory ligands for PPARβ/δ have been described over the past years. These include the PPARβ/δ-specific GSK0660 (32) and its improved derivative ST247 (33,34). These ligands inhibit the basal expression of PPARβ/δ target genes by enhancing the recruitment of transcriptional corepressors, classifying them as inverse agonists (33).
To date, genome-wide studies addressing the transcriptional PPARβ/δ signaling network in primary macrophages have not been performed. Recently published transcriptome data for myeloid leukemia THP-1 cells, induced to differentiation toward macrophage-like cells by phorbol ester exposure, do not reflect the situation in normal primary macrophages (35). However, such studies are urgently required to understand the multi-faceted role of PPARβ/δ in immune regulation. In the present study, we applied next-generation sequencing technologies to determine the PPARβ/δ-regulated transcriptome and the PPARβ/δ-RXR cistrome in human monocyte-derived macrophages (MDMs) with the goal to establish the PPARβ/δ-controlled regulatory network in these cells.
MATERIALS AND METHODS
Ligands
L165,041 was purchased from Biozol (Eching, Germany) and GW501516 from Axxora (Lörrach, Germany). ST247 was synthesized as described (33,34). The inverse PPARβ/δ agonist PT-S264 is a novel derivative of ST247 with improved plasma stability (Toth, P.M. et al., submitted for publication). Ligands were used at a concentration of 1 μM in all experiments.
Cell culture
MDA-MB-231 cells were purchased from Caliper Life Science (MDA-MB-231-luc2). WPMY-1 cells were obtained from the ATCC. Cells were maintained in Dulbecco's modified Eagle's medium supplemented with 10% fetal bovine serum, 100 U/ml penicillin and 100 μg/ml streptomycin in a humidified incubator at 37°C and 5% CO2.
Isolation of CD14+ cells
Peripheral blood mononuclear cells were obtained from healthy adult volunteers for MDM stimulation. Mononuclear cells were isolated by Lymphocyte Separation Medium 1077 density gradient centrifugation (PromoCell GmbH, D-69126 Heidelberg, Germany) and further purified by adherent cell positive selection.
Cell culture and cytokine treatment of MDMs
CD14+ monocytes were cultured either in RPMI1640 with 10% fetal calf serum (FCS) (R10 medium) or in serum-free macrophage X-VIVO 10 medium (Biozym Scientific GmbH, Hessisch Oldendorf, Germany; subsequently referred to as XV0 medium). MDMs were differentiated from CD14+ monocytes of healthy volunteers for 5–7 days at 1 × 10⁶ cells/ml. In some experiments MDMs were treated with 20 ng/ml IL-4 (Biozol, Eching, Germany), 100 ng/ml (lipopolysaccharide (LPS); Escherichia coli 0111:b4 L4391; Sigma Aldrich, Steinheim, Germany) or 10 ng/ml IFNγ (Biomol, Hamburg, Germany) during differentiation for 5–7 days. Isolation of murine bone marrow cells (BMCs), differentiation to macrophages (BMDMs) by granulocyte-macrophage colony stimulating factor (GM-CSF) and ligand treatment were carried out as described (36).
Propidium iodide uptake under hypoxia
MDMs were treated with ligands as indicated and kept under 1% oxygen starting directly after isolation of monocytes. Propidium iodide (Sigma Aldrich, Steinheim, Germany) was added to a 1 ml cell suspension containing 1–2 × 10⁶ MDMs to yield a final concentration of 1 μg/ml. Cells were kept at ambient temperature in the dark for 1 h followed by fluorescence-activated cell sorting (FACS) analysis using an FACS Canto cytometer and BD FACSDiva software (BD Biosciences, Heidelberg, Germany).
Phagocytosis assay
Phagocytosis assay was performed with d6 MDMs using 0.5 mg/ml fluorescein isothiocyanate (FITC) dextran (Sigma Aldrich, Steinheim, Germany). Cells were kept under standard culture conditions for 1 h. Negative control cells were incubated for 1 h at 4°C. Following the incubation, cells were washed three times and analyzed by FACS.
FACS phenotyping
Cells were pretreated and stained for macrophage markers as previously described (37). In addition, FITC-labeled anti-human CD86 (Miltenyi Biotech, Bergisch Gladbach, Germany), FITC-labeled anti-CD32A (Clone IV.3, Stemcell Technologies, Cologne, Germany) and allophycocyanin (APC)-labeled anti-CD274 (BD Biosciences) were used. Intracellular staining of permeabilized cells with anti-CD32B (Clone C2C3, Genetex, Irvine, CA, USA) and FITC-labeled secondary antibody (eBioscience, Frankfurt a.M., Germany) was performed as published (37). Isotype control antibodies were purchased from BD Biosciences, Miltenyi Biotech and eBioscience. Cells were analyzed using an FACS Canto cytometer and BD FACSDiva software (BD Biosciences). Results were calculated as mean fluorescence intensities.
T cell activation
For antigen-specific T cell activation, autologous CD14+ monocytes from buffy coats of healthy donors were differentiated to MDMs in the presence of different stimuli for 5–7 days and used as antigen-presenting cells for antigen-specific T cell activation. Eighty thousand MDMs per 96 well culture plate were loaded with 1 μg/ml cytomegalovirus, Epstein-Barr virus, influenza virus and tetanus toxoid (CEFT) peptide pool of 27 peptides (jpt Peptide Technologies, Berlin, Germany) for 24 h (37°C, 5% CO2). After washing with phosphate buffered saline, peptide-pulsed MDMs were cocultured with 4 × 10⁵ autologous lymphocytes (CD14− fraction after MACS selection of buffy coats) at a 5:1 ratio of lymphocytes to MDMs in XV0 medium. MDMs pulsed with dimethylsulfoxide (DMSO; 0.2% final concentration) were used as unstimulated controls for antigen-specific T cell activation. For polyclonal T cell stimulation, 4 × 10⁵ lymphocytes were incubated in 96 well culture plates coated with mouse anti-human CD3 mAb (500 ng/well; clone OKT3, Biolegend, San Diego, CA, USA) in the absence of autologous MDMs. Experimental controls included non-stimulated lymphocytes cultured without anti-CD3 mAb. Polyclonal and peptide-specific T cell stimulation were performed at 37°C and 5% CO2 for a total of 18 h with 5 μg/ml Brefeldin A (Sigma Aldrich, Steinheim, Germany) for the last 16 h. Activated lymphocytes were harvested and stained with surface markers anti-human CD8 APC (Miltenyi Biotec, Bergisch Gladbach, Germany). After permeabilization (BD Cytofix/Cytoperm Kit, BD Bioscience, Heidelberg, Germany) anti-human IFNγ FITC (eBioscience, Frankfurt a.M., Germany) was added according to the manufacturer's instructions. Frequencies of activated T cells were measured by flow cytometry (FACS Canto, BD Bioscience, Heidelberg, Germany) and expressed as IFNγ+/CD8+ cells after subtracting background staining of corresponding non-stimulated controls.
Immunoblotting
Immunoblots were performed according to standard protocols using the following antibodies: α-PPARβ/δ (sc-74517; Santa Cruz, Heidelberg, Germany); α-IDO-1 (MAB10009; Millipore, Darmstadt, Germany), α-LDH (sc-33781; Santa Cruz, Heidelberg, Germany), α-rabbit IgG HRP-linked AB and α-mouse IgG HRP-linked AB (cs7074, cs7076; Cell Signaling, NEB, Frankfurt, Germany). Imaging and quantification was done using the ChemiDoc MP system and Image Lab software version 5 (Bio-Rad, München, Germany).
Kynurenine assay
Kynurenine was measured according to a published procedure (38). Supernatant of MDM cultures (360 μl) was incubated with 180 μl of 30% trichloroacetic acid (TCA) for 30 min at 50°C. After centrifugation at 3000 × g for 10 min, the supernatant was collected, mixed with an equal volume of freshly prepared Ehrlich Reagent (2% p-dimethylaminobenzaldehyde in glacial acetic acid) and incubated for 12–30 min at ambient temperature. The absorbance was measured at 492 nm and compared to a calibration curve obtained with L-kynurenine (Santa Cruz, Heidelberg, Germany).
Reverse transcription quantitative polymerase chain reaction (RT-qPCR)
cDNA isolation and qPCR analyses were performed as described (33). L27 was used for normalization. Primer sequences are listed in Supplementary Table S1.
RNA sequencing
RNA was extracted with TRIfast (Peqlab, Erlangen, Germany) according to the manufacturer's instructions. Genomic DNA was removed by incubation with RNase-free DNase (Macherey-Nagel, Düren, Germany) for 15 min at room temperature. After column-based purification (Qiagen Minelute, Hilden Germany), 0.1–0.5 μg of DNA-depleted RNA was used for library preparation according to the manufacturer's instructions (ScriptSeq Complete Gold Kit, Human/Mouse/Rat-Low Input, Epicentre, Madison, WI, USA) utilizing Qiagen Minelute columns and Beckman Coulter Agencourt AMpure XP beads. Samples were sequenced on an Illumina HiSeq 1500.
Chromatin immunoprecipitation (ChIP) sequencing
ChIP was performed and evaluated as described (18,19) using the following antibodies: IgG pool, I5006 (Sigma-Aldrich, Steinheim, Germany); α-PPARβ/δ, sc-7197; α-RXR, sc-774 (Santa Cruz, Heidelberg, Germany). For precipitation, a mixture of Dynabeads Protein A (10002D) and Dynabeads Protein G (10004D; both from Life Technologies, Carlsbad, CA, USA) was blocked with 1 g/l bovine serum albumin overnight, and 50 μl was used per immunoprecipitation (IP). DNA was purified using Qiagen Minelute columns. Preceding the PE washing step, the membranes were washed twice with pure methanol in order to remove contaminating DNA-binding lipids that inhibit subsequent low-temperature enzymatic modification steps, which we found to be present in samples from primary macrophages. Libraries were synthesized from 1–2 ng of genomic DNA using the MicroPlex kit (Diagenode, Seraing, Belgium). Samples were sequenced on an Illumina Hi-Seq 1500 (Illumina, San Diego, CA, USA).
Mapping of ChIP sequencing reads and peak calling
ChIP sequencing (ChIP-Seq) mapping and peak calling was performed as described (18,19) except that (i) Subread (version 1.4.3-p1) (39) was used for alignment, (ii) reads were filtered to a maximum of five mismatches and five repetitions of each read start site (deduplication) and (iii) updated versions of Ensembl (v74) and MACS (1.4.0rc2 20110214) were employed. The number of usable reads was 46 299 322 (PPARβ/δ), 39 483 674 (RXR) and 42 750 342 (IgG control). Peaks were filtered for at least 15 deduplicated tags, a fold change (FC) over IgG of ≥2 (normalized total read counts) and at most 60 deduplicated IgG tags. Venn diagrams for peak overlaps were calculated by building the interval union and testing each resulting interval for overlaps with the initial peak sets. Genes were associated with peaks based on the closest transcription start site (TSS) from the peak summit and all TSSs within 50 kb of the summit (internal TSSs were considered). A peak could thus be assigned to multiple genes.
RNA sequencing analysis
RNA sequencing (RNA-Seq) data were aligned to Ensembl v74 using STAR (version STAR_2.3.1z13_r470) (40). Gene read counts were established as read count within merged exons of protein coding transcripts (for genes with a protein gene product) or within merged exons of all transcripts (for non-coding genes). FPKM (fragments per kb per million) were calculated based on the total gene read counts and length of merged exons. Raw read counts were quantile normalized within each comparison and logFC values were calculated (after adding 1/60 to the normalized FPKM values to avoid undefined values). Genes were considered regulated if they had a logFC of at least 0.7 (∼1.62-fold), a minimum FPKM of 0.3 in any condition and at least 50 raw reads.
Comparisons with published ChIP-Seq data
For comparison of the PPAR bound gene sets, signal transducer and activator of transcription 1 (STAT1) data were retrieved from (41) and gene IDs updated to Ensembl v74. STAT3 data were retrieved from Supplementary Table S1 in (42), updated to Ensembl v74 and translated from mouse to human via Ensembl Compara. NFκB bound regions (24) were retrieved from Gene Expression Omnibus (GSM61116, GSM61117, union), lifted from mm9 to mm10 using UCSCs liftOver utility and associated with the mouse gene with the closest transcription start site (internal TSSs were considered). Translation to human genes was again by Ensembl Compara. BCL6 bound sites from the same publication (24) (GSE16723, top level data file) were treated identically. P300 associated genes were extracted from (43) (Supplementary Table S1), assigned to mouse stable IDs using the ‘Official Gene Symbol’ column and Ensembl v64, updated to Ensembl v74 and translated to human genes via Ensembl Compara.
Comparisons with published stimulus-specific MDM transcriptomes
Raw microarray data (3) (GSE46903, ‘GSE46903_non-normalized.txt.gz’) quantile normalized using the lumi Bioconductor package annotated using Supplementary Table S1B in (3) were used to calculate logFC values versus basal (M0) condition based on expression values averages within each condition. Only GM-CSF stimulated macrophage samples were analyzed. WGCNA output (49 modules; Supplementary Table S2B in (3)) was translated to Ensembl stable gene IDs using Illumina Human-HT-12_v3 annotation (‘HumanHT-12_V3_0_R3_11283641_A’). Translation was preferentially based on Entrez IDs with gene symbols as a fall back. Overlaps between modules and L165,041 regulated genes were assessed by Fisher's exact test. For Figure 8, a directional score for overlapping genes was calculated as follows: the number of genes regulated in the same direction by L165,041 and a given stimulus minus the number of genes regulated in the opposite direction. Only genes showing an at least 1.5-fold induction by the respective stimulus [3] and 1.62-fold by L165,041 (Supplementary Table S2) were included.
Figure 8.
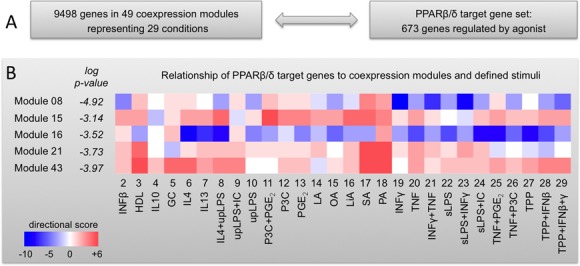
Comparison of the PPARβ/δ transcriptome with a spectrum of defined MDM activation states. (A) Scheme outlining the basis for the comparative analyses. (B) Relationship of PPARβ/δ target genes to expression data obtained with 29 different stimuli grouped into 49 coexpression modules (3). Overlaps between PPARβ/δ target genes and each module were determined by hypergeometric test. Modules yielding P-values <0.001 (modules 8, 15, 16, 21 and 43) were further analyzed by determining for each gene the direction of regulation by L165,041 (Supplementary Table S2) compared to all 29 stimuli (3). Results are displayed for each subset of genes (defined by specific stimulation conditions within individual modules) as a heatmap. The color code is based on a directional score reflecting the number of genes regulated in the same direction (red) or in opposite directions (blue; for details see the Materials and Methods section). GC, glucocorticoid; HDL, high density lipoprotein; IC, immune complexes; LA, lauric acid; LiA, linoleic acid; OA, oleic acid; P3C, Pam3CysSerLys4; PA, palmitic acid; SA, stearic acid; sLPS, standard lipopolysaccharide; TPP, TNFα+PGE2+P3C; upLPS, ultrapure lipopolysaccharide.
Comparison with published genomic PPARβ/δ data for other cell types
For comparisons based on peaks, original sequencing data (18,19) were reanalyzed as described in section ‘Mapping of ChIP-Seq reads and peak calling’. Microarray based transcription assay results were retrieved from supplementary tables of the aforementioned publications and their gene stable IDs updated to the Ensembl revision used. In comparisons depicting both RNA-Seq and microarray data, genes were filtered to those occurring on both microarray chip types used (Agilent-028004 and Agilent-014850).
Databases
All genomic sequence and gene annotation data were retrieved from Ensembl release 74, genome assembly hg19. Our full analysis scripts and computational pipeline are available upon request.
Statistical analysis of experimental data
Data are presented as the average of biological replicates (n ≥ 3; precise numbers for each experiment indicated in the figure legends) ± standard deviations (error bars). Comparative data were statistically analyzed by Student's t-test (two-sided, equal variance) using GraphPad Prism 6.0. Results were expressed as follows: *P < 0.05, **P < 0.01 and ***P < 0.001. When appropriate, correction for multiple hypothesis testing was done by Benjamini–Hochberg adjustment, as indicated.
Functional annotations, networks and pathway analyses
RNA-Seq data were analyzed using the Ingenuity Pathway Analysis (IPA) application and knowledge database (Qiagen Redwood City, CA, USA). The functions ‘Upstream Regulators, Diseases and Bio Functions and Networks’ were applied using the default settings. Results were sorted according to P-value of overlap (minimum 10−5) and activation z-scores (≤−2.0 or ≥+2.0 required).
RESULTS
Induction of PPARβ/δ during differentiation of human monocytes to MDMs
First, we sought to identify an experimental system suitable for studying the PPARβ/δ cistrome and ligand-regulated transcriptome. Human monocytes were differentiated to MDMs in RPMI1640 with 10% FCS medium (R10) and characterized with respect to PPARβ/δ expression and activity. RT-qPCR analysis showed increasing PPARD mRNA levels after initiation of cultures reaching a maximum around day 5 (Figure 1A), which was paralleled by a strong increase in PPARβ/δ protein expression (Figure 1B and Supplementary Figure S1) and ligand inducibility of the well-established target gene PDK4 (Figure 1C), both reaching maximum levels around day 6. Chromatin-bound PPARβ/δ and RXR were detected by ChIP at the PPAR-responsive PDK4 enhancer already on day 0 (monocytes; Figure 1D), which explains the ligand responsiveness of the PDK4 gene at early time points (Figure 1C). Re-ChIP analyses showed that PPARβ/δ and RXR formed complexes on the PDK4 enhancer, as expected (Supplementary Figure S2). The induction of PPARβ/δ expression and activity during differentiation was paralleled by an increased surface expression of the macrophage markers CD32, CD63, CD86, CD206 and HLA-DR and an induction of intracellular CD68 (Supplementary Figure S3). MDMs thus appear to be suitable for investigating effects of PPARβ/δ ligands on macrophage activation and/or polarization, in particular since plastic adherence partially activates monocytes and macrophages (44–48), including increased STAT1 and NFκB signaling (49,50), thus allowing for a potential modulation by agonists or inverse agonists in either direction. We therefore chose day-6 MDMs for the subsequent studies.
Figure 1.
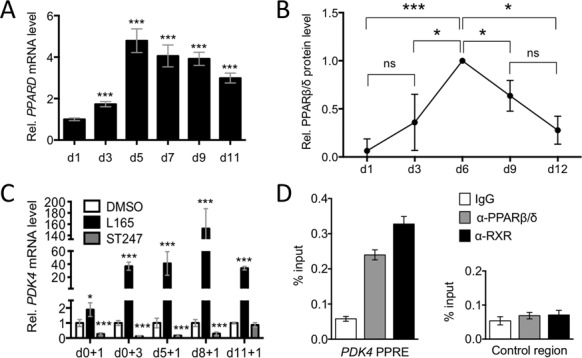
PPARβ/δ expression and activity in differentiating human MDMs. Human monocytes were differentiated in R10 medium for 11 days and analyzed at the indicated times after initiation of differentiation. (A) Expression of PPARD mRNA measured by RT-qPCR relative d1 (sample size = 3). (B) Quantitation of immunoblot analyses of PPARβ/δ protein expression in differentiating MDMs from four different donors relative to LDH (loading control). The individual blots are shown in Supplementary Figure S1. Values were normalized to 1.0 on d6 (maximum expression). (C) Ligand-mediated induction relative to DMSO of PDK4 determined by RT-qPCR. Cells (sample size = 3) were exposed to L165,041 for 1 or 3 days (+1 or +3) at the indicated d (d0, d5, d8, d11). (D) PPARβ/δ and RXR enrichment at the PDK4 enhancer at −12 kb from the transcription start site and an irrelevant control region (Con) in human monocytes (ChIP analysis; sample size = 6). Statistical significance was tested relative to d0 (panel (A)) or DMSO (panel (C)).
The transcriptome of PPARβ/δ ligand-regulated genes in human MDMs
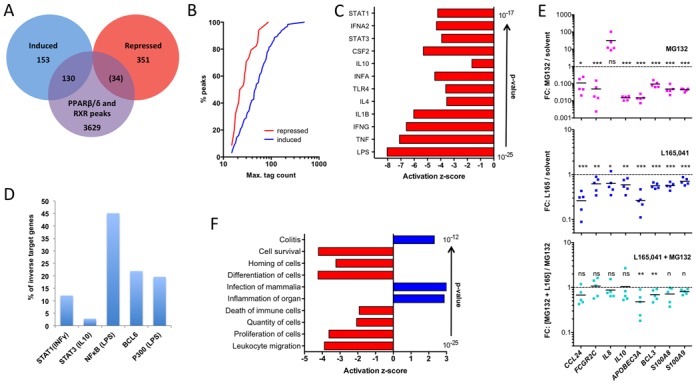
We used this experimental system to identify ligand-responsive genes as well as PPARβ/δ and RXR binding sites in macrophages by deep sequencing technologies. RNA-Seq data obtained with MDMs cultured either in R10 or serum-free synthetic X-VIVO 10 medium (XV0) revealed a total of 285 protein-coding genes upregulated by PPARβ/δ agonist L165,041 and 246 genes downregulated by the inverse agonists ST247 or PT-S264; logFC ≥ 0.7; FPKM ≥ 0.3), 29.6% of the latter (n = 73) overlapping with the agonist-induced gene set (Figure 2A; Supplementary Table S2). Our RNA-Seq also identified a large fraction of genes repressed by the agonist L165,041 (n = 388) and upregulated by the inverse agonist ST247 (n = 174), with 40 genes (10.3%) overlapping (Figure 2B; Supplementary Table S2). Diseases and functions annotation of the L165,041-induced gene set showed a strong association with the inhibition of cell death of immune cells and suppression of immune cell functions, including migration, inflammatory response, activation, homing, adhesion, chemotaxis and phagocytosis (Figure 2C; Supplementary Table S3). The gene set representing inflammation clearly overlapped with cell survival, migration/movement, adhesion and recruitment/infiltration/ chemotaxis (Figure 2D), suggesting that these to a large extent represent genes with functions in immune regulation. Interestingly, ‘Inflammation of intestine’ and ‘Colitis’ showed a positive activation z-score (Figure 2C), providing a first hint that the response to L165,041 may not be strictly anti-inflammatory. Likewise, lipid metabolism (‘Concentration of acylglycerol’) was upregulated, consistent with the known metabolic role of PPARβ/δ. Finally, analysis of the known upstream regulators of these genes (signaling molecules and transcription factors) identified two groups: canonically regulated (L165,041-induced) genes known to be activated by PPAR agonists (pirixinic acid, fibrates, glitazones) were upregulated by L165,041, while genes induced by pro-inflammatory signaling via LPS, TNFα, IFNγ, IL-1β, STAT3 or TLR4 were downregulated (inverse target genes).
Figure 2.
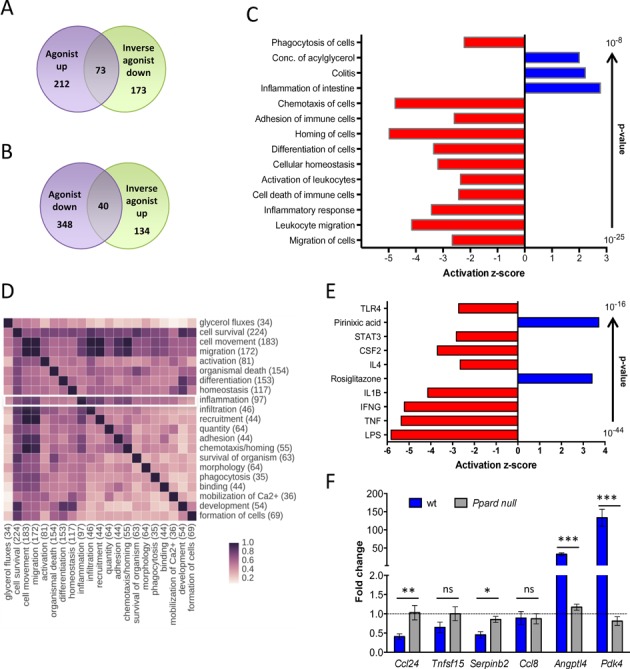
Genome-wide identification of PPARβ/δ target genes in macrophages. (A) Overlap of genes induced by L165,041 and repressed by ST247 or PT-S264 in MDMs cultured for 6 days followed by treatment with DMSO or ligands for 24 h. Data are derived from two independent experiments using either R10 (L165,041, ST247) or XV0 (L165,041, PT-S264) medium. Genes with a logFC > 0.7 in one culture condition, a logFC > 0 in both media, an FPKM ≥ 0.3 and a raw tag count of at least 50 were scored as positive. (B) Overlap of genes repressed by L165,041 and activated by ST247 in MDMs (conditions as in (A)). (C) IPA ‘Diseases and Functions Annotation’ of L165,041-regulated genes (examples of functionally different clusters with low P-values and high z-scores). (D) Overlap of L165,041-regulated genes linked to different functions (according to IPA ‘Diseases and Functions Annotation’; all clusters with n > 30 genes). (E) IPA ‘Upstream Regulator Analysis’ of L165,041-regulated genes (top regulators by P-value). (F) RT-qPCR analysis of target gene regulation by the PPARβ/δ agonist GW501516 in BMDMs from wild-type and Ppard null mice differentiated for 6 days in the presence of GM-CSF (sample size: 3 each). The data show the fold change (mean of triplicates) in response to the ligand relative to solvent treated wild-type and Ppard null control cells.
To rule out the possibility that inverse regulation may be due to PPARβ/δ-independent off-target mechanisms we analyzed the regulation of target genes in bone marrow-derived macrophages (BMDMs) from wild-type and Ppard null mice. As shown in Figure 2F, Ccl24, Tnfsf15 and Serpinb2 were repressed upon agonist treatment specifically in wild-type cells. Two other genes found to be repressed by agonists in human MDMs were not regulated (Ccl8) or not expressed (Enpp2) in murine BMDMs, while the canonical target genes Pdk4 and Angptl4 showed the expected PPARβ/δ-dependent induction. These observations confirm the PPARβ/δ dependence of agonist-mediated regulation, but also point to cell type (BMDM versus MDM) and/or species-specific differences in the regulation of inverse PPARβ/δ target genes.
To gain further insight into the diverse functions and regulatory mechanisms suggested by the data in Figure 1 we separately analyzed canonically regulated and inverse target genes as described in the following.
Canonical PPARβ/δ target genes in MDMs
ChIP-Seq analyses identified 1175 enrichment sites for PPARβ/δ associated with 3798 genes located within a distance of 50 kb, and 27 255 RXR enrichment sites associated with 32 720 genes (Figure 3A and B; Supplementary Tables S4 and S5). The majority of overlapping binding sites occurred at transcription start sites (within 1250 bp, 29.1%), within introns (31.6%) or upstream locations (5000 bp, 5.7%) (Figure 3C). A large fraction of the L165,041-induced genes (n = 132; 46.3%) showed clear enrichment of PPARβ/δ in vivo, and most of these sites (n = 130; 98.5%) were co-occupied by RXR (Figure 3A and B). Another fraction of L165,041-induced genes were occupied by RXR, but enrichment for PPARβ/δ at the same genomic region was less clear or not visible (n = 139; 48.8%; Figure 3A). These include the strongly regulated (Supplementary Figure S4) and established (51) canonical PPARβ/δ target gene ANGPTL4, which shows readily detectable ChIP-Seq peaks in other cell types under identical assay conditions (18,19). This may be due to cell type-specific PPARβ/δ transcription complexes in macrophages that limit accessibility to the antibody. We therefore assume that the presence of RXR on PPREs of L165,041-induced genes indicates canonical PPARβ/δ regulation. This is supported by the results of the upstream regulator analysis of L165,041-induced genes, which identified PPAR ligands and the PPAR coactivator PPARGC1A as the top regulators (nine out of 10; Figure 3D).
Figure 3.
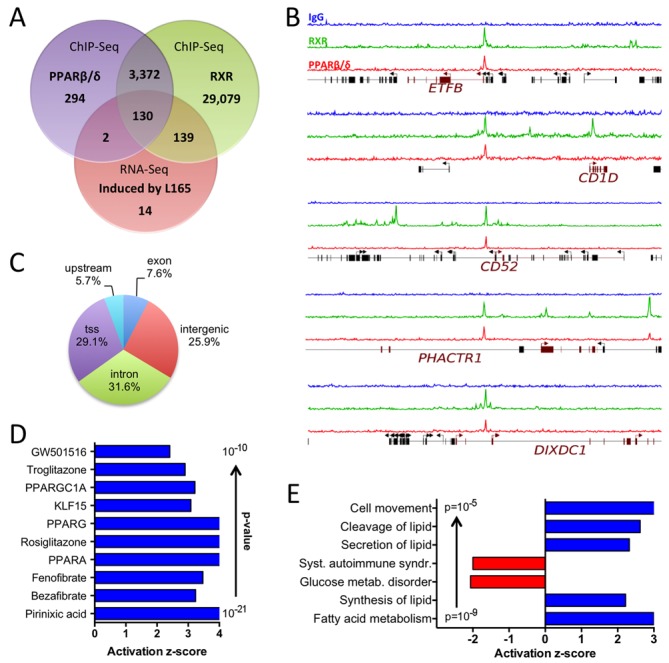
Genome-wide identification of agonist-induced direct PPARβ/δ target genes in MDMs. (A) Overlap of genes associated with PPARβ/δ and RXR binding sites in MDMs (ChIP-Seq; peaks filtered and associated with genes as described in the Materials and Methods section) and L165,041-induced genes (RNA-Seq). (B) Examples of RXR (green) and PPARβ/δ (red) enrichment peaks at novel canonical target genes (ChIP-Seq data). Blue: control IgG. (C) Locations of PPARβ/δ sites identified by ChIP-Seq. tss: within 1250 bp of a transcription start site; upstream: within 5 kb upstream of a transcription start site. (D) IPA ‘Upstream Regulator Analysis’ of L165,041-induced genes (top regulators by P-value). (E) IPA ‘Diseases and Functions Annotation’ of L165,041-induced genes in MDMs.
Diseases and functions annotation of the canonical target genes showed the strongest positive correlation (by P-value) with lipid metabolism (Figure 3E). The identified genes include established PPAR target genes with functions in lipid metabolism, such as ACADVL, ACAA2, ANGPTL4, CAT, CPT1A, FABP4, ECH1, PDK4, SLC25A20 and PLIN2, but also novel target genes, such as ETFB, ETFDH and ISCA1, the products of which play important roles in electron transfer and iron-sulfur cluster assembly, respectively. Other sets of canonical target genes were either positively associated with cell movement or negatively correlated with systemic autoimmune syndrome (Figure 3E). Consistent with this finding, the canonical target gene set encompasses a number of genes with functions in immune regulation, e.g. CD1D, CD36, CD52, CD300A, LRP5, NLRC4 and PHACTR1 (Table 1 and Figure 3B). Several of these examples were validated by RT-qPCR with MDMs from three to seven independent donors (Supplementary Figure S4).
Table 1. Canonical and inverse PPARβ/δ target genes with immune regulatory functions in MDMs (examples).
| Canonical target genes | |
| CD1D | CD1D molecule |
| CD36 | CD36 molecule (thrombospondin receptor) |
| CD52 | CD52 molecule |
| CD300A | CD300a molecule |
| CD300LB | CD300 molecule-like family member b |
| DIXDC1 | DIX domain containing 1 |
| LRP5 | Low density lipoprotein receptor-related protein 5 |
| MME | Membrane metallo-endopeptidase |
| NLRC4 | NLR family, CARD domain containing 4 |
| PHACTR1 | Phosphatase and actin regulator 1 |
| S100Z | S100 calcium binding protein Z |
| SCARB2 | Scavenger receptor class B, member 2 |
| SLAMF9 | SLAM family member 9 |
| ST14 | Suppression of tumorigenicity 14 |
| Inverse target genes | |
| ARG2 | Arginase 2 |
| BCL3 | B-Cell CLL/Lymphoma 3 |
| CASP5 | Caspase 5, apoptosis-related cysteine peptidase |
| CCL13 | Chemokine (C-C motif) ligand 13 |
| CCL24 | Chemokine (C-C motif) ligand 24 |
| CCL8 | Chemokine (C-C motif) ligand 8 |
| CD1A | CD1a molecule |
| CD1B | CD1b molecule |
| CD1E | CD1e molecule |
| CD300E | CD300e molecule |
| CXCL1 | Chemokine (C-X-C motif) ligand 1 |
| CXCL10 | Chemokine (C-X-C motif) ligand 10 |
| CXCL11 | Chemokine (C-X-C motif) ligand 11 |
| CXCL6 | Chemokine (C-X-C motif) ligand 6 |
| CXCL9 | Chemokine (C-X-C motif) ligand 9 |
| FCGR2B | Fc fragment of IgG, low affinity IIb, receptor (CD32B) |
| IDO1 | Indoleamine 2,3-dioxygenase 1 |
| IDO2 | Indoleamine 2,3-dioxygenase 2 |
| IL10 | Interleukin 10 |
| IL8 | Interleukin 8 |
| NLRP12 | NLR family, pyrin domain containing 12 |
| TLR3 | Toll-like receptor |
| TNF | Tumor necrosis factor α |
Inverse PPARβ/δ target genes in MDMs
As described above, our RNA-Seq also identified a large fraction of genes repressed by the agonist L165,041, which we subsequently refer to as ‘inverse target genes’. As shown in Figure 4A, less than 9% of these genes (34 out of 385) harbored a PPARβ/δ-RXR binding site, which almost uniformly showed low enrichment compared to canonical, agonist-induced PPARβ/δ genes (Figure 4B). This could be due to their regulation by a non-canonical mechanism involving indirect chromatin recruitment, but these genomic regions could also be fortuitous non-functional enrichment sites.
Figure 4.
Genome-wide identification of agonist-repressed (inverse) PPARβ/δ target genes. (A) Overlap of genes associated with PPARβ/δ and RXR binding sites in MDMs with L165,041-regulated genes. Number in parentheses indicates low enrichment sites. (B) Cumulative read distribution for all PPARβ/δ binding sites separated into agonist induced and agonist repressed genes. Plotted is the percentage of reads with n or fewer reads in PPARβ/δ ChIP-Seq analyses. (C) IPA ‘Upstream Regulator Analysis’ of L165,041-repressed genes (top regulators by P-value). (D) Percentage of inverse PPARβ/δ target genes in MDMs (this study) with published binding sites (ChIP-Seq) for STAT1 (INFγ induced) (41), STAT3 (IL-10 induced) (42), NFκB-p65 (24), BCL-6 (24) (43) or P300 (LPS-induced). (E) Effect (fold change) of MG132 (10 μM), L165,041 or a combination of both compounds on inverse target genes with ‘bona fide’ NFκB binding sites (24-h treatment) in MDMs from five donors. T-tests of the corresponding groups in the two L165,041 panels against each other showed a statistical significance for CCL24 (P < 0.05). (F) IPA ‘Diseases and Functions Annotation’ of L165,041-repressed genes in MDMs.
Upstream regulator analysis of the inverse target gene set identified exclusively cytokine signaling pathways (12 out of 12) as top regulators (Figure 4C). In agreement with this finding, published binding sites detected by ChIP-Seq for IFNγ-induced STAT1 (41), LPS-induced NFκB-p65 (24), BCL-6 (24) or LPS-induced P300 (43) were found in a substantial fraction of the inverse PPARβ/δ target genes (Figure 4D), with BCL-6 and LPS-induced P300 presumably indicative of NFκB recruitment. These associations suggest that NFκB plays an essential role in the regulation of inverse target genes by PPARβ/δ agonists. RNA-Seq analyses also identified BCL3 as an inverse target gene (Supplementary Table S2). Since BCL-3 can activate transcription via nuclear NFκB complexes (52), its repression by L165,041 potentially contributes to the inhibition of NFκB target genes.
Proteasome inhibitors block the function of NFκB by different mechanisms, including a blockade of IκB degradation or an inhibition of NFκB precursor processing (53). Consistent with the predicted role of NFκB in the regulation of inverse PPARβ/δ target genes, we found that the ‘bona fide’ (24) NFκB target genes APOBEC3A, BCL3, CCL24, FCGR2B, IL10, S100A8 and S100A9 were strongly downregulated by the proteasome inhibitor MG132. The only exception was IL8, which was strongly induced by MG132, indicating a different mechanism of regulation, consistent with published observations (54). A role of NFκB in the agonist-mediated regulation of inverse target genes is supported by our observation that MG132 diminished the magnitude of repression of several of these genes to a statistically not significant level in all cases but APOBEC3A and BCL3. However, repression by L165,041 was not completely abrogated, pointing to the involvement of other signaling pathways.
In contrast to the canonically regulated genes, the inverse target genes are mostly associated with functions in immune regulation as indicated by the diseases and functions annotation in Figure 4F. Strong negative correlations were found for leukocyte migration/movement/homing, proliferation and cell death, indicating an anti-inflammatory and pro-survival agonist effect via inverse target genes. However, positive associations with pro-inflammatory functions were also observed (‘Inflammation of organ’ and ‘Colitis’).
The inverse target genes include cytokines, chemokines and enzymes involved in immune regulation (Table 1). Most of these genes are pro-inflammatory (e.g. IL8), but a small number of immunosuppressive genes are also found among the inverse target genes (e.g. IDO1), consistent with the results of the diseases and functions annotation analysis above.
Functional networks derived from genomic data
In view of the above findings, several functional networks centered on NFκB (or its upstream regulator TNFα) or biological functions relevant to immune regulation were studied in further detail. It is obvious from the pathways depicted in Figure 5 that numerous L165,041-regulated genes impact on various aspects of inflammation and/or immune modulation. Anti-inflammatory, agonist-mediated mechanisms include inhibition of the NALP1 inflammasome through modulation of caspase 5 and multiple members of the NOD-like receptor (NLR) family (Figure 5A), reduced TLR signaling (Figure 5B) and diminished NFκB activation (Figure 5A).
Figure 5.
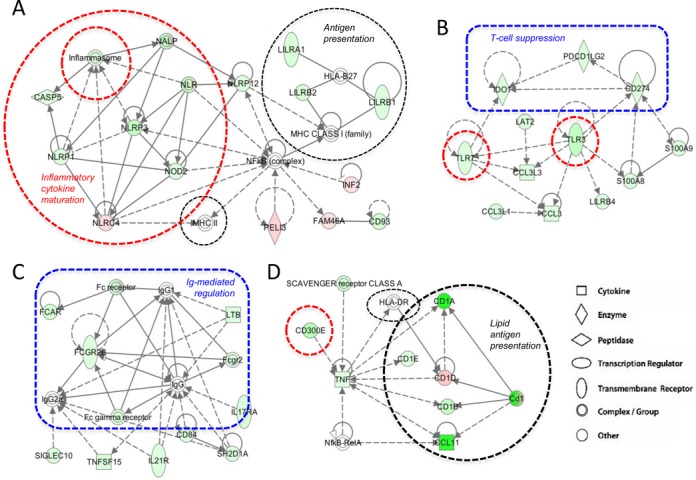
Effects of L165,041 on immune regulatory modules. The scheme displays functional modules derived from the IPA ‘Functional Network Analysis’ (Supplementary Table S6; modules 2, 3, 4 and 10). Pink symbols: genes upregulated by L165,041; green symbols: genes downregulated by L165,041. Dashed lines: indirect effects or interactions. Encircled areas indicate functional units with pro-inflammatory (red), anti-inflammatory (blue) or context-dependent (black) functions.
In contrast, repression of indoleamine 2,3-dioxygenase 1 (encoded by IDO1; Figure 5B), which catabolizes tryptophan to kynurenine, would be predicted to be immune stimulatory, since both tryptophan depletion and kynurenine production have been linked to T cell suppression (55). Moreover, CD274, which codes for the transmembrane glycoprotein PD-L1 (PD-1 ligand; B7-H1) and suppresses T cell proliferation (56), is repressed by PPARβ/δ agonists (Figure 5B). L165,041 also impinges on the regulation of macrophage activity by immunoglobulin binding to Fc receptors (Figure 5C). In this context, repression of the inhibitory FCGR2B gene encoding CD32B is of particular interest and points to another immune stimulatory action of PPARβ/δ agonists.
In addition, different pathways of antigen presentation are modulated by PPARβ/δ agonists. These include both MHCI and MHCII (HLA-DR, HLA-B27) complexes and MHC-like CD1 proteins involved in the presentation of different lipid antigens (57). These are modulated either directly by PPARβ/δ ligands, by ligand-regulated members of the leukocyte immunoglobulin-like receptor (LIR) family and/or by NFκB (Figure 5A and D). As the genes involved are either canonically or inversely regulated by ligands, and their encoded proteins include both inhibitory and stimulatory molecules, the immune modulatory effect of L165,041 on antigen presentation is likely to be context-dependent.
These predictions clearly point to a specific phenotype triggered by PPARβ/δ agonists that includes both positive and negative effects on immune regulation, consistent with the conclusions drawn from the functional annotation analyses above (Figures 2–4).
Ligand-induced anti-inflammatory alterations in human MDMs
To elucidate the phenotypic alterations induced by PPARβ/δ agonists in MDMs we first analyzed potential morphological alterations triggered by the PPARβ/δ agonists during the 6-day differentiation period of MDMs. For comparison, LPS with or without IFNγ (inducing M1 polarization) or IL-4 (triggering M2 polarization) were added to separate cultures. Figure 6A–E shows a clear morphological resemblance between L165,041 (agonist) and IL-4 treated cultures, while PT-S264 (inverse agonist) induced a morphology reminiscent of M1 cells. Very similar results were obtained irrespective of the culture medium (R10 in Figure 6; XV0 medium in Supplementary Figure S5).
Figure 6.
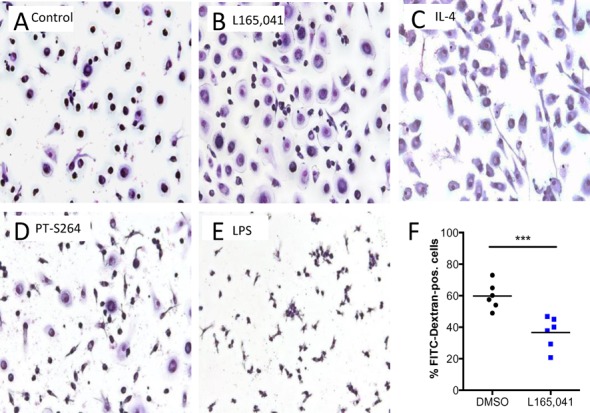
Inhibitory effects of PPARβ/δ ligands on human MDMs. Human monocytes were differentiated in XV0 medium for 6 days in the presence of the indicated additives. Cells were stained with Giemsa dye after treatment with (A) DMSO (solvent control), (B) L165,041 (agonist), (C) IL-4 (‘M2’ macrophages), (D) PT-S264 (inverse agonist) and (E) LPS (‘M1’ macrophages). (F) Effect of L165,041 on FITC-dextran uptake (FACS analysis) by MDMs. Data of six biological replicates with cells from four different donors are shown.
These morphological alterations are in agreement with the observed downregulation of pro-inflammatory genes by L165,041, exemplified by IL8 and CCL24 (Figure 4E), which was confirmed for GW501516 (Supplementary Figure S6). Consistent with this conclusion we also found that L165,041 inhibited phagocytosis. As shown in Figure 6F, L165,041 significantly decreased the macropinocytotic/phagocytotic activity for FITC-dextran upon PPARβ/δ activation in six independent experiments, as determined by the diminished uptake of fluorescent FITC-dextran by MDMs.
Ligand-induced immune stimulatory alterations in human MDMs
The functional networks in Figure 5 also predicted an increased T cell activation by agonist-treated MDMs as antigen-presenting cells. We tested this hypothesis by measuring intracellular IFNγ in CD8+ T cells after coculture with MDMs exposed to an antigen peptide mix (CEFT). Figure 7A shows that L165,041 pretreatment of MDMs (during the 6-day differentiation period) led to a clear increase in the fraction of IFNγ+CD8+ cells with samples from five out of six donors.
Figure 7.
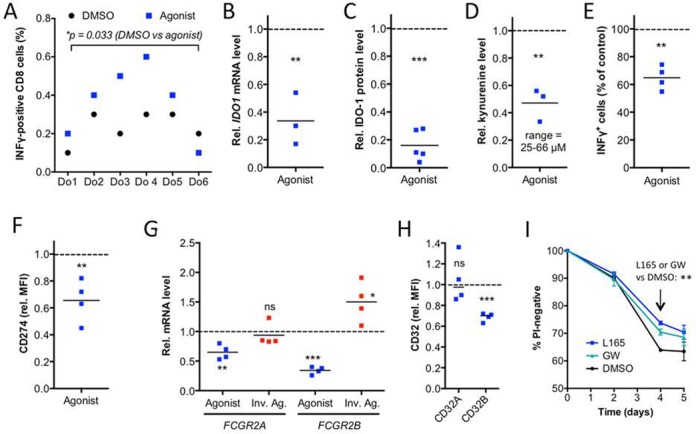
PPARβ/δ ligand-induced immune stimulatory alterations in human MDMs. (A) Effects of L165,041 on T cell activation by the recall antigen peptide mix CEFT. MDMs from six different donors differentiated in the presence of agonist or DMSO (solvent control) were analyzed for their ability to stimulate CEFT-peptide induced INFγ production by co-cultured autologous T cells. The fraction of CD8+IFNγ+ cells was determined by FACS. The experiment was performed with six independent donors (Do1–Do6) showing a CEFT-directed response. (B) RT-qPCR analysis of IDO1 by L165,041 (24 h) in MDMs from three donors relative to DMSO control. Each dot represents the average of technical triplicates. (C) Quantitation of immunoblot analyses of IDO-1 protein expression in L165,041-treated (24 h) MDMs from five different donors relative to DMSO control. Blots are shown in Supplementary Figure S7. (D) Kynurenine production by MDMs from three different donors treated with L165,041 for 24 h relative to DMSO control. (E) Effect of L165,041 on polyclonal T cell activation relative to DMSO control (four different donors). (F) FACS analysis of CD274 expression on MDMs treated with L165,041 or solvent (DMSO) during differentiation (four different donors). (G) RT-qPCR analysis of FCGR2A and FCGR2B expression on MDMs treated with L165,041 or ST247 during differentiation relative to DMSO control (four donors as in (F)). (H) FACS analysis of CD32A and CD32B, conditions as in (F). (I) Effect of PPARβ/δ ligands on the time course of hypoxia-induced cell death. MDMs were cultured in XV0 medium at <1% oxygen for up to 5 days in the presence or absence of L165,041 or GW501516 and analyzed for propidium (PI) uptake by flow cytometry. Data represent the mean of three biological replicates with cells from different donors. Horizontal lines in panels (B–H) and error bars in panel (I) indicate the average.
The product of the inverse PPARβ/δ target gene IDO1, which suppresses T cell activation via the production of kynurenine (55), may be involved in this effect. As shown in Figure 7, the agonist-mediated transcriptional repression of IDO1 (Figure 7B) was paralleled by a decreased protein level (Figure 7C; Supplementary Figure S7) and a clearly diminished release of kynurenine into the supernatant of MDM cultures (Figure 7D). Importantly, the level of kynurenine produced under these conditions was sufficient to significantly inhibit polyclonal (CD3 antibody-mediated) T cell activation (Figure 7E).
Another potentially important player in this scenario is the CD274 gene. Figure 7F shows that the inverse regulation of CD274 resulted in a reduced surface expression of its encoded product, the PD-1 ligand, a key regulator of an inhibitory T cell checkpoint (56). The agonist-mediated inhibition of kynurenine production may thus cooperate with downregulation of PD-1 ligand expression to stimulate T cell activation.
Our bioinformatic analyses also pointed to immune stimulatory effects via the agonist-mediated repression of the FCGR2B gene. FCGR2B codes for CD32B, a low affinity Fcγ receptor that inhibits the phagocytosis of opsonized antigens (58). In contrast to FCGR2B, FCGR2A was only weakly repressed by L165,041 and not significantly affected by the inverse agonists ST247 (Figure 7G). FCGR2B repression led to downregulation of CD32B protein as determined by flow cytometry (Figure 7H). FCGR2B thus represents a PPARβ/δ target gene potentially mediating an agonist-triggered immune stimulatory event.
The functional annotation and networks analysis (Figure 2C; Supplementary Table S3) also predicted an inhibition of cell death of immune cells by L165,041 (Figure 2C), which could be relevant under the stressful conditions of inflammation. We therefore tested this prediction in the context of hypoxia and found a clear pro-survival effect of L165,041, while PT-S264 exacerbated hypoxia-induced cell death, as indicated by the fraction of healthy cells and cell debris in Supplementary Figure S8A. A similar effect was seen in MMT-based viability assays of the adherent cell fraction (Supplementary Figure S8B). Propidium iodide uptake assays showed a time-dependent pro-survival effect of both PPARβ/δ agonists tested (L165,041, GW501516) peaking on day 4 (Figure 7I). As MDMs do not proliferate under the culture conditions used here, a ligand effect on proliferation could not contribute to these observations.
Finally, time-lapse video microscopy revealed a slight, but statistically significant inhibitory effect of L165,041 on the motility of MDMs (Supplementary Figure S9), as predicted by the functional annotation analysis in Figure 2C.
Comparison of the PPARβ/δ agonist-induced transcriptome with defined MDM activation states
A recent study (3) defined a spectrum of macrophage activation/polarization states extending the M1/M2-model based on microarray data derived from MDMs exposed to an array of different stimuli (28 plus baseline). In an attempt to define the PPARβ/δ agonist-induced MDM phenotype more precisely we compared the L165,041-induced transcriptome to the 143 comparable microarray data sets provided by the quoted study (3), as outlined in Figure 8A. Toward this end, we first identified overlaps between the PPARβ/δ target gene set and the 49 modules representing coregulated gene sets as defined by Xue et al. (3). Five modules yielding P-value <0.001 by hypergeometric test were identified and further analyzed (modules 8, 15, 16, 21 and 43; Figure 8B). For each gene in the overlap between a module and the L165,041 regulated set, we determined the direction of regulation by L165,041 (as in Supplementary Table S2) and the 28 non-baseline stimuli. The heatmap in Figure 8B represents gene subsets regulated in the same or opposite direction in red and blue, respectively. It is evident that for most stimulation conditions the five module-specific subsets show divergent directions of regulation. For instance, the classical inducers of alternative macrophage polarization (M2), IL-4 and IL-13, regulate genes in modules 15 and 43 in the same direction as L165,041, but in the opposite direction in module 16. Pro-inflammatory stimuli, like TNFα, IFNγ and LPS (stimulation conditions 10, 19–29), predominantly yield opposite patterns (modules 8 and 16), but also show a weak coordinate regulation within modules 15 and 43, consistent with a predominantly, but not exclusive anti-inflammatory effect exerted by L165,041. On the other hand, lipid-triggered (conditions 14–18) and agonist-induced patterns are similar in modules 15, 21 and 43. These data are in good agreement with our conclusion that PPARβ/δ induces a unique activation phenotype with components of anti-inflammatory, pro-inflammatory and fatty acid-mediated activation states.
Common and cell type-specific PPARβ/δ target genes
Finally, we compared the PPARβ/δ cistrome and the ligand-responsive transcriptome with those obtained with the human myofibroblastic cell line WPMY-1 (18) and the human breast cancer cell line MDA-MB-231 (19). The Venn diagrams in Figure 9A indicate a clear overlap of genes with PPARβ/δ binding sites in all three cell types (n = 129; Supplementary Table S7). Diseases and functions annotation revealed a statistically highly significant overlap with energy production and lipid metabolism (P = 4.3 × 10⁻⁹). In contrast, there was no inverse target gene common to all three cell types (Figure 9B). Our genomic studies in conjunction with the RT-qPCR analyses thus led to three conclusions: (i) a subgroup of canonical target genes are common target genes, including those with functions in intermediary metabolism (Figure 9A); (ii) another subgroup of canonical target genes are cell type-specific, such as CD52 and LRP5, which are ligand-responsive only in MDMs (Supplementary Figure S4 and Supplementary Table S2) compared to WPMY-1 and MDA-MB-231 cells (Figure 9C); and (iii) inverse target genes, such as IDO1 and IL8, are not regulated in WPMY1 and MDA-MB-231 cells (Figure 9C) as opposed to the clear ligand regulation in MDMs (Figures 4E and 7B; Supplementary Table S2).
Figure 9.
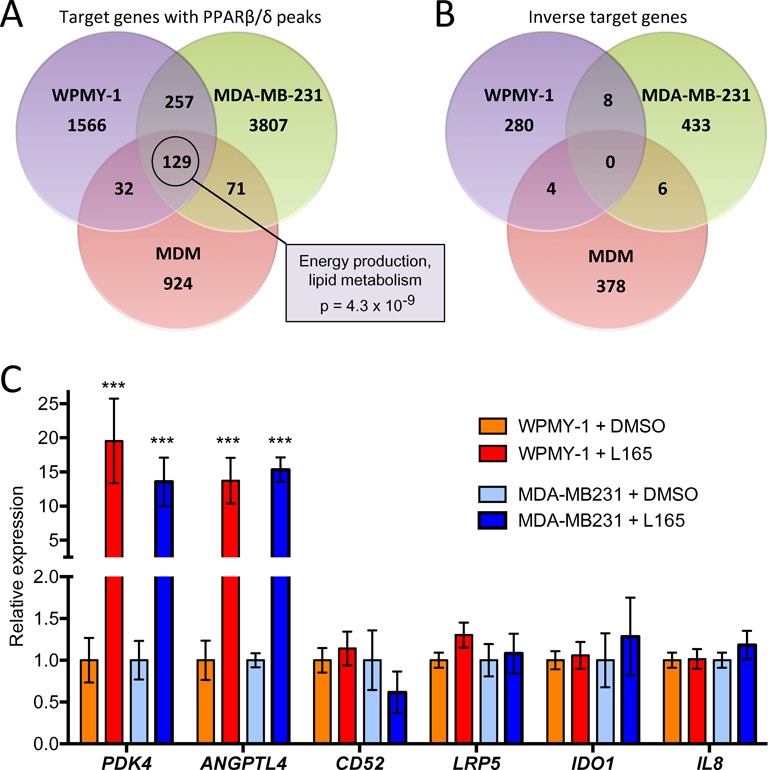
Identification of common and cell type-specific PPARβ/δ target genes. (A) Overlap of PPARβ/δ binding sites in WPMY-1 myofibroblast-like cells, MDA-MB-231 breast cancer cells and MDMs. Common target genes (n = 129) were analyzed by IPA Diseases and Functions Annotation. The box shows the top term by p-value of overlap. (B) Overlap of agonist-repressed genes. (C) RT-qPCR validation of common and macrophage-specific PPARβ/δ target genes in WPMY-1 and MDA-MB-231 cells. Values were normalized to 1 for untreated cells (solvent only) individually for each gene and cell line. Statistical significance was tested relative to DMSO-treated cells.
DISCUSSION
Our data show that PPARβ/δ target genes in normal macrophages (MDMs) fall into two major classes. The first class represents canonical genes with PPARβ/δ–RXR binding sites (PPREs), induced by agonists and repressed by inverse agonists. The second class is composed of genes lacking direct PPARβ/δ contact sites that are repressed by agonists, which we have termed inverse regulation. Importantly, inverse regulation was also seen in murine BMDMs for several target genes, and was impaired in cells with disrupted Ppard alleles, unequivocally demonstrating the dependence of non-canonical, ligand-mediated repression on functional PPARβ/δ. Clear evidence for the high selectivity of one of the ligands (GW501516) used in our study is also provided by published microarray data (36) obtained with differentiating murine BMCs, as depicted in the evaluation in Supplementary Figure S10.
Canonical and inverse target genes
A considerable fraction of canonical PPARβ/δ target genes have roles in lipid metabolism shared with other cell types. These include the known PPAR target genes with functions in fatty acid oxidation (ACADVL, ACAA2, CAT, CPT1A, ECH1, PDK4, SLC25A20) or other aspects of lipid metabolism (ANGPTL4, FABP4, PLIN2), but also genes not previously described as PPARβ/δ targets, such as ETFDH and ISCA1. Another large fraction of direct PPARβ/δ target genes are associated with non-metabolic functions, in particular immune regulation, such as CD300A, CD52, LRP5, NLRC4 and PHACTR1, and most of these genes are cell type-selective with respect to agonist-mediated regulation.
In contrast, inverse target genes are almost exclusively regulated by PPARβ/δ ligands in a cell type-specific fashion, at least for the three cell types analyzed, i.e. macrophages, myofibroblastic cells and breast cancer cells. Consistent with this finding, a large fraction of these genes are associated with pro-inflammatory functions exerted by macrophages, including immune cell activation, migration, chemotaxis and cellular survival, exemplified by a number of cytokine and chemokine genes (e.g. IL8, CCL24). However, several inverse target genes have immune suppressive rather than pro-inflammatory functions, for example IDO1, CD274 (PD-1L) and CD32B, which play essential roles in the inhibition of T cell activation. This data strongly suggested that the response to PPARβ/δ agonists is mainly anti-inflammatory, but also has immune stimulatory components.
Bioinformatic analyses showed that many of the inverse target genes are controlled by NFκB and STAT1 signaling pathways. This finding is consistent with the reported upregulation of inflammatory signaling through these pathways in adherent monocytic cells (49,50), which apparently is attenuated by PPARβ/δ agonists. PPARβ/δ has been reported to impinge on NFκB signaling by physically and/or functionally interacting with p65 in endothelial cells, cardiomyocytes, smooth muscle cells and keratinocytes (14,20,59,60) or though ERK1/2 signaling in adipocytes (22). However, in most cases the precise underlying mechanisms are not entirely clear. In mouse macrophages, a cell type selective mechanism involving the transcriptional repressor BCL-6 has been identified (23). BCL-6 is a repressor of NFκB target genes, which is sequestered by PPARβ/δ in the absence of PPARβ/δ agonists.
Our own data are consistent with the conclusion that PPARβ/δ agonists repress a subset of NFκB-regulated genes in macrophages, based on the observation that MG132 diminished the L165,041 effect on several NFκB target genes previously identified by ChIP-Seq in mouse macrophages (24). This effect of MG132 is presumably due to the inhibition of IκB degradation or a blockade of proteasome-dependent processing of p105 to p50 (53). Both effects would lead to the loss of regulation by NFκB and agonist-mediated regulation, as observed in our experiments, independent of a potential role of BCL-6 and/or other signaling pathways impinging on NFκB regulation. Obviously, proteasome inhibitors also target numerous other signaling pathways and transcription factors that might contribute to the observed effect, as exemplified by IL8, which has been suggested to be induced by proteasome inhibitors via reactive oxygen-mediated AP-1 activation (54).
The involvement of PPARβ/δ in modulating STAT activity is even less understood with all published evidence restricted to STAT3 (61–64). The identification of strongly regulated inverse target genes in the present study paves the way for addressing these open questions using individual genes as experimental models and for elucidating the mechanisms underlying the crosstalk between PPARβ/δ and pro-inflammatory signaling cascades.
Effects of PPARβ/δ agonists on inflammatory pathways
‘Functional Annotation and Networks Analysis’ indicated that inflammatory signaling is targeted by PPARβ/δ agonists at two different levels. First, several genes encoding pro-inflammatory cytokines (e.g.IL8, IFNG) and chemokines (e.g. CCL3/MIP1A, CCL8/MCP2, CCL11/eotaxin, CCL13/MCP4) are downregulated as inverse target genes with predicted anti-inflammatory effects. In addition, a few anti-inflammatory cytokine genes (e.g. IL10, IL13) are similarly affected, suggesting that agonist effects on immune cells are not exclusively inhibitory. Second, our RNA-Seq analyses identified several key components of NALP inflammasomes as novel PPARβ/δ targets (Figure 5C). These include the canonical target gene NLR4C and the inverse target genes NLRP1, NLRP3 and CASP5. NLR family proteins act as a sensor of pathogenic signals and promotes inflammasome assembly, leading to caspase-1 activation and inflammatory cytokine (IL-1β, IL-18) production (65). NLR4C encoded CARD12 is activated by microbial proteinaceous ligands, while NLRP1 recognizes muramyl dipeptide and diverse stimuli (e.g. crystalline material, peptide aggregates, bacterial toxins) can trigger NLRP3 activation (65). Non-canonical inflammasome activation by Gram-negative bacteria can involve the additional recruitment of caspase 5, encoded by another inverse PPARβ/δ target gene. Taken together, these findings indicate that PPARβ/δ agonists can have pro- and anti-inflammatory effects on specific inflammasome functions and suggest that the precise outcome is stimulus-dependent.
Our data confirm and extend a previous study identifying CD300A as a PPARβ/δ target gene in macrophage-like cells derived from the human leukemia cell line THP-1 (35). In mice, disruption of the Cd300a gene resulted in pro-inflammatory activation of peritoneal macrophages, identifying CD300a-mediated inhibitory signaling in macrophages as a critical regulator of intestinal immune homeostasis (35). CD300E, coding for an activating CD300 subtype, is repressed by L165,041 (Figure 5D) simultaneously with the induction of the inhibitory CD300A gene, consistent with an immunosuppressive agonist function via regulation of CD300 family members.
We also identified PHACTR1 as a novel canonical PPARβ/δ target gene. This gene encodes phosphatase and actin regulator 1, which is involved in the G-actin mediated control of actomyosin assembly (66) and may thus play a role in modulating macrophage migration and phagocytosis. However, the agonist-mediated induction of PHACTR1 appears to be inconsistent with the observed inhibition of phagocytosis/macropinocytosis of FITC-dextran, suggesting that other genes contribute to this effect. An example is DIXDC1, another canonical PPARβ/δ target gene implicated in cell migration by modulating the WNT and PI3K signaling pathways (67,68).
Immune stimulatory effects of PPARβ/δ agonists
As shown by our functional studies, PPARβ/δ agonists stimulate CD8+ T cell activation. Based on our bioinformatic analyses at least two mechanisms may be involved in this effect, i.e. the IDO-1 mediated catabolism of tryptophan and synthesis of PD-1 ligand (CD274). The inhibitory effect of agonists on CD274 and IDO1 transcription resulted in a decreased expression of both proteins and synthesis of the IDO-1 product kynurenine. The latter is a known suppressor of T cell activation (55), which we confirmed for the concentrations achieved in our experimental system. Repression of CD274 by PPARβ/δ agonist has previously also been described for human myofibroblastic cells (69), emphasizing the potential relevance of this regulatory effect of PPARβ/δ. CD274/PD-L1 engagement of the PD-1 receptor on T cells activates a key checkpoint restraining T cell activation (56), which constitutes a key component of immune suppression in the tumor microenvironment. We also found several genes with functions in antigen presentation to be modulated by PPARβ/δ agonists. Whether these changes play a role in the observed stimulation of T cell activation remains to be investigated.
Pro-survival effects of PPARβ/δ agonists
Another clear biological effect of PPARβ/δ agonists is the suppression of macrophage cell death under hypoxia, which is frequently associated with inflammation (70) and imposes environmental stress on the resident inflammatory cells. This biological effect of PPARβ/δ agonists is mirrored by the observed changes in gene expression. Thus, several transcription factor genes with death promoting functions (e.g. ID3 and MYC) are downregulated by agonists, while genes with pro-survival effects are upregulated (e.g. EGR3 and VDR). Our functional annotation analyses also showed a strong overlap of PPARβ/δ target genes associated with the inhibition of inflammation and cell survival, suggesting a functional link. This group indeed harbors a number of inverse target genes with both pro-inflammatory and death-promoting functions, for example the cytokines TNFα and IL-1β. In these cases, the downregulation of the same genes by PPARβ/δ agonist may thus contribute to both an attenuation of the inflammatory response and a promotion of cell survival.
A specific macrophage activation state induced by PPARβ/δ agonists
The bioinformatic analyses and biological data described above clearly indicate that PPARβ/δ agonists have a predominantly, but not exclusively, anti-inflammatory effect on MDMs. A recent study (3) reporting the transcriptomes for MDMs exposed to 28 different stimuli provided a resource to characterize the phenotype of agonist-stimulated MDMs in further detail. The authors used these data to define 49 modules of coregulated genes and determined the extent to which each of these modules was associated with the different stimulation conditions, resulting in the development of a spectrum model of macrophage activation. Comparison of these modules with the transcriptomes of L165,041-stimulated cells unraveled highly significant overlaps with activation states triggered by IL-4/IL13, TNFα/INFγ and fatty acids. These observations clearly confirm the hypothesis that PPARβ/δ induces a unique activation phenotype with components of anti-inflammatory, immune stimulatory and lipid-triggered activation states.
CONCLUSIONS
Numerous literature reports have documented an anti-inflammatory effect of PPARβ/δ agonists with few discrepant findings. However, the molecular mechanisms underlying the regulation of immune cells by PPARβ/δ are only partially understood. In the present study, we have determined the PPARβ/δ transcriptome and PPARβ/δ-RXR cistrome in human MDMs to establish the global PPARβ/δ-regulated signaling network in human macrophages. This study showed that genes with immune regulatory functions are regulated by PPARβ/δ agonists in a macrophage-selective fashion by at least two mechanisms: (i) canonical regulation, analogous to ubiquitous PPARβ/δ target genes with metabolic functions, which involves transcriptional induction by agonists and direct DNA contacts of PPARβ/δ-RXR heterodimers, and (ii) repression by agonists (inverse regulation) in the absence of PPARβ/δ DNA binding. The latter mechanism affects to a large extent NFκB and STAT1 target genes, resulting in the inhibition of multiple pro-inflammatory mediators in line with the known anti-inflammatory effect of PPARβ/δ activation. However, consistent with the results of different bioinformatic approaches, we also identified specific immune stimulatory effects exerted by PPARβ/δ agonists. Besides a pro-survival effect on macrophages and inhibition of CD32B surface expression, the most prominent example in this context is the stimulation of T cell activation. The latter is presumably linked to the repression of the CD274 and IDO1 genes, resulting in a diminished surface expression of PD-1 ligand and a decreased production of the immune suppressive kynurenine. Consistent with these observations, the PPARβ/δ agonist-regulated transcriptome shows a significant overlap with coexpression modules triggered by either the anti-inflammatory IL-4 and IL-13 cytokines or the pro-inflammatory mediators TNFα and IFNγ. These findings clearly indicate that PPARβ/δ agonists induce a novel and unique macrophage activation state with strong anti-inflammatory but also specific immune stimulatory components. Collectively, these findings suggest that contrary to the prevailing opinion PPARβ/δ exerts context-dependent rather than merely inhibitory functions in immune regulation.
It is obviously of great interest to analyze the effects of PPARβ/δ ligands on macrophages in the context of other immune cells in vivo. However, the identification of a mouse model suitable to recapitulate the global role of PPARβ/δ in the human immune system is associated with problems that cannot easily be solved, if at all. Thus, as suggested by our own data obtained with murine BMCs, murine BMDMs and human MDMs, the effect of PPARβ/δ ligands on the transcriptome of myeloid cells appears to be influenced by their differentiation and/or activation state, and perhaps also by species-specific effects. This suggests that data obtained with human MDMs may not be easily transferable to a mouse model. Testing the relevance of our findings in a physiological setting therefore remains a major challenge of future studies.
ACCESSION NUMBERS
RNA-Seq and ChIP-Seq data sets have been deposited at EBI ArrayExpress under accession numbers E-MTAB-3114 and E-MTAB-3113, respectively.
SUPPLEMENTARY DATA
Supplementary Data are available at NAR Online.
Acknowledgments
We are grateful to Dr Robert Geffers (Helmholtz-Zentrum für Infektionsforschung, Braunschweig, Germany) for valuable discussions on ChIP-Seq library synthesis. We thank Margitta Alt, Traute Plaum and Achim Allmeroth for expert technical assistance.
FUNDING
The Deutsche Forschungsgemeinschaft [MU601/13 to R.M.]; the Wilhelm-Sander-Stiftung [to S.M.B. and S.R.]; the Universitätsklinikum Giessen-Marburg [to T.A. and S.R.].
Conflict of interest statement. None declared.
REFERENCES
- 1.Sica A., Mantovani A. Macrophage plasticity and polarization: in vivo veritas. J. Clin. Invest. 2012;122:787–795. doi: 10.1172/JCI59643. [DOI] [PMC free article] [PubMed] [Google Scholar]
- 2.Martinez F.O., Gordon S. The M1 and M2 paradigm of macrophage activation: time for reassessment. F1000Prime Rep. 2014;6:13. doi: 10.12703/P6-13. [DOI] [PMC free article] [PubMed] [Google Scholar]
- 3.Xue J., Schmidt S.V., Sander J., Draffehn A., Krebs W., Quester I., De Nardo D., Gohel T.D., Emde M., Schmidleithner L., et al. Transcriptome-based network analysis reveals a spectrum model of human macrophage activation. Immunity. 2014;40:274–288. doi: 10.1016/j.immuni.2014.01.006. [DOI] [PMC free article] [PubMed] [Google Scholar]
- 4.Kostadinova R., Wahli W., Michalik L. PPARs in diseases: control mechanisms of inflammation. Curr. Med. Chem. 2005;12:2995–3009. doi: 10.2174/092986705774462905. [DOI] [PubMed] [Google Scholar]
- 5.Yang Y., Lovett-Racke A.E., Racke M.K. Regulation of immune responses and autoimmune encephalomyelitis by PPARs. PPAR Res. 2010;2010:104705. doi: 10.1155/2010/104705. [DOI] [PMC free article] [PubMed] [Google Scholar]
- 6.Wahli W., Michalik L. PPARs at the crossroads of lipid signaling and inflammation. Trends Endocrinol. Metab. 2012;23:351–363. doi: 10.1016/j.tem.2012.05.001. [DOI] [PubMed] [Google Scholar]
- 7.Michalik L., Wahli W. PPARs mediate lipid signaling in inflammation and cancer. PPAR Res. 2008;2008:134059. doi: 10.1155/2008/134059. [DOI] [PMC free article] [PubMed] [Google Scholar]
- 8.Peters J.M., Lee S.S., Li W., Ward J.M., Gavrilova O., Everett C., Reitman M.L., Hudson L.D., Gonzalez F.J. Growth, adipose, brain, and skin alterations resulting from targeted disruption of the mouse peroxisome proliferator-activated receptor beta(delta) Mol. Cell. Biol. 2000;20:5119–5128. doi: 10.1128/mcb.20.14.5119-5128.2000. [DOI] [PMC free article] [PubMed] [Google Scholar]
- 9.Chong H.C., Tan M.J., Philippe V., Tan S.H., Tan C.K., Ku C.W., Goh Y.Y., Wahli W., Michalik L., Tan N.S. Regulation of epithelial-mesenchymal IL-1 signaling by PPARbeta/delta is essential for skin homeostasis and wound healing. J. Cell Biol. 2009;184:817–831. doi: 10.1083/jcb.200809028. [DOI] [PMC free article] [PubMed] [Google Scholar]
- 10.Bassaganya-Riera J., DiGuardo M., Climent M., Vives C., Carbo A., Jouni Z.E., Einerhand A.W., O'Shea M., Hontecillas R. Activation of PPARgamma and delta by dietary punicic acid ameliorates intestinal inflammation in mice. Br. J. Nutr. 2011;106:878–886. doi: 10.1017/S0007114511001188. [DOI] [PubMed] [Google Scholar]
- 11.Kanakasabai S., Chearwae W., Walline C.C., Iams W., Adams S.M., Bright J.J. Peroxisome proliferator-activated receptor delta agonists inhibit T helper type 1 (Th1) and Th17 responses in experimental allergic encephalomyelitis. Immunology. 2010;130:572–588. doi: 10.1111/j.1365-2567.2010.03261.x. [DOI] [PMC free article] [PubMed] [Google Scholar]
- 12.Kang K., Reilly S.M., Karabacak V., Gangl M.R., Fitzgerald K., Hatano B., Lee C.H. Adipocyte-derived Th2 cytokines and myeloid PPARdelta regulate macrophage polarization and insulin sensitivity. Cell Metab. 2008;7:485–495. doi: 10.1016/j.cmet.2008.04.002. [DOI] [PMC free article] [PubMed] [Google Scholar]
- 13.Odegaard J.I., Ricardo-Gonzalez R.R., Red Eagle A., Vats D., Morel C.R., Goforth M.H., Subramanian V., Mukundan L., Ferrante A.W., Chawla A. Alternative M2 activation of Kupffer cells by PPARdelta ameliorates obesity-induced insulin resistance. Cell Metab. 2008;7:496–507. doi: 10.1016/j.cmet.2008.04.003. [DOI] [PMC free article] [PubMed] [Google Scholar]
- 14.Westergaard M., Henningsen J., Johansen C., Rasmussen S., Svendsen M.L., Jensen U.B., Schroder H.D., Staels B., Iversen L., Bolund L., et al. Expression and localization of peroxisome proliferator-activated receptors and nuclear factor kappaB in normal and lesional psoriatic skin. J. Invest. Dermatol. 2003;121:1104–1117. doi: 10.1046/j.1523-1747.2003.12536.x. [DOI] [PubMed] [Google Scholar]
- 15.Romanowska M., Reilly L., Palmer C.N., Gustafsson M.C., Foerster J. Activation of PPARbeta/delta causes a psoriasis-like skin disease in vivo. PLoS One. 2010;5:e9701. doi: 10.1371/journal.pone.0009701. [DOI] [PMC free article] [PubMed] [Google Scholar]
- 16.Hack K., Reilly L., Palmer C., Read K.D., Norval S., Kime R., Booth K., Foerster J. Skin-targeted inhibition of PPAR beta/delta by selective antagonists to treat PPAR beta/delta - mediated psoriasis-like skin sisease in vivo. PLoS One. 2012;7:e37097. doi: 10.1371/journal.pone.0037097. [DOI] [PMC free article] [PubMed] [Google Scholar]
- 17.Peters J.M., Shah Y.M., Gonzalez F.J. The role of peroxisome proliferator-activated receptors in carcinogenesis and chemoprevention. Nat. Rev. Cancer. 2012;12:181–195. doi: 10.1038/nrc3214. [DOI] [PMC free article] [PubMed] [Google Scholar]
- 18.Adhikary T., Kaddatz K., Finkernagel F., Schönbauer A., Meissner W., Scharfe M., Jarek M., Blöcker H., Müller-Brüsselbach S., Müller R. Genomewide analyses define different modes of transcriptional regulation by peroxisome proliferator-activated receptor-beta/delta (PPARbeta/delta) PLoS One. 2011;6:e16344. doi: 10.1371/journal.pone.0016344. [DOI] [PMC free article] [PubMed] [Google Scholar]
- 19.Adhikary T., Brandt D.T., Kaddatz K., Stockert J., Naruhn S., Meissner W., Finkernagel F., Obert J., Lieber S., Scharfe M., et al. Inverse PPARbeta/delta agonists suppress oncogenic signaling to the ANGPTL4 gene and inhibit cancer cell invasion. Oncogene. 2013;32:5241–5252. doi: 10.1038/onc.2012.549. [DOI] [PMC free article] [PubMed] [Google Scholar]
- 20.Planavila A., Rodriguez-Calvo R., Jove M., Michalik L., Wahli W., Laguna J.C., Vazquez-Carrera M. Peroxisome proliferator-activated receptor beta/delta activation inhibits hypertrophy in neonatal rat cardiomyocytes. Cardiovasc. Res. 2005;65:832–841. doi: 10.1016/j.cardiores.2004.11.011. [DOI] [PubMed] [Google Scholar]
- 21.Stockert J., Wolf A., Kaddatz K., Schnitzer E., Finkernagel F., Meissner W., Müller-Brüsselbach S., Kracht M., Müller R. Regulation of TAK1/TAB1-mediated IL-1beta signaling by cytoplasmic PPARbeta/delta. PLoS One. 2013;8:e63011. doi: 10.1371/journal.pone.0063011. [DOI] [PMC free article] [PubMed] [Google Scholar]
- 22.Rodriguez-Calvo R., Serrano L., Coll T., Moullan N., Sanchez R.M., Merlos M., Palomer X., Laguna J.C., Michalik L., Wahli W., et al. Activation of peroxisome proliferator-activated receptor beta/delta inhibits lipopolysaccharide-induced cytokine production in adipocytes by lowering nuclear factor-kappaB activity via extracellular signal-related kinase 1/2. Diabetes. 2008;57:2149–2157. doi: 10.2337/db08-0176. [DOI] [PMC free article] [PubMed] [Google Scholar]
- 23.Lee C.H., Chawla A., Urbiztondo N., Liao D., Boisvert W.A., Evans R.M., Curtiss L.K. Transcriptional repression of atherogenic inflammation: modulation by PPARdelta. Science. 2003;302:453–457. doi: 10.1126/science.1087344. [DOI] [PubMed] [Google Scholar]
- 24.Barish G.D., Yu R.T., Karunasiri M., Ocampo C.B., Dixon J., Benner C., Dent A.L., Tangirala R.K., Evans R.M. Bcl-6 and NF-kappaB cistromes mediate opposing regulation of the innate immune response. Genes Dev. 2010;24:2760–2765. doi: 10.1101/gad.1998010. [DOI] [PMC free article] [PubMed] [Google Scholar]
- 25.Xu H.E., Lambert M.H., Montana V.G., Parks D.J., Blanchard S.G., Brown P.J., Sternbach D.D., Lehmann J.M., Wisely G.B., Willson T.M., et al. Molecular recognition of fatty acids by peroxisome proliferator-activated receptors. Mol. Cell. 1999;3:397–403. doi: 10.1016/s1097-2765(00)80467-0. [DOI] [PubMed] [Google Scholar]
- 26.Naruhn S., Meissner W., Adhikary T., Kaddatz K., Klein T., Watzer B., Müller-Brüsselbach S., Müller R. 15-hydroxyeicosatetraenoic acid is a preferential peroxisome proliferator-activated receptor β/δ agonist. Mol. Pharmacol. 2010;77:171–184. doi: 10.1124/mol.109.060541. [DOI] [PubMed] [Google Scholar]
- 27.Lim H., Gupta R.A., Ma W.G., Paria B.C., Moller D.E., Morrow J.D., DuBois R.N., Trzaskos J.M., Dey S.K. Cyclo-oxygenase-2-derived prostacyclin mediates embryo implantation in the mouse via PPARdelta. Genes Dev. 1999;13:1561–1574. doi: 10.1101/gad.13.12.1561. [DOI] [PMC free article] [PubMed] [Google Scholar]
- 28.Fauti T., Müller-Brüsselbach S., Kreutzer M., Rieck M., Meissner W., Rapp U., Schweer H., Kömhoff M., Müller R. Induction of PPARbeta and prostacyclin (PGI2) synthesis by Raf signaling: failure of PGI2 to activate PPARbeta. FEBS J. 2006;273:170–179. doi: 10.1111/j.1742-4658.2005.05055.x. [DOI] [PubMed] [Google Scholar]
- 29.Rao G.H., Reddy K.R., Hagert K., White J.G. Influence of pH on the prostacyclin (PGI2) mediated inhibition of platelet function. Prostaglandins Med. 1980;4:263–273. doi: 10.1016/0161-4630(80)90021-x. [DOI] [PubMed] [Google Scholar]
- 30.Billin A.N. PPAR-beta/delta agonists for Type 2 diabetes and dyslipidemia: an adopted orphan still looking for a home. Expert Opin. Investig. Drugs. 2008;17:1465–1471. doi: 10.1517/13543784.17.10.1465. [DOI] [PubMed] [Google Scholar]
- 31.Peraza M.A., Burdick A.D., Marin H.E., Gonzalez F.J., Peters J.M. The toxicology of ligands for peroxisome proliferator-activated receptors (PPAR) Toxicol. Sci. 2006;90:269–295. doi: 10.1093/toxsci/kfj062. [DOI] [PubMed] [Google Scholar]
- 32.Shearer B.G., Steger D.J., Way J.M., Stanley T.B., Lobe D.C., Grillot D.A., Iannone M.A., Lazar M.A., Willson T.M., Billin A.N. Identification and characterization of a selective peroxisome proliferator-activated receptor beta/delta (NR1C2) antagonist. Mol. Endocrinol. 2008;22:523–529. doi: 10.1210/me.2007-0190. [DOI] [PMC free article] [PubMed] [Google Scholar]
- 33.Naruhn S., Toth P.M., Adhikary T., Kaddatz K., Pape V., Dörr S., Klebe G., Müller-Brüsselbach S., Diederich W.E., Müller R. High-affinity peroxisome proliferator-activated receptor beta/delta-specific ligands with pure antagonistic or inverse agonistic properties. Mol. Pharmacol. 2011;80:828–838. doi: 10.1124/mol.111.074039. [DOI] [PubMed] [Google Scholar]
- 34.Toth P.M., Naruhn S., Pape V.F., Dörr S.M., Klebe G., Müller R., Diederich W.E. Development of improved PPARbeta/delta inhibitors. ChemMedChem. 2012;7:159–170. doi: 10.1002/cmdc.201100408. [DOI] [PubMed] [Google Scholar]
- 35.Tanaka T., Tahara-Hanaoka S., Nabekura T., Ikeda K., Jiang S., Tsutsumi S., Inagaki T., Magoori K., Higurashi T., Takahashi H., et al. PPARbeta/delta activation of CD300a controls intestinal immunity. Sci. Rep. 2014;4:5412. doi: 10.1038/srep05412. [DOI] [PMC free article] [PubMed] [Google Scholar]
- 36.Lieber S., Scheer F., Finkernagel F., Meissner W., Giehl G., Brendel C., Diederich W.E., Muller-Brusselbach S., Muller R. The inverse agonist DG172 triggers a PPARbeta/delta-independent myeloid lineage shift and promotes GM-CSF/IL-4-induced dendritic cell differentiation. Mol. Pharmacol. 2015;87:162–173. doi: 10.1124/mol.114.094672. [DOI] [PubMed] [Google Scholar]
- 37.Reinartz S., Schumann T., Finkernagel F., Wortmann A., Jansen J.M., Meissner W., Krause M., Schworer A.M., Wagner U., Muller-Brusselbach S., et al. Mixed-polarization phenotype of ascites-associated macrophages in human ovarian carcinoma: Correlation of CD163 expression, cytokine levels and early relapse. Int. J. Cancer. 2014;134:32–42. doi: 10.1002/ijc.28335. [DOI] [PMC free article] [PubMed] [Google Scholar]
- 38.Braun D., Longman R.S., Albert M.L. A two-step induction of indoleamine 2,3 dioxygenase (IDO) activity during dendritic-cell maturation. Blood. 2005;106:2375–2381. doi: 10.1182/blood-2005-03-0979. [DOI] [PMC free article] [PubMed] [Google Scholar]
- 39.Liao Y., Smyth G.K., Shi W. The Subread aligner: fast, accurate and scalable read mapping by seed-and-vote. Nucleic Acids Res. 2013;41:e108. doi: 10.1093/nar/gkt214. [DOI] [PMC free article] [PubMed] [Google Scholar]
- 40.Dobin A., Davis C.A., Schlesinger F., Drenkow J., Zaleski C., Jha S., Batut P., Chaisson M., Gingeras T.R. STAR: ultrafast universal RNA-seq aligner. Bioinformatics. 2013;29:15–21. doi: 10.1093/bioinformatics/bts635. [DOI] [PMC free article] [PubMed] [Google Scholar]
- 41.Satoh J., Tabunoki H. A comprehensive profile of ChIP-Seq-based STAT1 target genes suggests the complexity of STAT1-mediated gene regulatory mechanisms. Gene Regul. Syst. Bio. 2013;7:41–56. doi: 10.4137/GRSB.S11433. [DOI] [PMC free article] [PubMed] [Google Scholar]
- 42.Hutchins A.P., Poulain S., Miranda-Saavedra D. Genome-wide analysis of STAT3 binding in vivo predicts effectors of the anti-inflammatory response in macrophages. Blood. 2012;119:e110–e119. doi: 10.1182/blood-2011-09-381483. [DOI] [PubMed] [Google Scholar]
- 43.Ghisletti S., Barozzi I., Mietton F., Polletti S., De Santa F., Venturini E., Gregory L., Lonie L., Chew A., Wei C.L., et al. Identification and characterization of enhancers controlling the inflammatory gene expression program in macrophages. Immunity. 2010;32:317–328. doi: 10.1016/j.immuni.2010.02.008. [DOI] [PubMed] [Google Scholar]
- 44.Haskill S., Johnson C., Eierman D., Becker S., Warren K. Adherence induces selective mRNA expression of monocyte mediators and proto-oncogenes. J. Immunol. 1988;140:1690–1694. [PubMed] [Google Scholar]
- 45.Sporn S.A., Eierman D.F., Johnson C.E., Morris J., Martin G., Ladner M., Haskill S. Monocyte adherence results in selective induction of novel genes sharing homology with mediators of inflammation and tissue repair. J. Immunol. 1990;144:4434–4441. [PubMed] [Google Scholar]
- 46.Kelley J.L., Rozek M.M., Suenram C.A., Schwartz C.J. Activation of human blood monocytes by adherence to tissue culture plastic surfaces. Exp. Mol. Pathol. 1987;46:266–278. doi: 10.1016/0014-4800(87)90049-9. [DOI] [PubMed] [Google Scholar]
- 47.Fuhlbrigge R.C., Chaplin D.D., Kiely J.M., Unanue E.R. Regulation of interleukin 1 gene expression by adherence and lipopolysaccharide. J. Immunol. 1987;138:3799–3802. [PubMed] [Google Scholar]
- 48.Eierman D.F., Johnson C.E., Haskill J.S. Human monocyte inflammatory mediator gene expression is selectively regulated by adherence substrates. J. Immunol. 1989;142:1970–1976. [PubMed] [Google Scholar]
- 49.Coccia E.M., Del Russo N., Stellacci E., Testa U., Marziali G., Battistini A. STAT1 activation during monocyte to macrophage maturation: role of adhesion molecules. Int. Immunol. 1999;11:1075–1083. doi: 10.1093/intimm/11.7.1075. [DOI] [PubMed] [Google Scholar]
- 50.Rosales C., Juliano R. Integrin signaling to NF-kappa B in monocytic leukemia cells is blocked by activated oncogenes. Cancer Res. 1996;56:2302–2305. [PubMed] [Google Scholar]
- 51.Mandard S., Zandbergen F., Tan N.S., Escher P., Patsouris D., Koenig W., Kleemann R., Bakker A., Veenman F., Wahli W., et al. The direct peroxisome proliferator-activated receptor target fasting-induced adipose factor (FIAF/PGAR/ANGPTL4) is present in blood plasma as a truncated protein that is increased by fenofibrate treatment. J. Biol. Chem. 2004;279:34411–34420. doi: 10.1074/jbc.M403058200. [DOI] [PubMed] [Google Scholar]
- 52.Bours V., Franzoso G., Azarenko V., Park S., Kanno T., Brown K., Siebenlist U. The oncoprotein Bcl-3 directly transactivates through kappa B motifs via association with DNA-binding p50B homodimers. Cell. 1993;72:729–739. doi: 10.1016/0092-8674(93)90401-b. [DOI] [PubMed] [Google Scholar]
- 53.Palombella V.J., Rando O.J., Goldberg A.L., Maniatis T. The ubiquitin-proteasome pathway is required for processing the NF-kappa B1 precursor protein and the activation of NF-kappa B. Cell. 1994;78:773–785. doi: 10.1016/s0092-8674(94)90482-0. [DOI] [PubMed] [Google Scholar]
- 54.Wu H.M., Wen H.C., Lin W.W. Proteasome inhibitors stimulate interleukin-8 expression via Ras and apoptosis signal-regulating kinase-dependent extracellular signal-related kinase and c-Jun N-terminal kinase activation. Am. J. Respir. Cell Mol. Biol. 2002;27:234–243. doi: 10.1165/ajrcmb.27.2.4792. [DOI] [PubMed] [Google Scholar]
- 55.Munn D.H., Mellor A.L. Indoleamine 2,3 dioxygenase and metabolic control of immune responses. Trends Immunol. 2013;34:137–143. doi: 10.1016/j.it.2012.10.001. [DOI] [PMC free article] [PubMed] [Google Scholar]
- 56.Francisco L.M., Sage P.T., Sharpe A.H. The PD-1 pathway in tolerance and autoimmunity. Immunol. Rev. 2010;236:219–242. doi: 10.1111/j.1600-065X.2010.00923.x. [DOI] [PMC free article] [PubMed] [Google Scholar]
- 57.Silk J.D., Salio M., Brown J., Jones E.Y., Cerundolo V. Structural and functional aspects of lipid binding by CD1 molecules. Annu. Rev. Cell Dev. Biol. 2008;24:369–395. doi: 10.1146/annurev.cellbio.24.110707.175359. [DOI] [PubMed] [Google Scholar]
- 58.Guilliams M., Bruhns P., Saeys Y., Hammad H., Lambrecht B.N. The function of Fcgamma receptors in dendritic cells and macrophages. Nat. Rev. Immunol. 2014;14:94–108. doi: 10.1038/nri3582. [DOI] [PubMed] [Google Scholar]
- 59.Rival Y., Beneteau N., Taillandier T., Pezet M., Dupont-Passelaigue E., Patoiseau J.F., Junquero D., Colpaert F.C., Delhon A. PPARalpha and PPARdelta activators inhibit cytokine-induced nuclear translocation of NF-kappaB and expression of VCAM-1 in EAhy926 endothelial cells. Eur. J. Pharmacol. 2002;435:143–151. doi: 10.1016/s0014-2999(01)01589-8. [DOI] [PubMed] [Google Scholar]
- 60.Ding G., Cheng L., Qin Q., Frontin S., Yang Q. PPARdelta modulates lipopolysaccharide-induced TNFalpha inflammation signaling in cultured cardiomyocytes. J. Mol. Cell. Cardiol. 2006;40:821–828. doi: 10.1016/j.yjmcc.2006.03.422. [DOI] [PubMed] [Google Scholar]
- 61.Wang L.H., Yang X.Y., Zhang X., Huang J., Hou J., Li J., Xiong H., Mihalic K., Zhu H., Xiao W., et al. Transcriptional inactivation of STAT3 by PPARgamma suppresses IL-6-responsive multiple myeloma cells. Immunity. 2004;20:205–218. doi: 10.1016/s1074-7613(04)00030-5. [DOI] [PubMed] [Google Scholar]
- 62.Kino T., Rice K.C., Chrousos G.P. The PPARdelta agonist GW501516 suppresses interleukin-6-mediated hepatocyte acute phase reaction via STAT3 inhibition. Eur. J. Clin. Invest. 2007;37:425–433. doi: 10.1111/j.1365-2362.2007.01796.x. [DOI] [PubMed] [Google Scholar]
- 63.Serrano-Marco L., Barroso E., El Kochairi I., Palomer X., Michalik L., Wahli W., Vazquez-Carrera M. The peroxisome proliferator-activated receptor (PPAR) beta/delta agonist GW501516 inhibits IL-6-induced signal transducer and activator of transcription 3 (STAT3) activation and insulin resistance in human liver cells. Diabetologia. 2011;55:743–751. doi: 10.1007/s00125-011-2401-4. [DOI] [PubMed] [Google Scholar]
- 64.Serrano-Marco L., Rodriguez-Calvo R., El Kochairi I., Palomer X., Michalik L., Wahli W., Vazquez-Carrera M. Activation of peroxisome proliferator-activated receptor-beta/-delta (PPAR-beta/-delta) ameliorates insulin signaling and reduces SOCS3 levels by inhibiting STAT3 in interleukin-6-stimulated adipocytes. Diabetes. 2011;60:1990–1999. doi: 10.2337/db10-0704. [DOI] [PMC free article] [PubMed] [Google Scholar]
- 65.Latz E., Xiao T.S., Stutz A. Activation and regulation of the inflammasomes. Nat. Rev. Immunol. 2013;13:397–411. doi: 10.1038/nri3452. [DOI] [PMC free article] [PubMed] [Google Scholar]
- 66.Wiezlak M., Diring J., Abella J., Mouilleron S., Way M., McDonald N.Q., Treisman R. G-actin regulates the shuttling and PP1 binding of the RPEL protein Phactr1 to control actomyosin assembly. J. Cell Sci. 2012;125:5860–5872. doi: 10.1242/jcs.112078. [DOI] [PubMed] [Google Scholar]
- 67.Singh K.K., Ge X., Mao Y., Drane L., Meletis K., Samuels B.A., Tsai L.H. Dixdc1 is a critical regulator of DISC1 and embryonic cortical development. Neuron. 2010;67:33–48. doi: 10.1016/j.neuron.2010.06.002. [DOI] [PMC free article] [PubMed] [Google Scholar]
- 68.Xu Z., Liu D., Fan C., Luan L., Zhang X., Wang E. DIXDC1 increases the invasion and migration ability of non-small-cell lung cancer cells via the PI3K-AKT/AP-1 pathway. Mol. Carcinog. 2014;53:917–925. doi: 10.1002/mc.22059. [DOI] [PubMed] [Google Scholar]
- 69.Stockert J., Adhikary T., Kaddatz K., Finkernagel F., Meissner W., Müller-Brüsselbach S., Müller R. Reverse crosstalk of TGFβ and PPARβ/δ signaling identified by transcriptional profiling. Nucleic Acids Res. 2011;39:119–131. doi: 10.1093/nar/gkq773. [DOI] [PMC free article] [PubMed] [Google Scholar]
- 70.Eltzschig H.K., Carmeliet P. Hypoxia and inflammation. N. Engl. J. Med. 2011;364:656–665. doi: 10.1056/NEJMra0910283. [DOI] [PMC free article] [PubMed] [Google Scholar]
Associated Data
This section collects any data citations, data availability statements, or supplementary materials included in this article.