

Abstract
Age-related bone loss in humans is associated with a decrease in bone formation relative to bone resorption, although the mechanisms for this impairment in bone formation with aging are not well understood. It is known that the precursors for the bone-forming osteoblasts reside in the mesenchymal cell population in bone marrow. Thus, in an effort to identify relevant genetic pathways that are altered with aging, we examined the gene expression and DNA methylation patterns from a highly enriched bone marrow mesenchymal cell population from young (mean age, 28.7 years) versus old (mean age, 73.3 years) women. Bone marrow mononuclear cells from these women were depleted of hematopoietic lineage (lin) and endothelial cells using a combination of magnetic- and fluorescence-activated cell sorting, yielding a previously characterized mesenchymal cell population (lin−/CD34−/CD31− cells) that is capable of osteoblast differentiation. Whole transcriptome RNA sequencing (RNAseq) of freshly isolated cells (without in vitro culture) identified 279 differentially expressed genes (p < 0.05, false discovery rate [q] < 0.10) between the young and old subjects. Pathway analysis revealed statistically significant (all p < 0.05) alterations in protein synthesis and degradation pathways, as well as mTOR, gap junction, calcium, melatonin and NFAT signaling pathways. Further, Reduced Representational Bisulphite sequencing (RRBS DNA methylation sequencing) revealed significant differences in methylation between the young and old subjects surrounding the promoters of 1528 target genes that also exhibited significant differences in gene expression by RNAseq. In summary, these studies provide novel insights into potential pathways affected by aging in a highly enriched human mesenchymal cell population analyzed without the confounding effects of in vitro culture. Specifically, our finding of alterations in several genes and pathways leading to impaired protein synthesis and turnover with aging in bone marrow mesenchymal cells points to the need for further studies examining how these changes, as well as the other alterations with aging that we identified, may contribute to the age-related impairment in osteoblast formation and/or function.
Keywords: aging, osteoporosis, transcriptional profiling
Introduction
Aging is associated with significant bone loss and a marked increase in fracture risk [1]. At the tissue level, decreased bone formation relative to bone resorption with aging results in net bone loss [1]. However, the fundamental molecular mechanisms that drive age-related bone loss remain poorly understood. A more comprehensive understanding of these mechanisms may lead to the development of novel clinical therapies to combat age-related bone loss and protect against fractures.
Since impaired bone formation is a key feature of age-related bone loss, it is important to understand the molecular changes that occur in osteoblast lineage cell populations during aging in vivo. Although the contribution of the entire bone microenvironment is important in maintaining bone homeostasis, it is clear that cell autonomous changes in osteoblastic precursors also contribute to age-related bone loss. For example, Zhou and colleagues found that human bone marrow stromal cells isolated from old patients exhibited increased senescence and decreased proliferation relative to young patients when placed in in vitro culture [2]. However, since in vitro culture may alter both the gene expression profile and phenotype of osteoblast precursor cells, it is important to complement the findings of these in vitro studies with an in vivo evaluation of changes in gene expression that occur with aging in osteoblast precursor cells in human bone marrow.
Epigenetics, or the changes in gene expression caused by chemical modification of histones or DNA, has recently emerged as a potentially important determinant in the aging process (reviewed in [3]). These modifications affect the local chromatin environment and can influence the level of expression of nearby genes. One of these modifications, DNA methylation, occurs on the cytosine residue of CpG dinucleotides and affects genomic structure by altering histone density and transcriptional regulation by influencing the accessibility of the nuclear transcriptional machinery to DNA control elements (i.e. promoters/enhancers). DNA methylation within groups of CpG dinucleotides (called CpG islands) correlates with transcriptional repression [4]. However, the extent to which global DNA methylation is affected by the aging process in bone marrow mesenchymal cells is unknown.
A previous study from our group described the isolation of mesenchymal cells from human bone marrow through depletion of all hematopoietic lineage (lin) and endothelial cells using a combination of magnetic- and fluorescence-activated cell sorting (MACS and FACS, respectively) [5]. These cells (lin−/CD34−/CD31−) contain virtually all of the bone marrow mononuclear cells (BMMCs) capable of in vitro mineralization and express bone-related marker genes when cultured under osteogenic conditions [5]. They are isolated using similar techniques to an analogous approach described by the Aubin laboratory to purify multipotent skeletal stem cells (highly purified osteoprogenitors, HipOPs) from mouse bone marrow that express osteoblast markers following in vitro culture and differentiate into osteoblasts and osteocytes upon in vivo transplantation [6, 7]. Thus, in the present study, we isolated lin−/CD34−/CD31− cells from the bone marrow of young and old women and performed RNA sequencing (RNAseq) and whole genome bisulphite DNA sequencing in order to characterize the effects of age on both gene expression and DNA methylation patterns in a highly enriched population of human bone marrow mesenchymal cells. Moreover, by isolating and analyzing these cells without in vitro culture, we circumvented changes in gene expression and/or DNA methylation in these cells potentially induced by culturing the cells.
Materials and Methods
Study subjects and sample isolation
Bone marrow aspirates were obtained from 16 young (22–40 years old) and 12 old (64–88 years old) female volunteers in the Outpatient Mayo Clinical Research Unit following an overnight fast, as previously described [5]. The study was approved by the Mayo Clinic Institutional Review Board, and all subjects provided written informed consent. Potential subjects were rigorously screened for coexisting disease and excluded if they had diseases known to affect bone metabolism. No subjects were taking any therapies likely to affect bone metabolism such as anticonvulsants, bisphosphonates, calcitonin, glucocorticoids, or sodium fluoride. Serum chemistries were measured by autoanalyzer and serum 25-hydroxyvitamin D was measured by liquid chromatography-tandem mass spectroscopy (interassay coefficient of variation, < 7%).
Isolation of lin−/CD34−/CD31− cells
The isolation and characterization of human bone marrow lin−/CD34−/CD31− cells has been previously described in detail from our laboratory [5]. Briefly, BMMCs were isolated from 40 mL of human bone marrow aspirate using Ficoll gradient centrifugation. Mature hematopoietic cells (i.e. T-cells, B-cells, NK cells, dendritic cells, monocytes, granulocytes, erythroid cells) were removed from the BMMCs using the Lineage Cell Depletion Kit (Miltenyi Biotec, San Diego, CA) followed by MACS. The MACS sorted lineage negative (lin−) cells were incubated with phycoerythrin (PE)-conjugated anti-CD34 and anti-CD31 antibodies (BD Biosciences, San Jose, CA) at 4°C for 30 min. The cells were also co-stained with propidium iodide to exclude dead cells. The lin−/CD34−/CD31− cell population was isolated by FACS, where the fluorescence threshold was set based on excluding the highly fluorescent CD34+/CD31+ population, as previously described [5]. Identical fluorescence thresholds were used for all patient samples.
RNA isolation and cDNA synthesis
Total RNA was prepared using the RNeasy Micro Kit (Qiagen, Valencia, CA) and treated with the Turbo DNA-free™ Kit (Life Technologies, Grand Island, NY) to remove potential contaminating DNA that may lead to false-positive amplification, as previously described [5]. The resulting RNA was used for either RNAseq or for reverse transcriptase-quantitative polymerase chain reaction (RT-QPCR) analysis. Due to the low abundance of the lin−/CD34−/CD31− cell population in the bone marrow aspirates, whole transcriptome amplification was necessary to perform in-depth gene expression analyses. ~30 ng total RNA input was used to generate 8–10 μg of amplified cDNA using the NuGEN Ovation Pico WTA System V2 (NuGEN Technologies, Inc., San Carlos, CA). In this system, the relative representation of each transcript from the original RNA sample is maintained following linear amplification [8, 9].
Gene expression analysis
RT-QPCR reactions were run on the ABI Prism 7900HT Real-Time System (Applied Biosystems, Carlsbad, CA) using the Quantitect SYBR Green Master Mix (Qiagen), as previously described [5]. Multiple reference genes and threshold calculations were used for data normalization, as previously described [10, 11]. Primer sequences for individual genes were designed using the Primer Express® Software version 3.0.1 (Applied Biosystems) and are available on request.
Whole transcriptome RNA sequencing (RNAseq)
RNAseq was carried out in the Mayo Clinic Medical Genome Facility. This was performed on total RNA from the lin−/CD34−/CD31− cell populations, as extensively described previously from our laboratory [12]. RNA libraries were prepared according to the manufacturer’s instructions for the NuGen Ovation RNASeq FFPE and Ultralow Library Systems (San Carlos, CA). Briefly, first strand cDNA was generated from ~30 ng of total RNA using DNA/RNA chimeric primers and reverse transcriptase, creating a cDNA/RNA hybrid. The second strand cDNA was then synthesized containing a DNA/RNA duplex. The resulting double-stranded cDNA molecule was amplified by Single Primer Isothermal Amplification (SPIA®) using a chimeric SPIA primer, DNA polymerase, and RNase H (NuGen). Following amplification, the products were modified by random priming and extension to create double-stranded products suitable for generating sequencing libraries. Unique indexes were incorporated for each sample. The double-stranded products then underwent blunt-end repair. Adapter molecules were ligated to the 5′ and 3′ ends of each fragment to facilitate PCR amplification of the fragments to produce the final library. Unique indexes were incorporated at the adaptor ligation step for loading multiple samples per flow cell. Three distinct indexed libraries were loaded per flow cell and sequenced on an Illumina HiSeq 2000 using TruSeq SBS sequencing software (version 3) and SCS data collection software (version 1.4.8). Base calling was performed using Illumina RTA (version 1.12.4.2).
Methylation sequencing (RRBS)
RRBS was carried out in the Mayo Clinic Medical Genome Facility. Genomic DNA was isolated from the lin−/CD34−/CD31− cell populations using the ZymoBead™ Genomic DNA Kit (Zymo Research, Irvine, CA). Two-hundred and fifty ng of genomic DNA was digested with the methylation insensitive restriction digest enzyme Msp1 (New England BioLabs Inc., Ipswich, MA), which cleaves DNA at CCGG sites creating fragments high in CpG content. The DNA was purified using the MinElute Reaction Cleanup Kit (Qiagen). Samples were end-repaired and A-tailed using a Klenow fragment (New England Biolabs, Inc). TrueSeq™ adaptors (Illumina, Inc., San Diego, CA) were ligated to the modified DNA ends using T4 DNA ligase (New England Biolabs, Inc). Size selection (~150–400 base pairs) was performed with Agencourt AMPure XP beads (Beckman Coulter, Brea, CA). This size range allows for a final insert size of ~40 to 280 basepairs (bp), which will include many CpG islands and shores. The sample was bisulfite modified and PCR amplified to enrich for fragments containing high CpG content. Samples were submitted for sequencing on the Illumina HiSeq™ instrument.
Statistical and bioinformatics analyses
The RNAseq data was analyzed essentially as previously described [12]. Briefly, paired-end reads from the raw RNAseq data were aligned using TopHat (version 2.0.6) against the h19 genome build using the bowtie 1 option, and quality control assessments were made using RSeQC software. Gene counts were generated using HTSeq software and gene annotation files were obtained from Illumina. Ramskold et al. [13] have suggested using a median reads per kilobase per million mapped reads (RPKM) threshold of 0.3 as criteria for calling a gene “expressed”; in our analyses, we have found very close concordance between this criteria and simply using an absolute median gene count threshold of 10, which is what we used previously [12] and in the current analysis. Genes with median gene counts of <10 in both young and old groups were considered “non-expressed”, as previously described [12]. However, due to recent concerns that the measurement of mRNA abundance using RPKM may be inconsistent among samples [14], conditional quantile normalization using the cqn Bioconductor package [15] was applied to the RNAseq data to reduce variability introduced by GC content, gene size, and total gene counts per sample Significance in differential expression was determined using the edgeR Bioconductor package [16] assuming a negative binomial error structure accounting for the cqn derived offset. Pathway analysis was performed using the Ingenuity Pathway Analysis software (Ingenuity Systems, Redwood City, CA).
The Mayo bioinformatics pipeline (Streamlined Analysis and Annotation Pipeline for Bisulfite Sequencing Data) was used for the initial analysis of the bisulfite methylation sequencing [17]. The pipeline integrates read quality assessment/clean-up, quality metrics, alignment, methylation data extraction, variant detection, annotation, reporting, and visualization. The extracted CpG methylation was then fully annotated for downstream analyses. The methylation counts were further summarized over the promoter regions of genes using two definitions: a narrow version encompassing −2000 to +500 bp, and a wider version encompassing −5000 to +2000 bp, both relative to the transcription start site (TSS). A logistic regression model was fit predicting methylation status allowing for over-dispersion using a quasi-binomial error family comparing the values from younger and older women. The median methylation rate (methylation count divided by the total count) was used to summarize values within each of the groups.
For the QPCR analyses, calculations and statistical comparisons were performed using Microsoft Office Excel 2003 (Microsoft Corp., Redmond, WA) and the data are presented as the mean ± SEM.
Results
The purpose of this study was to examine the gene expression and DNA methylation patterns from highly enriched bone marrow-derived mesenchymal cells during human aging in order to ascertain how aging affects these parameters. To this end, we used a subset of patients from a previously described cohort of young and old women from whom we obtained bone marrow aspirates for mesenchymal cell isolation [18]. Table 1 shows the clinical characteristics of the study subjects. The young and old subjects did not differ in anthropometric or serum parameters and were vitamin D sufficient.
Table 1.
Clinical characteristics of the study subjects. Data are mean ± SEM.
| Young | Old | P-value | |
|---|---|---|---|
| n | 16 | 12 | - |
| Age, yrs | 28.7 ± 1.20 | 73.3 ± 1.66 | - |
| Height, cm | 167.7 ± 1.68 | 162.5 ± 2.07 | 0.060 |
| Weight, kg | 72.2 ± 3.36 | 76.8 ± 4.31 | 0.392 |
| BMI, kg/m2 | 25.7 ± 1.30 | 28.9 ± 1.22 | 0.091 |
| Serum parameters | |||
| Calcium, mg/dL | 9.5 ± 0.07 | 9.7 ± 0.08 | 0.061 |
| Phosphorus, mg/dL | 3.6 ± 0.12 | 3.9 ± 0.10 | 0.090 |
| Creatinine, mg/dL | 0.9 ± 0.03 | 0.8 ± 0.08 | 0.114 |
| 25-hydroxyvitamin D, ng/mL | 38.5 ± 3.26 | 37.4 ± 1.83 | 0.794 |
We first used whole transcriptome RNAseq to identify differential gene expression in the lin−/CD34−/CD31− cells between the young and old subjects. As shown in Figure 1A and listed in Table S1, 13,567 total genes were expressed in the two groups, with 491 expressed in young only (3.6%) and 138 expressed in old only (1.0%). Interestingly, the vast majority (95.4%) were expressed in both young and old women. Consistent with our previous data using RT-QPCR, bone marrow lin−/CD34−/CD31− cells did express RUNX2, but its expression did not differ between the young or old subjects (Table S1). These cells also expressed detectable levels of COL1A1 and COL1A2, but not of other markers of more mature osteoblasts (e.g., SP7 [osterix] or BGLAP [osteocalcin]) (Table S1); in contrast to these findings using RNAseq, we were previously able to detect low level expression of these osteoblast marker genes in lin−/CD34−/CD31− cells using RT-QPCR [5], reflecting perhaps the greater sensitivity of RT-QPCR. Consistent with their mesenchymal stem cell phenotype, lin−/CD34−/CD31− cells also expressed several mesenchymal stem cell markers, including VCAM, NT5E (CD71), and MCAM (CD146) (Table S1). In addition, recent work from the Morrison laboratory [19] has demonstrated that leptin receptor-positive bone marrow cells are highly enriched for osteoprogenitor cells, at least in mouse bone marrow. Consistent with this, human lin−/CD34−/CD31− cells also expressed LEPR, although expression levels were not different between the young and old subjects (Table S1).
Figure 1. RNAseq analysis of young versus old bone marrow lin−/CD34/CD31− mesechymal cells.
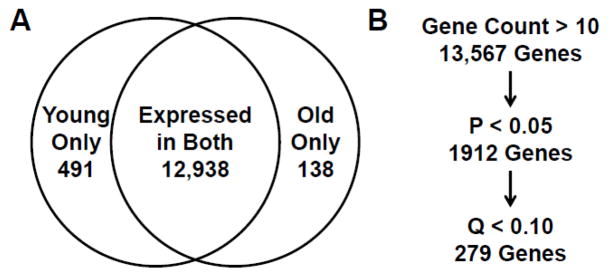
A) Genes exhibiting a median gene count of at least 10 in at least one group were considered expressed. The Venn diagram shows a breakdown of the expressed genes among the young only, old only, and both groups. B) The flowchart shows the number of genes remaining after applying the additional statistical criteria of p < 0.05 (1912 genes) and q < 0.10 (279 genes).
To identify differential gene expression between the young and old subjects, the gene list was narrowed by applying a p-value of < 0.05 (1912 genes) and a more stringent criteria of a false discovery rate of q < 0.10, as is generally accepted [20, 21]. This left 279 genes which were most confidently differentially expressed in young versus old subjects (Figure 1B). Table S2 lists all of the 279 differentially expressed genes between the young and old subjects, which included 152 and 127 genes that were expressed at higher and lower levels, respectively, in the old as compared to the young subjects. The 50 most up- and down-regulated genes are listed in Table 2. Ingenuity pathway analysis (IPA) of the 279 genes differentially regulated with aging in the lin−/CD34−/CD31− cells revealed alterations in numerous pathways (Table 3), including protein synthesis (eukaryotic translation initiation factor 2 (EIF2) signaling), where 14 ribosomal proteins were significantly down-regulated in the mesenchymal cells isolated from the old subjects, suggesting that protein synthesis may be less active or robust in aged mesenchymal cells. In addition, the protein ubiquitination pathway was also downregulated in the lin−/CD34−/CD31− cells from the old subjects (Table 2), potentially leading to the accumulation of misfolded or damaged proteins in these cells (reviewed in [22]). Table 3 also lists additional pathways that were altered with aging in the lin−/CD34−/CD31− cells, including mTOR, gap junction, calcium, melatonin and NFAT signaling pathways. Since IPA does not provide information on whether a particular pathway is up- or down-regulated, in Table 3 we also indicate the fold change for each regulated gene (p < 0.05; q < 0.10) in the old versus young subjects in order to provide a sense of the direction of changes in the genes in each pathway with aging.
Table 2.
Top 50 up- or down-regulated genes comparing old to young lin−/CD34−/31− cells by RNAseq
| Up-regulated in the old subjects | Down-regulated in the old subjects | ||||||
|---|---|---|---|---|---|---|---|
| Gene Symbol | Fold Change | p-Value | q-Value | Gene Symbol | Fold Change | p-Value | q-Value |
| SLC16A14 | 7.54 | ≤ 0.01 | 0.01 | IL18RAP | 0.05 | ≤ 0.01 | 0.01 |
| MMP8 | 6.78 | ≤ 0.01 | 0.01 | GNLY | 0.09 | ≤ 0.01 | 0.01 |
| GSTM5 | 6.57 | ≤ 0.01 | 0.04 | SAMD3 | 0.13 | ≤ 0.01 | 0.01 |
| CAMP | 5.79 | ≤ 0.01 | 0.03 | S1PR5 | 0.14 | ≤ 0.01 | 0.06 |
| BAG3 | 4.51 | ≤ 0.01 | 0.01 | GZMA | 0.14 | ≤ 0.01 | 0.04 |
| LTF | 3.93 | ≤ 0.01 | 0.10 | SH2D1B | 0.14 | ≤ 0.01 | 0.07 |
| PROK2 | 3.78 | ≤ 0.01 | 0.08 | CX3CR1 | 0.16 | ≤ 0.01 | 0.06 |
| DPP10 | 3.65 | ≤ 0.01 | 0.01 | KLRF1 | 0.17 | ≤ 0.01 | 0.06 |
| MTRNR2L7 | 3.62 | ≤ 0.01 | 0.08 | ST3GAL5 | 0.17 | ≤ 0.01 | 0.02 |
| ZNF532 | 3.59 | ≤ 0.01 | 0.04 | GRK5 | 0.18 | ≤ 0.01 | 0.06 |
| RPLP0P2 | 3.24 | ≤ 0.01 | 0.02 | AOX2P | 0.18 | ≤ 0.01 | 0.01 |
| PXDN | 3.24 | ≤ 0.01 | 0.07 | SPI1 | 0.21 | ≤ 0.01 | 0.10 |
| FERMT1 | 3.07 | ≤ 0.01 | 0.03 | CD247 | 0.21 | ≤ 0.01 | 0.09 |
| RYR1 | 2.98 | ≤ 0.01 | 0.03 | FCRL1 | 0.22 | ≤ 0.01 | 0.04 |
| GRINA | 2.97 | ≤ 0.01 | 0.06 | CD226 | 0.22 | ≤ 0.01 | 0.06 |
| LCN2 | 2.91 | ≤ 0.01 | 0.06 | FCGR3A | 0.23 | ≤ 0.01 | 0.09 |
| TFDP3 | 2.85 | ≤ 0.01 | 0.03 | CD3E | 0.24 | ≤ 0.01 | 0.08 |
| BEX1 | 2.79 | ≤ 0.01 | 0.07 | GIMAP6 | 0.24 | ≤ 0.01 | 0.08 |
| RNFT2 | 2.61 | ≤ 0.01 | ≤ 0.01 | SLFN5 | 0.26 | ≤ 0.01 | 0.01 |
| ZNF462 | 2.59 | ≤ 0.01 | 0.06 | IKZF3 | 0.26 | ≤ 0.01 | 0.04 |
| NOTCH4 | 2.51 | ≤ 0.01 | 0.04 | LINC00861 | 0.28 | ≤ 0.01 | 0.01 |
| STAG3L1 | 2.49 | ≤ 0.01 | 0.06 | LAX1 | 0.29 | ≤ 0.01 | 0.03 |
| FAM166A | 2.41 | ≤ 0.01 | 0.06 | LINC00410 | 0.31 | ≤ 0.01 | 0.01 |
| RNF212 | 2.38 | ≤ 0.01 | 0.02 | GIMAP8 | 0.31 | ≤ 0.01 | 0.09 |
| GPR52 | 2.23 | ≤ 0.01 | 0.04 | ADAM19 | 0.31 | ≤ 0.01 | 0.01 |
| LOC100133331 | 2.22 | ≤ 0.01 | 0.07 | CASP1 | 0.35 | ≤ 0.01 | 0.04 |
| TREML2 | 2.18 | ≤ 0.01 | 0.01 | ITGAX | 0.36 | ≤ 0.01 | 0.01 |
| SPARCL1 | 2.18 | ≤ 0.01 | 0.08 | PARM1 | 0.36 | ≤ 0.01 | 0.06 |
| F8A1 | 2.15 | ≤ 0.01 | 0.08 | HEYL | 0.36 | ≤ 0.01 | 0.08 |
| SLITRK4 | 2.13 | ≤ 0.01 | 0.10 | ETS1 | 0.38 | ≤ 0.01 | 0.06 |
| GOLGA6L10 | 2.11 | ≤ 0.01 | 0.04 | GVINP1 | 0.38 | ≤ 0.01 | 0.08 |
| TUBA8 | 2.11 | ≤ 0.01 | 0.04 | TDRD9 | 0.38 | ≤ 0.01 | 0.07 |
| ROCK1P1 | 2.03 | ≤ 0.01 | 0.02 | ROBO1 | 0.39 | ≤ 0.01 | ≤ 0.01 |
| WASH3P | 2.02 | ≤ 0.01 | 0.08 | IGLL5 | 0.40 | ≤ 0.01 | 0.06 |
| EFHC2 | 2.02 | ≤ 0.01 | 0.06 | IKZF2 | 0.42 | ≤ 0.01 | 0.06 |
| TMCC2 | 1.98 | ≤ 0.01 | 0.09 | KIAA1324L | 0.43 | ≤ 0.01 | 0.02 |
| GIPC2 | 1.98 | ≤ 0.01 | 0.10 | RARRES3 | 0.45 | ≤ 0.01 | 0.04 |
| MATN2 | 1.98 | ≤ 0.01 | 0.05 | SP140 | 0.45 | ≤ 0.01 | 0.10 |
| LOC441454 | 1.97 | ≤ 0.01 | 0.02 | CYSLTR1 | 0.45 | ≤ 0.01 | 0.10 |
| TTN | 1.93 | ≤ 0.01 | 0.06 | ITGB8 | 0.48 | ≤ 0.01 | 0.02 |
| SMG1P1 | 1.88 | ≤ 0.01 | 0.08 | CD53 | 0.49 | ≤ 0.01 | 0.06 |
| IL12RB2 | 1.87 | ≤ 0.01 | 0.06 | EML3 | 0.49 | ≤ 0.01 | 0.01 |
| RPSAP9 | 1.84 | ≤ 0.01 | 0.10 | GALM | 0.53 | ≤ 0.01 | 0.01 |
| NEURL1B | 1.83 | ≤ 0.01 | ≤ 0.01 | STK19 | 0.54 | ≤ 0.01 | 0.06 |
| KLHL26 | 1.75 | ≤ 0.01 | 0.05 | SNORD102 | 0.56 | ≤ 0.01 | 0.04 |
| DNM3 | 1.73 | ≤ 0.01 | 0.04 | LINC01012 | 0.58 | ≤ 0.01 | 0.06 |
| KCNAB1 | 1.71 | ≤ 0.01 | 0.08 | GBP4 | 0.58 | ≤ 0.01 | 0.06 |
| VPS9D1-AS1 | 1.67 | ≤ 0.01 | 0.10 | MIR5047 | 0.62 | ≤ 0.01 | 0.06 |
| FCGR2A | 1.60 | ≤ 0.01 | 0.02 | CRYL1 | 0.63 | ≤ 0.01 | 0.08 |
| LOC728554 | 1.60 | ≤ 0.01 | 0.02 | DSG3 | 0.63 | ≤ 0.01 | 0.05 |
Table 3.
IPA analysis of the 279 differentially regulated genes comparing old to young lin−/CD34−/31− cells. Numbers in parentheses indicate the fold change (old/young) for the regulated genes (p < 0.05, q < 0.10) in each pathway.
| Ingenuity Canonical Pathways | p-Value | Targets |
|---|---|---|
|
| ||
| Eukaryotic translation initiation factor 2 (EIF2) signaling | ≤ 0.01 | RPL37A(0.85),RPS18(0.85),RPL30(0.83),RPL7L1(0.87),RPS13(1.19),EIF4A2(0.89),RPL23A(0.78),RPS21(1.24),RPL7(0.74),RPS7(0.79),RPL6(0.89),RPL18A(0.85),RPL7A(0.87),RPS15(0.85),RPS3(0.86),RPL41(0.84) |
| mTOR Signaling | ≤ 0.01 | RPS7(0.79),MAPKAP1(1.18),PRKCQ(0.78),RPS18(0.85),RPS15(0.85),RPS13(1.19),EIF4A2(0.89),RPS21(1.24),RPS3(0.86),PRKAG1(1.22) |
| Regulation of eIF4 and p70S6K Signaling | ≤ 0.01 | RPS7(0.79),RPS18(0.85),RPS15(0.85),RPS13(1.19),EIF4A2(0.89),RPS21(1.24),PAIP2(0.89),RPS3(0.86) |
| Calcium-induced T Lymphocyte Apoptosis | ≤ 0.01 | CD247(0.21),CALM3(0.80),PRKCQ(0.78),CD3E(0.24),HDAC1(0.89) |
| Remodeling of Epithelial Adherens Junctions | ≤ 0.01 | TUBA8(2.11),TUBG1(1.30),DNM3(1.73),TUBA1C(1.28),TUBA1B(1.17) |
| Polyamine Regulation in Colon Cancer | ≤ 0.01 | PSME1(0.87),PSME2(0.84),OAZ1(0.77) |
| Nur77 Signaling in T Lymphocytes | 0.01 | CD247(0.21),CALM3(0.80),CD3E(0.24),HDAC1(0.89) |
| Gap Junction Signaling | 0.01 | PRKCQ(0.78),TUBA8(2.11),PDIA3(1.33),TUBG1(1.30),TUBA1C(1.28),TUBA1B(1.17),PRKAG1(1.22) |
| Breast Cancer Regulation by Stathmin1 | 0.01 | CALM3(0.80),STMN1(1.12),PRKCQ(0.78),TUBA8(2.11),TUBG1(1.30),TUBA1C(1.28),TUBA1B(1.17),PRKAG1(1.22) |
| 14-3-3-mediated Signaling | 0.01 | PRKCQ(0.78),TUBA8(2.11),PDIA3(1.33),TUBG1(1.30),TUBA1C(1.28),TUBA1B(1.17) |
| CCR5 Signaling in Macrophages | 0.02 | CD247(0.21),CALM3(0.80),PRKCQ(0.78),CD3E(0.24) |
| Melatonin Signaling | 0.02 | CALM3(0.80),PRKCQ(0.78),PDIA3(1.33),PRKAG1(1.22) |
| nNOS Signaling in Skeletal Muscle Cells | 0.02 | CALM3(0.80),RYR1(2.98) |
| Natural Killer Cell Signaling | 0.02 | CD247(0.21),PRKCQ(0.78),FCGR2A(1.60),SH2D1B(0.14),FCGR3A(0.23) |
| Sperm Motility | 0.02 | CALM3(0.80),PRKCQ(0.78),PDIA3(1.33),RARRES3(0.45),PRKAG1(1.22) |
| Synaptic Long Term Potentiation | 0.03 | CALM3(0.80),PRKCQ(0.78),PDIA3(1.33),PRKAG1(1.22),GRINA(2.97) |
| nNOS Signaling in Neurons | 0.03 | CALM3(0.80),PRKCQ(0.78),GRINA(2.97) |
| Protein Ubiquitination Pathway | 0.03 | PSME1(0.87),UBE2L3(1.15),PSMB2(1.14),RBX1(1.17),UBE2D2(1.15),PSME2(0.84),PSMC3(1.12),UBE2C(1.26) |
| Role of NFAT in Regulation of the Immune Response | 0.03 | CD247(0.21),CALM3(0.80),PRKCQ(0.78),CD3E(0.24),FCGR2A(1.60),FCGR3A(0.23) |
| Calcium Signaling | 0.04 | CALM3(0.80),ATP2C1(0.90),HDAC1(0.89),RYR1(2.98),PRKAG1(1.22),GRINA(2.97) |
| D-glucuronate Degradation I | 0.04 | CRYL1(0.63) |
| Lipid Antigen Presentation by CD1 | 0.05 | CD3E(0.24),PDIA3(1.33) |
| T Cell Receptor Signaling | 0.05 | CD247(0.21),CALM3(0.80),PRKCQ(0.78),CD3E(0.24) |
In order to further validate the RNAseq data, 48 genes were randomly chosen and analyzed by RT-QPCR. As evident in Table 4, the QPCR and RNAseq techniques were highly correlated (r=0.91, P < 0.001), thus demonstrating that the RNAseq technology is accurate and robust.
Table 4.
Confirmation of the RNAseq data using QPCR comparing old to young lin−/CD34−/31− cells (r = 0.91, P < 0.001)
| Gene | RNAseq Fold Change | QPCR Fold Change | Expected |
|---|---|---|---|
| MMP8 | 6.78 | 7.91 | Up |
| GSTM5 | 6.57 | 6.35 | Up |
| CAMP | 5.79 | 4.30 | Up |
| BAG3 | 4.51 | 1.76 | Up |
| LTF | 3.93 | 4.50 | Up |
| PROK2 | 3.78 | 3.49 | Up |
| DPP10 | 3.65 | 5.02 | Up |
| ZNF532 | 3.59 | 2.74 | Up |
| PXDN | 3.24 | 2.68 | Up |
| FERMT1 | 3.07 | 2.63 | Up |
| GRINA | 2.97 | 1.03 | Up |
| LCN2 | 2.91 | 2.66 | Up |
| BEX1 | 2.79 | 3.00 | Up |
| ZNF462 | 2.59 | 3.20 | Up |
| STAG3L1 | 2.49 | 0.91 | Up |
| RNF212 | 2.38 | 1.99 | Up |
| GPR52 | 2.23 | 1.43 | Up |
| TREML2 | 2.18 | 0.80 | Up |
| SPARCL1 | 2.18 | 2.36 | Up |
| F8A1 | 2.15 | 1.37 | Up |
| SLITRK4 | 2.13 | 0.47 | Up |
| GOLGA6L10 | 2.11 | 0.98 | Up |
| ETS1 | 0.38 | 0.36 | Down |
| PARM1 | 0.36 | 0.63 | Down |
| ITGAX | 0.36 | 0.25 | Down |
| CASP1 | 0.35 | 0.58 | Down |
| GIMAP8 | 0.31 | 0.15 | Down |
| LINC00410 | 0.31 | 0.30 | Down |
| LAX1 | 0.29 | 0.52 | Down |
| LOC100130231 | 0.28 | 0.16 | Down |
| IKZF3 | 0.26 | 0.28 | Down |
| SLFN5 | 0.26 | 0.27 | Down |
| GIMAP6 | 0.24 | 0.25 | Down |
| CD3E | 0.24 | 0.11 | Down |
| FCGR3A | 0.23 | 0.40 | Down |
| CD226 | 0.22 | 0.41 | Down |
| FCRL1 | 0.22 | 0.18 | Down |
| CD247 | 0.21 | 0.16 | Down |
| AOX2P | 0.18 | 0.18 | Down |
| GRK5 | 0.18 | 0.60 | Down |
| KLRF1 | 0.17 | 0.26 | Down |
| CX3CR1 | 0.16 | 0.16 | Down |
| SH2D1B | 0.14 | 0.06 | Down |
| GZMA | 0.14 | 0.22 | Down |
| S1PR5 | 0.14 | 0.22 | Down |
| SAMD3 | 0.13 | 0.16 | Down |
| GNLY | 0.09 | 0.11 | Down |
| IL18RAP | 0.05 | 0.22 | Down |
Values are presented as fold changes.
Because DNA methylation has important implications for gene expression [4, 23], we next performed RRBS DNA sequencing (methylation sequencing) to identify age-related changes in methylated CpG dinucleotides in lin−/CD34−/CD31− cells. We restricted our methylation analysis to the promoter regions of genes using two different analytical paradigms. In addition, we focused on genes that were also differentially expressed (P < 0.05) in the old versus young subjects. In Methylation Analysis A (Figure 2A, top), we measured methylation between −5000 and +2000, relative to the transcriptional start site (TSS, defined as +1). In Methylation Analysis B (Figure 2A, bottom), we measured methylation closer to the TSS, using −2000 to +500. In general, we observed similar numbers of differentially methylated targets between the young and old subjects using both methods, 1528 and 1445 genes, respectively (Figure 2B, Table S3). The genes using Methylation Analysis B were completely contained within Methylation Analysis A. Overall, our analysis demonstrated significantly (P < 0.001) higher median methylation levels in the lin−/CD34−/CD31− cells from the old as compared to the young subjects.
Figure 2. Whole genome bisulphite DNA sequencing (DNA methylation) of young versus old bone marrow lin−/CD34−/CD31− mesechymal cells.
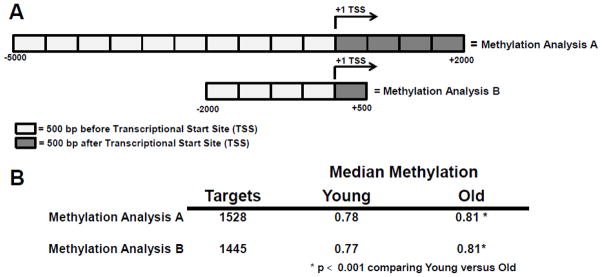
A) Relative to the transcriptional start site (TSS), Methylation Analysis A measured methylation between −5000 and +2000 basepairs (bp) while Methylation Analysis B measured methylation between −2000 to +500 bp of each gene. B) Results of the methylation analyses listing the number of gene targets exhibiting significantly (p < 0.05) differential methylation. The median methylation of all genes contained within each analyses (0 = no methylation, 1 = complete methylation) is also listed and marked with an asterisk (*) denoting statistical significance (p < 0.001) between the young and old groups.
We next compared the 1528 differentially methylated and expressed target genes between the old and young subjects. We found that 758 genes were expressed in the opposite direction of the methylation (i.e., higher methylation and lower gene expression), whereas 770 genes were expressed in the same direction as the methylation (i.e., higher gene expression and higher methylation, Table S4). Since higher methylation has generally been associated with inhibition of gene expression [4], we examined more closely the degree of changes in methylation between the subjects based on whether gene expression was in the opposite direction of methylation as opposed to in the same direction of methylation. For the 758 genes expressed in the opposite direction of the methylation, the relative median methylation difference between genes was 1.2-fold, and for the 770 genes that were expressed in the same direction as the methylation, the relative median methylation difference between genes was also 1.2-fold. Thus, the degree of methylation difference was similar for the 2 groups of genes.
In additional exploratory analyses, we compared our findings to a previous study from Bork et al. [24] where the pattern of DNA methylation changes were examined in human mesenchymal stromal cells either following long term culture or in cultured stromal cells from young versus old subjects. Keeping in mind that there were significant differences in study methods, including the fact that we analyzed uncultured lin−/CD34−/CD31− cells versus cells following in vitro culture by Bork et al. [24] as well as the use of methylation sequencing in our study versus the Human-Methylation27 BeadChip microarray by Bork et al. [24], there were some interesting findings that emerged from this comparison. For this, we used the published data of Bork et al. [24] to identify genes that had significant (P < 0.05) differences in methylation either following long-term in vitro culture or in cultured cells from young versus old subjects as well as in the young versus old lin−/CD34−/CD31− cells in our study. We next required that the gene should be expressed in our dataset using RNAseq (using the criteria described earlier in Materials and Methods), and subsequently that there be a significant (P < 0.05) difference in mRNA expression in our dataset for that gene in the lin−/CD34−/CD31− cells from the young versus old subjects. Table 5 shows the genes meeting all of these criteria. Of note, RUNX3 showed altered methylation with long term in vitro culture and in cultured human mesenchymal cells from young versus old subjects in the study of Bork et al. [24]. It was also differentially methylated and had significantly lower expression in uncultured lin−/CD34−/CD31− cells from old versus young women in our study (Table 5). Also listed in Table 5 are a number of additional genes that showed methylation changes in the study of Bork et al. [24] and in our dataset and also exhibited altered gene expression by RNAseq.
Table 5.
Comparison of our dataset with that of Bork et al. [24]. Listed are the genes that demonstrated significant differences in methylation in both datasets along with significant alterations in gene expression by RNAseq in lin−/CD34−/CD31− from young versus old subjects in our data. Fold changes and P-values are from our dataset. Please see text for further details.
| Gene | Methylation fold change (Old/Young) (P-value) | Gene expression fold change (Old/Young) (P-value) |
|---|---|---|
| Following long term culture in Bork et al. [24] | ||
| RUNX3 | 1.20 (0.042) | 0.54 (0.023) |
| In cultured human stromal cells from young versus old subjects in Bork et al. [24] | ||
| CD226 | 1.33 (<0.001) | 0.22 (<0.001) |
| LAX1 | 1.37 (0.042) | 0.29 (<0.001) |
| RUNX3 | 1.20 (0.042) | 0.54 (0.023) |
| NAPRT1 | 1.54 (0.001) | 0.61 (0.038) |
| HOXB3 | 1.23 (<0.001) | 0.65 (0.003) |
| CDKL1 | 1.21 (<0.001) | 0.71 (0.013) |
| CAPN2 | 1.44 (0.003) | 0.78 (0.018) |
| DHX38 | 1.35 (<0.001) | 0.86 (0.003) |
| ZC3H11A | 1.22 (<0.001) | 0.93 (0.032) |
| POLE3 | 1.22 (<0.001) | 1.14 (<0.001) |
| CTAGE5 | 1.23 (<0.001) | 1.21 (0.014) |
| MLC1 | 1.11 (0.012) | 1.21 (0.008) |
| THRB | 1.10 (0.035) | 1.38 (0.049) |
| PAX9 | 1.11 (0.010) | 1.76 (0.004) |
Discussion
In this study, we examined potential differences in gene expression and DNA methylation patterns in a previously characterized (in humans [5] and in mice [6, 7]), highly enriched population of bone marrow mesenchymal cells (lin−/CD34−/CD31−) from young and old women to better characterize and understand age-related changes that occur in these cells. We utilized a novel technique to rapidly isolate these mesenchymal cells through depletion of all hematopoietic lineage and endothelial/endothelial precursor cells without the need for in vitro culture [5–7]. These cells are highly osteogenic and express typical bone-related marker genes when cultured under osteogenic conditions in vitro [5–7] and form bone in vivo [6, 7]. From this mesenchymal cell population, we isolated RNA and performed RNAseq analysis to identify 279 differentially regulated genes between young and old subjects. To our knowledge, this is the first report to identify differentially regulated genes with aging in a highly enriched human bone marrow mesenchymal cell population.
Pathway analysis of these differentially regulated genes between young and old subjects revealed that cellular processes involving protein translation and degradation were significantly altered with aging. Protein translation is catalyzed by 40S and 60S ribosomal subunits, consisting of 4 RNA species and approximately 80 distinct ribosomal proteins. As noted earlier, our data reveal that 14 ribosomal proteins were significantly down-regulated in the mesenchymal cells isolated from the old subjects, suggesting that protein synthesis may be less active or robust in aged mesenchymal cells.
Regulated degradation of misfolded, short-lived, or damaged proteins is a normal cellular process that is mediated by the ubiquitin-proteasome system, and has been extensively described elsewhere (reviewed in [22]). Dysfunction of this system through altered expression and/or activity of its individual components can disrupt cellular homeostasis, leading to a host of age-related degenerative disorders [25]. The binding of free ubiquitin by ubiquitin-activating enzymes (E1) is the first step in the ubiquitination process. Interestingly, expression of UBA2, UBA3, and UBA7 E1 enzymes were decreased in the mesenchymal cells isolated from old subjects, suggesting that protein degradation may also be impaired in the aging process. Indeed, decreased proteasomal activity associated with aging has been widely reported [26–28]. We also found that the E2 ubiquitin-conjugating enzymes UBE2C, UBE2D2, and UBE2L3, as well as the E3 ubiquitin ligase RBX1, were upregulated with aging. These may represent compensatory mechanisms to the decreased expression of the E1 ubiquitin-activating enzymes described above. Taken together, the alterations in these pathways suggest that both protein synthesis and degradation are negatively affected by the aging process. Thus, an underlying dysregulation in protein synthesis and/or turnover in bone marrow mesenchymal cells from old as compared to young women may contribute to impaired osteoblast formation and/or function in the old subjects, and this possibility warrants further investigation.
The IPA analysis also identified additional regulated cellular pathways in the lin−/CD34−/CD31− mesenchymal cell population with known roles in the aging process. For example, the mechanistic target of rapamycin (mTOR) pathway was significantly regulated during aging (p < 0.01). Since modulation of mTOR signaling by various drugs or dietary interventions affects lifespan in numerous models organisms [29], it is not surprising that this pathway is important in these mesenchymal cells during aging. It is intriguing that one of the major downstream processes regulated by mTOR signaling is protein translation, which occurs through the promotion of ribosome biosynthesis [30], and this was also regulated in the lin−/CD34−/CD31− cells, as described above. Other regulated pathways, such as gap junction signaling, calcium signaling, melatonin signaling, and nuclear factor of activated T-cells (NFAT) signaling all have established roles in aging [31–34]. On the other hand, the IPA also identified pathways that, to date, have little or no known role in aging (see Table 2). Future investigation of these pathways is necessary to ascertain their involvement in the aging process.
As noted earlier, lin−/CD34−/CD31− cells expressed mRNAs for several early osteoblast/mesenchymal cell markers, consistent with our previous characterization of these cells [5–7]. However, the expression of these osteoblast/mesenchymal marker genes was not different between the young versus old subjects, suggesting that if there is a “block” in osteoblast differentiation and/or function with aging, it occurs at a later stage in the osteoblast lineage than that reflected by the lin−/CD34−/CD31− cells.
We also examined the DNA methylation status of the lin−/CD34−/CD31− mesenchymal cells in young and old subjects and found, on average, DNA hypermethylation surrounding the promoter regions of ~1500 differentially methylated genes with aging. In contrast to our findings, previous studies have reported that mammalian cells underwent a DNA methylation drift during the normal aging process resulting in an overall global decrease in DNA methylation [35], although this occurred predominantly in repetitive DNA sequences and constitutive heterochromatin. One possible mechanism for loss of global DNA methylation during aging is loss of efficacy of the DNA methyltransferase Dnmt1 [36]. While complex and incompletely understood, the current paradigm suggests that global loss of DNA methylation also causes overexpression of Dnmt3b, resulting in hypermethylation of promoter-specific CpG islands [36]. Indeed, DNA hypermethylation during aging occurs at the promoters of numerous genes such as estrogen receptor-alpha (ERα), insulin-like growth factor 2 (IGF2), lysyl oxidase (LOX), runt-related transcription factor 3 (RUNX3), E-cadherin (CDH1), c-fos, and collagen 1a1 (COL1A1), among others [37–40]. Therefore it is perhaps not surprising that the differentially methylated genes in the lin−/CD34−/CD31− cells in the current study were (on average) hypermethylated with age, since we restricted our DNA methylation analysis to regions surrounding gene transcriptional start sites (e.g. promoter regions). We also examined the expression patterns of DNMT1, DNMT3A and DNMT3B during aging, and found no differences between young and old subjects (data not shown), although we did not measure the enzymatic activity of these proteins. Nonetheless, taken together, our data suggest that in bone marrow mesenchymal cells (lin−/CD34−/CD31−), select promoters become hypermethylated with advanced age.
A unique aspect of this study is that both transcriptional regulation and DNA methylation status were measured in the same subjects. DNA methylation is known to correlate with transcriptional regulation, particularly transcriptional repression [4]. Indeed, we found that roughly half of those genes exhibiting differential DNA methylation were transcriptionally repressed, whereas the other half were transcriptionally activated. It is possible that the differentially methylated CpG dinucleotides may mask a repressor element, leading to transcriptional activation. Further studies at single promoters of these genes are necessary to ascertain the mechanisms.
As part of our analysis, we also compared our methylation data to that previously published by Bork et al. [24] using cultured human bone marrow stromal cells. These investigators compared alterations in DNA methylation in these cells either following prolonged in vitro culture or in cultured mesenchymal stromal cells from young versus old subjects. Comparing our dataset to theirs, we identified a number of genes that showed differential methylation in their dataset and in ours and also demonstrated altered gene expression by RNAseq in our study (Table 5). Of particular interest was RUNX3, which met these criteria and showed increased methylation (by 20%) and reduced gene expression (by 46%) in the lin−/CD34−/CD31− cells from the old as compared to the young subjects. Although the role of RUNX2 as the master regulator of bone formation is well established [41], recent studies have found that RUNX3 also plays an important role in skeletal development in that RUNX3-deficient mice develop severe congenital osteopenia associated with impaired bone formation [42]. Moreover, human RUNX3 resides on chromosome 1p36, a region that is associated with osteoporosis [43]. Thus, the consistent pattern of altered methylation with prolonged in vitro culture and in cultured young versus old bone marrow mesenchymal cells in the study of Bork et al. [24] and the altered methylation and gene expression observed in our data in young versus old lin−/CD34−/CD31− cells suggests that altered methylation and expression of RUNX3 may play an important role in mediating the impaired bone formation with aging. Clearly, this possibility warrants further study.
We recognize that the current study has several limitations. For example, although we used negative selection to deplete the bone marrow of hematopoietic lineage and endothelial/endothelial precursor cells, the resulting cell population is not completely homogeneous. Nonetheless, this cell population is highly enriched for mesenchymal cells and specifically, osteoprogenitor cells, as previously documented [5–7]. Additionally, while we previously demonstrated that this cell population can differentiate into osteoblasts, as evidenced by robust mineralization when cultured under osteogenic conditions in vitro, as well as into adipocytes [5], we have not yet explored whether these cells can differentiate into other cell lineages, such as myocytes or cartilage cells. Our data therefore represent gene expression and DNA methylation patterns from a highly enriched mesenchymal cell population that is capable of at least osteoblastic and adipocytic cell differentiation. Further studies are needed to ascertain the ability of this and similar cell populations in differentiating into other cell lineages. We also recognize that although we performed RNAseq and DNA methylation analyses in this cell population, we did not ascertain potential age-related changes in microRNA (miRNA) expression. Alterations in miRNA expression could certainly influence the gene expression patterns and/or protein translation of targeted mRNAs; however, this analysis was beyond the scope of this report. Our identification of putative pathways altered by age in this cell population suggests future experiments where the effects of miRNAs can be examined in a more focused manner. An additional point is that our study subjects were rigorously screened to exclude women with diseases or drugs known to affect bone metabolism, and as such, the findings may not be applicable to all aging women. Using the approaches developed here, additional studies need to be done in the future examining aging women (and men) with conditions that may alter bone metabolism (e.g., glucocorticoid use, hyperparathyroidism, etc.). We also recognize that the old women differed from the young women not only in terms of age, but also in terms of estrogen status. Given that we did not analyze lin−/CD34−/CD31− cells from old women treated with estrogen using similar techniques (RNAseq and Methseq), it is very difficult to compare findings in this study with previous studies where we analyzed a somewhat different mesenchymal cell population (lin−/Stro1+ cells) using RT-QPCR [44]. Thus, further studies are needed to dissect the effects of age separately from estrogen deficiency, using an additional group of estrogen-treated postmenopausal women. Finally, although the young and old women were generally well matched, BMI did tend (not unexpectedly) to be somewhat higher in the old women. As we did not control for this, we acknowledge that this could have influenced our findings, although given the relatively small difference in BMI (~12%) this effect, if present, is likely to be minimal.
In conclusion, we have for the first time identified age-related differential gene expression and DNA methylation patterns in a highly enriched human bone marrow mesenchymal cell population. Importantly, these cells were obtained from humans and analyzed for gene expression and DNA methylation patterns without being subjected to the confounding effects of in vitro culture. Moreover, we identified numerous cellular pathways and processes that are modulated with aging, some of which have already been implicated in aging, but also others that are completely novel. Our finding of alterations in several genes and pathways leading to impaired protein synthesis and turnover with aging in bone marrow mesenchymal cells points to the need for further studies examining how these defects may contribute to the age-related impairment in osteoblast formation and/or function [1]. In addition to expanding our understanding of the effects of aging on bone marrow mesenchymal cells, these studies provide a basis for further animal studies to modulate the pathways we identified as being altered with aging in these cells and to assess the impact of such interventions on treating age-related degenerative disorders, such as osteoporosis.
Supplementary Material
Highlights.
We harvest and characterize, without in vitro culture, mesenchymal cells form human bone marrow capable of osteogenic differentiation
Our analysis includes both RNA sequencing as well as a global analysis of DNA methylation patterns
We identify 279 genes in these cells associated with aging, along with key pathways alterations
We also identify 1528 genes with methylation differences between young and old subjects; these also exhibited altered gene expression
These studies provide novel insights into potential pathways affected by aging in a highly enriched human mesenchymal cell population
Acknowledgments
This research was supported by NIH Grants P01 AG004875 and UL1TR000135 (Mayo CTSA), funding from the Mayo Clinic Center for Individualized Medicine, and the Mayo Kogod Center on Aging. The Mayo Clinic Medical Genome Facility is supported by NCI grant CA15083 and the Mayo Clinic Center for Individualized Medicine.
Footnotes
Publisher's Disclaimer: This is a PDF file of an unedited manuscript that has been accepted for publication. As a service to our customers we are providing this early version of the manuscript. The manuscript will undergo copyediting, typesetting, and review of the resulting proof before it is published in its final citable form. Please note that during the production process errors may be discovered which could affect the content, and all legal disclaimers that apply to the journal pertain.
Contributor Information
Matthew M. Roforth, Email: roforth.matthew@mayo.edu.
Joshua N. Farr, Email: farr.joshua@mayo.edu.
Koji Fujita, Email: fkojikoji77@gmail.com.
Louise K. McCready, Email: mccready.louise@mayo.edu.
Elizabeth J. Atkinson, Email: atkinson@mayo.edu.
Terry M. Therneau, Email: therneau@mayo.edu.
Julie M. Cunningham, Email: cunningham.julie@mayo.edu.
Matthew T. Drake, Email: drake.matthew@mayo.edu.
David G. Monroe, Email: monroe.david@mayo.edu.
Sundeep Khosla, Email: khosla.sundeep@mayo.edu.
References
- 1.Khosla S. Pathogenesis of age-related bone loss in humans. J Gerontol A Biol Sci Med Sci. 2013;68:1226–35. doi: 10.1093/gerona/gls163. [DOI] [PMC free article] [PubMed] [Google Scholar]
- 2.Zhou S, Greenberger JS, Epperly MW, Goff JP, Adler C, Leboff MS, Glowacki J. Age-related intrinsic changes in human bone-marrow-derived mesenchymal stem cells and their differentiation to osteoblasts. Aging Cell. 2008;7:335–43. doi: 10.1111/j.1474-9726.2008.00377.x. [DOI] [PMC free article] [PubMed] [Google Scholar]
- 3.Munoz-Najar U, Sedivy JM. Epigenetic control of aging. Antioxid Redox Signal. 2011;14:241–59. doi: 10.1089/ars.2010.3250. [DOI] [PMC free article] [PubMed] [Google Scholar]
- 4.Goll MG, Bestor TH. Eukaryotic cytosine methyltransferases. Annu Rev Biochem. 2005;74:481–514. doi: 10.1146/annurev.biochem.74.010904.153721. [DOI] [PubMed] [Google Scholar]
- 5.Modder UI, Roforth MM, Nicks KM, Peterson JM, McCready LK, Monroe DG, Khosla S. Characterization of mesenchymal progenitor cells isolated from human bone marrow by negative selection. Bone. 2012;50:804–810. doi: 10.1016/j.bone.2011.12.014. [DOI] [PMC free article] [PubMed] [Google Scholar]
- 6.Itoh S, Aubin JE. A novel purification method for multipotential skeletal stem cells. J Cell Biochem. 2009;108:368–377. doi: 10.1002/jcb.22262. [DOI] [PubMed] [Google Scholar]
- 7.Mckenzie KP, Mayer DC, Aubin JE. Osteogenesis and expression of the bone marrow niche in endothelial cell-deleted HipOPs. J Cell Biochem. 2013;114:1066–1073. doi: 10.1002/jcb.24446. [DOI] [PubMed] [Google Scholar]
- 8.Dafforn A, Chen P, Deng G, Herrler M, Iglehart D, Koritala S, Lato S, Pillarsietty S, Purohit R, Wang M, Wang S, Kurn N. Linear mRNA amplification from as little as 5ng total RNA for global gene expression. Biotechniques. 2004;37:854–857. doi: 10.2144/04375PF01. [DOI] [PubMed] [Google Scholar]
- 9.Nygaard V, Hovig E. Options available for profiling small samples: a review of sample amplification technology when combined with microarray profiling. Nucleic Acids Res. 2006;34:996–1014. doi: 10.1093/nar/gkj499. [DOI] [PMC free article] [PubMed] [Google Scholar]
- 10.Radonic A, Thulke S, Mackay IM, Landt O, Siegert W, Nitsche A. Guideline to reference gene selection for quantitative real-time PCR. Biochem Biophys Res Commun. 2004;313:856–862. doi: 10.1016/j.bbrc.2003.11.177. [DOI] [PubMed] [Google Scholar]
- 11.Vandesompele J, De Preter K, Pattyn F, Poppe B, Van Roy N, De Paepe A, Speleman F. Accurate normalization of real-time quantitative RT-PCR data by geometeric averaging of multiple internal control genes. Genome Biol. 2002;3:research0034.1-0-34.11. doi: 10.1186/gb-2002-3-7-research0034. [DOI] [PMC free article] [PubMed] [Google Scholar]
- 12.Fujita K, Roforth MM, Atkinson EJ, Peterson JM, Drake MT, McCready LK, Farr JN, Monroe DG, Khosla S. Isolation and characterization of human osteoblasts from needle biopsies without in vitro culture. Osteoporos Int. 2014;25:887–95. doi: 10.1007/s00198-013-2529-9. [DOI] [PMC free article] [PubMed] [Google Scholar]
- 13.Ramskold D, Wang ET, Burge CB, Sandberg R. An abundance of ubiquitously expressed genes revealed by tissue transcriptome sequence data. PLoS Comput Biol. 2009;5:e1000598. doi: 10.1371/journal.pcbi.1000598. [DOI] [PMC free article] [PubMed] [Google Scholar]
- 14.Wagner GP, Kin K, Lynch VJ. Measurement of mRNA abundance using RNA-seq data: RPKM measure is inconsistent among samples. Theory Biosci. 2012;131:281–284. doi: 10.1007/s12064-012-0162-3. [DOI] [PubMed] [Google Scholar]
- 15.Hansen KD, Irizarry RA, Wu Z. Removing technical variability in RNA-seq data using conditional quantile normalization. Biostatistics. 2012;13:204–16. doi: 10.1093/biostatistics/kxr054. [DOI] [PMC free article] [PubMed] [Google Scholar]
- 16.Robinson MD, McCarthy DJ, Smyth GK. edgeR: a Bioconductor package for differential expression analysis of digital gene expression data. Bioinformatics. 2010;26:139–40. doi: 10.1093/bioinformatics/btp616. [DOI] [PMC free article] [PubMed] [Google Scholar]
- 17.Sun Z, Baheti S, Middha S, Kanwar R, Zhang Y, Li X, Beutler AS, Klee E, Asmann YW, Thompson EA, Kocher JP. SAAP-RRBS: streamlined analysis and annotation pipeline for reduced representation bisulfite sequencing. Bioinformatics. 2012;28:2180–1. doi: 10.1093/bioinformatics/bts337. [DOI] [PMC free article] [PubMed] [Google Scholar]
- 18.Roforth MM, Fujita K, McGregor UI, Kirmani S, McCready LK, Peterson JM, Drake MT, Monroe DG, Khosla S. Efftects of age on bone mRNA levels of sclerostin and other genes relevant to bone metabolism in humans. Bone. 2014;59:1–6. doi: 10.1016/j.bone.2013.10.019. [DOI] [PMC free article] [PubMed] [Google Scholar]
- 19.Zhou BO, Yue R, Murphpy MM, Peyer JG, Morrison SJ. Leptin-receptor-expressing mesenchymal stromal cells represent the main source of bone formed by adult bone marrow. Cell Stem Cell. 2014;15:154–168. doi: 10.1016/j.stem.2014.06.008. [DOI] [PMC free article] [PubMed] [Google Scholar]
- 20.Reiner A, Yekutieli D, Benjamini Y. Identifying differentially expressed genes using false discovery rate controlling procedures. Bioinformatics. 2003;19:368–375. doi: 10.1093/bioinformatics/btf877. [DOI] [PubMed] [Google Scholar]
- 21.Hirakawa A, Sato Y, Sozu T, Hamada C, Yoshimura I. Estimating the false discovery rate using mixed normal distribution for identifying differentially expressed genes in microarray data analysis. Cancer Inform. 2008;22:140–148. [PMC free article] [PubMed] [Google Scholar]
- 22.Hershko A, Ciechanover A. The ubiquitin system for protein degradation. Annu Rev Biochem. 1992;61:761–807. doi: 10.1146/annurev.bi.61.070192.003553. [DOI] [PubMed] [Google Scholar]
- 23.Phillips T. The role of methylation in gene expression. Nature Education. 2008;1:116. [Google Scholar]
- 24.Bork S, Pfister S, Witt H, Horn P, Korn B, Ho AD, Wagner W. DNA methylation pattern changes upon long-term culture and aging of human mesenchymal stromal cells. Aging Cell. 2010;9:54–63. doi: 10.1111/j.1474-9726.2009.00535.x. [DOI] [PMC free article] [PubMed] [Google Scholar]
- 25.Cuanalo-Contreras K, Mukherjee A, Soto C. Role of Protein Misfolding and Proteostasis Deficiency in Protein Misfolding Diseases and Aging. Int J Cell Biol. 2013;2013:638083. doi: 10.1155/2013/638083. [DOI] [PMC free article] [PubMed] [Google Scholar]
- 26.Hwang JS, Chang I, Kim S. Age-associated decrease in proteasome content and activities in human dermal fibroblasts: restoration of normal level of proteasome subunits reduces aging markers in fibroblasts from elderly persons. J Gerontol A Biol Sci Med Sci. 2007;62:490–9. doi: 10.1093/gerona/62.5.490. [DOI] [PubMed] [Google Scholar]
- 27.Tydlacka S, Wang CE, Wang X, Li S, Li XJ. Differential activities of the ubiquitin-proteasome system in neurons versus glia may account for the preferential accumulation of misfolded proteins in neurons. J Neurosci. 2008;28:13285–95. doi: 10.1523/JNEUROSCI.4393-08.2008. [DOI] [PMC free article] [PubMed] [Google Scholar]
- 28.Keller JN, Huang FF, Markesbery WR. Decreased levels of proteasome activity and proteasome expression in aging spinal cord. Neuroscience. 2000;98:149–56. doi: 10.1016/s0306-4522(00)00067-1. [DOI] [PubMed] [Google Scholar]
- 29.Kaeberlein M. mTOR Inhibition: From Aging to Autism and Beyond. Scientifica. 2013;2013:849186. doi: 10.1155/2013/849186. [DOI] [PMC free article] [PubMed] [Google Scholar]
- 30.Kennedy BK, Kaeberlein M. Hot topics in aging research: protein translation, 2009. Aging Cell. 2009;8:617–23. doi: 10.1111/j.1474-9726.2009.00522.x. [DOI] [PMC free article] [PubMed] [Google Scholar]
- 31.Huang TY, Hanani M, Ledda M, De Palo S, Pannese E. Aging is associated with an increase in dye coupling and in gap junction number in satellite glial cells of murine dorsal root ganglia. Neuroscience. 2006;137:1185–92. doi: 10.1016/j.neuroscience.2005.10.020. [DOI] [PubMed] [Google Scholar]
- 32.Hoskins B, Scott JM. Changes in activities of calmodulin-mediated enzymes in rat brain during aging. Mech Ageing Dev. 1984;26:231–9. doi: 10.1016/0047-6374(84)90096-4. [DOI] [PubMed] [Google Scholar]
- 33.Hardeland R. Melatonin and the theories of aging: a critical appraisal of melatonin’s role in antiaging mechanisms. J Pineal Res. 2013;55:325–56. doi: 10.1111/jpi.12090. [DOI] [PubMed] [Google Scholar]
- 34.Oliveira AM, Bading H. Calcium signaling in cognition and aging-dependent cognitive decline. BioFactors. 2011;37:168–74. doi: 10.1002/biof.148. [DOI] [PubMed] [Google Scholar]
- 35.Wilson VL, Jones PA. DNA methylation decreases in aging but not in immortal cells. Science. 1983;220:1055–7. doi: 10.1126/science.6844925. [DOI] [PubMed] [Google Scholar]
- 36.Casillas MA, Jr, Lopatina N, Andrews LG, Tollefsbol TO. Transcriptional control of the DNA methyltransferases is altered in aging and neoplastically-transformed human fibroblasts. Mol Cell Biochem. 2003;252:33–43. doi: 10.1023/a:1025548623524. [DOI] [PubMed] [Google Scholar]
- 37.Issa JP. Age-related epigenetic changes and the immune system. Clin Immunol. 2003;109:103–8. doi: 10.1016/s1521-6616(03)00203-1. [DOI] [PubMed] [Google Scholar]
- 38.Bornman DM, Mathew S, Alsruhe J, Herman JG, Gabrielson E. Methylation of the E-cadherin gene in bladder neoplasia and in normal urothelial epithelium from elderly individuals. Am J Pathol. 2001;159:831–5. doi: 10.1016/S0002-9440(10)61758-0. [DOI] [PMC free article] [PubMed] [Google Scholar]
- 39.Choi EK, Uyeno S, Nishida N, Okumoto T, Fujimura S, Aoki Y, Nata M, Sagisaka K, Fukuda Y, Nakao K, Yoshimoto T, Kim YS, Ono T. Alterations of c-fos gene methylation in the processes of aging and tumorigenesis in human liver. Mutat Res. 1996;354:123–8. doi: 10.1016/0027-5107(96)00056-5. [DOI] [PubMed] [Google Scholar]
- 40.Takatsu M, Uyeno S, Komura J, Watanabe M, Ono T. Age-dependent alterations in mRNA level and promoter methylation of collagen alpha1(I) gene in human periodontal ligament. Mech Ageing Dev. 1999;110:37–48. doi: 10.1016/s0047-6374(99)00041-x. [DOI] [PubMed] [Google Scholar]
- 41.Ducy P, Zhang R, Geoffroy V, Ridall AL, Karsenty G. Osf2/Cbfa1: a transcriptional activator of osteoblast differentiation. Cell. 1997;89:747–754. doi: 10.1016/s0092-8674(00)80257-3. [DOI] [PubMed] [Google Scholar]
- 42.Bauer O, Sharir A, Kimura A, Hantisteanu S, Takeda S, Groner Y. Loss of osteoblast Runx3 produces severe congenital osteopenia. Mol Cell Biol. 2015 doi: 10.1128/MCB.01106-14. pii: MCB.01106-14 [Epub ahead of print] [DOI] [PMC free article] [PubMed] [Google Scholar]
- 43.Devoto M, Shimoya K, Caminis J, Ott J, Tenenhouse A, Whyte MP, Sereda L, Hall S, Considine E, Williams CJ, Tromp G, Kuivaniemi H, Ala-Kokko L, Prockop DJ, Spotial LD. First-stage autosomal genome screen in extended pedigrees suggests genes predisposing to low bone mineral density on chromosomes 1p, 2p, and 4q. Eur J Hum Genet. 1998;6:151–157. doi: 10.1038/sj.ejhg.5200169. [DOI] [PubMed] [Google Scholar]
- 44.Modder UI, Roforth MM, Hoey K, McCready LK, Peterson JM, Monroe DG, Oursler MJ, Khosla S. Effects of estrogen on osteoprogenitor cells and cytokines/bone regulatory factors in postmenopausal women. Bone. 2011;49:202–207. doi: 10.1016/j.bone.2011.04.015. [DOI] [PMC free article] [PubMed] [Google Scholar]
Associated Data
This section collects any data citations, data availability statements, or supplementary materials included in this article.