

Abstract
KRAS mutations are one of the most common driver mutations in non-small-cell lung cancer (NSCLC) and finding druggable target molecules to inhibit oncogenic KRAS signaling is a significant challenge in NSCLC therapy. We recently identified epiregulin (EREG) as one of several putative transcriptional targets of oncogenic KRAS signaling in both KRAS-mutant NSCLC cells and immortalized bronchial epithelial cells expressing ectopic mutant KRAS. In the current study, we found that EREG is overexpressed in NSCLCs harboring KRAS, BRAF or EGFR mutations compared with NSCLCs with wild-type KRAS/BRAF/EGFR. Small interfering RNAs (siRNAs) targeting mutant KRAS, but not an siRNA targeting wild-type KRAS, significantly reduced EREG expression in KRAS-mutant and EREG-overexpressing NSCLC cell lines. In these cell lines, EREG expression was downregulated by MEK and ERK inhibitors. Importantly, EREG expression significantly correlated with KRAS expression or KRAS copy number in KRAS-mutant NSCLC cell lines. Further expression analysis using 89 NSCLC specimens showed that EREG was predominantly expressed in NSCLCs with pleural involvement, lymphatic permeation or vascular invasion and in KRAS-mutant adenocarcinomas. In addition, multivariate analysis revealed that EREG expression is an independent prognostic marker and EREG overexpression in combination with KRAS mutations was associated with an unfavorable prognosis for lung adenocarcinoma patients. In KRAS-mutant and EREG overexpressing NSCLC cells, siRNA-mediated EREG silencing inhibited anchorage-dependent and -independent growth and induced apoptosis. Our findings suggest that oncogenic KRAS-induced EREG overexpression contributes to an aggressive phenotype and could be a promising therapeutic target in oncogenic KRAS-driven NSCLC.
Keywords: NSCLC, KRAS, EREG, therapeutic target
INTRODUCTION
Lung cancer is the leading cause of cancer-related deaths worldwide.1 Lung cancer comprises two major histological types: small-cell lung cancer (SCLC) and non-small-cell lung cancer (NSCLC), and the latter represents 80–85% of all lung cancers.2 NSCLC is further histologically classified into three major subtypes: adenocarcinoma, squamous cell carcinoma and large cell carcinoma, and the most common subtype is adenocarcinoma.3 The development of lung cancer involves a number of genetic and epigenetic alterations, many of which may represent potential therapeutic targets.2 The proto-oncogene KRAS is one of the most attractive therapeutic targets because KRAS mutations are frequently found in NSCLC (especially in adenocarcinoma) and are associated with a poor prognosis for NSCLC patients.2,4,5
KRAS encodes a small GTP-binding protein that sits at the hub of multiple signaling cascades and is involved in many cellular processes, including cell proliferation and apoptosis.6 Wild-type KRAS has intrinsic GTPase activity, which catalyzes the hydrolysis of bound GTP to GDP, and KRAS mutations impair GTPase activity, thereby deregulating several signaling pathways and downstream effectors in the GTP-bound form. Recently, we identified epiregulin (EREG) as one of several putative transcriptional targets of oncogenic KRAS signaling in both KRAS-mutant NSCLC cells and immortalized bronchial epithelial cells expressing ectopic mutant KRAS.7 EREG is a member of the epidermal growth factor (EGF) family and was originally purified from conditioned medium from mouse tumorigenic fibroblast NIH/3T3 clones.8 EREG has broad receptor specificity; it stimulates not only homodimers of EGFR and HER-4 but also all possible heterodimeric HER complexes.9,10 EREG is expressed at relatively low levels in most adult normal tissues but is highly expressed in various human cancers including colon, bladder, pancreatic, breast and NSCLC.11–19 Although accumulating evidence indicates the possible involvement of EREG in tumorigenesis, the oncogenic effects of high-level tumor-specific expression of EREG and its relationship to KRAS in lung cancer remain unknown. Here, we describe that KRAS mutations along with increased KRAS copy number induce EREG overexpression, which contributes to an aggressive phenotype and an unfavorable prognosis in KRAS-mutant NSCLC, suggesting that EREG could be a therapeutic target for oncogenic KRAS-driven NSCLC.
RESULTS
We first examined EREG expression in a panel of NSCLC cell lines (12 KRAS-mutant, four BRAF-mutants, nine EGFR-mutants and 10 lines with wild-type KRAS/BRAF/EGFR) by quantitative RT–PCR analysis. There were significant differences in EREG expression levels among these groups, and EREG was predominantly expressed in NSCLCs harboring KRAS, BRAF or EGFR mutations (Figure 1a). In contrast, EREG expression levels were extremely low in most small-cell lung cancer cell lines; EREG expression was undetectable in 87% (20/23) of SCLCs (data not shown). We further tested whether elevated EREG expression is oncogenic KRAS-dependent in NSCLC cells. In KRAS-mutant NSCLC cell lines, in which EREG is most highly expressed (Figure 1a), small interfering RNAs (siRNAs) targeting mutant KRAS, but not an siRNA targeting wild-type KRAS, significantly reduced EREG expression compared with the untreated controls (Figures 1b, c). Thus, we confirmed our microarray results,7 showing that EREG is a transcriptional target of oncogenic KRAS signaling in NSCLC cells.
Figure 1.

(a) Expression of EREG mRNA in human bronchial epithelial cell lines (noncancerous cells; N = 5), NSCLC cell lines with wild-type EGFR/BRAF/KRAS (EGFR/BRAF/KRAS WT; N = 10), NSCLC cell lines harboring EGFR mutations (EGFR Mut; N = 9), BRAF mutations (BRAF Mut; N = 4) or KRAS mutations (KRAS Mut; N = 12). Significant differences were observed among all groups (P < 0.0001, Kruskal–Wallis test). The points represent the mean EREG levels from four independent experiments. The lines represent the median levels in each group. (b) The mutant KRAS transcripts and the wild-type KRAS transcripts were specifically reduced by mutant KRAS siRNAs and a wild-type KRAS siRNA, respectively. BstNI digestion produces a 156 bp DNA fragment (WT) in cells that have wild-type KRAS alleles (for example, H1299 cells), whereas a 186 bp DNA fragment (Mut) remained uncut in cells that have a mutant KRAS allele but no wild-type alleles. (c) siRNA-mediated EREG silencing in KRAS-mutant NSCLC cell lines, H1792, HCC4017, H441 and H358. For KRAS mutant-specific knockdown, an siRNA against KRAS G12C mutant was used for H358, HCC4017 and H1792, and an siRNA against KRAS G12V mutant was used for H441. NT, non-treatment; siControl, Tax siRNA-transfected cells; siKRAS-Mut, siRNA against mutant KRAS transfected cells; siKRAS-WT, siRNA against wild-type KRAS transfected cells. *P < 0.05; **P < 0.01; ***P < 0.001 for comparison with NT by the Kruskal–Wallis test with Dunn’s Multiple Comparison.
Previous studies have suggested that activation of ERK mediates EREG upregulation.17,20,21 Therefore, to investigate the regulatory mechanisms of EREG expression in NSCLC cells with KRAS mutations, KRAS-mutant NSCLC cells were treated with selective inhibitors of MEK or ERK. In all cell lines, EREG expression was significantly downregulated by inhibitors of MEK (U0126) or ERK (FR180204) (Figure 2). These findings strongly indicate that EREG expression is upregulated through oncogenic KRAS-induced activation of the RAS/RAF/MAPK pathway. In addition, in EREG-overexpressing NSCLC cells with wild-type KRAS, inhibition of MEK or ERK resulted in a decrease in EREG expression levels (Supplementary Figure 1), indicating that the EGFR/RAS/RAF/MAPK pathway activation is also essential for EREG upregulation in NSCLC cells with wild-type KRAS.
Figure 2.
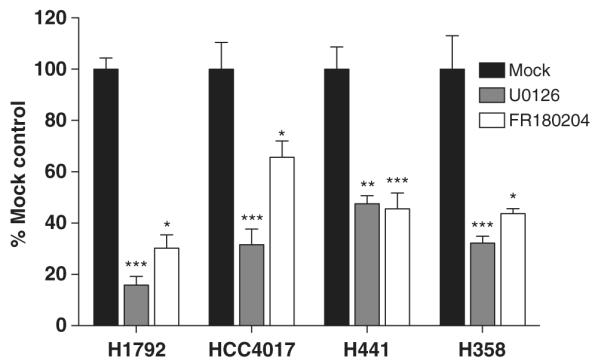
The effects of U0126 (MEK inhibitor) and FR180204 (ERK inhibitor) on EREG expression in KRAS-mutant NSCLC cell lines. Twenty-four hours after 5 × 10⁵ cells were plated in each well of six-well plates, cultured medium was replaced with 2 ml of the growth medium with U0126 (10 μM) or FR180204 (10 μM). After culture for an additional 6 h, the cells were harvested for subsequent quantitative RT–PCR analysis. The columns represent the means ± s.d. of 8 determinants from two independent experiments. *P < 0.05; **P < 0.01; ***P < 0.001 for comparison with mock treatment (DMSO alone) by the Kruskal–Wallis test with Dunn’s Multiple Comparison.
We observed a significant correlation between EREG and KRAS expression in a subgroup of KRAS-mutant NSCLC lines but not in NSCLC lines without KRAS mutations (Figure 3a). Previously, we demonstrated that KRAS copy number gains (CNGs) are associated with increased mutant allele transcription and gene activity,22 and we confirmed that KRAS expression significantly correlated with KRAS copy number in KRAS-mutant NSCLC cell lines (Figure 3b). We next analyzed the association between EREG expression and KRAS copy number in KRAS-mutant NSCLC cell lines. As expected, there was a significant correlation between EREG expression and KRAS copy number in a subgroup of KRAS-mutant NSCLCs (Figure 3c). These results suggest that KRAS CNGs enhance oncogenic KRAS-dependent activation of the RAS/RAF/MAPK pathway, which in turn leads to EREG overexpression in NSCLC cells. We also investigated whether EREG expression is correlated with EGFR expression or EGFR copy number in NSCLC cell lines, as a previous study reported that EREG expression is EGFR dependent.17 Although EGFR expression was strongly correlated with EGFR copy number in both the whole group and an EGFR-mutant subgroup (Supplementary Figure 2A), EREG expression was not significantly correlated with EGFR expression or EGFR copy number (Supplementary Figures 2B, C); however, this should be verified using a larger number of EGFR-mutant NSCLC samples.
Figure 3.
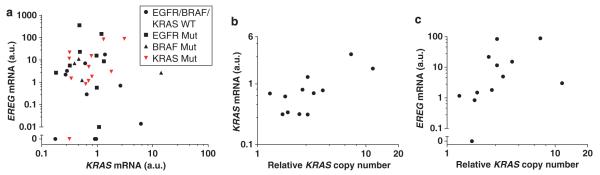
Significant correlations were observed (a) between EREG expression and KRAS expression (Pearson r = 0.7043, P = 0.0106), (b) between KRAS expression and KRAS copy number (Pearson r = 0.7256, P = 0.0076) and (c) between EREG expression and KRAS copy number (Spearman r = 0.6970, P = 0.0142) in KRAS-mutant NSCLC cell lines.
We next examined EREG mRNA expression in surgical specimens from 89 NSCLC patients by quantitative RT–PCR and analyzed the association between EREG expression and clinicopathological parameters (Supplementary Table 1). First, we validated that the EREG mRNA expression levels in lung adenocarcinoma tumors significantly correlated with EREG protein expression levels, as evaluated by immunohistochemical analysis (Figures 4a–d, Supplementary Figure 3). Quantitative RT–PCR analysis revealed that EREG mRNA expression was significantly higher in adenocarcinomas than in squamous cell carcinomas (Figure 4e), whereas no significant differences in EREG mRNA levels were observed according to gender, age, smoking status and pathological stages (data not shown). In addition, EREG expression was significantly higher in tumor specimens with pleural involvement, lymphatic permeation or vascular involvement than those without such characteristics (Figure 4e).
Figure 4.

Representative figures of the immunohistochemical staining of EREG protein are shown in (a, b) an EREG-overexpressing tumor (EREG mRNA level = 142.1 a.u.; EREG protein score = 4) and (c, d) an EREG-undetectable tumor (EREG mRNA level = 0.0 a.u.; EREG protein score = 0). In Figures 4(a, b), cytoplasmic and nuclear staining of epiregulin was observed in the tumor, consistent = with a previous study.19 (e) Comparisons of EREG mRNA expression levels between lung adenocarcinomas versus squamous cell carcinomas (P = 0.0265), between tumors with or without pleural involvement (P = 0.0013), between tumors with or without lymphatic permeation (P = 0.0224), and between tumors with or without vascular invasion (P = 0.0034). The differences between groups were statistically analyzed by the Mann–Whitney test. (f) The comparison of EREG expression between tumors of lung adenocarcinomas with wild-type EGFR/KRAS (EGFR/KRAS WT), EGFR mutations (EGFR Mut) or KRAS mutations (KRAS Mut). P < 0.001 for differences among the three groups by the Kruskal–Wallis test, and P < 0.01 for differences between EGFR Mut and KRAS Mut or between EGFR Mut and EGFR/KRAS WT by the Kruskal–Wallis test with Dunn’s Multiple Comparison. (g) The comparison of EREG expression among the adenocarcinoma groups classified according to KRAS mutation status and smoking status. P < 0.05 for differences among the four groups by the Kruskal–Wallis test, and P < 0.05 for differences between KRAS WT/nonsmoker and KRAS Mut/Smoker by the Kruskal-Wallis test with Dunn’s Multiple Comparison. EREG expression levels in NSCLC tumors were normalized to the mean ( = 1 a.u.) of values obtained from nine different noncancerous lung tissues. The points represent the mean EREG levels obtained from four independent experiments. The lines represent the median EREG levels in each group.
In our series of NSCLC specimens, activating mutations in KRAS and EGFR were found in 19% (N = 17) and 38% (N = 34) of samples, respectively, and these mutations were found as mutually exclusive events in adenocarcinomas. Conversely, no BRAF mutations were found in the tumor specimens, which was not surprising, as BRAF mutations are rarely found in NSCLC; the frequency of BRAF mutations in NSCLC tumors was found in previous studies to be 1–4%.23,24 Because KRAS and EGFR mutations were restricted to adenocarcinomas, we analyzed the association between EREG expression and mutational status of KRAS or EGFR within a subgroup of adenocarcinomas to avoid a histological bias. There was a significant difference in EREG expression levels depending on KRAS or EGFR mutational status; EREG expression levels were higher in KRAS-mutant adenocarcinomas compared with adenocarcinomas with EGFR mutations or those with wild-type KRAS and EGFR (Figure 4f). KRAS mutations have been associated with cigarette smoking in lung adenocarcinomas;5 therefore, we compared the EREG expression levels among four groups of adenocarcinomas classified according to KRAS mutation status and smoking history. In both smokers and nonsmokers, EREG expression levels were higher in KRAS-mutant adenocarcinomas (Figure 4g). These results indicate that EREG is predominantly expressed in KRAS-mutant lung adenocarcinomas; although, it should be noted that EREG was highly expressed in some NSCLCs with EGFR mutations or wild-type KRAS/EGFR.
We next evaluated the prognostic significance of EREG expression in lung adenocarcinomas. Lung adenocarcinoma patients with high EREG expression levels tended to have shorter overall survival compared with those with low EREG expression levels (Figure 5a). When lung adenocarcinoma patients were divided into four groups according to EREG expression levels and KRAS mutation status, the overall survival for lung adenocarcinoma patients with EREG-high/KRAS-mutant tumors was significantly shorter than those with EREG-low/KRAS-wild-type tumors (Figure 5b). Survival analysis was also performed in an adenocarcinoma cohort that had not received EGFR-TKI therapy to exclude selection bias of EGFR-TKI use. We observed shorter overall survival for the patients with high EREG expression compared with those with low EREG expression (Supplementary Figure 4A) and for the patients with EREG-high/KRAS-mutant compared with those with EREG-low/KRAS-wild-type (Supplementary Figure 4B). Furthermore, EREG expression was a significant prognostic marker by univariate and multivariate analyses adjusted for pathology, stage and KRAS mutation status (Supplementary Table 3). In an adenocarcinoma cohort, EREG expression still remained as a significant prognostic marker by univariate and multivariate analyses when adjusted for stage and KRAS mutation status (Supplementary Table 4). It is thus likely that EREG overexpression is associated with an unfavorable outcome, especially for KRAS-mutant lung adenocarcinoma patients; although, further investigation with a larger number of patients is needed to verify the prognostic role of EREG expression.
Figure 5.

Kaplan–Meier analysis of overall survival (month) in lung adenocarcinoma patients who were classified (a) according to the EREG expression levels or (b) according to EREG expression levels and KRAS mutational status. KRAS-WT, KRAS wild-type; KRAS-Mut, KRAS mutant; EREG-Low, ≤2.127 a.u.; EREG-High, >2.127 a.u. (the median of EREG levels in all tumor specimens is 2.127 a.u.). There is a significant difference in overall survival between EREG-High/KRAS Mut and EREG-Low/KRAS-WT groups (P = 0.0031, log-rank test with Bonferroni’s correction for multiple comparisons).
Finally, to assess the functional role of EREG in tumor growth of KRAS-mutant NSCLC cells, we examined the effects of siRNA-mediated silencing of EREG expression on in vitro tumor growth in the H358 cell line whose EREG expression level is highest among the KRAS-mutant NSCLC cell lines. EREG siRNAs successfully reduced the EREG expression in H358 cells (Figure 6a, Supplementary Figure 5), leading to significant inhibition of cell proliferation (Figure 6b) and colony formation in liquid culture (Figure 6c), and of colony formation on soft agar (Figure 6d). Furthermore, siRNA-mediated EREG silencing significantly induced apoptosis as evaluated by annexin-V-fluorescein staining assays (Figures 6e, f) and histone-DNA fragmentation ELISA assays (Figure 6g). These results indicate that EREG is required for anchorage-dependent and -independent cell growth and survival in KRAS-mutant NSCLC cells, suggesting that EREG could be a therapeutic target for NSCLC with KRAS mutations.
Figure 6.

(a) siRNA-mediated EREG silencing in H358 cells as evaluated by quantitative RT–PCR. NT, non-treatment; siControl, treatment with Tax siRNA. siEREG-1 and siEREG-2: two siRNAs targeting different sites of EREG mRNA were used. *P < 0.01; **P < 0.001 by the Kruskal–Wallis test with Dunn’s multiple comparison. siRNA-mediated EREG silencing inhibits cell proliferation and colony formation as evaluated by (b) MTT assay (*P < 0.05; **P < 0.001, Kruskal–Wallis test with Dunn’s multiple comparison), (c) colony-formation assay in liquid culture and (d) soft-agar colony-formation assay in H358 cells (*P < 0.0001, ANOVA with Bonferroni’s multiple comparison). The columns represent the mean ± s.d. from three independent experiments, and NT was set at 100%. (e) Representative figures for annexin-V-positive apoptotic H358 cells (green fluorescence) with/without nuclear staining with Hoechst 33342 (blue fluorescence) and (f) the percentage of both annexin-V and Hoechst 33342-positive H358 cells after treatments with EREG siRNAs or the control siRNA. The columns represent the means ± s.d. of 12 determinants from two independent experiments. *P < 0.001 by the Kruskal–Wallis test with Dunn’s Multiple Comparison. (g) siRNA-mediated EREG silencing induces DNA fragmentation in H358 cells. *P < 0.0001 by ANOVA with Bonferroni’s multiple comparison. The enrichment factor was used as a parameter of apoptosis. The columns represent the mean ± s.d. from four independent experiments, and NT control was set at 1. All statistical analyses in Figure 6 were performed for comparison between NT control and each treatment.
DISCUSSION
In the present study, EREG is overexpressed predominantly in NSCLC cell lines and surgical NSCLC specimens that harbor KRAS mutations. In addition, we confirmed that siRNA-mediated knockdown of mutant KRAS resulted in a significant reduction of EREG expression in KRAS-mutant and EREG-overexpressing NSCLC cells. Our observations were supported by previous studies using other types of human cancer cells with KRAS mutations and experimental mouse models. Using a PCR-based complementary DNA (cDNA) subtraction library to isolate genes that were differentially expressed between KRAS-mutant HCT116 colon cancer cells and their KRAS-disrupted clones, Baba et al.25 identified EREG as a gene upregulated by oncogenic KRAS and demonstrated that the in vivo tumorigenicity in the KRAS-disrupted clones was partially recovered by forced expression of exogenous EREG. Elevated EREG expression was also observed in KRAS-transformed prostate epithelial cells21 and lung tumors from mice carrying oncogenic KRAS alleles.15,26 Collectively, these findings strongly suggest that activating KRAS mutations induce EREG overexpression, which potentially confers oncogenic KRAS-mediated lung tumorigenesis.
The regulatory mechanism of EREG expression by oncogenic KRAS was described in a previous study showing that constitutive activation of the MEK-ERK signaling pathway induces EREG upregulation in KRAS-transformed prostate epithelial cells.21 Consistent with that result, we found that inhibition of MEK or ERK leads to a significant decrease in EREG expression in NSCLC cell lines that harbor KRAS mutations and overexpress EREG. In addition to the present findings, we have previously shown that knockdown of mutant KRAS reduced the levels of phosphorylated MEK and phosphorylated ERK.7 It is thus plausible that the oncogenic activation of the RAS/RAF/MEK/ERK pathway has a central role in the regulation of EREG expression in KRAS-mutant NSCLC cells.
We found that EREG is overexpressed in several NSCLC cell lines harboring EGFR mutations. A previous study reported that EREG upregulation induced by compressive stress was inhibited by an EGFR-TKI in human bronchial epithelial cells.27 Other studies have reported that EREG is overexpressed in EGFR-mutant NSCLC cell lines, including the HCC827 cell line.15,17 In these studies, treatment with the EGFR-TKI gefitinib reduced EREG expression in HCC827 cells17 and in mouse lung tumors.15 More recently, Regales et al.28 identified EREG as one of the most highly expressed genes in the lung tumors of mutant EGFR transgenic mice. Consistent with these findings, EREG expression was downregulated by EGFR siRNA or EGFR TKIs in HCC827 cells in our preliminary study (Supplementary Figures 6A–C). Taken together, it is likely that EREG expression is dependent on oncogenic EGFR activation in NSCLC cells.
In contrast with the EREG expression data in EGFR-mutant NSCLC cell lines, EREG levels appear to be relatively low in EGFR-mutant NSCLC specimens (Figure 4f). Given that most of the NSCLC cell lines we used were established from advanced NSCLCs with metastasis and came from the metastatic lesions,29,30 higher EREG expression in the cell-line data may reflect more aggressive tumor phenotypes of EGFR-mutant NSCLC. In fact, EGFR-mutant NSCLC specimens with the pathological features of aggressiveness tended to express high levels of EREG and EREG levels in the EGFR-mutant tumors with either pleural involvement, lymphatic permeation or vascular involvement were significantly higher than those without such characteristics (Supplementary Figure 7). Therefore, EREG overexpression may be required for the acquisition of aggressive phenotypes during tumor progression of EGFR-mutant NSCLC.
Our study also showed that BRAF-mutant NSCLC cell lines overexpress EREG and that attenuation of BRAF activity led to a decrease in EREG expression in BRAF-mutant NSCLC cells (Supplementary Figures 6D–F). Considering that BRAF is a direct downstream mediator of KRAS, it is likely that oncogenic activation of the RAS/RAF/MEK/ERK pathway can induce EREG overexpression in NSCLC cells. Although further studies will be needed to clarify the roles of EGFR and BRAF mutations as positive regulators of EREG expression, oncogenic activation of EGFR/RAS/RAF/MAPK signaling may lead to constitutive, high-level expression of EREG in NSCLC.
EREG serves as a pan-EGFR ligand with a broader specificity than other EGF-like ligands and is a more potent mitogen than EGF.9,10 EREG promoted ERK-MAPK activation more effectively than EGF or TGF-α,31 suggesting a possible involvement of EREG in tumor progression. Indeed, there are several reports describing the oncogenic function of EREG. EREG promoted cell proliferation in hTERT-immortalized fibroblasts32 and cancer cells of the pancreas12 and bladder,18 whereas attenuation of EREG activity impaired in vitro tumor growth in hepatoma cells33 and EGFR-mutant NSCLC cells.17 Consistent with these findings, we found that siRNA-mediated EREG silencing inhibited anchorage-dependent and -independent tumor growth, suggesting that EREG expression is required for NSCLC tumor growth.
Our clinicopathological analysis of NSCLC surgical specimens revealed that elevated EREG expression was associated with the pathological features of aggressiveness and was an independent prognostic marker for lung adenocarcinoma. Furthermore, lung adenocarcinoma patients with tumors with high EREG levels/KRAS mutations had worse prognoses compared with those with low EREG levels/wild-type KRAS. Previous studies using biopsy specimens showed that EREG expression correlated with advanced stage in bladder cancer and lymph node metastasis in NSCLC and was suggested to be an unfavorable prognostic marker for these cancers.13,17 These observations imply that EREG is essential for tumor invasion and metastasis, thus contributing to the high-malignant potential of NSCLC. This idea is supported by previous experimental studies. In a gene expression profiling of bladder cell lines in a lung metastasis mouse model and human primary bladder tumors, EREG was one of the overexpressed genes related to metastatic progression.14 In another experimental mouse model using human breast cancer cells, EREG promoted tumor growth, angiogenesis and lung metastasis in cooperation with COX2, MMP1 and MMP2.34 Moreover, EREG promoted in vitro migration and invasion through the activation of ERK and Akt in salivary adenoid cystic carcinoma cells.35 Notably, we found that EREG expression significantly correlated with KRAS copy number in KRAS-mutant NSCLC cell lines. Given that CNGs of oncogenes are thought to be later events associated with the metastatic phenotype,36 it is likely that EREG overexpression is a later event involved in the KRAS CNG-related metastatic phenotypes in NSCLC. Interestingly, EREG expression was significantly correlated with EGFR copy number in a subgroup of NSCLC cell lines with wild-type EGFR/KRAS/BRAF (Supplementary Figure 2C). It is thus possible that EREG overexpression in NSCLCs with wild-type EGFR/KRAS/BRAF may be because of increased EGFR copy number. Conversely, in a subgroup of EGFR-mutant NSCLCs, EREG expression was not correlated with EGFR expression or EGFR copy number, suggesting that EREG overexpression in EGFR-mutated NSCLC may not depend on EGFR expression status or EGFR copy number. Further investigation using a larger sample size will be needed to address these issues.
Activating mutations in KRAS or EGFR are major genetic alterations in NSCLC, and detection of these mutations in tumors has clinical implications for EGFR-TKI therapy.2 Clinical studies have demonstrated that patients with EGFR-mutated NSCLC benefit from EGFR-TKI therapy,37,38 whereas KRAS mutations appear to be associated with EGFR-TKI resistance.39–41 Although BRAF mutations are relatively rare in NSCLC,23,24 detection of BRAF mutations would also be clinically meaningful considering the possible application of BRAF-targeted inhibitors to patients with BRAF-mutant NSCLC. Recently, Kris et al.42 analyzed 10 driver mutations in 1000 patients with lung adenocarcinoma, demonstrating that the frequencies of mutations in KRAS, EGFR and BRAF were 22%, 17% and 2%, respectively, with mutually exclusive patterns. This implies that >40% of lung adenocarcinomas potentially harbor mutations of KRAS, EGFR or BRAF, all of which may cause deregulation of the EGFR/RAS/RAF/MAPK pathway and upregulate EREG. Considering that mutations in KRAS or BRAF appear to confer intrinsic resistance to EGFR-TKIs39–41 and that most EGFR-mutated NSCLC eventually acquire resistance to EGFR-TKIs,43 EREG might be an attractive therapeutic target for the majority of NSCLC tumors.
In conclusion, our findings suggest that EREG has essential roles in the acquisition of aggressive phenotypes and is a promising therapeutic target in oncogenic KRAS-driven NSCLC. Given that EGFR, BRAF and KRAS function in the same pathway, EREG might also be a good target for BRAF-mutated or EGFR-mutated NSCLC, as it could expand the population treatable by an EREG-targeted therapy. It should also be noted that other unknown mechanisms might be involved in EREG overexpression.
MATERIALS AND METHODS
Cell lines and reagents
Thirty-five NSCLC cell lines and five noncancerous human bronchial epithelial cell lines were used in this study (Supplementary Table 2). NHBE and SAEC cells were obtained from Clonetics (San Diego, CA, USA), and BEAS-2B cells were obtained from ATCC. All other cell lines were obtained from the Hamon Center collection (University of Texas Southwestern Medical Center, Dallas, TX, USA). Information on the mutational status of KRAS, BRAF and EGFR and the gene copy number of EGFR and KRAS in the cancer cell lines is described in previous studies from our group22,23,29,41 and in the COSMIC database of the Sanger Institute (http://www.sanger.ac.uk). The cancer cells were cultured with RPMI 1640 medium supplemented with 5% fetal bovine serum. The human bronchial epithelial cell lines were cultured with Keratinocyte-SFM (Invitrogen, Carlsbad, CA, USA) medium with 50 μg/ml bovine pituitary extract (Invitrogen) and 5 ng/ml EGF (Invitrogen). All cell lines were DNA fingerprinted for provenance using the PowerPlex 1.2 kit (Promega, Madison, WI, USA), which was confirmed to be the same as the DNA fingerprint library maintained either by ATCC or by the Minna/Gazdar lab (which is the primary source of the lines). The lines were also confirmed to be free of mycoplasma using the e-Myco kit (Boca Scientific, Boca Raton, FL, USA). The reagents gefitinib (Selleck Chemicals, Houston, TX, USA), erlotinib (Toronto Research Chemicals, Inc., North York, ON, Canada), SB590885 (Symansis, Shanghai, China), U0126 (Promega) and FR180204 (Calbiochem, San Diego, CA, USA) were purchased from commercial suppliers.
Tumor specimens from NSCLC patients
The tumor specimens were obtained from 89 consecutive patients with primary NSCLC cancer who underwent surgery between July 2003 and May 2008 at the Gunma University School of Medicine Hospital (Supplementary Table 1). The tumors were histologically classified according to the criteria of the World Health Organization. The postsurgical pathological stage was classified according to the tumor–node–metastasis classification. Nine adenocarcinoma patients have received gefitinib and six patients achieved partial response. Noncancerous lung specimens (N = 9) obtained from nine patients were used as normal controls for tumor specimens. The study protocol was approved by the institutional review board of Gunma University Graduate School of Medicine. The specimens were frozen immediately after collection and stored at −80 °C, until the extraction of genomic DNA or total RNA was performed.
Gene mutational analyses
The mutations in KRAS at codon 12 or in EGFR in exons 19 and 21 were analyzed using the Smart Amplification Process Version 2 assay (DNA-FORM, Kanagawa, Japan), followed by direct sequencing for confirmation.44 BRAF mutational analysis was performed, as previously described.23 The PCR products were purified using the QIAquick PCR Purification kit (QIAGEN, Valencia, CA, USA) and were sequenced in both directions using the ABI PRISM 3100 DNA Analyzer (Applied Biosystems, Tokyo, Japan).
Quantitative RT–PCR
The expression levels of EREG, KRAS, BRAF and EGFR mRNA were determined by real-time RT–PCR.45 Taqman probe and primer sets for EREG, KRAS, BRAF and EGFR were purchased from Applied Biosystems. The total RNA was extracted using the RNeasy mini kit (QIAGEN), and the complementary DNA was synthesized using 2 μg of total RNA with the SuperScript II First-Strand Synthesis using the oligo (dT) primer system (Invitrogen). Real-time PCR was performed using a Lightcycler 480 system (Roche Diagnostics, Tokyo, Japan). For quantitative analysis, the TBP gene was used as an internal reference gene to normalize input complementary DNA. The comparative Ct method was used to compute relative expression values.
Use of synthetic small interfering RNA
siRNAs targeting wild-type KRAS or mutant KRAS were designed and purchased from Dharmacon (Lafayette, CO, USA). The siRNA sequences are as follows: 5′-GUUGGAGCUUGUGGCGUAGTT-3′ (sense) and 5′-CUACGCCACAAGCUCCAACTT-3′ (antisense) for the KRAS G12C mutation; 5′-GUUGGAGCUGUUGGCGUAGTT-3′ (sense) and 5′-CUACGCCAACAGCUCCAACTT-3′ (antisense) for the KRAS G12V mutation; 5′-GUUGGAGCUGGUGGCGUAGTT-3′ (sense) and 5′-CUACGCCACCAGCUCCAACTT-3′ (antisense) for wild-type KRAS. The siRNAs against EREG (siEREG-1 and siEREG-2), BRAF (siBRAF-1 and siBRAF-2) and EGFR (siEGFR-1 and siEGFR-2) were obtained from the siGENOME library (Dharmacon). An siRNA against Tax was used as a negative control, as previously described.46 The cells were transfected with 30 nm siRNA using Lipofectamine RNAiMAX transfection reagent (Invitrogen), according to the manufacturer’s protocol. After 48 h, the cells were harvested to verify target gene silencing.
RT–PCR and restriction fragment length polymorphism (RFLP) analysis
To detect the transcripts of wild-type KRAS or mutant KRAS, the PCR-RFLP method was performed. Detailed methods are described in our previous study.7 For the wild-type transcript, digestion of the 186-bp PCR product produced 156- and 30-bp fragments while the PCR product remained as a 186-bp fragment for the mutant transcripts.
Gene copy number analysis
KRAS and EGFR copy numbers were determined by real-time quantitative PCR assay as described.22 LINE-1 was used as a reference gene for all copy number analyses. Gene dosage of each target and reference gene was calculated using the standard curve method. Relative copy number of each sample was determined by comparing the ratio of target gene to LINE-1 in each sample with the ratio of these genes in normal human genomic DNA, made from a mixture of human blood cells from six to eight different donors, as a diploid control. CNG in cell lines was defined as values >4.
Immunohistochemical and immunofluorescent staining
Immunohistochemical staining was performed according to the procedure described in a previous study.47 A goat polyclonal antibody against EREG (1:40 dilution) was purchased from R&D systems (Minneapolis, MN, USA). The EREG expression was considered positive only if nuclear or cytoplasmic staining was present. The staining intensity was scored as follows: 1, <10% of tumor area stained; 2, 10–25% stained; 3, 26–50% stained; and 4, >50% stained. The tumors that had a score of more than 3 were defined as having high expression. Immunofluorescent staining was performed using the Alexa Fluor 488 anti-goat IgG (H + L) (Molecular Probes, Eugene, OR, USA) secondary antibody as described.46
MTT assay
Forty-eight hours after the transfection of siRNAs, 5000 viable cells (that were negative for trypan blue staining) were replated and cultured in 96-well plates in replicates of six. After 3 days, cell growth was evaluated by the 3-(4,5 dimethylthiazol–2yl)-2,5-diphenyl-tetrazolium bromide (MTT) assay as described.44
Colony-formation assay
Forty-eight hours after siRNA transfection, the cells were harvested, and 1000 trypan blue-negative cells were replated for colony formation in liquid culture.46 Alternatively, 2000 siRNA-transfected cells were replated for soft-agar colony-formation assay as described.46
DNA fragment detection by ELISA
Forty-eight hours after siRNA transfection, the cells were harvested, and 5000 trypan blue-negative cells were replated and cultured in 96-well plates in replicates of 6. After 48 h, the transfected cells were assayed by the cytoplasmic histone-associated DNA fragment method using the Cell Death Detection ELISA Plus Kit (Roche Diagnostics), according to the manufacturer’s protocol.
Apoptotic cell detection by annexin-V-fluorescein staining
Four days after siRNA transfection, the cells were double-stained using the Annexin V–FLUOS kit (Roche Diagnostics) and Hoechst 33342 solution (Molecular Probes), according to the manufacturers’ protocols. The stained cells were immediately viewed using a fluorescence microscope (Keyence, Osaka, Japan; Model BZ-8100), and the cells positive for annexin-V were considered apoptotic. The cells visualized by Hoechst staining were counted in 12 randomly selected microscopic fields, and the percentage of apoptotic cells was calculated by dividing the number of annexin-V-positive cells by the total number of cells. The results were obtained from two independent experiments.
Statistical analyses
The data were statistically analyzed with GraphPad Prism 5 for Mac OS X (GraphPad Software, San Diego, CA, USA). The Kaplan–Meier method was used to estimate survival as a function of time, and survival differences were analyzed by the log-rank test. Multivariate analyses were performed with StatView version 5.0 software (SAS Institute Inc., Cary, NC, USA) using stepwise Cox proportional hazards model to identify independent prognostic factors. P < 0.05 was considered significant.
Supplementary Material
Supplementary Fig. 1. The effects of U0126 and FR180204 on EREG expression in EREG-overexpressing NSCLC cells with wild-type KRAS (BRAF mutants, EGFR mutants, and NSCLCs with wild-type EGFR/BRAF/KRAS) as evaluated by the same methods in Fig. 2. *P<0.05; **P<0.01; ***P<0.001 for comparison with mock treatment (DMSO alone) by the Kruskal-Wallis test with Dunn’s Multiple Comparison.
Supplementary Fig. 2. (A) Correlations between EGFR expression and EGFR copy number (Pearson r = 0.6450, P<0.0001 in all NSCLCs; Pearson r = 0.9841, P<0.0001 in EGFR mutants; Pearson r = 0.7448, P = 0.0135 in NSCLCs with wild-type EGFR/BRAF/KRAS). (B) Correlations between EREG expression and EGFR expression. (C) Correlations between EREG expression and EGFR copy number (Pearson r = 0.8455, P = 0.0021 in NSCLCs with wild-type EGFR/BRAF/KRAS).
Supplementary Fig. 3. A significant correlation was observed between EREG mRNA expression and EREG protein expression scoring in lung adenocarcinomas (Spearman r = 0.5265, P<0.0001).
Supplementary Fig. 4. Kaplan-Meier analysis of overall survival (month) in lung adenocarcinoma patients who had not received EGFR-TKI therapy. The patients were classified (A) according to the EREG expression levels or (B) according to EREG expression levels and KRAS mutational status.
Supplementary Fig. 5. siRNA-mediated EREG silencing in H358 cells as evaluated by Immunofluorescent staining. After 72 h of siRNA transfection, the cells were stained with the anti-EREG antibody (green) and Hoechst 33342 (blue) and analyzed by fluorescent microscopy. siControl: treatment with Tax siRNA. siEREG-1 and siEREG-2: treatment with EREG siRNAs.
Supplementary Fig. 6. (A) siRNA-mediated EGFR knockdown in HCC827 NSCLC cells harboring EGFR mutations (E746-A750 deletion). NT: treatment with medium alone; siControl: treatment with Tax siRNA; siEGFR-1 and siEGFR-2: two siRNAs targeting different sites of EGFR mRNA. *P<0.001; ** P<0.05 for comparison with NT. (B) siRNA-mediated EGFR knockdown reduces EREG mRNA expression in HCC827 cells. *P<0.001 for comparison of NT. (C) Treatment with gefitinib or erlotinib down-regulates EREG expression in HCC827 cells. After treatment with gefitinib (1 μM) or erlotinib (1 μM) for 24 h, the cells were harvested for subsequent quantitative RT-PCR analysis. *P<0.01; **P<0.001 for comparison with mock treatment (DMSO alone). (D) siRNA-mediated BRAF knockdown in H1666 NSCLC cells harboring BRAF mutations (G466V point mutation). NT: treatment with medium alone; siControl: treatment with Tax siRNA; siBRAF-1 and siBRAF-2: two siRNAs targeting different sites of the BRAF mRNA. *P<0.001 for comparison with NT. (E) siRNA-mediated BRAF knockdown reduces EREG mRNA expression in H1666 cells. *P<0.001 for comparison with NT. (F) The BRAF inhibitor SB590885 down-regulates EREG expression in H1666 cells. After treatment with SB590885 (10 μM) for 24 h, the cells were harvested for subsequent quantitative RT-PCR analysis. *P<0.001 for comparison with mock treatment (DMSO alone). In Fig. 2A-G, the columns represent the mean ± SD (bars) in eight determinations from two independent experiments, and NT was set at 100%. All experiments were performed by quantitative RT-PCR analysis. The differences between two groups were analyzed by the Mann-Whitney test, and the differences between more than two groups were analyzed by the Kruskal-Wallis test with Dunn’s multiple comparison.
Supplementary Fig. 7. Comparisons of EREG mRNA expression levels between tumors with or without pleural involvement (P), between tumors with or without lymphatic permeation (L), between tumors with or without vascular invasion (V), and between tumors with any P/L/V factor-positive or without such characteristics. The differences between groups were analyzed by the Mann-Whitney test.
Supplementary Table 1. Characteristics of tumor specimens of non-small cell lung cancer.
Supplementary Table 2. Cell lines used in the present study.
Supplementary Table 3. Univariate and multivariate analysis in patients with non-small cell lung cancer.
Supplementary Table 4. Univariate and multivariate analysis in adenocarcinoma patients.
ACKNOWLEDGEMENTS
This work was supported by Grants-in-Aid for Scientific Research (C) (grant #23591134) from the Japan Society for the Promotion of Science. Funding for this work also came from SPORE (P50CA70907); DOD PROSPECT, Texas Higher Education Coordinating Board Advanced Technology Program (grant #01001901392003); Gillson Longenbaugh Foundation; NASA Specialized Center of Research (grant #NNJ05HD36G). We thank Drs Yoshio Tomizawa, Noriko Yanagitani, Hironobu Iijima, Takeshi Hisada, Mitsuyoshi Utsugi of the Department of Medicine and Molecular Science, Gunma University Graduate School of Medicine, Gunma, Japan for technical support and critical advices. We also thank Drs Kenneth Huffman and Victor Stastny of the Hamon Center for Therapeutic Oncology Research, University of Texas Southwestern Medical Center at Dallas for kind assistance.
Footnotes
CONFLICT OF INTEREST
The authors declare no conflict of interest.
Supplementary Information accompanies the paper on the Oncogene website (http://www.nature.com/onc)
REFERENCES
- 1.Jemal A, Bray F, Center MM, Ferlay J, Ward E, Forman D. Global cancer statistics. CA Cancer J Clin. 2011;61:69–90. doi: 10.3322/caac.20107. [DOI] [PubMed] [Google Scholar]
- 2.Larsen JE, Minna JD. Molecular biology of lung cancer: clinical implications. Clin Chest Med. 2011;32:703–740. doi: 10.1016/j.ccm.2011.08.003. [DOI] [PMC free article] [PubMed] [Google Scholar]
- 3.Devesa SS, Bray F, Vizcaino AP, Parkin DM. International lung cancer trends by histologic type: male:female differences diminishing and adenocarcinoma rates rising. Int J Cancer. 2005;117:294–299. doi: 10.1002/ijc.21183. [DOI] [PubMed] [Google Scholar]
- 4.Mascaux C, Iannino N, Martin B, Paesmans M, Berghmans T, Dusart M, et al. The role of RAS oncogene in survival of patients with lung cancer: a systematic review of the literature with meta-analysis. Br J Cancer. 2005;92:131–139. doi: 10.1038/sj.bjc.6602258. [DOI] [PMC free article] [PubMed] [Google Scholar]
- 5.Ding L, Getz G, Wheeler DA, Mardis ER, McLellan MD, Cibulskis K, et al. Somatic mutations affect key pathways in lung adenocarcinoma. Nature. 2008;455:1069–1075. doi: 10.1038/nature07423. [DOI] [PMC free article] [PubMed] [Google Scholar]
- 6.Suda K, Tomizawa K, Mitsudomi T. Biological and clinical significance of KRAS mutations in lung cancer: an oncogenic driver that contrasts with EGFR mutation. Cancer Metastasis Rev. 2010;29:49–60. doi: 10.1007/s10555-010-9209-4. [DOI] [PubMed] [Google Scholar]
- 7.Sunaga N, Shames DS, Girard L, Peyton M, Larsen JE, Imai H, et al. Knockdown of oncogenic KRAS in non-small cell lung cancers suppresses tumor growth and sensitizes tumor cells to targeted therapy. Mol Cancer Ther. 2011;10:336–346. doi: 10.1158/1535-7163.MCT-10-0750. [DOI] [PMC free article] [PubMed] [Google Scholar]
- 8.Toyoda H, Komurasaki T, Uchida D, Takayama Y, Isobe T, Okuyama T, et al. Epiregulin. A novel epidermal growth factor with mitogenic activity for rat primary hepatocytes. J Biol Chem. 1995;270:7495–7500. doi: 10.1074/jbc.270.13.7495. [DOI] [PubMed] [Google Scholar]
- 9.Shelly M, Pinkas-Kramarski R, Guarino BC, Waterman H, Wang LM, Lyass L, et al. Epiregulin is a potent pan-ErbB ligand that preferentially activates heterodimeric receptor complexes. J Biol Chem. 1998;273:10496–10505. doi: 10.1074/jbc.273.17.10496. [DOI] [PubMed] [Google Scholar]
- 10.Riese DJ, 2nd, Komurasaki T, Plowman GD, Stern DF. Activation of ErbB4 by the bifunctional epidermal growth factor family hormone epiregulin is regulated by ErbB2. J Biol Chem. 1998;273:11288–11294. doi: 10.1074/jbc.273.18.11288. [DOI] [PubMed] [Google Scholar]
- 11.Toyoda H, Komurasaki T, Uchida D, Morimoto S. Distribution of mRNA for human epiregulin, a differentially expressed member of the epidermal growth factor family. Biochem J. 1997;326:69–75. doi: 10.1042/bj3260069. [DOI] [PMC free article] [PubMed] [Google Scholar]
- 12.Zhu Z, Kleeff J, Friess H, Wang L, Zimmermann A, Yarden Y, et al. Epiregulin is up-regulated in pancreatic cancer and stimulates pancreatic cancer cell growth. Biochem Biophys Res Commun. 2000;273:1019–1024. doi: 10.1006/bbrc.2000.3033. [DOI] [PubMed] [Google Scholar]
- 13.Thogersen VB, Sorensen BS, Poulsen SS, Orntoft TF, Wolf H, Nexo E. A subclass of HER1 ligands are prognostic markers for survival in bladder cancer patients. Cancer Res. 2001;61:6227–6233. [PubMed] [Google Scholar]
- 14.Nicholson BE, Frierson HF, Conaway MR, Seraj JM, Harding MA, Hampton GM, et al. Profiling the evolution of human metastatic bladder cancer. Cancer Res. 2004;64:7813–7821. doi: 10.1158/0008-5472.CAN-04-0826. [DOI] [PubMed] [Google Scholar]
- 15.Fujimoto N, Wislez M, Zhang J, Iwanaga K, Dackor J, Hanna AE, et al. High expression of ErbB family members and their ligands in lung adenocarcinomas that are sensitive to inhibition of epidermal growth factor receptor. Cancer Res. 2005;65:11478–11485. doi: 10.1158/0008-5472.CAN-05-1977. [DOI] [PubMed] [Google Scholar]
- 16.Revillion F, Lhotellier V, Hornez L, Bonneterre J, Peyrat JP. ErbB/HER ligands in human breast cancer, and relationships with their receptors, the bio-pathological features and prognosis. Ann Oncol. 2008;19:73–80. doi: 10.1093/annonc/mdm431. [DOI] [PubMed] [Google Scholar]
- 17.Zhang J, Iwanaga K, Choi KC, Wislez M, Raso MG, Wei W, et al. Intratumoral epiregulin is a marker of advanced disease in non-small cell lung cancer patients and confers invasive properties on EGFR-mutant cells. Cancer Prev Res. 2008;1:201–207. doi: 10.1158/1940-6207.CAPR-08-0014. [DOI] [PMC free article] [PubMed] [Google Scholar]
- 18.Wang X, Colby JK, Rengel RC, Fischer SM, Clinton SK, Klein RD. Overexpression of cyclooxygenase-2 (COX-2) in the mouse urinary bladder induces the expression of immune- and cell proliferation-related genes. Mol Carcinog. 2009;48:1–13. doi: 10.1002/mc.20449. [DOI] [PubMed] [Google Scholar]
- 19.Sun M, Behrens C, Feng L, Ozburn N, Tang X, Yin G, et al. HER family receptor abnormalities in lung cancer brain metastases and corresponding primary tumors. Clin Cancer Res. 2009;15:4829–4237. doi: 10.1158/1078-0432.CCR-08-2921. [DOI] [PMC free article] [PubMed] [Google Scholar]
- 20.Takahashi M, Hayashi K, Yoshida K, Ohkawa Y, Komurasaki T, Kitabatake A, et al. Epiregulin as a major autocrine/paracrine factor released from ERK- and p38MAPK-activated vascular smooth muscle cells. Circulation. 2003;108:2524–2529. doi: 10.1161/01.CIR.0000096482.02567.8C. [DOI] [PubMed] [Google Scholar]
- 21.Cho MC, Choi HS, Lee S, Kim BY, Jung M, Park SN, et al. Epiregulin expression by Ets-1 and ERK signaling pathway in Ki-ras-transformed cells. Biochem Biophys Res Commun. 2008;377:832–837. doi: 10.1016/j.bbrc.2008.10.053. [DOI] [PubMed] [Google Scholar]
- 22.Soh J, Okumura N, Lockwood WW, Yamamoto H, Shigematsu H, Zhang W, et al. Oncogene mutations, copy number gains and mutant allele specific imbalance (MASI) frequently occur together in tumor cells. PLoS One. 2009;4:e7464. doi: 10.1371/journal.pone.0007464. [DOI] [PMC free article] [PubMed] [Google Scholar]
- 23.Pratilas CA, Hanrahan AJ, Halilovic E, Persaud Y, Soh J, Chitale D, et al. Genetic predictors of MEK dependence in non-small cell lung cancer. Cancer Res. 2008;68:9375–9383. doi: 10.1158/0008-5472.CAN-08-2223. [DOI] [PMC free article] [PubMed] [Google Scholar]
- 24.Marchetti A, Felicioni L, Malatesta S, Grazia Sciarrotta M, Guetti L, Chella A, et al. Clinical features and outcome of patients with non-small-cell lung cancer harboring BRAF mutations. J Clin Oncol. 2011;29:3574–3579. doi: 10.1200/JCO.2011.35.9638. [DOI] [PubMed] [Google Scholar]
- 25.Baba I, Shirasawa S, Iwamoto R, Okumura K, Tsunoda T, Nishioka M, et al. Involvement of deregulated epiregulin expression in tumorigenesis in vivo through activated Ki-Ras signaling pathway in human colon cancer cells. Cancer Res. 2000;60:6886–6889. [PubMed] [Google Scholar]
- 26.Lee S, Kang J, Cho M, Seo E, Choi H, Kim E, et al. Profiling of transcripts and proteins modulated by K-ras oncogene in the lung tissues of K-ras transgenic mice by omics approaches. Int J Oncol. 2009;34:161–172. [PubMed] [Google Scholar]
- 27.Chu EK, Foley JS, Cheng J, Patel AS, Drazen JM, Tschumperlin DJ. Bronchial epithelial compression regulates epidermal growth factor receptor family ligand expression in an autocrine manner. Am J Respir Cell Mol Biol. 2005;32:373–380. doi: 10.1165/rcmb.2004-0266OC. [DOI] [PubMed] [Google Scholar]
- 28.Regales L, Gong Y, Shen R, de Stanchina E, Vivanco I, Goel A, et al. Dual targeting of EGFR can overcome a major drug resistance mutation in mouse models of EGFR mutant lung cancer. J Clin Invest. 2009;119:3000–3010. doi: 10.1172/JCI38746. [DOI] [PMC free article] [PubMed] [Google Scholar]
- 29.Phelps RM, Johnson BE, Ihde DC, Gazdar AF, Carbone DP, McClintock PR, et al. NCI-Navy Medical Oncology Branch cell line data base. J Cell Biochem Suppl. 1996;24:32–91. doi: 10.1002/jcb.240630505. [DOI] [PubMed] [Google Scholar]
- 30.Yamamoto H, Shigematsu H, Nomura M, Lockwood WW, Sato M, Okumura N, et al. PIK3CA mutations and copy number gains in human lung cancers. Cancer Res. 2008;68:6913–6921. doi: 10.1158/0008-5472.CAN-07-5084. [DOI] [PMC free article] [PubMed] [Google Scholar]
- 31.Draper BK, Komurasaki T, Davidson MK, Nanney LB. Epiregulin is more potent than EGF or TGFalpha in promoting in vitro wound closure due to enhanced ERK/MAPK activation. J Cell Biochem. 2003;89:1126–1137. doi: 10.1002/jcb.10584. [DOI] [PubMed] [Google Scholar]
- 32.Lindvall C, Hou M, Komurasaki T, Zheng C, Henriksson M, Sedivy JM, et al. Molecular characterization of human telomerase reverse transcriptase-immortalized human fibroblasts by gene expression profiling: activation of the epiregulin gene. Cancer Res. 2003;63:1743–1747. [PubMed] [Google Scholar]
- 33.Zhao M, He HW, Sun HX, Ren KH, Shao RG. Dual knockdown of N-ras and epiregulin synergistically suppressed the growth of human hepatoma cells. Biochem Biophys Res Commun. 2009;387:239–244. doi: 10.1016/j.bbrc.2009.06.128. [DOI] [PubMed] [Google Scholar]
- 34.Gupta GP, Nguyen DX, Chiang AC, Bos PD, Kim JY, Nadal C, et al. Mediators of vascular remodelling co-opted for sequential steps in lung metastasis. Nature. 2007;446:765–770. doi: 10.1038/nature05760. [DOI] [PubMed] [Google Scholar]
- 35.Hu K, Li SL, Gan YH, Wang CY, Yu GY. Epiregulin promotes migration and invasion of salivary adenoid cystic carcinoma cell line SACC-83 through activation of ERK and Akt. Oral Oncol. 2009;45:156–163. doi: 10.1016/j.oraloncology.2008.04.009. [DOI] [PubMed] [Google Scholar]
- 36.Gazdar AF, Minna JD. Deregulated EGFR signaling during lung cancer progression: mutations, amplicons, and autocrine loops. Cancer Prev Res. 2008;1:156–160. doi: 10.1158/1940-6207.CAPR-08-0080. [DOI] [PMC free article] [PubMed] [Google Scholar]
- 37.Mok TS, Wu YL, Thongprasert S, Yang CH, Chu DT, Saijo N, et al. Gefitinib or carboplatin-paclitaxel in pulmonary adenocarcinoma. N Engl J Med. 2009;361:947–957. doi: 10.1056/NEJMoa0810699. [DOI] [PubMed] [Google Scholar]
- 38.Morita S, Okamoto I, Kobayashi K, Yamazaki K, Asahina H, Inoue A, et al. Combined survival analysis of prospective clinical trials of gefitinib for non-small cell lung cancer with EGFR mutations. Clin Cancer Res. 2009;15:4493–4498. doi: 10.1158/1078-0432.CCR-09-0391. [DOI] [PubMed] [Google Scholar]
- 39.Pao W, Wang TY, Riely GJ, Miller VA, Pan Q, Ladanyi M, et al. KRAS mutations and primary resistance of lung adenocarcinomas to gefitinib or erlotinib. PLoS Med. 2005;2:e17. doi: 10.1371/journal.pmed.0020017. [DOI] [PMC free article] [PubMed] [Google Scholar]
- 40.Massarelli E, Varella-Garcia M, Tang X, Xavier AC, Ozburn NC, Liu DD, et al. KRAS mutation is an important predictor of resistance to therapy with epidermal growth factor receptor tyrosine kinase inhibitors in non-small-cell lung cancer. Clin Cancer Res. 2007;13:2890–2896. doi: 10.1158/1078-0432.CCR-06-3043. [DOI] [PubMed] [Google Scholar]
- 41.Gandhi J, Zhang J, Xie Y, Soh J, Shigematsu H, Zhang W, et al. Alterations in genes of the EGFR signaling pathway and their relationship to EGFR tyrosine kinase inhibitor sensitivity in lung cancer cell lines. PLoS One. 2009;4:e4576. doi: 10.1371/journal.pone.0004576. [DOI] [PMC free article] [PubMed] [Google Scholar]
- 42.Kris M, Johnson BE, Kwiatkowski DJ, Iafrate AJ, Wistuba II, Aronson SL, et al. Identification of driver mutations in tumor specimens from 1000 patients with lung adenocarcinoma: the NCI’s lung cancer mutation consortium (LCMC) J Clin Oncol. 2011;29(Suppl) abstract CRA7506. [Google Scholar]
- 43.Gazdar AF. Activating and resistance mutations of EGFR in non-small-cell lung cancer: role in clinical response to EGFR tyrosine kinase inhibitors. Oncogene. 2009;28:S24–S31. doi: 10.1038/onc.2009.198. [DOI] [PMC free article] [PubMed] [Google Scholar]
- 44.Imai H, Sunaga N, Shimizu Y, Kakegawa S, Shimizu K, Sano T, et al. Clinicopathological and therapeutic significance of CXCL12 expression in lung cancer. Int J Immunopathol Pharmacol. 2010;23:153–164. doi: 10.1177/039463201002300114. [DOI] [PMC free article] [PubMed] [Google Scholar]
- 45.Sunaga N, Imai H, Shimizu K, Shames DS, Kakegawa S, Girard L, et al. Oncogenic KRAS-induced interleukin-8 overexpression promotes cell growth and migration and contributes to aggressive phenotypes of non-small cell lung cancer. Int J Cancer. 2012;130:1733–1744. doi: 10.1002/ijc.26164. [DOI] [PMC free article] [PubMed] [Google Scholar]
- 46.Sunaga N, Miyajima K, Suzuki M, Sato M, White MA, Ramirez RD, et al. Different roles for caveolin-1 in the development of non-small cell lung cancer versus small cell lung cancer. Cancer Res. 2004;64:4277–4285. doi: 10.1158/0008-5472.CAN-03-3941. [DOI] [PubMed] [Google Scholar]
- 47.Kaira K, Endo M, Abe M, Nakagawa K, Ohde Y, Okumura T, et al. Biologic correlation of 2-[18F]-fluoro-2-deoxy-D-glucose uptake on positron emission tomography in thymic epithelial tumors. J Clin Oncol. 2010;28:3746–3753. doi: 10.1200/JCO.2009.27.4662. [DOI] [PubMed] [Google Scholar]
Associated Data
This section collects any data citations, data availability statements, or supplementary materials included in this article.
Supplementary Materials
Supplementary Fig. 1. The effects of U0126 and FR180204 on EREG expression in EREG-overexpressing NSCLC cells with wild-type KRAS (BRAF mutants, EGFR mutants, and NSCLCs with wild-type EGFR/BRAF/KRAS) as evaluated by the same methods in Fig. 2. *P<0.05; **P<0.01; ***P<0.001 for comparison with mock treatment (DMSO alone) by the Kruskal-Wallis test with Dunn’s Multiple Comparison.
Supplementary Fig. 2. (A) Correlations between EGFR expression and EGFR copy number (Pearson r = 0.6450, P<0.0001 in all NSCLCs; Pearson r = 0.9841, P<0.0001 in EGFR mutants; Pearson r = 0.7448, P = 0.0135 in NSCLCs with wild-type EGFR/BRAF/KRAS). (B) Correlations between EREG expression and EGFR expression. (C) Correlations between EREG expression and EGFR copy number (Pearson r = 0.8455, P = 0.0021 in NSCLCs with wild-type EGFR/BRAF/KRAS).
Supplementary Fig. 3. A significant correlation was observed between EREG mRNA expression and EREG protein expression scoring in lung adenocarcinomas (Spearman r = 0.5265, P<0.0001).
Supplementary Fig. 4. Kaplan-Meier analysis of overall survival (month) in lung adenocarcinoma patients who had not received EGFR-TKI therapy. The patients were classified (A) according to the EREG expression levels or (B) according to EREG expression levels and KRAS mutational status.
Supplementary Fig. 5. siRNA-mediated EREG silencing in H358 cells as evaluated by Immunofluorescent staining. After 72 h of siRNA transfection, the cells were stained with the anti-EREG antibody (green) and Hoechst 33342 (blue) and analyzed by fluorescent microscopy. siControl: treatment with Tax siRNA. siEREG-1 and siEREG-2: treatment with EREG siRNAs.
Supplementary Fig. 6. (A) siRNA-mediated EGFR knockdown in HCC827 NSCLC cells harboring EGFR mutations (E746-A750 deletion). NT: treatment with medium alone; siControl: treatment with Tax siRNA; siEGFR-1 and siEGFR-2: two siRNAs targeting different sites of EGFR mRNA. *P<0.001; ** P<0.05 for comparison with NT. (B) siRNA-mediated EGFR knockdown reduces EREG mRNA expression in HCC827 cells. *P<0.001 for comparison of NT. (C) Treatment with gefitinib or erlotinib down-regulates EREG expression in HCC827 cells. After treatment with gefitinib (1 μM) or erlotinib (1 μM) for 24 h, the cells were harvested for subsequent quantitative RT-PCR analysis. *P<0.01; **P<0.001 for comparison with mock treatment (DMSO alone). (D) siRNA-mediated BRAF knockdown in H1666 NSCLC cells harboring BRAF mutations (G466V point mutation). NT: treatment with medium alone; siControl: treatment with Tax siRNA; siBRAF-1 and siBRAF-2: two siRNAs targeting different sites of the BRAF mRNA. *P<0.001 for comparison with NT. (E) siRNA-mediated BRAF knockdown reduces EREG mRNA expression in H1666 cells. *P<0.001 for comparison with NT. (F) The BRAF inhibitor SB590885 down-regulates EREG expression in H1666 cells. After treatment with SB590885 (10 μM) for 24 h, the cells were harvested for subsequent quantitative RT-PCR analysis. *P<0.001 for comparison with mock treatment (DMSO alone). In Fig. 2A-G, the columns represent the mean ± SD (bars) in eight determinations from two independent experiments, and NT was set at 100%. All experiments were performed by quantitative RT-PCR analysis. The differences between two groups were analyzed by the Mann-Whitney test, and the differences between more than two groups were analyzed by the Kruskal-Wallis test with Dunn’s multiple comparison.
Supplementary Fig. 7. Comparisons of EREG mRNA expression levels between tumors with or without pleural involvement (P), between tumors with or without lymphatic permeation (L), between tumors with or without vascular invasion (V), and between tumors with any P/L/V factor-positive or without such characteristics. The differences between groups were analyzed by the Mann-Whitney test.
Supplementary Table 1. Characteristics of tumor specimens of non-small cell lung cancer.
Supplementary Table 2. Cell lines used in the present study.
Supplementary Table 3. Univariate and multivariate analysis in patients with non-small cell lung cancer.
Supplementary Table 4. Univariate and multivariate analysis in adenocarcinoma patients.