

Abstract
Despite much discussion regarding the clinical relevance of glycemic variation (GV), little discourse has addressed the properties of the data set from which it is derived. We aimed to assess the minimum duration of data required using continuous glucose monitoring (CGM) that most closely approximates to a gold standard 90-day measure. Data from 20 children and adolescents with type 1 diabetes were examined. All participants had CGM data sets of 90 days duration, from which standard deviation (SD), coefficient of variation (CV), mean amplitude of glycemic action (MAGE), and continuous overlapping net glycemic action (CONGA1-8) were calculated for the overall period and then investigational periods of 2, 4, 6, 12, 18, 24, and 30 days. The percentage difference between each measure and the overall measure per time period was assessed. As the duration of the CGM data set increased, the percentage error continued to decrease, giving a metric approximating more closely toward the overall measure. Median SD and CV differed from the overall measure by <10% at 12 days duration. The frequency of interruptions to the CGM trace rendered MAGE and CONGA unreliable, hence SD and CV were reported. We suggest that data sets used to infer GV should be of a minimum duration of 12 days. MAGE and CONGA exhibit poor performance in the setting of frequent trace interruption.
Keywords: glycemic variation, continuous glucose monitoring, type 1 diabetes, pediatric, standard deviation, CONGA, MAGE
There has been increasing interest displayed in glycemic variability (GV) as an HbA1c-independent risk factor for development of diabetes-associated complications.1,2 In vitro studies have suggested that both periods of sustained hyperglycemia, as well as fluctuating glycemia, result in deleterious effects on endothelial cells.3,4 Exposure of cell cultures to these conditions resulted in overproduction of reactive oxygen species in mitochondria, leading to increased oxidative stress and cell apoptosis.
In vivo studies have produced more debate, with a systematic review of the topic concluding that plausible evidence exists for an association between GV and retinopathy, cardiovascular events and mortality in type 2 diabetes, but less so for type 1 diabetes (T1D).5 Two studies using data from the Diabetes Control & Complications Trial (DCCT) displayed discrepant associations with microvascular complications,6,7 and 1 study that followed 100 participants with T1D for 11 years found GV to be an independent predictor of prevalence of peripheral neuropathy.8
One potential reason for the variability in trial results is that there is no accepted gold standard measure of GV, leading to marked heterogeneity in methods used for its assessment. With the emergence of continuous glucose monitoring (CGM), description of up to 30 different measures of GV has ensued, each method with its own strengths and weaknesses.9,10 Despite ongoing discussion as to the best metric of GV, little debate has taken place regarding the properties required of the data set from which GV can be derived. The minimum frequency of glucose measurements required within a data set to consistently assess GV has previously been defined, but no published data exists regarding duration.11 The purpose of this study was to identify the minimum duration required of a CGM data set to be able to approximate GV to a 3-month gold standard duration.
Methods
Twenty CGM traces were chosen randomly from our clinical research data set of patients. All had confirmed T1D and were using continuous subcutaneous insulin infusion (CSII). Each patient used the CGM system (Medtronic Minimed Paradigm, Northridge, CA, USA, mean absolute relative difference 13.86%)12 for 90 days in total. As this approximates to a standard time period assessed by HbA1c,13 we took this period as the gold standard duration. Users of the system calibrated the CGM trace with a minimum of 3 capillary blood glucose measurements per 24 hours. Review of calibration frequency and excision of gaps in the CGM trace was undertaken using Stata (v11, StataCorp, College Station, TX, USA).
GV was initially assessed using: standard deviation of all glucose values (SD), coefficient of variation (CV), mean amplitude of glycemic excursion (MAGE), and continuous overlapping net glycemic action (CONGAn) at n = 1, 2, 4, and 8 hours for the entire 90-day period, using methods as previously described.14-16 The estimates were then repeated using 2, 4, 6, 12, 18, 24, and 30 days of CGM data within the same data set provided for each patient. The percentage difference between the corresponding values obtained and the “gold standard” 90-day GV measure was then calculated for each of the time periods. Overall median and interquartile ranges of the percentage difference from the gold standard for each time period were calculated.
Results
Participants were 35% male and had a mean age of 13.5 ± 2.6 years (range 10.1-18.3), duration of diabetes of 5.6 ± 2.7 years, and mean HbA1c of 7.6 ± 0.6% (59 ± 6 mmol/mol).
Gaps in the CGM trace were a very frequent occurrence, with a mean of 446.2 ± 239 hours of trace dropout per patient, per 90-day period (mean 20.7% of time recorded; range 112.6-803.8 hours). The frequency of these interruptions to the 90-day overall CGM traces dramatically reduced the interpretability and reliability of both MAGE and CONGA, hence SD alone was used for reporting all outcome data. CV was also calculated to control for mean glucose values.
As the duration of CGM trace increased, there was a demonstrated continued reduction in the percentage error of both the SD and the CV for that time period from the overall “best estimate” 90-day value (see Figures 1 and 2). This reaches a median value of <10% error at 12 days for both measures (see Table 1 for absolute values).
Figure 1.
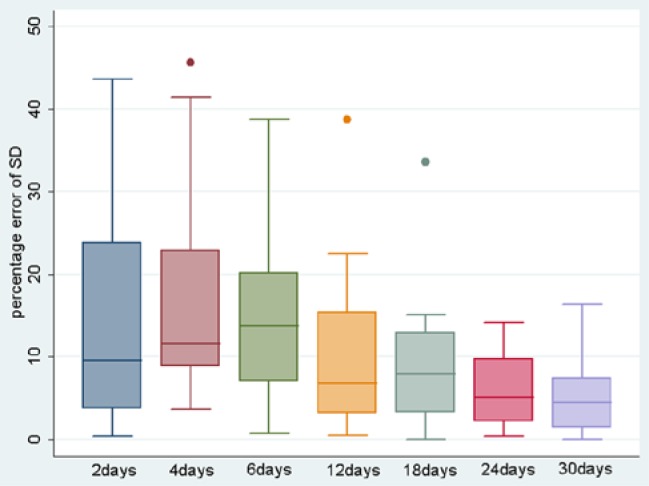
Boxplot of percentage difference of SD from 90-day standard for each time period. Box indicates interquartile ranges, line represents median, whiskers represent range of values.
Figure 2.
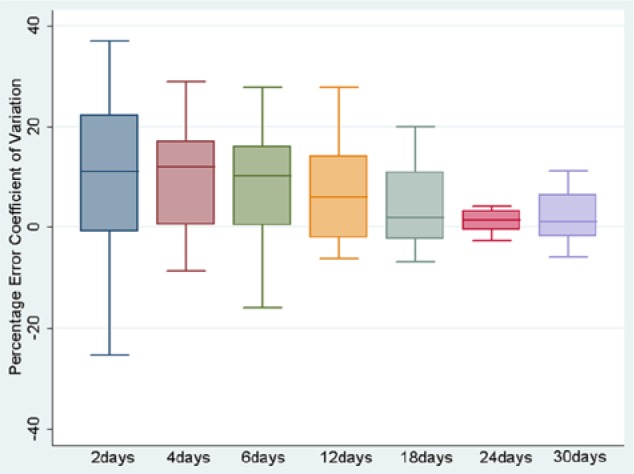
Boxplot of percentage difference of CV from 90-day standard for each time period.
Table 1.
Absolute Values of SD (Upper Figure) and CV (Lower Figure, %).
| Pt | 90 days | 2 days | 4 days | 6 days | 12 days | 18 days | 24 days | 30 days |
|---|---|---|---|---|---|---|---|---|
| 1 | 3.40
39.1 |
3.29
38.8 |
3.01
32.9 |
2.92
33.0 |
3.07
32.6 |
3.1
34.0 |
3.19
35.5 |
3.18
35.4 |
| 2 | 4.23
47.0 |
3.24
29.6 |
3.52
40.7 |
3.91
48.5 |
3.97
48.7 |
3.89
46.9 |
3.86
45.6 |
4.35
47.2 |
| 3 | 3.39
41.0 |
3.58
42.3 |
3.71
41.5 |
3.46
40.0 |
3.45
38.6 |
3.60
40.5 |
3.53
40.0 |
3.55
40.3 |
| 4 | 3.11
40.6 |
2.24
27.6 |
2.90
36.1 |
2.70
33.6 |
2.56
33.2 |
2.64
36.0 |
2.67
36.5 |
2.85
38.1 |
| 5 | 3.71
42.3 |
2.99
36.6 |
2.86
32.1 |
2.90
32.1 |
3.08
34.8 |
3.22
38.7 |
3.25
40.8 |
3.38
40.9 |
| 6 | 4.38
42.7 |
3.37
30.5 |
3.38
35.5 |
3.66
38.2 |
4.15
41.3 |
4.38
43.4 |
4.48
44.3 |
4.44
44.9 |
| 7 | 3.48
43.0 |
3.62
53.9 |
3.09
41.7 |
2.97
39.8 |
3.54
42.3 |
3.49
42.0 |
3.41
40.3 |
3.48
41.6 |
| 8 | 2.74
37.0 |
3.28
41.2 |
3.04
37.8 |
2.94
34.6 |
3.21
37.3 |
3.14
38.5 |
2.94
36.8 |
2.83
36.8 |
| 9 | 3.29
44.5 |
3.25
44.8 |
3.13
42.0 |
3.07
40.1 |
3.05
39.2 |
2.81
38.9 |
2.95
40.3 |
2.78
39.5 |
| 10 | 2.94
35.0 |
2.84
27.5 |
2.68
26.7 |
2.75
29.4 |
2.86
32.7 |
2.89
34.6 |
2.95
35.5 |
2.97
35.6 |
| 11 | 4.30
46.0 |
4.76
41.9 |
4.98
47.0 |
4.87
50.8 |
4.15
47.8 |
4.12
46.9 |
3.91
43.6 |
4.31
46.4 |
| 12 | 3.07
38.5 |
3.06
36.9 |
2.80
35.0 |
2.66
33.3 |
2.71
32.2 |
2.83
33.8 |
2.91
34.8 |
2.91
35.7 |
| 13 | 4.21
44.1 |
3.19
35.1 |
3.72
37.6 |
4.18
41.8 |
4.23
39.9 |
4.32
41.1 |
4.27
41.9 |
4.17
41.3 |
| 14 | 4.22
41.4 |
3.11
37.7 |
3.0
36.1 |
3.11
36.9 |
4.47
43.7 |
4.25
44.2 |
4.18
44.1 |
4.13
43.8 |
| 15 | 3.38
45.8 |
3.10
35.4 |
3.71
42.2 |
3.94
46.2 |
3.44
45.0 |
3.51
48.1 |
3.44
47.7 |
3.33
46.7 |
| 16 | 4.06
40.3 |
4.09
32.0 |
3.76
33.5 |
3.99
35.7 |
3.84
35.6 |
3.70
36.0 |
3.92
38.9 |
3.83
39.8 |
| 17 | 3.97
43.6 |
4.16
44.1 |
4.82
47.0 |
4.85
46.3 |
4.50
45.6 |
4.36
45.9 |
4.16
44.4 |
4.16
45.5 |
| 18 | 4.28
43.3 |
2.49
33.8 |
2.33
32.6 |
2.74
34.4 |
3.32
38.4 |
3.74
39.2 |
3.79
39.5 |
3.76
39.4 |
| 19 | 4.11
43.0 |
2.32
28.3 |
2.41
30.7 |
2.52
31.1 |
2.52
31.1. |
2.73
34.4 |
3.54
40.2 |
3.44
40.3 |
| 20 | 4.72
43.9 |
4.96
44.6 |
5.91
47.7 |
5.59
50.9 |
5.37
46.6 |
4.96
45.1 |
4.93
45.2 |
4.92
44.7 |
Discussion
This study assessed 90 days of CGM traces from pediatric participants with T1D and suggests that a 12-day minimum duration of trace is required to approximate GV to a “best estimate” value using SD and CV as the GV metrics, measurable in a HbA1c-equivalent time-frame. In the current technology environment, this is the equivalent duration of continuous usage of 2 sensors. We judged <10% error from the overall measure as acceptable, which was also selected as an acceptable discrepancy in an abstract with similar aims.17 This study examined 50 days of CGM data from 68 participants and concluded that 6 days was a sufficient time period to approximate GV using MAGE. However, this was conducted in adult participants with T1D who may exhibit a more stable glycemic profile than children. MAGE was developed in 1970 during in-house highly controlled conditions, using pooled results of arbitrarily designated adjacent blood glucose swings.15 However, it exhibits high sensitivity to frequent trace discontinuity when 288 data points per day are obtained over a more prolonged period than the original 48 hour evaluation, and 1 study has shown that MAGE was only weakly associated with clinical assessment of lability (r = .328).18
The reality of the real-life CGM experience is that trace dropout is an inevitably frequent occurrence, mainly due to delays in calibration, distance from the receiver during sport/swimming, or during the 3-hour initialization phase postsensor insertion. Children and adolescents are also much less likely than adults to wear CGM continuously, despite the attendant HbA1c benefit conferred with >70% usage.19,20 CONGA was originally conceived using 72 hours of CGM data, and although there now exists automated methods of analysis, the regular absence of corresponding 1-, 2-, or 4-hour data points where required renders this method unreliable for analysis of data sets of longer duration.
Our findings should be interpreted as preliminary as we analyzed traces from 20 patients with reasonable baseline metabolic control, however, it is the first to our knowledge which has examined 90 days of data from each participant in this context. Repeating this analysis in a higher number of patients with a broader spread of HbA1c values would be worthwhile, although minimization of trace interruption and achievement of the required usage of CGM may be challenging.
Of the 8 studies of participants with T1D chosen for the aforementioned systematic review,5 only 3 used CGM for GV estimation.21-23 Of these studies, only 72 hours of CGM data were utilized to infer GV. Other studies used either 2.5-point or 7-point capillary glucose profiles, previously demonstrated to be a suboptimal frequency for consistent GV assessment.11 For standardization of methodology and improved homogeneity, we suggest that future studies of GV estimation use a data set obtained from a minimum of 12 days of continuous CGM usage, with no longer than 2 to 4 hours between glucose data points. This should assist to improve the consistency of correlation of GV with relevant clinicopathologic outcomes in T1D. Development of automated computer assessment would also be advantageous.
Footnotes
Abbreviations: CGM, continuous glucose monitoring; CONGA, continuous overlapping net glycemic action; CV, coefficient of variation; DCCT, Diabetes Control & Complications Trial; GV, glycemic variation; HbA1c, glycosylated hemoglobin; MAGE, mean amplitude of glycemic excursion; SD, standard deviation; T1D, type 1 diabetes.
Declaration of Conflicting Interests: The author(s) declared no potential conflicts of interest with respect to the research, authorship, and/or publication of this article.
Funding: The author(s) received no financial support for the research, authorship, and/or publication of this article.
References
- 1. Kilpatrick ES, Rigby AS, Atkin SL. For debate. Glucose variability and diabetes complication risk: we need to know the answer. Diabet Med. 2010;27(8):868-871. [DOI] [PubMed] [Google Scholar]
- 2. Monnier L, Colette C. Glycemic variability: should we and can we prevent it? Diabetes Care. 2008;31(suppl 2):S150-S154. [DOI] [PubMed] [Google Scholar]
- 3. Giannini S, Benvenuti S, Luciani P, et al. Intermittent high glucose concentrations reduce neuronal precursor survival by altering the IGF system: the involvement of the neuroprotective factor DHCR24 (Seladin-1). J Endocrinol. 2008;198(3):523-532. [DOI] [PubMed] [Google Scholar]
- 4. Quagliaro L, Piconi L, Assaloni R, Martinelli L, Motz E, Ceriello A. Intermittent high glucose enhances apoptosis related to oxidative stress in human umbilical vein endothelial cells: the role of protein kinase C and NAD(P)H-oxidase activation. Diabetes. 2003;52(11):2795-2804. [DOI] [PubMed] [Google Scholar]
- 5. Nalysnyk L, Hernandez-Medina M, Krishnarajah G. Glycaemic variability and complications in patients with diabetes mellitus: evidence from a systematic review of the literature. Diabetes Obes Metab. 2010;12(4):288-298. [DOI] [PubMed] [Google Scholar]
- 6. Service FJ, O’Brien PC. The relation of glycaemia to the risk of development and progression of retinopathy in the Diabetic Control and Complications Trial. Diabetologia. 2001;44(10):1215-1220. [DOI] [PubMed] [Google Scholar]
- 7. Kilpatrick ES, Rigby AS, Atkin SL. The effect of glucose variability on the risk of microvascular complications in type 1 diabetes. Diabetes Care. 2006;29(7):1486-1490. [DOI] [PubMed] [Google Scholar]
- 8. Bragd J, Adamson U, Backlund LB, Lins PE, Moberg E, Oskarsson P. Can glycaemic variability, as calculated from blood glucose self-monitoring, predict the development of complications in type 1 diabetes over a decade? Diabetes Metab. 2008;34(6 pt 1):612-616. [DOI] [PubMed] [Google Scholar]
- 9. Cameron FJ, Baghurst PA, Rodbard D. Assessing glycemic variation: why, when and how? Pediatr Endocrinol Rev. 2010;7(suppl 3):432-444. [PubMed] [Google Scholar]
- 10. Weber C, Schnell O. The assessment of glycemic variability and its impact on diabetes-related complications: an overview. Diabetes Technol Ther. 2009;11(10):623-633. [DOI] [PubMed] [Google Scholar]
- 11. Baghurst PA, Rodbard D, Cameron FJ. The minimum frequency of glucose measurements from which glycemic variation can be consistently assessed. J Diabetes Sci Technol. 2010;4(6):1382-1385. [DOI] [PMC free article] [PubMed] [Google Scholar]
- 12. Keenan DB, Mastrototaro JJ, Zisser H, et al. Accuracy of the Enlite 6-day glucose sensor with guardian and Veo calibration algorithms. Diabetes Technol Ther. 2012;14(3):225-231. [DOI] [PubMed] [Google Scholar]
- 13. Abraham EC, Huff TA, Cope ND, Wilson JB, Jr, Bransome ED, Jr, Huisman TH. Determination of the glycosylated hemoglobins (HB AI) with a new microcolumn procedure. Suitability of the technique for assessing the clinical management of diabetes mellitus. Diabetes. 1978;27(9):931-937. [DOI] [PubMed] [Google Scholar]
- 14. McDonnell CM, Donath SM, Vidmar SI, Werther GA, Cameron FJ. A novel approach to continuous glucose analysis utilizing glycemic variation. Diabetes Technol Ther. 2005;7(2):253-263. [DOI] [PubMed] [Google Scholar]
- 15. Service FJ, Molnar GD, Rosevear JW, Ackerman E, Gatewood LC, Taylor WF. Mean amplitude of glycemic excursions, a measure of diabetic instability. Diabetes. 1970;19(9):644-655. [DOI] [PubMed] [Google Scholar]
- 16. Rodbard D. Interpretation of continuous glucose monitoring data: glycemic variability and quality of glycemic control. Diabetes Technol Ther. 2009;11(suppl 1):S55-S67. [DOI] [PubMed] [Google Scholar]
- 17. Bugler J. An estimation of the amount of data required to measure glycaemic variability. Adv Technol Treatments Diabetes. 2008:55. [Google Scholar]
- 18. Ryan EA, Shandro T, Green K, et al. Assessment of the severity of hypoglycemia and glycemic lability in type 1 diabetic subjects undergoing islet transplantation. Diabetes. 2004;53(4):955-962. [DOI] [PubMed] [Google Scholar]
- 19. Beck RW, Buckingham B, Miller K, et al. Factors predictive of use and of benefit from continuous glucose monitoring in type 1 diabetes. Diabetes Care. 2009;32(11):1947-1953. [DOI] [PMC free article] [PubMed] [Google Scholar]
- 20. O’Connell MA, Donath S, O’Neal DN, et al. Glycaemic impact of patient-led use of sensor-guided pump therapy in type 1 diabetes: a randomised controlled trial. Diabetologia. 2009;52(7):1250-1257. [DOI] [PubMed] [Google Scholar]
- 21. Gordin D, Ronnback M, Forsblom C, Makinen V, Saraheimo M, Groop PH. Glucose variability, blood pressure and arterial stiffness in type 1 diabetes. Diabetes Res Clin Pract. 2008;80(3):e4-e7. [DOI] [PubMed] [Google Scholar]
- 22. Oyibo SO, Prasad YD, Jackson NJ, Jude EB, Boulton AJ. The relationship between blood glucose excursions and painful diabetic peripheral neuropathy: a pilot study. Diabet Med. 2002;19(10):870-873. [DOI] [PubMed] [Google Scholar]
- 23. Wentholt IM, Kulik W, Michels RP, Hoekstra JB, DeVries JH. Glucose fluctuations and activation of oxidative stress in patients with type 1 diabetes. Diabetologia. 2008;51(1):183-190. [DOI] [PubMed] [Google Scholar]