

1.1 Introduction
The dopamine (DA) precursor, L-DOPA, remains the most effective treatment for Parkinson's disease (PD) but causes dyskinesia (abnormal involuntary movements) in the vast majority of the patients (reviewed in Fabbrini et al., 2007). The pathophysiology of L-DOPA-induced dyskinesia (LID) is multilayered, involving both pre- and postsynaptic abnormalities in the nigrostriatal system, ultimately leading to altered activity patterns in basal ganglionic-thalamocortical networks (Bezard et al., 2001; Cenci et al., 1998; Cenci and Lindgren, 2007). Studies performed in both animal models and PD patients indicate that dyskinesia is triggered by large and transient elevations in brain extracellular levels of DA following the administration of L-DOPA (de la Fuente-Fernandez et al., 2004; Lindgren et al., 2010; Pavese et al., 2006). These elevations reflect an abnormal handling of exogenous L-DOPA and an altered regulation of DA release and clearance, which are in turn attributed to the degeneration and the secondary maladaptive changes that affect DA (Lee et al., 2008) and serotonin axonal projections (Rylander et al., 2010). Functional and structural alterations of the brain microvasculature may however also contribute to this effect. Indeed, L-DOPA reaches the brain from the blood through endothelial transport mechanisms (Pardridge and Oldendorf, 1975) and alterations of the brain endothelium or its barrier properties could affect the kinetics of L-DOPA entry into the brain. Our studies in a rat model of PD have shown that treatment with L-DOPA induces endothelial proliferation and angiogenic activity in the basal ganglia nuclei (Lindgren et al., 2009; Ohlin et al., 2011; Westin et al., 2006). Accordingly, we have recently obtained immunohistochemical evidence of angiogenesis on post-mortem basal ganglia sections from dyskinetic PD patients and showed that vascular endothelial growth factor (VEGF), an important inducer of angiogenesis (Carmeliet P, 2000), is upregulated in striatal tissue from both L-DOPA-treated dyskinetic rats and PD patients with a history of dyskinesia (Ohlin et al., 2011). In the search for potential mechanisms that may mediate an angiogenic response to L-DOPA, it is highly warranted to consider local alterations in blood flow and metabolism, as these phenomena often are coupled with angiogenesis and appear to be dysregulated in PD (Hirano et al., 2008). On a functional level, studies based on in vivo imaging techniques have evidenced changes in regional cerebral blood flow (rCBF) in basal ganglionic-thalamocortical circuits in PD patients, which were related both to the disease stage, to the presence of dyskinesia, and to the performance of motor tasks (Hershey et al., 1998, 2003; Morgante et al., 2006; Rascol et al., 1998). Using positron emission tomography (PET) imaging of cerebral blood flow and metabolism in PD patients, Hirano and colleagues reported large increases in rCBF in the basal ganglia following the administration of L-DOPA, which were not matched by equivalent changes in regional metabolic patterns (Hirano et al., 2008). Increases in rCBF “ON L-DOPA” were particularly pronounced in PD patients affected by dyskinesia (Hirano et al., 2008). These independent lines of investigation indicate that neurovascular coupling mechanisms may be affected by L-DOPA pharmacotherapy in the parkinsonian brain and raise the hypothesis of a possible relationship between these functional changes and long-lasting microvascular alterations involving angiogenesis and increases in BBB permeability (Ohlin et al., 2011).
In the present study we have used high-resolution autoradiography in order to map changes in rCBF and cerebral glucose utilization (rCGU) both at baseline and following L-DOPA administration, in rats with 6-hydroxydopamine (6-OHDA) lesions. To assess the impact of L-DOPA treatment on rCBF, rCGU or BBB permeability, 14C-labelled tracer molecules were injected intravenously at 60 min following peripheral administration of either L-DOPA or saline (referred to as the “ON L-DOPA” versus “ON Saline” conditions, respectively). In chronically L-DOPA-treated rats, the saline injection was given 24 hours after the last L-DOPA dose, mimicking an “OFF L-DOPA” state of treated PD.
2. Materials and methods
2.1. Experimental design
2.1.1 Subjects
A total of 138 Female Sprague-Dawley rats (200-225 g; Harlan, The Netherlands) were housed under a 12h light/dark cycle with access to food and water ad libitum. All procedures were approved by the Malmö-Lund Ethical Committee on Animal Research.
2.1.2 Treatment groups and experimental design
The study time line and the experimental groups are depicted in Fig 1. In all experiments, rats with a unilateral 6-OHDA lesion of the medial forebrain bundle (MFB) or a sham lesion received single daily subcutaneous (s.c.) injections of either L-DOPA or saline for 21 days. During the treatment, animals were monitored for the development of abnormal involuntary movements (AIMs), yielding a subdivision of chronically L-DOPA-treated rats into dyskinetic and non-dyskinetic subgroups (defined below). On the twenty-second day, a venous catheter was inserted in the jugular vein for injecting radiotracers to study regional cerebral blood flow ([14C]-iodoantipyrine; IAP;), regional glucose utilization ([14C ]-2-deoxyglucose; 2-DG), or BBB permeability ([14C]-aminoisobutyric acid; AIB). In the following, the experiments will be denoted IAP, 2-DG and AIB, respectively. Following a short recovery period, rats in each experimental group received a final injection of either L-DOPA or saline 60 min prior to sacrifice, yielding the two final conditions, ON L-DOPA and ON Saline (see Fig 1A, B).
Figure 1. Experimental design of studies of regional cerebral blood flow, metabolism and blood-brain barrier permeability.
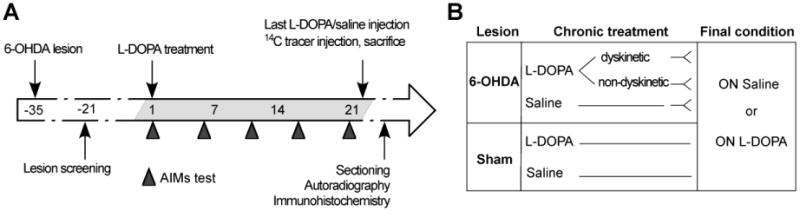
(A) Rats received 6-hydroxydopamine (6-OHDA) or sham lesions into the right medial forebrain bundle (MFB) and were chronically treated for 21 days with L-DOPA (10 mg/kg) or saline (1 ml/kg, subcutaneous injections). Rats were monitored on the abnormal involuntary movements (AIMs) test every fifth day. On day 22, animals received a final injection of either L-DOPA or saline one hour prior to sacrifice (in the sham-lesion groups, cases chronically treated with L-DOPA or saline received the same treatment condition on the final day). An intravenous injection of the selected [14C]-tracer (iodo-antipyrine/2-deoxyglucose) was delivered to freely moving rats. Brains were coronally sectioned and exposed for autoradiography. The extent of dopaminergic denervation and blood vessel nestin upregulation were assessed by immunohistochemistry. (B) Experimental groups for [14C]iodoanti-pyrine/[14C]2-deoxyglucose tracers: 6-OHDA dyskinetic (n=12/14), non-dyskinetic (n=14/13), saline controls (n=10/17), and sham lesioned (n=12/9) rats were randomly split and assigned to either the “On Saline” or “ON L-DOPA” condition on the day of tracer injection.
2.1.3 Drugs
L-DOPA methyl ester and the peripheral DOPA decarboxylase inhibitor, Benserazide-HCl (purchased from Sigma-Aldrich AB, Stockholm, Sweden) were freshly dissolved in saline and coadministered subcutaneously (s.c.) at the doses of 10/15 mg/kg for IAP and 2-DG (Lindgren et al., 2009), and 25/15 mg/kg for the study of AIB (as in Papa et al., 1994 and Lindgren et al., 2007), for studying BBB permeability. The injection volume was 1.0 ml/kg body weight. The higher L-DOPA dose used for AIB was motivated by a need to minimize within-group variations that would be expected to occur based on differences in dyskinesia severity. Indeed, with the selected dosage all rats become severely dyskinetic over three treatment weeks (Lindgren et al., 2007; Ohlin et al., 2011).
2.2 Surgical procedures and behavioural assessments
2.2.1 DA-denervating lesion and behavioural screening
Rats included in the experiments received unilateral injections of 6-OHDA-HCl (Sigma-Aldrich, Stockholm, Sweden) or a sham lesion into the right ascending DA fibre bundle (medial forebrain bundle, MFB). Sham lesions were performed by inserting a needle at the same coordinates. Rats were anaesthetized with an intraperitoneal (i.p.) injection of a 20:1 mixture of Fentanyl® and Domitor® (Apoteksbolaget, Sweden AB) and subsequently placed in the stereotaxic frame. 6-OHDA was dissolved in a 0.02% ascorbic acid/saline solution at a concentration of 3.5 μg/μl and injected at the following coordinates (in mm, relative to bregma (i) anteroposterior (AP) = −4.4, lateral (L) = −1.2, dorsoventral (DV) = −7.8; tooth bar = −2.4 (2.5 μl); (ii) AP = −4.0, L = −0.8, DV = −8.0; tooth bar = +3.4 (2 μl). After surgery, animals received analgesic treatment (Temgesic®, 0.167 mg/kg, s.c.; Apoteksbolaget AB, Sweden). Two weeks post-lesion, rats were tested for amphetamine induced-rotation (2.5 mg/kg D-amphetamine i.p.; 90 .min recordings). Only animals showing > 5 net full turns per min in the direction ipsilateral to the lesion were selected for the experiments (Winkler et al., 2002). The extent of the lesion was finally verified with tyrosine hydroxylase (TH) immunohistochemistry in all animals, and rats having > 10% residual TH staining in the DA-denervated striatum were excluded from the study.
2.2.2 Abnormal involuntary movements (AIMs) ratings
The development of dyskinesia was monitored using the rodent abnormal involuntary movements (AIMs) scale (Cenci et al., 1998; Lundblad et al., 2002). The scale considers the following topographic subtypes of dyskinetic movements: (i) axial AIMs, i.e. twisting movements of the neck and upper trunk towards the side contralateral to the lesion; (ii) forelimb AIMs, i.e. repetitive jerks or dystonic posturing of the contralateral forelimb; and (iii) orolingual AIMs, i.e. empty jaw movements and contralateral tongue protrusion. Animals were observed individually for one every 20th minute during 3 hours following the administration of L-DOPA. Each AIM subtype was scored on the original severity scale of Cenci et al., 1998, which is based on the proportion of the monitoring period during which dyskinesia is present (0 = no dyskinesia; 1 = occasional signs of dyskinesia; 2 = signs of dyskinesia present for more than 50% of the observation time; 3 = dyskinesia is present during the entire monitoring period, but is interrupted by external stimuli; 4 = continuous dyskinesia not interrupted by external stimuli). AIMs were rated on five occasions during the 3 weeks of daily L-DOPA treatment. Rats were classified as “dyskinetic” if they displayed a severity score per monitoring period of ≥2 on at least two AIM subtypes on most testing sessions. Animals classified as “non-dyskinetic” exhibited either no AIMs at all, or very mild and occasional AIMs (Lindgren et al., 2009; Westin et al., 2006). Animals that did not fall into either category were excluded.
2.2.3 Surgery and tracer injections
Rats were anaesthetized with a mixture of isofluorane in air (Isoba® vet., Apoteksbolaget, Sweden; 3% and 1.5-2.0% during the induction and maintenance of anaesthesia, respectively). Following local anaesthesia (Marcain®, 0.05 mg/kg s.c. in the wound area; Sigma Aldrich, Sweden), a fine cut was made to expose the right jugular vein, and approximately 1.0 cm of a silicone tube (0.635 and 1.194 mm inner and outer diameter, respectively), filled with physiological saline solution, was introduced through a small incision into the vein and secured with sterile suture string. The distal end of the tube was tunnelled under the skin to the infrascapular region where a long end (15 cm) was secured with surgical tape and the flow was blocked with a small vessel clip. The animals were placed in individual clean cages to recover for three hours prior to radiotracer injection and sacrifice. After recovery from surgery, while rats were moving freely in their cage, the distal end of the catheter tube was coupled to a syringe filled with physiological saline solution. After flushing the tubing with 50-75 μl of saline, either of the three radiotracers, [14C]-iodoantipyrine ([14C]-IAP; 100 μCi/kg), [14C]-2-deoxyglucose ([14C]-2-DG; 100 μCi/kg) or [14C]-aminoisobutyric acid ([14C]-AIB; 100 μCi/kg) (all from American Radiolabeled Chemicals Inc., St Louise, MO, USA) were injected through the catheter (1 ml/kg). The selected radiotracer was delivered intravenously through the catheter with a speed of 0.1 ml/sec. The tracer circulation time was optimized to the physiological parameters being examined, consisting of 10 seconds for [14C]-IAP, 45 minutes for [14C]2-DG, and 25 minutes for [14C]-AIB (Blasberg et al., 1983; Holschneider and Maarek, 2004; Sakurada et al., 1978; Sokoloff et al., 1977). Following the given tracer circulation time, animals were immediately anaesthetized by a bolus injection of sodium pentobarbital (240 mg/kg; Apoteksbolaget AB) through the catheter and killed by decapitation. A sample of the blood ejected from the trunk was immediately collected for a determination of tracer concentration. Brains were extracted in less then 45 seconds (to avoid passive diffusion of the tracer; Williams et al., 1991), flash frozen in isopentane (2-methylbutane; Sigma-Aldrich, Sweden) and stored at −80°C. Plasma samples were separated by 10 min centrifugation and frozen to −20°C.
To verify whether changes in rCBF induced by L-DOPA are conditional on an increased motor activity, [14C]-iodoantipyrine autoradiography was carried out also in the anaesthetized condition in a smaller group of 6-OHDA-lesioned animals (n=15). Animals were anaesthetized with isofluorane as previously described (Bentzer et al., 2001). The femoral artery and the jugular vein were cannulated for measurement of mean arterial blood pressure (MAP) and infusion of the tracer, respectively. Animals thereafter received an injection of either L-DOPA (n=7; 10 mg/kg in combination with 15 mg/kg benserazide, 1 ml/kg s.c.) or physiological saline (n=8; 1 ml/kg, s.c). Sixty minutes following the L-DOPA or saline injection, animals received an infusion of 100 μCi/kg of [14C]-iodoantipyrine at constant speed over 45 seconds. Six timed arterial blood samples of 25 μL were collected during the tracer infusion time. The animals were decapitated simultaneously with the last blood sample, brains were quickly extracted and frozen in 2-methylbutane (−50°C). Blood samples were dissolved in Solvable (Packard, Groningen, Netherlands) at 60 °C for one hour followed by bleaching by 30% hydrogen peroxide at 60 °C for one hour. Following addition of scintillation fluid, [14C] activity was measured in a liquid scintillation counter. Regional blood flow was calculated according to the following equation (Sakurada et al., 1978).
where Ci (T) equals the tissue concentration of a chemically inert diffusible tracer at a given time (T) after the introduction of the tracer into the circulation, λ is the tissue/blood partition coefficient, CA the concentration of the tracer in arterial blood, t is time and K a constant which incorporates the rate of blood flow in the tissue. The constant K is defined as K= (m/λ)(F/W) where m is a diffusion coefficient and F/W is blood flow per unit mass. For iodoantipyrine λ= 0.8 and m=1 (Sakurada et al., 1978).
2.3 Autoradiographic and immunohistochemical analyses
2.3.1 Tissue preparation and autoradiography
Brains were cut in a cryostat (−12 to −18°C) in 20-μm thick coronal sections with a section interdistance of 100 μm. Sections were dried on glass slides and exposed at −20°C on autoradiography films (18 × 24 cm; Kodak BioMax MR-1 Film) in light-tight cassettes (18 × 24 cm; Amersham, UK), along with [14C] microscales (ARC 146C (PL); St. Luis, MO, USA). Film exposure times were optimized for each tracer (96 hours for [14C]-IAP and 66 hours for [14C]-2-DG). Films were developed through immersion in developing solution (Kodak Professional D19 Developer; Kodak, USA) for 4 min followed by fixing solution (Ilford rapid fixer; Harman, UK. Diluted 1:5 in distilled water) for 10 min. Films were placed on a light table at constant illumination and autoradiographs were digitized with a Nikon Digital Camera (DXM1200F) coupled to a computer equipped with Nis-Elements F 3.0 software (Nikon, Japan).
2.3.2 Region of interest analysis
Digital pictures of section autoradiographs were converted to 8-bit and analyzed with the NIH-produced software, ImageJ (http://www.rsb.info.nih.gov/ij/). Optical density units were calibrated on the [14C] microscales (see above) exposed along with the films. Values were thus converted to nCi/g tissue. Measurements were performed by an experimentally blinded investigator. Regions of interest were defined in different basal ganglia nuclei (Fig. 2) spanning the following rostrocaudal levels (numbers give anterior-posterior coordinates in mm relative to bregma according to the rat brain atlas of Paxinos and Watson, 1998): primary motor cortex (M1; +1.00/−0.30), mid-caudal striatum (Str: −0.30/−1.00); globus pallidus (GP; −0.80/−1.00); entopeduncular nucleus (EP; −2.12/−3.00) and substantia nigra pars reticulata (SNr; −5.00/−6.00; Fig. 2). In the striatum and GP, at least three sections per animal, spanning the above rostrocaudal coordinates, were measured. In the EP and SNr, 4-5 sections per animal were analyzed to cover the entire rostrocaudal extents of these structures.
Figure 2. Regions of interest used for optical density analysis.
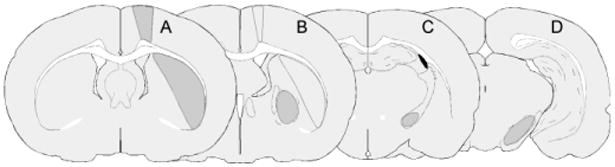
The sampled areas are outlined on representative drawings of coronal sections through the rat brain (A-D). The sections are defined by their anterior-posterior coordinates relative to bregma (in millimetre) according to the rat stereotaxic atlas by Paxinos and Watson, 1998. (A) Primary motor cortex (M1; +1.00/−0.80) and mid striatum (− 0.30/−1.00); (B) Globus pallidus (GP; −0.80/−1.30) and caudal striatum (C) Entopeduncular nucleus (EP; −2.12/−3.00); (D) Substantia nigra pars reticulata (SNr; −5.00/−6.00). Main structure for which the coronal level was chosen is shaded in grey.
2.3.3 Assessments of BBB permeability
The tracer [14C]-aminoisobutyric acid (AIB) is a 104 Da inert amino acid that does not cross an intact BBB during a 25 minutes circulation time (Blasberg et al., 1983). It therefore gives a strong signal on the surface of the brain (pial vessels, venous sinuses) and periventricular spaces. Uptake of this tracer into the brain parenchyma (AIB) was measured on a phosphorimager (Fujifilm FLA-7000; Fujifilm Life Science USA) after exposing the sections to phosphorescent screens for 7 days together with [14C] microscale standards. Autofluorescent images of the same sections were used to outline the regions of interest, which were acquired using an Olympus MVX10 macroscope, merged with a Retiga 4000R (QImaging) monochromatic cooled CCD camera, using a 1.2×/0.5 numerical aperture objective. Images were captured with SlideBook 5.0 software (Intelligent Imaging Innovations Inc., USA) using a green fluorescent protein (GFP) fluorescent filter (excitation λ = 470/40nm; emission λ = 525/50nm; Chroma Technology Corp.; specifically built for Olympus MVX10 XL-sized filter turret). Exported TIFF images of the autofluorescent sections were manually aligned to the corresponding phosphor-images using Photoshop CS4 (Adobe Systems Inc.). The relative [14C]-AIB uptake was measured in the SNr and the lateral striatum at the same rostrocaudal levels as described above. Measurements were not taken in the GP and motor cortex because of the intense radioactivity halo spreading inwards from the cortical surface and the ventricular spaces (cf. Fig. 6 A-C), which would have given artifactually high readings in these structures. Measurements were not taken from the EP either due to difficulties in reliably outlining the boundaries of this structure on the autofluorescent section images.
Figure 6. Nestin immunoreactivity measured on blood vessels within the basal ganglia output structures.
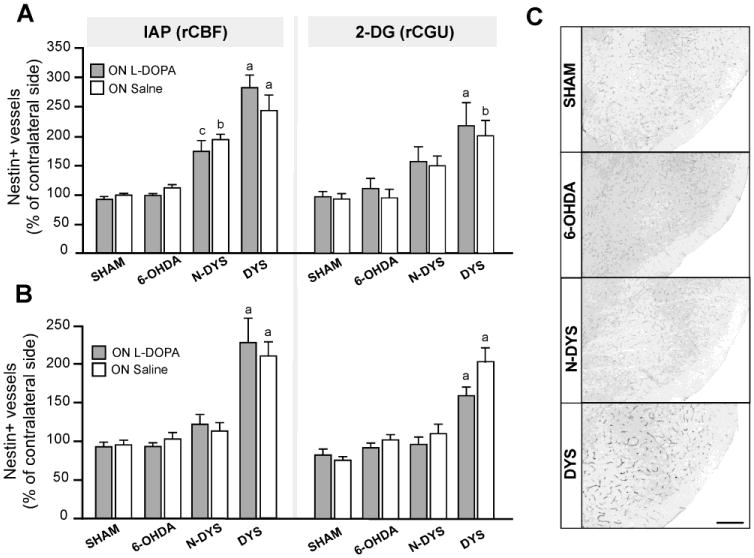
Semi-quantitative analysis of microvessel nestin immunoreactivity in the entopeduncular nucleus (EP; A) and substantia nigra pars reticulata (SNr; B) in sham-lesioned controls, 6-OHDA controls (6-OHDA), non-dyskinetic (Non-dys) and dyskinetic (Dys) animals in the ON L-DOPA and ON saline conditions from the experiments IAP awake and rCGU. Measurements from the DA-denervated side are expressed as a percentage of the values on the contralateral side. One-factor ANOVA followed by Student Newman-Keul's post hoc test, p<0.05 (a) vs all other groups (sham, 6-OHDA controls, non-dyskinetic); (b) vs 6-OHDA controls (ON L-DOPA) groups; (c) sham ON L-DOPA. (C) Low-magnification photomicrographs of the SNr from each treatment arm. Scale bar: 250 μm.
2.3.4 Determination of radioactivity levels in blood samples
Radioactivity levels in blood samples were determined by means of liquid scintillation counting (Beckman LS 6500, Multi-purpose scintillation counter; U.S.A.). Twenty μl of plasma obtained from each animal were mixed with 10 ml of Ultima Gold Liquid Scintillation Cocktail (Perkin-Elmer, Boston, MA). The analysis software automatically converted the specific activity expressed as Curie per millimole (Ci/mmol; CPM) to decay per minute (DPM). These analyses were made to confirm that the intravenous tracer infusion had been successful in all animals included in the study.
2.3.5 Tyrosine hydroxylase and nestin immunohistochemistry
Tyrosine hydroxylase (TH) and nestin immunohistochemistry were performed to estimate the degree of DA denervation (TH) and to compare the levels of angiogenic activity (microvascular nestin expression) among the groups (Lindgren et al., 2009; Westin et al., 2006), respectively. Fresh frozen sections were rinsed in 0.02 M potassium phosphate buffered saline, pH 7.4, containing 0.25% Triton-X (KPBS-T), fixed for 1 h in 10% formalin, and rinsed. Quenching of endogenous peroxidases was done with 3% H2O2 in 10% methanol/water for 15 minutes. Sections were preincubated for 1 hour in blocking buffer (either 5% normal goat serum; NGS, or normal horse serum; NHS, in KPBS/T). This was followed by overnight incubation with one of the following primary antibodies: rabbit-anti-TH (1:1000; Pel-Freeze, Rogers, AR) or mouse-anti-nestin (1:10000; BD Pharmingen, San Jose, CA). Thereafter, sections were rinsed and incubated with the biotinylated goat-anti-rabbit (BA1000, 1:300; Vector Laboratories, Burlingame, CA) or horse-anti-mouse (BA2001, 1: 200; Vector Laboratories) secondary antibody in 2.5% serum blocking solution. Immunocomplexes were visualized using a standard peroxidase-based method (Vectastain Elite ABC; Vector Laboratories) and 3′3′-diaminobenzidine (DAB; Sigma Aldrich) as a chromogen. Sections were rinsed in KPBS/T to stop the DAB reaction, dehydrated in increasing concentrations of alcohol and xylene and coverslipped using DPX mounting medium (Sigma Aldrich, Sweden). Densitometric measurements of TH immunostaining were performed on striatal sections using ImageJ software. Optical density readings were taken at the relevant rostrocaudal levels (see above) on both sides of the brain, and animals having >10% residual TH staining in the striatum ipsilateral to the lesion were excluded from the study. There were no differences in the extent of TH depletion between dyskinetic, non-dyskinetic, and 6-OHDA control groups in any experiment. Sections immunostained for nestin were digitized under bright-field microscopy on a Nikon Eclipse 80i microscope equipped with a digital camera (Olympus DP72). Analysis of nestin-positive microvessels was performed in the EP and SNr (the regions showing largest angiogenic activation in this animal model, Westin et al., 2006) using the image segmentation software VIS (Visiopharm Integrator System; Visiopharm, Denmark). A polynomial local linear filter with pre-trained bayesian pixel classifier was used to separate nestin-positive vessels from background, as in (Lindgren et al., 2009; Westin et al., 2006). Results from the DA-denervated side were expressed as a percentage of the values from the contralateral side.
2.4 Statistical analysis
All data are presented as group means ± standard error of mean (SEM). Optical density readings were converted to radiotracer levels in tissue (nCi/g). In order to compensate for possible differences in absolute tracer uptake between animals and regions, data from the side ipsilateral to the lesion (6-OHDA or sham lesion) were expressed as the percentage change relative to the values from the contralateral side in each animal. Comparisons between the last treatment condition (ON L-DOPA vs ON saline) and experimental groups (sham, 6-OHDA controls, dyskinetic and non-dyskinetic cases) were carried out by two-factor analysis of variance (ANOVA) and post hoc Tukey's honestly significant difference (HSD) test. For the anaesthetized IAP group, paired t-test was used to compare the two sides within each group, and unpaired t-test to compare delta-flow values and physiological parameters between groups. In the AIB study, one-factor ANOVA with post hoc Student Newman Keul's test was used. Statistical analyses were performed with SPSS 17.0 (SPSS, Chicago, IL). The threshold for statistical significance was set at p < 0.05.
3. Results
3.1. Development of abnormal involuntary movements
The development of abnormal involuntary movements (AIMs) was monitored in all experimental groups. In dyskinetic animals, AIM scores reached a stable plateau during the second or third treatment week (Fig 3A-B). There was no significant difference in either the cumulative or the final AIMs scores between experiments investigating rCBF or rCGU (Fig 3A-C). Non-dyskinetic rats displayed either no or very mild signs of dyskinesia (Fig 3), and the AIM scores in this group did not differ significantly from those of saline-treated 6-OHDA-lesioned rats (hereafter termed “6-OHDA controls”). Sham-lesioned rats (both L-DOPA- and saline-treated) did not display any signs of dyskinesia. The administration of L-DOPA to sham-lesioned rats did not exert any obvious motor stimulant effect.
Figure 3. Development of abnormal involuntary movements (AIMs) following chronic L-DOPA treatment.
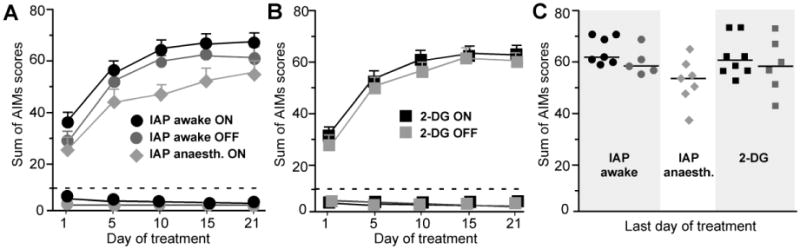
Rats with unilateral 6-OHDA lesions receiving chronic treatment with L-DOPA and benserazide (10/15 mg/kg) for the study of either IAP (awake and anaesthetized) or 2-DG showed similar levels of dyskinesia during the treatment period. (A-B) Development of AIMs during tests performed on days 1, 5, 10, 15, and 20 of L-DOPA treatment. Values above the dashed lines represent dyskinetic groups below are the non-dyskinetic cases. In the experiments, IAP awake (A) and 2-DG (B), animals were randomly assorted into two sub-groups receiving a last injection of either L-DOPA or saline, which are here represented by black and grey symbols, respectively (cf. ON and OFF groups in A and B). (A) Awake dyskinetic ON/OFF n=7/5; non-dyskinetic ON/OFF n=7/7, anaesthetized (ON) n=7. (B) Dyskinetic ON/OFF n=8/6; non-dyskinetic ON/OFF n=7/6. (C) Distribution of individual AIMs scores on the last dyskinesia test in the dyskinetic groups.
3.2. The effect of L-DOPA on regional cerebral blood flow (rCBF)
Rats treated chronically with either L-DOPA or physiological saline for 21 days received a final dose of L-DOPA or saline one hour before [14C]-IAP tracer injection and decapitation, yielding the two conditions: ON L-DOPA and ON Saline (n=5-7 per condition per group). In chronically L-DOPA treated animals, the latter condition corresponds to an “OFF L-DOPA” state. In all regions examined, rCBF did not differ significantly among the groups in the ON Saline condition, whereas strong effects occurred ON L-DOPA. In the primary motor cortex (M1), all groups showed a modest increase in rCBF ON L-DOPA compared to the ON Saline condition (two-factor ANOVA, F(7,48)=4.74, Pgroup<0.272, PL-DOPA/SALINE<0.0001, Pinteraction=0.059; Fig 4A-B). In the post hoc comparisons, the increase in rCBF on L-DOPA vs saline reached significance in the 6-OHDA controls and dyskinetic groups (approx. 30% and 20% increase vs the saline condition, respectively; Fig 4A). In the striatum, clear-cut effects were seen in all the overall comparisons (two-factor ANOVA, F(7,48)=20.45, Pgroup<0.0001; PL-DOPA/SALINE <0.0001; Pinteraction<0.0001; Fig 4A-B). Following the administration of L-DOPA, the largest augmentation in rCBF occurred in the dyskinetic group (+52%) followed by 6-OHDA controls (+29%) both p<0.05 vs all other groups/conditions). A modest but significant increase in rCBF ON L-DOPA (+13%) was present in the non-dyskinetic group (p<0.05 vs the corresponding saline condition). In the GP, there were strong overall effects too (Fig 4; two-factor ANOVA, F(7,48)=20.25, Pgroup<0.0001, PL-DOPA/SALINE<0.0001, Pinteraction<0.0001). Both dyskinetic rats and 6-OHDA controls showed pronounced rCBF increases in the GP ON L-DOPA vs Saline (approximately +65%, p<0.05 vs all other groups). Strong overall effects also occurred in the two output nuclei of the basal ganglia, the EP and SNr (two-factor ANOVA, EP: F(7,48)=19.33, Pgroup<0.0001; PL-DOPA/SALINE <0.0001; Pinteraction<0.0001, SNr: F(7,48)=34.25, Pgroup<0.0001; PON-OFF<0.0001; Pinteraction<0.0001; Fig 4). The largest changes in rCBF ON L-DOPA occurred in dyskinetic rats, amounting to an increase by 91% in the EP (p<0.05 vs all other groups/conditions) and by 61% in the SNr (p<0.05 vs all other groups/conditions but 6-OHDA control ON L-DOPA; Fig 4). 6-OHDA controls also showed large increases ON L-DOPA (+53% in the EP, p<0.05 vs all other groups/conditions and +60% in the SNr, p<0.05 vs all groups/conditions but dyskinetic ON L-DOPA). The non-dyskinetic group showed modest increases in rCBF (30% and 9% in the EP and SNr, respectively), which did not however reach statistical significance in any post hoc comparison.
Figure 4. Relative changes in regional cerebral blood flow (rCBF) associated with unilateral DA lesion, chronic L-DOPA treatment and expression of dyskinesia.
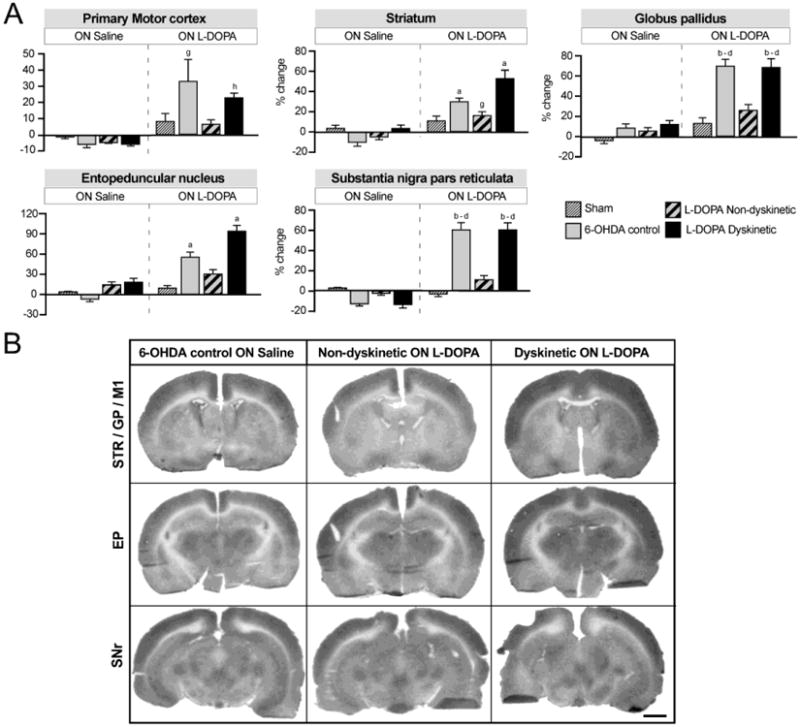
(A) Bar charts show the results from region of interest analysis of IAP optical density. Data from the DA-denervated side are expressed as the percentage change relative to the contralateral side. Two-factor ANOVA followed by Tukey's HSD post hoc test, p<0.05 vs. (a) all other groups; (b) all groups ON Saline; (c) sham ON L-DOPA; (d) non-dyskinetic ON L-DOPA; (e) sham ON Saline; (f) non-dyskinetic ON Saline; (g) 6-OHDA control ON Saline; (h) dyskinetic ON Saline. For the two groups treated chronically with L-DOPA (dyskinetic and non-dyskinetic), the ON saline condition corresponds to an “OFF L-DOPA” state (i.e. 24 hours after the last dose of L-DOPA in the chronic treatment). (B) Representative autoradiographs of sections used in the analysis. Left column: 6-OHDA lesion control rats not given L-DOPA (ON Saline); Middle column: Non-dyskinetic rats given a last injection of L-DOPA; Right column: Dyskinetic rats given a last injection of L-DOPA. The represented sections contain the following regions of interest (cf. Fig. 2): Top row, Caudal striatum (STR), globus pallidus (GP), and primary motor cortex (M1); Middle row, entopeduncular nucleus (EP); Bottom row, substantia nigra pars reticulata (SNr). The lesioned side is shown to the right. Scale bar: 2 mm.
The application of [14C]-IAP autoradiography to anaesthetized rats allows for monitoring the tracer concentrations in the arterial blood at multiple and tightly spaced time points, which is required to calculate the actual blood flow rate in each region as ml/min/g of tissue (Sakurada et al., 1978). We applied the [14C]-IAP technique using this protocol to a limited number of animals (L-DOPA-treated dyskinetic rats and saline-treated lesioned controls, n=7 and 8, respectively). Intravenous tracer infusion was performed 60 min after the injection of L-DOPA (dyskinetic rats) or saline (control group). The absolute rCBF values (ml × min−1 × g−1) in the regions of interest were in the range previously reported in anaesthetized rats of this age and strain (Mies, 1997). In the saline-treated group, only the GP showed enhanced flow rates on the DA-denervated side compared to the intact side, while L-DOPA raised the flow values on the DA-denervated side in most structures; Table 1). A comparison between groups was performed using the difference in absolute flow values between hemispheres (Δflow, Table 1). This comparison showed significantly increased flow rates in the L-DOPA group in all structures examined (p<0.05 vs. saline; Table 1). Respiratory and cardiovascular parameters (Table 2) were in the normal physiological range (Bentzer et al., 2001). Arterial blood oxygenation levels (PaO2) were slightly but significantly larger in L-DOPA-treated rats (independent samples t-test; t(14)=3.02, p=0.02; Table 2) but the partial pressure of CO2 and the mean arterial pressure did not differ between the two groups.
Table 1. Regional cerebral blood flow values in anaesthetized rats.
| Region | L-DO PA (n=7) | SALIN E (n=8) | Δ flow L-DOPA vs SALINE | ||||||
|---|---|---|---|---|---|---|---|---|---|
| Ipsi | Contra | p-value paired t-test | Δflow (ml/min/g) | Ipsi | Contra | p-value paired t-test | Δflow (ml/min/g) | p-value unpaired t-test | |
| Striatum | 1.44 ± 0.10# | 1.21 ± 0.09 | p=0.006 | 0.23±0.05* | 1.24 ± 0.09 | 1.27± 0.09 | p=0.261 | −0.03 ± 0.02 | p=0.003 |
| Globus pallidus | 1.23 ± 0.10# | 0.84 ± 0.10 | P=0.001 | 0.39 ± 0.06* | 1.03 ± 0.07# | 0.86 ± 0.06 | p=0.004 | 0.18 ± 0.04 | p=0.012 |
| Entopeduncular nucleus | 1.17 ± 0.10# | 0.80 ± 0.09 | p=0.001 | 0.37 ± 0.06* | 0.81 ± 0.08 | 0.84 ± 0.07 | p=0.900 | −0.01 ± 0.02 | p<0.0001 |
| Substantia nigra pars reticulata | 1.24 ± 0.09 | 1.17 ± 0.08 | p=0.054 | 0.10 ± 0.03* | 0.85 ± 0.14 | 0.89 ± 0.15 | p=0.150 | −0.04 ± 0.03 | p=0.004 |
| Primary motor cortex | 1.19 ± 0.09# | 1.14 ± 0.09 | p=0.007 | 0.05±0.01* | 1.20 ± 0.10 | 1.22 ± 0.10 | p=0.290 | −0.03 ± 0.01 | p=0.007 |
Values are given in estimated regional cerebral blood flow in ml/min/g tissue. Ipsi (ipsilateral hemisphere; lesioned side), Contra (contralateral hemisphere, intact side), Δ flow (side difference in flow values between ipsilateral and contralateral side), values presented as ± standard error of mean.
p<0.05 unpaired t-test between groups within each region for delta-flow.
p<0.05 paired samples t-test within each region and treatment group.
Table 2. Physiological data for anaesthetized animals (14C-iodo-antipyrine).
| Variable | L-DOPA (n=7) | SALINE (n=8) | Unpaired T-test p-value |
|---|---|---|---|
|
| |||
| Hct % | 41.0 ± 0.8 | 39.8 ± 0.4 | p=0.19 |
| PaO2 | 11.9±0.3* | 10.7 ± 0.3 | p=0.02 |
| PaCO2 | 4.7 ± 0.1 | 4.9 ± 0.1 | p=0.58 |
| pH | 7.5±0.0 | 7.5±0.1 | p=0.86 |
| MAP (mmHg) | 105.7±6.5 | 114.4±5.8 | p=0.13 |
Hct=hematocrit, MAP (mean arterial blood pressure), ± (standard error of mean) Pa (partial pressure).
p<0.05, unpaired t-test.
3.3. The effect of L-DOPA on regional cerebral glucose utilization (rCGU)
Studies regarding the effects of chronic L-DOPA treatment on rCGU were carried out only in awake rats according to the same experimental design as for [14C]-IAP autoradiography (Fig 1B; n=4-9 per group and condition). Unlike the rCBF patterns, significant group differences in rCGU could be observed in the ON saline condition in a number of structures, reflecting the impact of the DA-denervating lesion on brain metabolic activities, as previously reported (Wooten and Collins 1981). In the motor cortex, rCGU tended to be reduced by the 6-OHDA lesion in all groups, but this effect only reached significance in chronically L-DOPA-treated rats (−8-12%; Fig 5; two-factor ANOVA F(7,52)=4.85, Pgroup=0.0001, PL-DOPA/SALINE =0.76, Pinteraction=0.30, p<0.05 for dyskinetic and non-dyskinetic groups vs the sham group ON L-DOPA). In the striatum, the 6-OHDA lesion per se did not have any significant effect on rCGU, but overall differences were seen between the ON L-DOPA and the ON Saline conditions (two-factor ANOVA F(7,52)=3.28, Pgroup=0.179, PL-DOPA/SALINE=0.001, Pinteraction=0.193). Indeed, L-DOPA tended to enhance striatal rCGU in all groups, although the increase reached significance only in the 6-OHDA control group (+8%, p<0.05 vs ON Saline). In the GP, there was a strong overall group effect but no overall effect of treatment (Fig. 5; two-factor ANOVA F(7,52)=3.96, p(group)<0.0001, pL-DOPA/SALINE=0.348, pinteraction=0.612) and only the 6-OHDA control group differed significantly from sham-lesioned animals ON L-DOPA. In the EP, no clear lesion-induced effects were present ON Saline, but there was an overall effect of L-DOPA treatment (Fig 5; two-factor ANOVA; EP: F(7,52)=5.24, Pgroup=0.245, PL-DOPA/Saline<0.0001, Pinteraction=0.053). The strongest increase in rCGU following L-DOPA administration was seen in the dyskinetic group (34%). In the SNr, there were significant overall differences between groups and conditions (two-factor ANOVA; F(7,52)=11.49, Pgroup <0.0001, PL-DOPA/SALINE <0.0001, Pinteraction=0.003). Group differences did not reach significance ON Saline. However, following the administration of L-DOPA, the 6-OHDA control group showed a significant increase in rCGU (+30%, p < 0.05 vs 6-OHDA controls ON saline, non-dyskinetic and sham groups ON L-DOPA), while the dyskinetic group only showed a relative increase of 13% (p <0.05 vs its ON saline condition).
Figure 5. Relative changes in regional cerebral glucose utilization (rCGU) associated with unilateral DA lesion, chronic L-DOPA treatment and expression of dyskinesia.
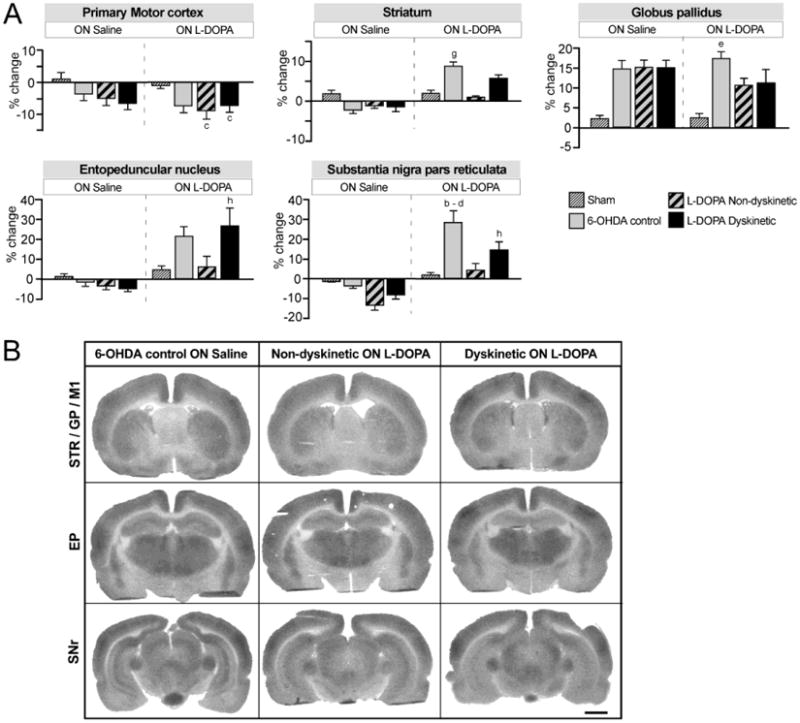
(A) Bar charts show the results from region of interest analysis of 2-DG optical density. Data from the DA-denervated side are expressed as the percentage change relative to the contralateral side. Two-factor ANOVA followed by Tukey's HSD post hoc test, p<0.05 vs. (a) all other groups; (b) all groups ON Saline; (c) sham ON L-DOPA; (d) non-dyskinetic ON L-DOPA; (e) sham ON Saline; (f) non-dyskinetic ON Saline; (g) 6-OHDA control ON Saline; (h) dyskinetic ON Saline. For the two groups treated chronically with L-DOPA (dyskinetic and non-dyskinetic), the ON saline condition corresponds to an “OFF L-DOPA” state (i.e. 24 hours after the last dose of L-DOPA in the chronic treatment). (B) Representative autoradiographs of sections used in the analysis. Left column: 6-OHDA lesion control rats not given L-DOPA (ON Saline); Middle column: Non-dyskinetic rats given a last injection of L-DOPA; Right column: Dyskinetic rats given a last injection of L-DOPA. The represented sections contain the following regions of interest (cf. Fig. 2): Top row, Caudal striatum (STR), globus pallidus (GP), and primary motor cortex (M1); Middle row, entopeduncular nucleus (EP); Bottom row, substantia nigra pars reticulata (SNr). The lesioned side is shown to the right. Scale bar: 2 mm.
3.4 Microvessels expressed nestin following chronic but not acute L-DOPA treatment
Endothelial expression of nestin occurs under conditions of active angiogenesis (Alonso et al., 2005; Mokrý and Nemecek, 1999). In the present study, nestin expression was quantified in the EP and SNr, regions that exhibit the highest angiogenic activity in L-DOPA-treated animals (Lindgren et al., 2009; Westin et al., 2006). Results are shown in Fig 6A-B, while Fig 6C shows low magnification photomicrographs of nestin immunoreactivity in the SNr from all the main experimental groups in this study. In the IAP and 2-DG studies, dyskinetic rats showed significantly higher levels of nestin-immunopositive vessels that non-treated rats in both the EP (>2-fold on DA-denervated side; Fig 6A; IAP: F(7,34)=19.0; p<0.0001; 2-DG: F(7,35)=9.2; p<0.0001) and the SNr (Fig 6B-C; IAP: F(7,33)=14.0; p<0.0001; 2-DG: F(7,39)=17.0; p<0.0001). Small elevations in EP microvessel nestin expression were observed also in non-dyskinetic animals, reaching significance in IAP (awake; p<0.05 vs sham group, Fig 6A). No significant upregulation of nestin was detected in acutely L-DOPA treated animals (cf. 6-OHDA, ON L-DOPA, Fig 6).
3.5 Permeability of the BBB
We have previously reported that dyskinetic rats show histological evidence of increased BBB permeability in the basal ganglia (Westin et al., 2006; Lindgren et al., 2009; Ohlin et al, 2011). To address the question, whether a larger BBB leakage may occur under conditions of increased rCBF, we prepared a group of dyskinetic rats with similarly high AIMs scores and used these for autoradiographic analysis of BBB permeability. To this end, the regional permeability of the BBB was studied in the striatum and the SNr by measuring the local uptake of [14C]-aminoisobutyric acid ([14C]-AIB), an inert amino acid that is not efficiently transported across the brain endothelium (Blasberg et al, 1983). Chronically L-DOPA-treated rats received their last L-DOPA dose either one hour or 24 hours prior to tracer injection, thus mimicking an ON versus OFF L-DOPA state, and both groups were compared to saline-injected 6-OHDA controls (n=6-8 per group). In both the striatum and the SNr, region of interest analysis revealed increases in tracer accumulation in the chronically L-DOPA-treated rats (one-factor ANOVA, striatum; F(2,22)=4.77 p=0.016; SNr: F(2,21)=5.67, p=0.010; Fig 7D and H respectively). In the post hoc comparisons, a significant increase in tracer uptake in the striatum only occurred during the ON L-DOPA condition (p<0.05 vs saline controls; Fig 7D). In the SNr, significant increases in tracer uptake above controls (saline) occurred in both the ON and the OFF L-DOPA group (+45% and +27%, p<0.05 vs saline controls, respectively), but were more prominent in the former (p < 0.05 for ON vs OFF L-DOPA; Fig 7H). Visual inspection of the autoradiographs showed regional heterogeneity in tracer uptake within the striatum, with “hot spots” of radioactivity that were mostly seen in the lateral region flanking the external capsule (see Fig 7A-C, E-G).
Figure 7. Regional permeability of the BBB ON and OFF L-DOPA.
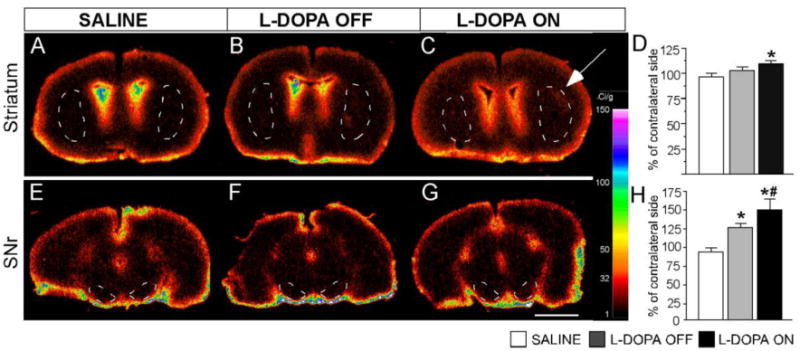
Digitized autoradiographs representing [14C]-aminoisobutyric acid (AIB) uptake in the striatum (A, B and C) and SNr (E, F and G). Left column (A and E): saline treated animals; Mid column (B and F): dyskinetic animals OFF L-DOPA; Right column (C and G): dyskinetic animals ON L-DOPA. The calibration bar to the right shows the Ci/g equivalents of the pseudocolor scale. (D and H) Quantitative analysis of [14C]-AIB uptake in the striatum and SNr, respectively. Data from the DA-denervated side are expressed as a percentage of the values measured on the contralateral side. High concentrations of the tracer on the brain surface and periventricular regions are an expected feature of this method. In C, a white arrow points to an area of focal accumulation of the radiotracer in the dorsolateral striatum. One-factor ANOVA followed by post hoc Student-Newman Keul's test, p<0.05, * vs saline; # vs L-DOPA OFF group. Scale bar 500 fm.
4. Discussion
The present study is the first to systematically compare changes in rCBF and rCGU in an animal model of PD at baseline and following L-DOPA treatment. Our results show that L-DOPA administration increases blood flow and metabolism in the DA-denervated basal ganglia nuclei but that the magnitude of the effect is largely dependent on the motor response evoked by the treatment. Chronically L-DOPA-treated animals that had remained free from dyskinesia had small, if any, relative changes in either rCBF or rCGU. By contrast, chronically treated dyskinetic rats exhibited significant changes in CBF and CGU in regions previously reported to show angiogenic activity in this animal model (Westin et al., 2006).
Changes in rCGU induced by a nigrostriatal DA lesion and L-DOPA treatment have been previously reported in 6-OHDA-lesioned rats (Engber et al., 1990; Trugman et al., 1996; Trugman and Wooten, 1986; Wooten and Collins, 1981) and non-human primate models of PD (Bezard et al., 2001, Mitchell et al 1986; 1992, Palombo et al., 1990). This is, however, the first study to examine differences between chronically and acutely L-DOPA-treated rats (cf. group comparisons “ON L-DOPA”), and to discriminate dyskinetic from non-dyskinetic cases among the chronically L-DOPA treated animals. In agreement with previous findings (Wooten and Collins, 1981), slight depressions in metabolic activity following the 6-OHDA lesion were found in all regions examined but for the GP, where rCGU was instead increased. An increased metabolic rate in this region at baseline can be explained by an overactivity of the indirect striatopallidal pathway caused by DA-denervation (Albin et al., 1989).
Likewise, L-DOPA injections caused rCGU responses similar to those previously reported (Trugman and Wooten, 1986), consisting in large elevations in 2-DG uptake in the basal ganglia output nuclei (EP and SNr), and more subtle effects in the striatum and GP. Interestingly, non-dyskinetic rats showed a blunted rCGU response to L-DOPA. The blunted metabolic response in non-dyskinetic rats parallels a lack of significant plastic adaptations in these brain regions in this category of animals (Westin et al., 2006, 2007).
The present study also provides the first demonstration that alterations in rCBF caused by peripheral L-DOPA injections have a similar, but not identical, anatomical pattern as the corresponding metabolic changes and that they are linked to the motor response elicited by the treatment. A comparison between acutely and chronically L-DOPA treated animals indicates that, on their first exposure to L-DOPA, all 6-OHDA lesioned rats respond with increases in rCBF in the regions examined (including the motor cortex), the highest response magnitude occurring in the EP and the SNr. Following chronic L-DOPA treatment, the pattern of rCBF differs dramatically between dyskinetic and non-dyskinetic rats. While the latter exhibit modest rCBF increases, dyskinetic rats show rCBF responses that are equally high, or even higher, than those measured in acutely L-DOPA-treated 6-OHDA controls (see rCBF data ON L-DOPA from the striatum and EP). This pattern of changes parallels previously reported differences in the expression levels of neuroplasticity markers between these group categories (reviewed in Cenci and Konradi, 2010). In agreement with our results, a recent pharmacological magnetic resonance imaging (phMRI) study performed in unilaterally 6-OHDA-lesioned rats has showed that D1 receptor agonist-induced dyskinesia is associated with a sensitization in blood-oxygenation level-dependent (BOLD) signal (corresponding to functional hyperaemia) in the striatum and motor cortex after repeated drug exposure (Delfino et al., 2007). The deep basal ganglia structures were not examined in this study, probably due to the limited anatomical resolution offered by the phMRI technique.
Measurements of rCBF in the present study were also performed in a group of rats that were kept anaesthetized before and during the tracer infusion. Even though the response magnitude was overall lower than that seen in awake rats, significant changes in rCBF were present in the lesioned hemisphere ON L-DOPA also in anaesthetized rats. These data indicate that a direct pharmacological effect of L-DOPA can raise rCBF in most parts of the basal ganglia independent of ongoing motor activity/expression of dyskinesia. It is also interesting to observe that the 6-OHDA lesion had resulted in a hyperperfusion of the GP, which paralleled the lesion-induced hypermetabolism.
Despite overall similarities in the L-DOPA-induced patterns of rCBF and rCGU, some important differences deserve particular attention. First, rCBF in the motor cortex was significantly enhanced ON L-DOPA in 6-OHDA-lesioned animals, while the rCGU in this region was reduced under the same conditions. Second, striatal rCBF ON L-DOPA was larger in dyskinetic rats than in acutely L-DOPA-treated animals, while a clear trend could be observed for rCGU to be reduced in the former compared to the latter group. Similar trends emerge from a comparison between changes in rCBF and rCGU in the SNr. In addition, L-DOPA treatment tended to reduce rCGU in the GP, while rCBF was further enhanced by L-DOPA also in this region. These findings point to some degree of dissociation between changes in flow and metabolism following treatment with L-DOPA.
Our results raise questions on the possible mechanisms by which L-DOPA elevates rCBF in the basal ganglia. In the absence of specific pharmacological stimuli or disease conditions, rCBF increases as a direct response to neuronal activity, a process known as functional hyperaemia (Girouard and Iadecola, 2006). Cerebral blood flow and glucose metabolism are normally tightly coupled and linearly correlated in the healthy brain (Girouard and Iadecola, 2006; Klein et al., 1986; Fox et al., 1988), while oxygen consumption increases to a lower rate than rCBF (Fox et al., 1988), providing the basis of BOLD-signal magnetic resonance imaging (MRI; Attwell and Iadecola, 2002). However, flow-metabolism responses may be uncoupled under a range of physiological conditions (reviewed in Ekstrom, 2011; Paulson et al., 2010), in neurological disease (Zlokovic, 2008), and in response to certain pharmacotherapies (Hirano et al., 2008). Interestingly, a few independent studies have evidenced changes in both rCGU (Borghammer et al., 2011) and rCBF (Hershey 1998, 2003; Morgante et al., 2006; Rascol et al., 1998) or both (HIrano et al., 2008) in the human parkinsonian brain. A PET imaging study mapping both rCGU and rCBF responses in PD patients provided evidence of flow-metabolism dissociation in the “ON L-DOPA” condition (Hirano et al., 2008). While rCBF was abnormally increased in striatal, pallidal, and brain stem regions, rCGU responses were either unchanged or depressed following the administration of L-DOPA. Interestingly, these effects were very prominent in PD patients suffering from LID (Hirano et al., 2008). It is possible that a similar flow-metabolism dissociation occurs in our animal model, although a comparison with the human study would require the use of similar techniques and analytical methods.
The increase in rCBF induced by L-DOPA in the DA-denervated brain is likely dependent on a stimulation of D1-class receptors. This hypothesis is supported by the realization that L-DOPA-induced changes in rCBF (and rCGU) are largest in the basal ganglia output nuclei, the EP and SNr, where the D1 receptor class clearly predominates over the D2 one (18:1 and 36:1 expression ratio of D1 vs D2 receptors, respectively, Boyson et al., 1986). Moreover, the effect of DA on rCBF has been closely linked to the D1 receptor by previous studies, as pharmacological D1 receptor stimulation enhances imaging parameters related to rCBF in the striatum both in DA-denervated animals (Delfino et al., 2007) and in the non-denervated brain (Choi et al., 2006; Nguyen et al., 2000). In addition, D1 agonists exert direct effects on the vascular diameter in isolated brain arterioles (either dilatation or constriction; Edvinsson et al., 1978, 1985). Indeed, D1 receptors are expressed not only in neurons, but also in brain endothelial cells and astrocytes, particularly in the striatum and the midbrain (Choi et al., 2006; Hansson et al., 1984; Miyazaki et al., 2004; Zanassi et al., 1999). Interestingly, a recent study has shown that the astrocytic expression of D1 receptors and their downstream signalling proteins is dynamically regulated in the brain in vivo (Ruscher et al. 2011). Future studies should therefore explore whether the supersensitivity of D1 receptors that occurs following DA denervation (reviewed in Cenci and Konradi, 2010; Gerfen et al., 2002) also can affect non-neuronal cells of the neurovascular unit, in addition to neurons.
A particularly important implication of changes in rCBF in our animal model is their possible association with angiogenesis. Indeed, the regions of increased rCGU and rCBF “ON L-DOPA” in this study also show angiogenic activity (Lindgren et al., 2009; Westin et al., 2006). Taken together, the results of the present study suggest that a combination of large changes in rCBF and a high metabolic rate ON L-DOPA concur with an angiogenic response to the treatment. For example, there is no angiogenic response to L-DOPA in the motor cortex (Westin et al., 2006), where rCBF is enhanced but rCGU reduced. An important, novel contribution of this study is the demonstration that BBB permeability is transiently increased following the administration of L-DOPA to dyskinetic rats. While the BBB changes that are seen in this animal model appear to be subtle compared to those in brain tumours (Lockman et al., 2010) or temporal lobe epilepsy (Van Vliet et al., 2007), their potential impact should not be underestimated. Indeed, a leaky BBB has deleterious effects on perivascular astrocytes and neurons, which may contribute to slow neurodegenerative changes (Zlokovic, 2008). In this animal model of PD and LID, hyperpermeability of the BBB was previously established using albumin immunoreactivity as a measure of cumulative BBB leakage (Ohlin et al., 2011; Westin et al., 2006). In the present study, the use of [14C]-AIB has allowed us to determine when exactly the leakage occurs, pointing to its association with an increased rCBF ON L-DOPA. Indeed, a fluctuating perfusion pressure causes significant shear stress on the endothelium and may enhance tight junction opening between endothelial cells (Sandoval and Witt, 2008). Accordingly, studies in rats have shown that hypercapnia-induced vasodilatation is associated with an increased permeability of the BBB and ensuing extravasation of blood-borne proteins (Johansson and Nilsson, 1977). Although the haemodynamic responses to L-DOPA are unlikely to be as extreme as those measured during experimental hypercapnia, the angiogenic activity associated with chronic L-DOPA exposure and dyskinesia may render specific subsets of microvessels particularly leaky upon even modest increases in rCBF. This suggestion is in keeping with the striatal pattern of 14C-AIB uptake in the present study, showing hot spots of tracer uptake in areas that consistently express high indices of angiogenesis in this animal model of LID (Westin et al., 2006; Ohlin et al., 2011).
In addition to the findings in animal models, there are reports of deficient BBB function also in PD patients (Bartels et al., 2008; Kortekaas et al., 2005), and angiogenic activity has been detected in the post-mortem PD basal ganglia in several independent studies (Faucheux et al., 1999; Desai et al., 2011; Ohlin et al, 2011). The results of this study suggest that the permeability of an already compromised BBB in PD may increase following the administration of L-DOPA, at least in patients that experience dyskinesia.
5. Conclusion
The present study provides new pathophysiological clues to LID from a non-neuronal perspective (Fig 8). We suggest that large intermittent elevations in brain DA levels during L-DOPA treatment (Pavese et al., 2006; Lindgren et al, 2010) induce transient and large increases in rCBF in the DA-denervated basal ganglia. These intermittent elevations in rCBF concur with an increased local metabolic activity and with an upregulation of angiogenic cytokines (Ohlin et al., 2011) to stimulate angiogenesis in the most affected brain regions. The resulting microvascular plasticity has a maladaptive character, contributing to the development of LlD (Ohlin et al., 2011) and possibly also to slow neurodegenerative changes in these regions (Naydenov et al., 2010; Zlokovic, 2008).
Figure 8. Hypothetical model of how an increased rCBF ON L-DOPA may be causally linked with long-lasting microvascular plasticity in LID.
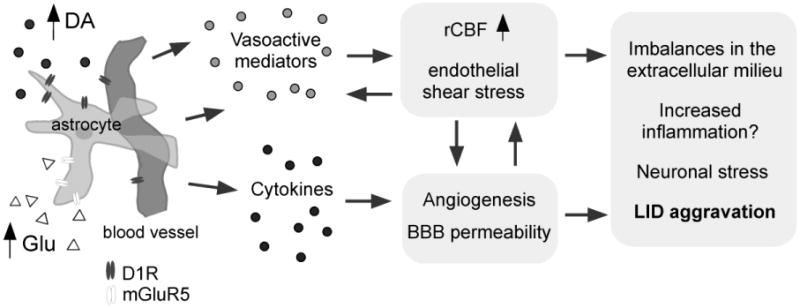
High extracellular levels of dopamine (DA) and glutamate (Glu) during the expression of LID (Lindgren et al., 2010; Mela et al., 2011) stimulate cells of the neurovascular unit (here represented by an astrocyte and its associated microvessel) to produce angiogenic growth factors (e.g. vascular endothelial growth factor; Ohlin et al., 2011) and vasoactive substances in the DA-denervated basal ganglia. Elevations of rCBF, angiogenesis, and an increased BBB permeability are proposed to be interdependent processes that may have deleterious effects on perivascular astrocytes (Seifert and Steinhauser 2011) and neurons (Zlokovic 2010), contributing to an aggravation of LID during the course of PD. Abbreviations: D1R, D1 type DA receptor; mGluR5, metabotropic glutamate receptor type 5; LID, L-DOPA-induced dyskinesia.
Based on results from animal models, therapeutic development efforts for LID are currently focused on normalizing signalling responses in neurons. Our results indicate that maladaptive responses of the neurovascular unit may be an additional important target for future treatments, particularly from the point of view of preventing the chronic, dysfunctional brain plasticity that renders dyskinesia poorly responsive to palliative pharmacological intervention (reviewed in Cenci et al., 2011).
Acknowledgments
The authors are thankful to Ann-Christin Lindh, Michael Sparrenius and Helén Axelberg for excellent technical assistance. The work was supported by grants from the Swedish Research Council, the Swedish Brain Foundation, the Michael J Fox Foundation of Parkinson's Disease Research, and by a subcontract from the NIH Morris K. Udall Centre of Excellence for Parkinson's disease research (NIH P50 NS0716759 to M.A.C).
Abbreviations
- AIB
[14C]-aminoisobutyric acid
- AIMs
abnormal involuntary movements
- BBB
blood-brain barrier
- DA
dopamine
- 2-DG
[14C]-2-deoxyglucose
- IAP
[14C]-iodoantipyrine
- KPBS-T
potassium phosphate buffered saline containing 0.25% Triton-X
- LID
L-DOPA-induced dyskinesia
- MFB
medial forebrain bundle
- 6-OHDA
6-hydroxydopamine
- PD
Parkinson's disease
- PET
positron emission tomography
- phMRI
Pharmacological magnetic resonance imaging
- rCBF
regional cerebral blood flow
- rCGU
regional cerebral glucose utilization
- TH
tyrosine hydroxylase
Footnotes
Publisher's Disclaimer: This is a PDF file of an unedited manuscript that has been accepted for publication. As a service to our customers we are providing this early version of the manuscript. The manuscript will undergo copyediting, typesetting, and review of the resulting proof before it is published in its final citable form. Please note that during the production process errors may be discovered which could affect the content, and all legal disclaimers that apply to the journal pertain.
References
- Albin RL, Young AB, Penney JB. The functional anatomy of the basal ganglia. Trends in Neurosciences. 1989;12:366–374. doi: 10.1016/0166-2236(89)90074-x. [DOI] [PubMed] [Google Scholar]
- Alonso G, Galibert E, Duvoid-Guillou A, Vincent A. Hyperosmotic stimulus induces reversible angiogenesis within the hypothalamic magnocellular nuclei of the adult rat: a potential role for neuronal vascular endothelial growth factor. BMC Neurosci. 2005;6:20. doi: 10.1186/1471-2202-6-20. [DOI] [PMC free article] [PubMed] [Google Scholar]
- Attwell D, Iadecola C. The neural basis of functional brain imaging signals. Trends Neurosci. 2002;25:621–625. doi: 10.1016/s0166-2236(02)02264-6. [DOI] [PubMed] [Google Scholar]
- Bartels AL, Willemsen ATM, Kortekaas R, de Jong BM, de Vries R, de Klerk O, van Oostrom JCH, Portman A, Leenders KL. Decreased blood-brain barrier P-glycoprotein function in the progression of Parkinson's disease, PSP and MSA. J Neural Transm. 2008;115:1001–1009. doi: 10.1007/s00702-008-0030-y. [DOI] [PMC free article] [PubMed] [Google Scholar]
- Bentzer P, Mattiasson G, McIntosh TK, Wieloch T, Grande PO. Infusion of prostacyclin following experimental brain injury in the rat reduces cortical lesion volume. J Neurotrauma. 2001;18:275–285. doi: 10.1089/08977150151070919. [DOI] [PubMed] [Google Scholar]
- Bezard E Crossman AR, Gross CE Brotchie JM. Structures outside the basal ganglia may compensate for dopamine loss in the presymptomatic stages of Parkinson's disease. FASEB J. 2001;15:1092–1094. doi: 10.1096/fj.00-0637fje. [DOI] [PubMed] [Google Scholar]
- Bezard E, Brotchie JM, Gross CE. Pathophysiology of levodopa-induced dyskinesia: potential for new therapies. Nat Rev Neurosci. 2001;2:577–588. doi: 10.1038/35086062. [DOI] [PubMed] [Google Scholar]
- Blasberg RG, Fenstermacher JD, Patlak CS. Transport of alpha-aminoisobutyric acid across brain capillary and cellular membranes. J Cereb Blood Flow Metab. 1983;3:8–32. doi: 10.1038/jcbfm.1983.2. [DOI] [PubMed] [Google Scholar]
- Borghammer P, Hansen SB, Eggers C, Chakravarty M, Vang K, Aanerud J, Hilker R, Heiss WD, Rodell A, Munk OL, Keator D, Gjedde A. Glucose metabolism in small subcortical structures in Parkinson's disease. Acta Neurol Scand. 2011 doi: 10.1111/j.1600-0404.2011.01556.x. [DOI] [PubMed] [Google Scholar]
- Boyson SJ, McGonigle P, Molinoff PB. Quantitative autoradiographic localization of the D1 and D2 subtypes of dopamine receptors in rat brain. J Neurosci. 1986;6:3177–3188. doi: 10.1523/JNEUROSCI.06-11-03177.1986. [DOI] [PMC free article] [PubMed] [Google Scholar]
- Carmeliet P. Mechanisms of angiogenesis and arteriogenesis. Nature medicine. 2000;6:389–395. doi: 10.1038/74651. [DOI] [PubMed] [Google Scholar]
- Cenci MA, Konradi C. Maladaptive striatal plasticity in L-DOPA-induced dyskinesia. Prog Brain Res. 2010;183:209–233. doi: 10.1016/S0079-6123(10)83011-0. [DOI] [PMC free article] [PubMed] [Google Scholar]
- Cenci MA, Lee CS, Bjorklund A. L-DOPA-induced dyskinesia in the rat is associated with striatal overexpression of prodynorphin- and glutamic acid decarboxylase mRNA. Eur J Neurosci. 1998;10:2694–2706. [PubMed] [Google Scholar]
- Cenci MA, Lindgren HS. Advances in understanding L-DOPA-induced dyskinesia. Curr Opin Neurobiol. 2007;17:665–671. doi: 10.1016/j.conb.2008.01.004. [DOI] [PubMed] [Google Scholar]
- Cenci MA, Odin P, Ohlin KE. Current options and future prospects for the treatment of dyskinesia and motor fluctuations in Parkinson's disease. CNS and Neurological Disorders Drug Targets. 2011;10(6):670–84. doi: 10.2174/187152711797247885. [DOI] [PubMed] [Google Scholar]
- Choi JK, Chen YI, Hamel E, Jenkins BG. Brain hemodynamic changes mediated by dopamine receptors: Role of the cerebral microvasculature in dopamine-mediated neurovascular coupling. Neuroimage. 2006;30:700–712. doi: 10.1016/j.neuroimage.2005.10.029. [DOI] [PubMed] [Google Scholar]
- de la Fuente-Fernandez R, Sossi V, Huang Z, Furtado S, Lu JQ, Calne DB, Ruth TJ, Stoessl AJ. Levodopa-induced changes in synaptic dopamine levels increase with progression of Parkinson's disease: implications for dyskinesias. Brain. 2004;127:2747–2754. doi: 10.1093/brain/awh290. [DOI] [PubMed] [Google Scholar]
- Delfino M, Kalisch R, Czisch M, Larramendy C, Ricatti J, Taravini IRE, Trenkwalder C, Murer MG, Auer DP, Gershanik OS. Mapping the effects of three dopamine agonists with different dyskinetogenic potential and receptor selectivity using pharmacological functional magnetic resonance imaging. Neuropsychopharmacology. 2007;32:1911–1921. doi: 10.1038/sj.npp.1301329. [DOI] [PubMed] [Google Scholar]
- Desai B, Patel A, Schneider J, Carvey PM, Hendey B. Evidence for Angiogenesis in Parkinson's disease, Incidental Lewy Body disease, and Progressive Supranuclear Palsy. Journal of Neural Transmission. 2011 doi: 10.1007/s00702-011-0684-8. E-pub ahead of print. [DOI] [PMC free article] [PubMed] [Google Scholar]
- Edvinsson L, Hardebo JE, McCulloch J, Owman C. Vasomotor response of cerebral blood vessels to dopamine and dopaminergic agonists. Adv Neurol. 1978;20:85–96. [PubMed] [Google Scholar]
- Edvinsson L, McCulloch J, Sharkey J. Vasomotor responses of cerebral arterioles in situ to putative dopamine receptor agonists. Br J Pharmacol. 1985;85:403–410. doi: 10.1111/j.1476-5381.1985.tb08875.x. [DOI] [PMC free article] [PubMed] [Google Scholar]
- Ekstrom A. How and when the fMRI BOLD signal relates to underlying neural activity: the danger in dissociation. Brain Res Rev. 2011;62:233–244. doi: 10.1016/j.brainresrev.2009.12.004. [DOI] [PMC free article] [PubMed] [Google Scholar]
- Fox PT, Raichle ME, Mintun MA, Dence C. Nonoxidative glucose consumption during focal physiologic neural activity. Science. 1988;241:462–464. doi: 10.1126/science.3260686. [DOI] [PubMed] [Google Scholar]
- Engber TM, Susel Z, Kuo S, Chase TN. Chronic levodopa treatment alters basal and dopamine agonist-stimulated cerebral glucose utilization. J Neurosci. 1990;10:3889–3895. doi: 10.1523/JNEUROSCI.10-12-03889.1990. [DOI] [PMC free article] [PubMed] [Google Scholar]
- Fabbrini G, Brotchie JM, Grandas F, Nomoto M, Goetz CG. Levodopa-induced dyskinesias. Mov Disord. 2007;22:1379–1389. doi: 10.1002/mds.21475. quiz 1523. [DOI] [PubMed] [Google Scholar]
- Faucheux BA, Bonnet AM, Agid Y, Hirsch EC. Blood vessels change in the mesencephalon of patients with Parkinson's disease. Lancet. 1999;353:981–982. doi: 10.1016/S0140-6736(99)00641-8. [DOI] [PubMed] [Google Scholar]
- Gerfen CR, Miyachi S, Paletzki R, Brown P. D1 dopamine receptor supersensitivity in the dopamine-depleted striatum results from a switch in the regulation of ERK1/2/MAP kinase. Journal of Neuroscience. 2002;22:5042–5054. doi: 10.1523/JNEUROSCI.22-12-05042.2002. [DOI] [PMC free article] [PubMed] [Google Scholar]
- Girouard H, Iadecola C. Neurovascular coupling in the normal brain and in hypertension, stroke, and Alzheimer disease. J Appl Physiol. 2006;100:328–335. doi: 10.1152/japplphysiol.00966.2005. [DOI] [PubMed] [Google Scholar]
- Hansson E, Rönnbäck L, Sellström A. Is there a “dopaminergic glial cell”? Neurochem Res. 1984;9:679–689. doi: 10.1007/BF00964514. [DOI] [PubMed] [Google Scholar]
- Hershey T, Black KJ, Carl JL, McGee-Minnich L, Snyder AZ, Perlmutter JS. Long term treatment and disease severity change brain responses to levodopa in Parkinson's disease. J Neurol Neurosurg Psychiatry. 2003;74:844–851. doi: 10.1136/jnnp.74.7.844. [DOI] [PMC free article] [PubMed] [Google Scholar]
- Hershey T, Black KJ, Stambuk MK, Carl JL, McGee-Minnich LA, Perlmutter JS. Altered thalamic response to levodopa in Parkinson's patients with dopa-induced dyskinesias. Proc Natl Acad Sci USA. 1998;95:12016–12021. doi: 10.1073/pnas.95.20.12016. [DOI] [PMC free article] [PubMed] [Google Scholar]
- Hirano S, Asanuma K, Ma Y, Tang C, Feigin A, Dhawan V, Carbon M, Eidelberg D. Dissociation of metabolic and neurovascular responses to levodopa in the treatment of Parkinson's disease. J Neurosci. 2008;28:4201–4209. doi: 10.1523/JNEUROSCI.0582-08.2008. [DOI] [PMC free article] [PubMed] [Google Scholar]
- Holschneider DP, Maarek JM. Mapping brain function in freely moving subjects. Neurosci Biobehav Rev. 2004;28:449–461. doi: 10.1016/j.neubiorev.2004.06.007. [DOI] [PMC free article] [PubMed] [Google Scholar]
- Johansson B, Nilsson B. The pathophysiology of the blood-brain barrier dysfunction induced by severe hypercapnia and by epileptic brain activity. Acta Neuropathol. 1977;38:153–158. doi: 10.1007/BF00688563. [DOI] [PubMed] [Google Scholar]
- Klein B, Kuschinsky W, Schrock H, Vetterlein F. Interdependency of local capillary density, blood flow, and metabolism in rat brains. Am J Physiol. 1986;251:H1333–1340. doi: 10.1152/ajpheart.1986.251.6.H1333. [DOI] [PubMed] [Google Scholar]
- Kortekaas R, Leenders KL, van Oostrom JC, Vaalburg W, Bart J, Willemsen AT, Hendrikse NH. Blood-brain barrier dysfunction in parkinsonian midbrain in vivo. Ann Neurol. 2005;57:176–179. doi: 10.1002/ana.20369. [DOI] [PubMed] [Google Scholar]
- Lee J, Zhu WM, Stanic D, Finkelstein DI, Horne MH, Henderson J, Lawrence AJ, O'Connor L, Tomas D, Drago J, Horne MK. Sprouting of dopamine terminals and altered dopamine release and uptake in Parkinsonian dyskinaesia. Brain. 2008;131:1574–1587. doi: 10.1093/brain/awn085. [DOI] [PubMed] [Google Scholar]
- Lindgren HS, Andersson DR, Lagerkvist S, Nissbrandt H, Cenci MA. L-DOPA-induced dopamine efflux in the striatum and the substantia nigra in a rat model of Parkinson's disease: temporal and quantitative relationship to the expression of dyskinesia. J Neurochem. 2010;112:1465–1476. doi: 10.1111/j.1471-4159.2009.06556.x. [DOI] [PubMed] [Google Scholar]
- Lindgren HS, Ohlin KE, Cenci MA. Differential involvement of D1 and D2 dopamine receptors in L-DOPA-induced angiogenic activity in a rat model of Parkinson's disease. Neuropsychopharmacology. 2009;34:2477–2488. doi: 10.1038/npp.2009.74. [DOI] [PubMed] [Google Scholar]
- Lindgren HS, Rylander D, Ohlin KE, Lundblad M, Cenci MA. The “motor complication syndrome” in rats with 6-OHDA lesions treated chronically with L-DOPA: relation to dose and route of administration. Behav Brain Res. 2007;177:150–159. doi: 10.1016/j.bbr.2006.09.019. [DOI] [PubMed] [Google Scholar]
- Lockman PR, Mittapalli RK, Taskar KS, Rudraraju V, Gril B, Bohn KA, Adkins CE, Roberts A, Thorsheim HR, Gaasch JA, Huang S, Palmieri D, Steeg PS, Smith QR. Heterogeneous blood-tumor barrier permeability determines drug efficacy in experimental brain metastases of breast cancer. Clin Cancer Res. 2010;16:5664–5678. doi: 10.1158/1078-0432.CCR-10-1564. [DOI] [PMC free article] [PubMed] [Google Scholar]
- Lundblad M, Andersson M, Winkler C, Kirik D, Wierup N, Cenci MA. Pharmacological validation of behavioural measures of akinesia and dyskinesia in a rat model of Parkinson's disease. Eur J Neurosci. 2002;15:120–132. doi: 10.1046/j.0953-816x.2001.01843.x. [DOI] [PubMed] [Google Scholar]
- Mela F, Marti M, Bido S, Cenci MA, Morari M. In vivo evidence for a differential contribution of striatal and nigral D1 and D2 receptors to l-DOPA induced dyskinesia and the accompanying surge of nigral amino acid levels. Neurobiol Dis 2012. 2011 Jan;45(1):573–82. doi: 10.1016/j.nbd.2011.09.015. E-pub ahead of print. [DOI] [PubMed] [Google Scholar]
- Mies G. Blood flow dependent duration of cortical depolarizations in the periphery of focal ischemia of rat brain. Neurosci Lett. 1997;221:165–168. doi: 10.1016/s0304-3940(96)13317-6. [DOI] [PubMed] [Google Scholar]
- Mitchell IJ, Cross AJ, Sambrook MA, Crossman AR. Neural mechanisms mediating 1-methyl-4-phenyl-1,2,3, 6-tetrahydropyridine-induced parkinsonism in the monkey: relative contributions of the striatopallidal and striatonigral pathways as suggested by 2-deoxyglucose uptake. Neuroscience letters. 1986;63:61–65. doi: 10.1016/0304-3940(86)90013-3. [DOI] [PubMed] [Google Scholar]
- Mitchell IJ, Boyce S, Sambrook MA, Crossman AR. A 2-deoxyglucose study of the effects of dopamine agonists on the parkinsonian primate brain. Implications for the neural mechanisms that mediate dopamine agonist-induced dyskinesia. Brain. 1992;115(Pt 3):809–824. doi: 10.1093/brain/115.3.809. [DOI] [PubMed] [Google Scholar]
- Miyazaki I, Asanuma M, Diaz-Corrales FJ, Miyoshi K, Ogawa N. Direct evidence for expression of dopamine receptors in astrocytes from basal ganglia. Brain Research. 2004;1029:120–123. doi: 10.1016/j.brainres.2004.09.014. [DOI] [PubMed] [Google Scholar]
- Mokrý J, Nemecek S. Cerebral angiogenesis shows nestin expression in endothelial cells. Gen Physiol Biophys. 1999;18(1):25–29. [PubMed] [Google Scholar]
- Morgante F, Espay AJ, Gunraj C, Lang AE, Chen R. Motor cortex plasticity in Parkinson's disease and levodopa-induced dyskinesias. Brain. 2006;129:1059–1069. doi: 10.1093/brain/awl031. [DOI] [PubMed] [Google Scholar]
- Naydenov AV, Vassoler F, Luksik AS, Kaczmarska J, Konradi C. Mitochondrial abnormalities in the putamen in Parkinson's disease dyskinesia. Acta Neuropathol. 2010;120:623–631. doi: 10.1007/s00401-010-0740-8. [DOI] [PMC free article] [PubMed] [Google Scholar]
- Nguyen TV, Brownell AL, Iris Chen YC, Livni E, Coyle JT, Rosen BR, Cavagna F, Jenkins BG. Detection of the effects of dopamine receptor supersensitivity using pharmacological MRI and correlations with PET. Synapse. 2000;36:57–65. doi: 10.1002/(SICI)1098-2396(200004)36:1<57::AID-SYN6>3.0.CO;2-K. [DOI] [PubMed] [Google Scholar]
- Ohlin KE, Francardo V, Lindgren HS, Sillivan SE, O'Sullivan SS, Luksik AS, Vassoler FM, Lees AJ, Konradi C, Cenci MA. Vascular endothelial growth factor is upregulated by L-dopa in the parkinsonian brain: implications for the development of dyskinesia. Brain. 2011 doi: 10.1093/brain/awr165. [DOI] [PMC free article] [PubMed] [Google Scholar]
- Papa SM, Engber TM, Kask AM, Chase TN. Motor fluctuations in levodopa treated parkinsonian rats: relation to lesion extent and treatment duration. Brain Res. 1994;662:69–74. doi: 10.1016/0006-8993(94)90796-x. [DOI] [PubMed] [Google Scholar]
- Palombo E, Porrino LJ, Bankiewicz KS, Crane AM, Sokoloff L, Kopin IJ. Local cerebral glucose utilization in monkeys with hemiparkinsonism induced by intracarotid infusion of the neurotoxin MPTP. J Neurosci. 1990;10:860–869. doi: 10.1523/JNEUROSCI.10-03-00860.1990. [DOI] [PMC free article] [PubMed] [Google Scholar]
- Pardridge WM, Oldendorf WH. Kinetic analysis of blood-brain barrier transport of amino acids. Biochim Biophys Acta. 1975;401:128–136. doi: 10.1016/0005-2736(75)90347-8. [DOI] [PubMed] [Google Scholar]
- Paulson OB, Hasselbalch SG, Rostrup E, Knudsen GM, Pelligrino D. Cerebral blood flow response to functional activation. J Cereb Blood Flow Metab. 2010;30:2–14. doi: 10.1038/jcbfm.2009.188. [DOI] [PMC free article] [PubMed] [Google Scholar]
- Pavese N, Evans AH, Tai YF, Hotton G, Brooks DJ, Lees AJ, Piccini P. Clinical correlates of levodopa-induced dopamine release in Parkinson disease: a PET study. Neurology. 2006;67:1612–1617. doi: 10.1212/01.wnl.0000242888.30755.5d. [DOI] [PubMed] [Google Scholar]
- Paxinos G, Watson C. The rat brain steretactic coordinates. Academic Press Inc; San Diego, CA: 1998. [Google Scholar]
- Rascol O, Sabatini U, Brefel C, Fabre N, Rai S, Senard JM, Celsis P, Viallard G, Montastruc JL, Chollet F. Cortical motor overactivation in parkinsonian patients with L-dopa-induced peak-dose dyskinesia. Brain. 1998;121(Pt 3):527–533. doi: 10.1093/brain/121.3.527. [DOI] [PubMed] [Google Scholar]
- Ruscher K, Kuric E, Wieloch T. Levodopa Treatment Improves Functional Recovery After Experimental Stroke. Stroke. 2011 Nov 17; doi: 10.1161/STROKEAHA.111.638767. E-pub ahead of print. [DOI] [PubMed] [Google Scholar]
- Rylander D, Parent M, O'sullivan SS, Dovero S, Lees AJ, Bezard E, Descarries L, Cenci MA. Maladaptive plasticity of serotonin axon terminals in levodopa-induced dyskinesia. Ann Neurol. 2010;68:619–628. doi: 10.1002/ana.22097. [DOI] [PubMed] [Google Scholar]
- Sakurada O, Kennedy C, Jehle J, Brown JD, Carbin GL, Sokoloff L. Measurement of local cerebral blood flow with iodo [14C] antipyrine. Am J Physiol. 1978;234:H59–66. doi: 10.1152/ajpheart.1978.234.1.H59. [DOI] [PubMed] [Google Scholar]
- Sandoval KE, Witt KA. Blood-brain barrier tight junction permeability and ischemic stroke. Neurobiol Dis. 2008;32:200–219. doi: 10.1016/j.nbd.2008.08.005. [DOI] [PubMed] [Google Scholar]
- Seifert G, Steinhauser C. Neuron-astrocyte signaling and epilepsy. Exp Neurol. 2011 Sep 7; doi: 10.1016/j.expneurol.2011.08.024. e-pub ahead of print. [DOI] [PubMed] [Google Scholar]
- Sokoloff L, Reivich M, Kennedy C, Des Rosiers MH, Patlak CS, Pettigrew KD, Sakurada O, Shinohara M. The [14C]deoxyglucose method for the measurement of local cerebral glucose utilization: theory, procedure, and normal values in the conscious and anesthetized albino rat. J Neurochem. 1977;28:897–916. doi: 10.1111/j.1471-4159.1977.tb10649.x. [DOI] [PubMed] [Google Scholar]
- Trugman JM, Hubbard CA, Bennett JP., Jr Dose-related effects of continuous levodopa infusion in rats with unilateral lesions of the substantia nigra. Brain Res. 1996;725:177–183. doi: 10.1016/0006-8993(96)00238-7. [DOI] [PubMed] [Google Scholar]
- Trugman JM, Wooten GF. The effects of L-DOPA on regional cerebral glucose utilization in rats with unilateral lesions of the substantia nigra. Brain Res. 1986;379:264–274. doi: 10.1016/0006-8993(86)90780-8. [DOI] [PubMed] [Google Scholar]
- Van Vliet EA, Da Costa Araujo S, Redeker S, Van Schaik R, Aronica E, Gorter JA. Blood-brain barrier leakage may lead to progression of temporal lobe epilepsy. Brain. 2007;130:521–534. doi: 10.1093/brain/awl318. [DOI] [PubMed] [Google Scholar]
- Westin JE, Lindgren HS, Gardi J, Nyengaard JR, Brundin P, Mohapel P, Cenci MA. Endothelial proliferation and increased blood-brain barrier permeability in the basal ganglia in a rat model of 3,4-dihydroxyphenyl-L-alanine-induced dyskinesia. J Neurosci. 2006;26:9448–9461. doi: 10.1523/JNEUROSCI.0944-06.2006. [DOI] [PMC free article] [PubMed] [Google Scholar]
- Westin JE, Vercammen L, Strome EM, Konradi C, Cenci MA. Spatiotemporal pattern of striatal ERK1/2 phosphorylation in a rat model of L-DOPA-induced dyskinesia and the role of dopamine D1 receptors. Biol Psychiatry. 2007;62:800–810. doi: 10.1016/j.biopsych.2006.11.032. [DOI] [PMC free article] [PubMed] [Google Scholar]
- Williams JL, Shea M, Furlan AJ, Little JR, Jones SC. Importance of freezing time when iodoantipyrine is used for measurement of cerebral blood flow. Am J Physiol. 1991;261:H252–256. doi: 10.1152/ajpheart.1991.261.1.H252. [DOI] [PubMed] [Google Scholar]
- Winkler C, Kirik D, Bjorklund A, Cenci MA. L-DOPA-induced dyskinesia in the intrastriatal 6-hydroxydopamine model of parkinson's disease: relation to motor and cellular parameters of nigrostriatal function. Neurobiol Dis. 2002;10:165–186. doi: 10.1006/nbdi.2002.0499. [DOI] [PubMed] [Google Scholar]
- Wooten GF, Collins RC. Metabolic effects of unilateral lesion of the substantia nigra. J Neurosci. 1981;1:285–291. doi: 10.1523/JNEUROSCI.01-03-00285.1981. [DOI] [PMC free article] [PubMed] [Google Scholar]
- Zanassi P, Paolillo M, Montecucco A, Avvedimento EV, Schinelli S. Pharmacological and molecular evidence for dopamine D(1) receptor expression by striatal astrocytes in culture. J Neurosci Res. 1999;58:544–552. doi: 10.1002/(sici)1097-4547(19991115)58:4<544::aid-jnr7>3.0.co;2-9. [DOI] [PubMed] [Google Scholar]
- Zlokovic BV. The blood-brain barrier in health and chronic neurodegenerative disorders. Neuron. 2008;57:178–201. doi: 10.1016/j.neuron.2008.01.003. [DOI] [PubMed] [Google Scholar]