Abstract
Although p53–mediated cell–cycle arrest, senescence and apoptosis serve as critical barriers to cancer development, emerging evidence suggests that the metabolic activities of p53 are also important. Here we show that p53 inhibits cystine uptake and sensitizes cells to ferroptosis, a non–apoptotic form of cell death, by repressing expression of SLC7A11, a key component of the cystine/glutamate antiporter. Notably, p533KR, an acetylation–defective mutant that fails to induce cell–cycle arrest, senescence and apoptosis, fully retains the ability to regulate SLC7A11 expression and induce ferroptosis upon reactive oxygen species (ROS)–induced stress. Analysis of mutant mice shows that these non–canonical p53 activities contribute to embryonic development and the lethality associated with loss of Mdm2. Moreover, SLC7A11 is highly expressed in human tumours, and its overexpression inhibits ROS–induced ferroptosis and abrogates p533KR–mediated tumour growth suppression in xenograft models. Our findings uncover a new mode of tumour suppression based on p53 regulation of cystine metabolism, ROS responses and ferroptosis.
Inactivation of the p53 tumour suppression pathway is a pivotal event in the formation of most human cancers1–5. Traditionally, the tumour suppression activity of p53 was thought to reflect its ability to elicit cell-cycle arrest, apoptosis and/or senescence in response to cellular stress. However, recent studies suggest that other unconventional activities of p53 are also crucial for its tumour suppressor function4–8. The p53 protein achieves its diverse cellular outcomes by serving as a DNA-binding transcription factor that selectively modulates the expression of certain p53 transcriptional target genes. Stress-induced activation of p53 protein is primarily achieved by post-translational modifications9, and our recent studies of mice expressing acetylation-defective p53 mutants revealed that acetylation differentially regulates p53-mediated cell-cycle arrest, apoptosis and senescence10. Notably, the mutant p533KR polypeptide, while defective for the three conventional p53 functions, still retains its tumour suppression function and the ability to modulate the expression of metabolic targets10, suggesting that p53-mediated metabolic regulation is critically involved in suppressing tumour formation in vivo.
Identification of SLC7A11 as a p53 target
To elucidate the precise effects of p53-mediated metabolic regulation, we sought to identify novel p53 target genes by generating a tetracycline-controlled (tet-on) p53-inducible cell line for microarray analysis. Array data were examined with Partek software and genes that are differentially expressed between induced and non-induced cells were identified (Extended Data Table 1). SLC7A11, which encodes a component of the cystine/glutamate antiporter11–13, was identified as a novel p53 target gene. While there was no obvious effect of tetracycline treatment on SLC7A11 expression in the parental H1299 cells, progressive repression of SLC7A11 mRNA expression was observed in the tet-on p53-inducible line (Extended Data Fig. 1a) and western blot analysis revealed that p53 activation severely reduced SLC7A11 protein levels (Fig. 1a). The 5′ flanking region of the human SLC7A11 gene at chromosome 4q28-31 (ref. 13) contains one site that matches the consensus p53-binding sequence (Fig. 1b), and a p53–DNA complex was readily identified by electrophoretic mobility shift analysis (EMSA) upon incubation of highly purified recombinant full-length human wild-type p53 with a radio-labelled oligonucleotide probe containing this site (Fig. 1c). Moreover, this p53–DNA complex was super-shifted in the presence of a p53-specific antibody and was markedly diminished by competition with the unlabelled probe. Furthermore, chromatin immunoprecipitation (ChIP) analysis of human osteosarcoma U2OS cells (which express wild-type p53) revealed that endogenous p53 polypeptides occupy the promoter region of the SLC7A11 gene (Fig. 1d). Moreover, the protein levels of SLC7A11 were markedly decreased when p53 is activated by nutlin-3 treatment14 or upon DNA damage (Fig.1e and Extended Data Fig. 1b). In contrast, SLC7A11 downregulation was completely abrogated under p53-knockdown conditions (Fig. 1e). Similar results were also observed in other human cancer cell lines expressing wild-type p53 (H460 and MCF-7), whereas no apparent effects were detected in p53-null cells (H1299 and SAOS-2) (Extended Data Fig. 1c–e). Together, these data indicate that the SLC7A11 gene is a target of p53-mediated transcriptional repression.
Extended Data Table 1. p53-regulated genes identified in the wild-type p53 inducible stable line through microarray analysis.
| Functional group | Gene symbol | Gene name | RefSeq | Fold Change | p-value |
|---|---|---|---|---|---|
| Transports Metabolism | TIGAR | TP53-induced glycolysis and apoptosis regulator | AY425618 | 4.55812 | 2.3798E-07 |
| SLC7A11 | solute carrier family 7, (cationic amino acid transporter, y+ system) member 11 | AB026891 | -2.66607 | 7.0681 E-05 | |
| GLS2 | glutaminase 2 (liver, mitochondrial) | AF110330 | 17.0011 | 4.8505E-09 | |
| SESN1 | sestrin 1 | AF033122 | 9.78117 | 8.93E-09 | |
| TAP1 | transporter 1, ATP-binding cassette, sub-family B (MDR/TAP) | AB012644 | 2.95728 | 7.1604E-08 | |
| PANK1 | pantothenate kinase 1 | AY027661 | 5.72688 | 1.456E-06 | |
| ACER2 | similar to alkaline ceramidase 2; alkaline ceramidase 2 | ENST00000340967 | 5.34687 | 1.1182E-05 | |
| SESN2 | sestrin 2 | BC013304 | 2.59232 | 7.8217E-06 | |
| CHAC1 | ChaC, cation transport regulator homolog 1 (E. coli) | BC001683 | 4.81706 | 4.0584E-08 | |
| ORAI3 | ORAI calcium release-activated calcium modulator 3 | BC015555 | 3.23129 | 7.6884E-06 | |
| ABHD4 | abhydrolase domain containing 4 | AK293198 | 10.3618 | 1.1017E-09 | |
| ALDH1L2 | aldehyde dehydrogenase 1 family, member L2 | AK300373 | 13.0247 | 6.7912E-08 | |
| ANK1 | ankyrin 1, erythrocytic | M28880 | 2.72917 | 3.7932E-06 | |
| BCAT1 | branched chain aminotransferase 1, cytosolic | ENST00000261192 | -2.64027 | 3.6497E-07 | |
| CMBL | carboxymethylenebutenolidase homolog (Pseudomonas) | ENST00000510532 | 5.0088 | 4.8907E-07 | |
| DGKA | diacylglycerol kinase, alpha 80kDa | BC023523 | 5.92523 | 5.4931 E-07 | |
| FDXR | ferredoxin reductase | AK298908 | 7.05275 | 1.1567E-09 | |
| PHGDH | phosphoglycerate dehydrogenase | AF171237 | -1.31044 | 5.8696E-05 | |
| GPT2 | glutamic pyruvate transaminase (alanine aminotransferase) 2 | AL833351 | 2.78579 | 9.8714E-07 | |
| KLHL24 | kelch-like 24 (Drosophila) | AK000066 | 2.50394 | 1.6715E-06 | |
| LRP1 | low density lipoprotein-related protein 1 (alpha-2-macroglobulin receptor) | AK122840 | 3.52784 | 1.1368E-08 | |
| TM7SF2 | transmembrane 7 superfamily member 2 | AF096304 | 6.93921 | 2.5897E-08 | |
| Cell cycle & Proliferation | CDKN1A/p21 | cyclin-dependent kinase inhibitor 1A (p21, Cip1) | AK298901 | 10.9225 | 3.0979E-09 |
| BTG2 | BTG family, member 2 | BC105948 | 14.9562 | 6.8143E-09 | |
| GADD45A | growth arrest and DNA-damage-inducible, alpha | BC011757 | 2.93357 | 1.0756E-07 | |
| CAV1 | caveolin 1, caveolae protein, 22kDa | AK290871 | 2.65042 | 3.2047E-07 | |
| CCNK | cyclin K | BT006950 | 2.90074 | 9.9132E-07 | |
| DUSP1 | dual specificity phosphatase 1 | AK298047 | 3.06448 | 6.6673E-10 | |
| PLK2 | polo-like kinase 2 (Drosophila) | AK297298 | 5.30746 | 2.2421 E-08 | |
| PLK3 | polo-like kinase 3 (Drosophila) | AJ293866 | 18.2063 | 9.4625E-10 | |
| RB1 | retinoblastoma 1 | AK299179 | 2.69757 | 1.4404E-07 | |
| SFN | stratifin | AF029082 | 3.45591 | 7.6309E-06 | |
| TRIM22 | tripartite motif-containing 22 | AK298934 | 2.81865 | 5.2447E-05 | |
| FBXW7 | F-box and WD repeat domain containing 7 | AF411971 | 3.23697 | 9.4834E-06 | |
| ZMAT3 | zinc finger, matrin type 3 | AF355465 | 5.73607 | 6.5446E-08 | |
| CCNE2 | cyclin E2 | AF102778 | -10.5563 | 9.6454E-09 | |
| MNS1 | meiosis-specific nuclear structural 1 | ENST00000260453 | -2.97374 | 0.00015946 | |
| Apoptosis | BAX | BCL2-associated X protein | L22474 | 1.88726 | 3.7902E-06 |
| TP53INP1 | tumor protein p53 inducible nuclear protein 1 | AF409115 | 12.3711 | 6.2069E-09 | |
| TP53I3 | tumor protein p53 inducible protein 3 | ENST00000407482 | 15.126 | 2.3803E-09 | |
| TNFRSF10D | death domain | AF021233 | 2.82197 | 4.2642E-07 | |
| AIFM2 | apoptosis-inducing factor, mitochondrion-associated, 2 | AF337957 | 2.9952 | 5.8401 E-07 | |
| APAF1 | apoptotic peptidase activating factor 1 | AF013263 | 10.2862 | 4.0106E-10 | |
| CASP6 | caspase 6, apoptosis-related cysteine peptidase | BC000305 | 9.60075 | 2.8464E-08 | |
| GDF15 | growth differentiation factor 15 | AB000584 | 13.1249 | 1.1527E-08 | |
| PCBP4 | poly(rC) binding protein 4 | AF176330 | 4.50693 | 9.552E-09 | |
| PERP | PERP, TP53 apoptosis effector | BC010163 | 3.02863 | 1.9567E-08 | |
| RPS27L | ribosomal protein S27-like | BC003667 | 3.53852 | 1.0771 E-05 | |
| SCN3B | sodium channel, voltage-gated, type III, beta | BC117282 | 8.94659 | 4.3472E-08 | |
| DDIT3 | DNA-damage-inducible transcript 3 | BC003637 | 2.63317 | 0.0001017 | |
| Others | DRAM1 | DNA-damage regulated autophagy modulator 1 | BC018435 | 3.67323 | 7.8723E-08 |
| MDM2 | MDM2 oncogene, E3 ubiquitin protein ligase | AF092845 | 7.44673 | 5.4175E-08 | |
| RRM2B | ribonucleotide reductase M2 B (TP53 inducible) | ENST00000395910 | 4.53617 | 4.0021 E-07 | |
| XPC | xeroderma pigmentosum, complementation group C | ENST00000285021 | 2.72401 | 4.349E-05 | |
| PRKAB1 | protein kinase, AMP-activated, beta 1 non-catalytic subunit | AK301165 | 3.35515 | 1.2744E-07 | |
| ANKRA2 | ankyrin repeat, family A (RFXANK-like), 2 | AF251051 | 12.5615 | 2.8927E-06 | |
| APOBEC3C | apolipoprotein B mRNA editing enzyme, catalytic polypeptide-like 3C | AF165520 | 4.85886 | 3.1852E-08 | |
| ARID5B | AT rich interactive domain 5B (MRF1-like) | AK296921 | 3.56829 | 3.3834E-07 | |
| BMP6 | bone morphogenetic protein 6 | AK300628 | -3.88207 | 7.2324E-07 | |
| C4ORF21 | chromosome 4 open reading frame 21 | AK090556 | -3.97572 | 1.401E-06 | |
| C5ORF28 | chromosome 5 open reading frame 28 | BC013351 | -3.03553 | 5.0792E-05 | |
| CALCOCO1 | calcium binding and coiled-coil domain 1 | AB040969 | 5.94756 | 3.9553E-08 | |
| FERMT1 | fermitin family homolog 1 (Drosophila) | AB105105 | 4.28817 | 6.2732E-07 | |
| GATS | GATS, stromal antigen 3 opposite strand | AK124689 | 4.13525 | 1.1626E-07 | |
| MR1 | major histocompatibility complex, class l-related | AF010446 | 4.56814 | 2.5677E-07 | |
| PCDHB11 | protocadherin beta 11 | BC112132 | 4.26781 | 3.3776E-05 | |
| PCDHB14 | protocadherin beta 14 | AF152493 | 2.76533 | 9.4183E-05 | |
| PLXNB2 | plexin B2 | AK056543 | 2.79781 | 1.2076E-08 | |
| PROCR | protein C receptor, endothelial (EPCR) | BC014451 | 3.27997 | 6.7976E-08 | |
| VCAN | versican | ENST00000343200 | 15.2705 | 2.7969E-07 | |
| WDR63 | WD repeat domain 63 | ENST00000294664 | 19.3466 | 1.204E-08 | |
| ZNF702P | zinc finger protein 702 pseudogene | NR_003578 | 3.99824 | 3.3623E-05 |
Figure 1. Identification of SLC7A11as a target of p53.
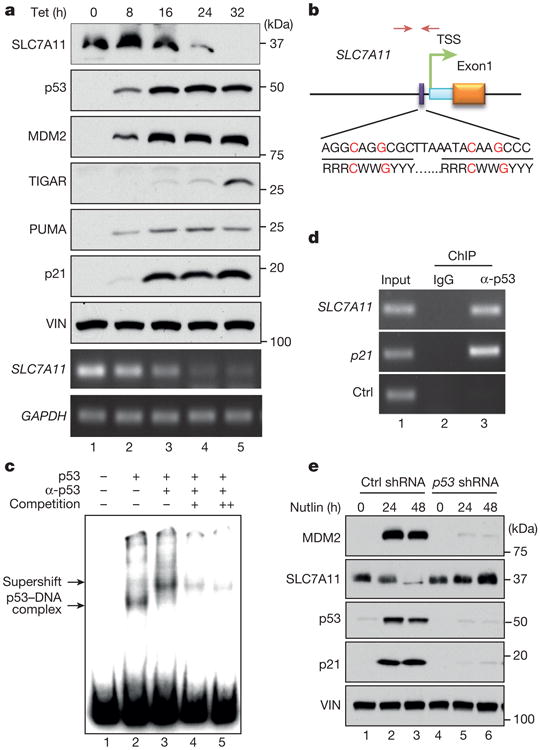
a, Western blot and RT–PCR for tet-on p53 stable line cells treated with doxycycline. VIN, vinculin. b, Schematic diagram of p53 binding location and sequence on human SLC7A11 gene. Identified p53 binding sequence was compared with consensus sequence (R, A/G; W, A/T; Y, C/T; nucleotides C and G in red are essential for p53 binding). TSS, transcription start site. Facing arrows indicate primers for generating probes in c and PCR in d. c, EMSA was performed with indicated components. The double plus sign represents that more competition cold probes were added compared to the single plus sign (200-fold versus 100-fold to radioactive-labelled hot probes). d, ChIP assay was carried out in U2OS cells. e, U2OS cells with p53 knockdown were treated with nutlin and analysed by western blot. All data are representative of three independent experiments.
Regulation of SLC7A11 expression by p533KR
Our previous study showed that p533KR retains the ability to regulate metabolic targets10. To test the role of p533KR in modulating SLC7A11 expression, we established a tet-on H1299 cell line in which p533KR expression can be induced by tetracycline. Consistent with our previous study10, p533KR was able to activate expression of TIGAR and MDM2, but not p21 (also known as CDKN1A) or PUMA (also known as BBC3). Notably, SLC7A11 levels were drastically reduced at various time points after p533KR induction (Fig. 2a). Chromatin immunoprecipitation (ChIP) analysis showed that the p533KR protein is able to bind the promoter of the SLC7A11 gene (Fig. 2b). To corroborate this finding under more physiological settings, we examined the levels of SLC7A11 transcripts in mouse embryonic fibroblasts (MEFs) derived from p53+/+, p533KR/3KR and p53−/− mice. Quantitative reverse transcription polymerase chain reaction (RT–qPCR) analysis revealed that SLC7A11 expression is markedly increased (∼4 fold) in p53−/− cells relative to wild-type MEFs (Fig. 2c and Extended Data Fig. 1f). However, SLC7A11 transcript levels remain low in p533KR/3KR cells, suggesting that p533KR can inhibit SLC7A11 expression in a manner similar to wild-type p53. Moreover, ChIP analysis revealed that mouse p53 was recruited to the murine Slc7a11 promoter region with the primers corresponding to the RE3 site in both wild-type and p533KR MEFs but not in p53-null MEFs (Extended Data Fig. 1g, h). These data demonstrate that the acetylation-defective mutant p533KR retains its ability to regulate SLC7A11 expression in vivo.
Figure 2. p533KR in regulating SLC7A11and cystine uptake activity.
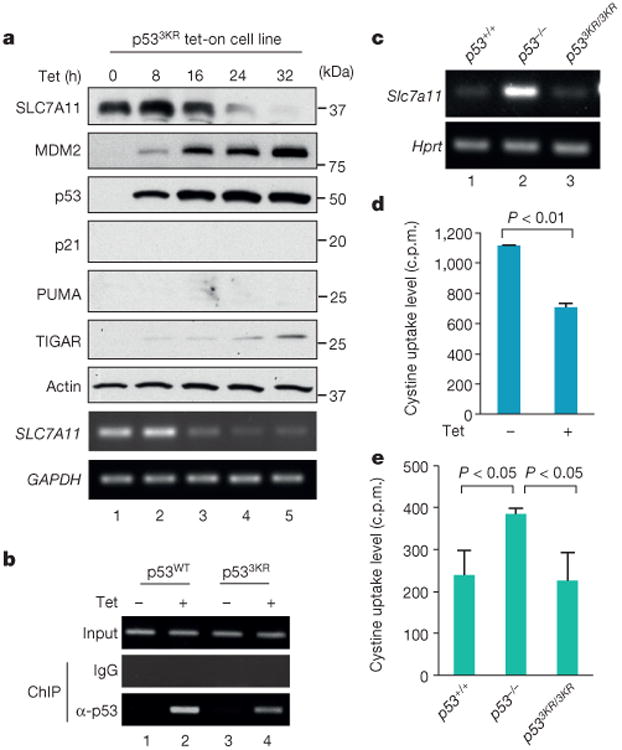
a, Tet-on p533KR stable line cells were treated with doxycycline followed by western blots and RT–PCR. b, ChIP assay was performed in wild-type p53 (p53WT) and p533KR tet-on stable line cells. c, Messenger RNA level of Slc7a11 in MEFs with indicated genotype was determined by RT–PCR with Hprt as endogenous control. d, Cystine uptake activity (c.p.m., count per minute) was determined in p533KR stable line cells. Mean ± s.d. from two technical replicates are shown. e, Cystine uptake levels (c.p.m.) were measured in MEFs derived from three individual embryos for each genotype (error bars, s.e.m.). All data were repeated independently three times with representatives shown.
Regulation of cystine uptake and ferroptosis
SLC7A11 is a key component of a plasma membrane transporter (the system) that mediates Na+-independent cellular uptake of extracellular cystine in exchange for intracellular glutamate11–13. To understand the functional consequences of p53-mediated repression of SLC7A11 expression, we first examined the effect of p53 activation on cellular uptake of l-[14C]-cystine. Indeed, the cystine uptake levels of tet-on p533KR-inducible cells were reduced upon treatment with tetracycline (Fig. 2d). To investigate this effect in a more physiological setting, we also examined p53+/+, p533KR/3KR and p53−/− MEFs. As shown in Fig. 2e, cystine uptake was increased in p53−/− MEFs to levels about 60% higher than those of p53+/+ MEFs, validating that loss of p53 promotes cellular uptake of cystine. Nevertheless, we failed to detect any increase of cystine uptake in p533KR/3KR MEF cells, suggesting that p533KR retains the ability to suppress cystine uptake in vivo.
Notably, recent studies showed that SLC7A11 expression is also critical for ferroptosis, an iron-dependent non-apoptotic cell death involving metabolic dysfunction15. To this end, we examined whether p53 influences cellular sensitivity to ferroptosis by treating early passage MEFs with erastin, a ferroptosis inducer. Although erastin induced high levels of cell death (>48%) in both p53+/+ and p533KR/3KR MEFs, only low levels (∼20%) were observed in p53-null cells (Fig. 3a and Extended Data Fig. 2a). Moreover, upon kinetic analysis, cell death was readily detected in both p53+/+ and p533KR/3KR MEFs as early as 6 h after treatment (Fig. 3b). Although a small fraction of cell death was also detected in p53-null cells, differential effects on p53-null cells versus p53+/+ or p533KR/3KR MEFs are very obvious at different time points upon exposure to different concentrations of erastin (Fig. 3b and Extended Data Fig. 2b). By transmission electron microscopy of erastin-treated cells, we observed shrunken mitochondria with increased membrane density but no obvious DNA fragmentation (III and IV, Fig. 3c), a characteristic morphologic feature of apoptotic cells upon TNF-α treatment (Extended Data Fig. 2c). Western blot analysis revealed that erastin-induced cell death also failed to induce PARP1 cleavage and caspase 3 activation and the lack of DNA fragmentation in ferroptosis was confirmed using TUNEL assay (Extended Data Fig. 2d–f).
Figure 3. Roles of p53 in ferroptosis.
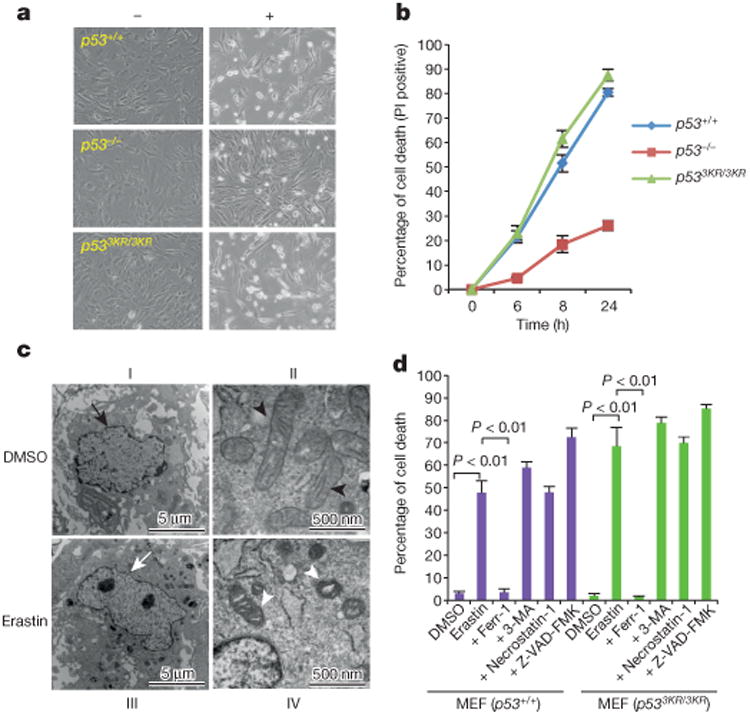
a, Representative phase-contrast images of MEFs treated with 4 μM erastin for 8h (magnification, ×10). b, Kinetics of cell death induced by 4 μM erastin over a 24-h period. Mean ± s.d. from two replicate experiments are shown. PI, propidium iodide. c, Wild-type MEFs were treated with dimethyl sulfoxide (DMSO) or erastin and subjected to transmission electron microscopy. Arrows, nuclei; arrow heads, mitochondria. d, MEFs were treated with erastin and specific cell death inhibitors for 8 h and the percentage of cell death was determined (error bars, s.d. from two technical replicates). 3-MA, 3-methylademine. All data are representative of three independent experiments.
To confirm the mode of erastin-induced cell death, we treated cells with ferrostatin-1 (ferr-1), a specific inhibitor of ferroptosis15. Notably, ferr-1 completely rescued cell death in both p53+/+ and p533KR/3KR MEFs (Fig. 3d). In contrast, inhibitors of other forms of cell death, including autophagy (3-methylademine), apoptosis (Z-VAD-FMK) and necroptosis (necrostatin-1), failed to suppress erastin-induced cell death (Fig. 3d and Extended Data Fig. 2g) despite their abilities to inhibit autophagy, necroptosis and apoptosis, respectively, in the same MEFs (Extended Data Fig. 3a–e). Moreover, several additional inhibitors of ferroptosis15 also proved to be effective in blocking p53-mediated ferroptosis of p533KR/3KR MEFs (Extended Data Fig. 3f). Together, these data demonstrate that p533KR retains the capacity to regulate cellular uptake of cystine and promote ferroptosis.
SLC7A11 in ferroptosis and tumour suppression
Previous studies have shown that SLC7A11 overexpression is observed in several forms of human cancer16–18. Upon analysis of 20 pairs of human tumours versus adjacent normal tissues, we observed SLC7A11 over-expression in about 70% of human cancer specimens (8/10 colon tumour samples, 3/5 liver tumour samples, and 3/5 kidney tumour samples) (Extended Data Fig. 4a–c). To further evaluate its role in tumorigenesis, we performed immunofluorescence staining assays for SLC7A11 on these tissue sections by using confocal microscopy. As shown in Fig. 4a, both the membrane marker (ATP1A1) (green) and SLC7A11 (red) were localized predominantly on the plasma membrane. More importantly, although the levels of ATP1A1 (green) were similar in normal and cancerous tissues, the SLC7A11 levels (red) were markedly higher in malignant cells compared to the adjacent normal cells (also see Extended Data Fig. 4d). Although SLC7A11 levels are elevated in all p53-mutated tumours, SLC7A11 upregulation also occurs in tumours expressing wild-type p53 (Extended Data Fig. 4e), suggesting that other factors may also influence SLC7A11 expression in human cancers.
Figure 4. Regulation of p53-mediated ferroptosis by SLC7A11.
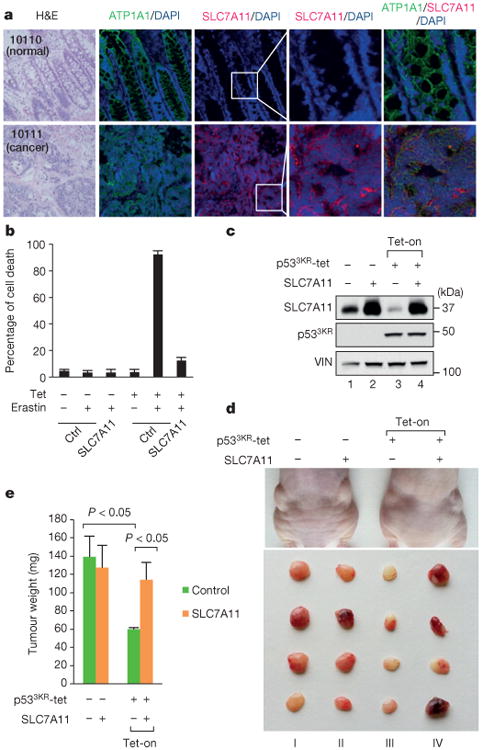
a, Representative immunofluorescence staining of SLC7A11 on paired colon cancer and adjacent normal tissues. H&E, haematoxylin and eosin (magnification, ×20). Numbers in the top left are specific tissue identification numbers of a normal/cancer tissue pair from one colon cancer patient. b, Tet-on p533KR cells were transfected with either control or plasmid overexpressing SLC7A11 followed by treatment as indicated. Quantification of cell death from two technical replicates is shown (mean ± s.d.). c, Western bot analysis of tet-on p533KR cells with or without SLC7A11 overexpression. VIN, vinculin. d, Xenograft tumours from tet-on p533KR cells shown in c. e, Tumour weight was determined (error bars, s.d. from from four tumours). Independent experiments were repeated three times and representative data are shown.
To explore the roles of p53-mediated SLC7A11 and ferroptosis in human cancer cells, we first examined the effects of erastin on tet-on p533KR-inducible H1299 cells. As expected, these cells are very resistant to erastin-mediated ferroptosis in the absence of p533KR induction (Fig. 4b and Extended Data Fig. 5a); conversely, high levels of cell death (>80%) were observed upon tetracycline induction of p533KR in the presence of erastin. Again, the ferroptosis activity induced by p533KR was inhibited in the presence of ferr-1 (Extended Data Fig. 5b). Notably, SLC7A11 overexpression rescued these cells from p533KR-dependent ferroptosis (Fig. 4b) and also abrogated p533KR-mediated reduction in colony formation (Extended Data Fig. 5c–e). These data indicate that SLC7A11 is overexpressed in human tumour samples and that ectopic SLC7A11 expression can suppress ferroptosis induced by p533KR in human cancer cells.
To validate the role of p53-mediated effects on SLC7A11 expression in modulating tumour suppression activity independent of cell growth arrest, apoptosis and senescence, we tested whether SLC7A11 overexpression affects tumour growth suppression induced by p533KR in xenograft tumour models. Upon p533KR expression induced by tetracycline (Fig. 4c), the growth of p53-null H1299 cells was dramatically reduced (Fig. 4d, III versus I) in xenograft tumour growth assays; however, the tumour suppression effects of p533KR were largely abrogated in the presence of SLC7A11 overexpression (Fig. 4d, IV versus III, also see Fig. 4e). These data demonstrate that SLC7A11 expression is crucial for the tumour growth suppression activity induced by p533KR.
Metabolic regulation by p53 in embryonic development
Several studies implicate that the canonical activities of p53 in apoptosis, cell growth arrest and senescence are the primary cause of the lethality observed in p53+/+Mdm2−/− mouse embryos, which die at days E3.5–E5.5 of development19–24. To evaluate whether non-canonical activities of p53 contribute to this phenotype, p533KR/3KRMdm2+/− mice were intercrossed and their progenies genotyped. Given that the p533KR mutant fails to induce p53-mediated cell-cycle arrest, apoptosis or senescence10, we were surprised to find a complete absence of p533KR/3KRMdm2−/− pups in the progeny of these intercrosses (Extended Data Fig. 6a, b). Therefore, embryos obtained from timed intercrosses of p533KR/3KRMdm2+/− mice were examined. By day E7.5, p533KR/3KRMdm2−/− embryos displayed dramatically elevated p53 staining but largely normal developmental structures (Fig. 5a), indicating that the p533KRmutation elicits a substantial rescue of embryonic development. As expected, despite high p533KR expression, p533KR/3KRMdm2−/− embryos did not exhibit increasing levels of apoptosis as shown by absence of cleaved caspase-3 staining (Fig. 5a) and negative TUNEL signals (Extended Data Fig. 6c, d). The levels for Ki67 and BrdU staining also indicated that there is no cell growth inhibition in p533KR/3KRMdm2−/− embryos (Fig. 5a and Extended Data Fig. 6d). Further analysis confirmed the high levels of p533KR protein, absence of cleaved caspase-3, and lack of induction of p21 or PUMA in p533KR/3KRMdm2−/− embryos (Extended Data Fig. 6e, f). Moreover, we failed to detect any cells staining positive for senescence-associated β-galactosidase activity in p533KR/3KRMdm2−/− embryos (Extended Data Fig. 6g–i), suggesting an absence of senescent cells in those embryos.
Figure 5. p53-mediated metabolic regulation in embryonic development.
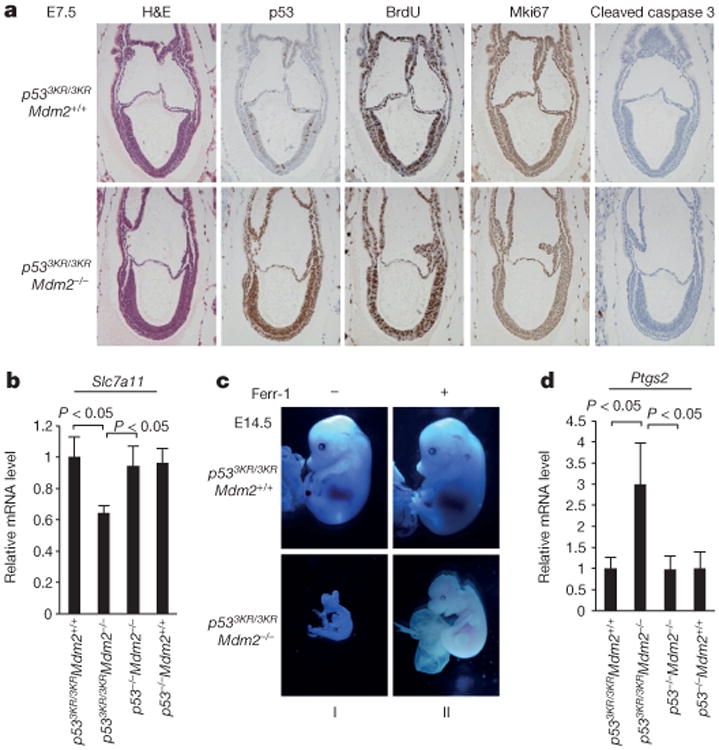
a, Representative haematoxylin and eosin (H&E) and immunohistochemistry staining on E7.5 embryos with indicated genotype (magnification, ×20). b, Messenger RNA expression levels of Slc7a11 in E9.5 embryos with indicated genotype (error bars, s.d.; n = 3 for p533KR/3KRMdm2+/+ and n = 5 for all other genotypes). c, Representative morphologies of E14.5 embryos treated with either dimethyl sulfoxide or ferr-1 (magnification, ×1.5). d, Messenger RNA expression levels of Ptgs2 determined similarly as in b. All data were repeated independently at least three times and representatives are shown.
Nevertheless, Slc7a11 mRNA expression was suppressed in p533KR/3KRMdm2−/− embryos (Fig. 5b), and by day E11.5 the developmental abnormalities of p533KR/3KRMdm2−/− embryos became very obvious (Extended Data Fig. 7a). To explore whether p53-mediated ferroptosis contributes to the developmental defects of p533KR/3KRMdm2−/− embryos, we injected the ferroptosis inhibitor ferr-1 into the peritoneal cavity at day E5.5 and collected embryos at day E14.5. As shown in Fig. 5c, ferr-1-treated p533KR/3KRMdm2−/− embryos showed clear organogenesis such as eye formation and limb differentiation at day E14.5 (II), at a time when untreated p533KR/3KRMdm2−/− embryos had been largely decimated (I, also see Extended Data Fig. 7b). The body sizes (from head to tail) of recovered p533KR/3KRMdm2−/− embryos were also significantly larger and the structure of the eyes was markedly improved upon ferr-1 treatment (Extended Data Fig. 7c, d). A recent study identified upregulation of PTGS2 as a potential molecular marker of ferroptosis25. As shown in Fig. 5d, Ptgs2 was indeed significantly upregulated in p533KR/3KRMdm2−/− embryos; conversely, Ptgs2 levels were not affected in p53−/−Mdm2−/− embryos, suggesting that Ptgs2 upregulation in p533KR/3KRMdm2−/− embryos is p53-dependent. Taken together, these data indicate that p53-mediated effects on metabolic regulation and ferroptotic cell death contribute critically to the embryonic developmental defects observed in p533KR/3KRMdm2−/− embryos.
p53–mediated ferroptosis in ROS responses
To evaluate the regulation of ferroptosis in a more physiological setting, we examined whether p533KR-mediated ferroptotic cell death is involved in ROS stress responses. The method for ROS treatment has been described previously26,27. As shown in Fig. 6a, no obvious cell death was observed upon either p533KR induction or ROS treatment alone. Notably, however, the combination of p533KR induction and ROS treatment induced massive cell death that was specifically inhibited by ferr-1 (Fig. 6a and Extended Data Fig. 8a) or by overexpression of SLC7A11 (Fig. 6b). These data indicate that activation of p533KR leads to ferroptotic cell death in the presence of ROS stress, independent of cell-cycle arrest, senescence and apoptosis.
Figure 6. p53-mediated ferroptosisin ROS responses.
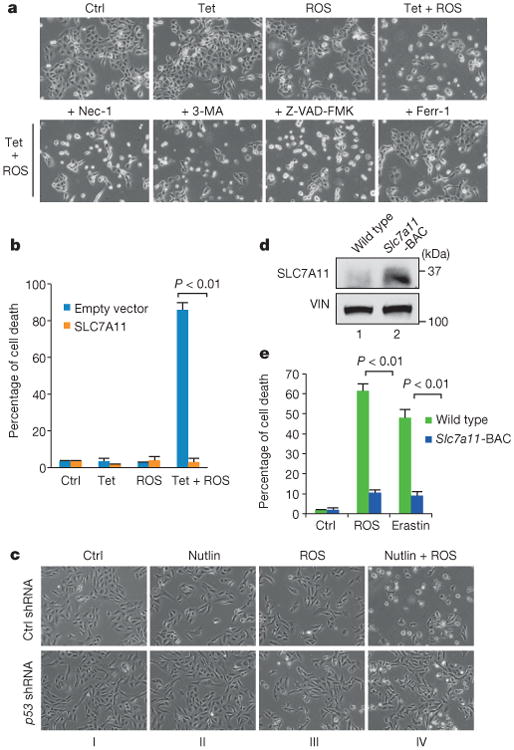
a, Tet-on p533KR cells were treated with doxycycline and ROS with specific cell death inhibitors for24 h. Nec-1, necrostatin-1 (magnification, ×10). b, Tet-on p533KRcells were transfected with either control or plasmid overexpressing SLC7A11 followed by treatment of doxycycline and ROS for 16 h. Quantification of cell death from two technical replicates is shown (mean ± s.d.). c, U2OS cells with p53 knockdown were treated with nutlin and ROS for 24 h when images were taken. d, Western blots of MEFs generated from wild-type or Slc7a11-BAC transgenic mice. VIN, vinculin. e, MEFs from indicated genotype were treated with ROS or erastin for 8 h and quantification of cell death from two technical replicates (mean ± s.d.) is shown. All experiments were performed independently three times and representative data are shown.
Recent studies indicate that wild-type p53 proteins can be activated in human tumours by nutlin-3 (ref 14). In most human cancer cells, nutlin-3-mediated p53 activation induces reversible cell-cycle arrest but not cell death28,29, which may limit its efficacy in cancer treatment. Therefore, we examined whether Mdm2 inhibition can modulate p53-mediated ferroptos is in human cancer cells. As expected, nutlin-3 treatment of U2OS cells induced high levels of p53 expression without eliciting cell death whereas the treatment of ROS alone, which did not induce strong p53 activation, also failed to elicit a cell death response (Fig.6c and Extended Data Fig. 8b, c). However, massive cell death was observed upon combination treatment with both nutlin and ROS (Fig. 6c). The cell death response is p53-dependent since it was abrogated upon knockdown of endogenous p53 (Fig. 6c and Extended Data Fig. 8c), and the cell death was again rescued by the ferroptosis inhibitor ferr-1 (Extended Data Fig. 8d). Interestingly, although high levels of cell death were also induced in U2OS cells by DNA-damaging agents such as etoposide and doxorubicin, DNA-damage-induced cell death could not be suppressed by ferr-1 treatment (Extended Data Fig. 8e, f), suggesting that p53-mediated ferroptosisis specifically induced by ROS but not by DNA damage.
Finally, to evaluate SLC7A11 regulation of ferroptosis under more physiological conditions, we generated BAC transgenic mice overexpressing SLC7A11 (Slc7a11 bacterial artificial chromosome, Slc7a11-BAC) (Extended Data Fig. 9). Although the phenotypes of Slc7a11-BAC mice need further analysis, we derived MEFs from both Slc7a11-BAC mice and their control littermates. As shown in Fig. 6d, SLC7A11 protein levels were elevated approximately fivefold higher in Slc7a11-BACMEFs relative to the control MEFs. Notably, treatment with either ROS or erastin elicited high levels of ferroptosis in wild-type MEFs but ferroptotic cell death was largely abrogated in Slc7a11-BAC MEFs (Fig. 6e). Together, these data indicate that p53-mediated ferroptosis is specifically induced by ROS and that the levels of SLC7A11 are critical for p53-mediated ferroptotic responses.
Discussion
Although it is commonly accepted that p53-mediated cell-cycle arrest, apoptosis and senescence all serve as major mechanisms of tumour suppression, accumulating evidence indicates that other activities of p53, such as metabolic regulation, are also critical for tumour suppression10. While a number of metabolic targets of p53 such as TIGAR, GLS2 and SCO2 have been identified30–37, it remains unclear how the metabolic functions of p53 contribute to its tumour suppression activity. Here we show that, by transcriptional suppression of SLC7A11, a component of the cystine/glutamate antiporter, p53 inhibits cystine uptake and sensitizes cells to ferroptosis, a non-apoptotic form of cell death. Moreover, the p533KR mutant, which is defective for p53-dependent cell-cycle arrest, apoptosis and senescence, retains the ability to inhibit SLC7A11 expression and thereby regulate cystine metabolism and ferroptotic cell death. Using p533KR/3KRMdm2−/− mutant mice, we further show that this aspect of p53 function contributes critically to embryonic development and the lethality associated with loss of Mdm2. Ferroptosis is associated with metabolic dysfunction that results in production of both cytosolic and lipid ROS, independent of mitochondria15,25. By repressing SLC7A11 transcription, p53 activation reduces cystine uptake, which in turn limits production of intracellular glutathione (GSH), the primary cellular antioxidant. Thus, the sensitivity of ROS-induced ferroptosisis markedly increased in p53-activated cells. Notably, SLC7A11 is overexpressed in many types of human cancers and the levels of SLC7A11 are critical for the sensitivity of ferroptotic responses. By using the p533KR mutant in xenograft tumour models, we show that high levels of SLC7A11 expression lead to a significant abrogation of the tumour growth suppression activity induced by p533KR, which is independent of cell-cycle arrest, apoptosis and senescence.
Our data indicate that p53-mediated transcriptional repression of SLC7A11 is critical for ROS-induced ferroptosis. Nonetheless, it is possible that additional p53 target genes may contribute to this novel p53 response. Future investigations are required to elucidate the roles of other metabolic targets of p53 in regulating ferroptosis. Interestingly, previous studies have shown that p53 ameliorates oxidative stress by upregulating metabolic targets, such as TIGAR (also known as C12 or f5) and GLS2, that decrease cellular levels of ROS30–37. Yet, we found that p53-mediated ferroptosis can be triggered by high levels of ROS (Fig. 6), consistent with the observation that ferroptosis is characterized by a lethal iron-dependent accumulation of lipid ROS15,25. Although numerous studies implicate ROS in both metabolism and tumorigenes is, the mechanisms that underlie cellular responses to ROS are poorly understood. Nevertheless, the divergent effects of p53 on cellular ROS levels suggest an intriguing model. In response to low or basal ROS levels, p53 may prevent cells from accumulating lethal levels of ROS while also allowing survival and repair of moderate oxidative damage. However, in response to higher or inappropriate ROS levels (such as in cancer cells), p53 may instead promote the removal of unsalvageable cancer cells through ferroptosis. This model is reminiscent of the divergent effects of p53 on the cellular response to DNA damage1–6. In that scenario, p53 activation promotes cell survival and repair of genotoxic damage (through target genes that facilitate cell cycle checkpoints and DNA repair) in response to low levels of DNA damage; however, upon severe DNA damage, high levels of p53-mediated apoptotic cell death eliminate damaged cells permanently. Taken together, our findings suggest that p53-mediated effects on cystine metabolism, ROS responses and ferroptotic cell-death represent a novel mechanism of tumour suppression.
Methods
Cell culture and stable lines
Cells were previously obtained from American Type Culture Collection (ATCC) and maintained in 37 °C incubator with 5% CO2. All media used were supplemented with 10% FBS, 100 units per ml penicillin and 100 μg ml−1 streptomycin. H1299, U2OS and MCF7 cells were maintained in DMEM medium; SOAS-2 cells in McCoy's 5A medium. MEFs were generated from day 13.5 embryos according to standard procedures. FBS used for MEFs was heat-inactivated and supplemented with 1% non-essential amino acids. To generate inducible stable lines, wild-type and 3KR (K117R, K161R and K162R) mouse p53 complementary DNA were cloned into tet-on pTRIPZ inducible expression vector (Thermo Open Biosystems). All sequences have been confirmed before transfection using Lipofectamine 2000 (Invitrogen), followed by selection and maintenance with puromycin (1 μg ml−1) in DMEM medium containing 10% tetracycline-free FBS. To induce the expression of p53, 0.1 μg ml−1 of doxycycline was added to the culture medium. To generate cells with stable knockdown of p53, U2OS cells were infected with GIPZ short hairpin RNA (shRNA) non-silencing control or shRNA against TP53 (Thermo Scientific) with the following target sequences: 3LHS_333919, TACACATGTAGTTGTAGTG and 3LHS_333920, TCTCTTCCTCTGTGCGCCG. Cells were then selected with puromycin (1 μg ml−1) for 2weeks.
Microarray and statistical analysis
Tet-on mouse wild-type p53 stable line cells were induced by doxycycline (0.1 μg ml−1) for 0 or 24 h before total RNA was extracted. RNA was further purified by RNeasy column (Qiagen) and processed for expression microarray (Affymetrix human gene ST 1.0) following the manufacturer's instructions. Each condition was done in technical duplicates. Array data were analysed by Partek software (ver. 6.6) and selected genes that are differentially expressed (false-discovery-rate-corrected P value less than 0.05) between the induced and non-induced cells were listed in Extended Data Fig. 1. A two-tailed Student's t-test was used for comparisons between two groups and a P value of less than 0.05 was considered statistically significant. No statistical methods were used to predetermine sample size.
Plasmids and tranfection
Full-length cDNA of SLC7A11 was amplified by PCR from human HeLa Marathon-Ready cDNA (Clonetech) and cloned into either TOPO (Invitrogen) or pCIN4-HA expression vector. Lipofectamine 2000 (Invitrogen) was used for plasmid transfection according to the manufacturer's protocols.
Chromatin immunoprecipitation assay
The procedure was performed essentially as described previously38 with minor modifications. In brief, cells were crosslinked with 1% formaldehyde for 10min at room temperature and neutralized by adding glycine to a final concentration of 0.125M. After washing twice with cold PBS, cells were harvested and suspended in cold lysis buffer (10 mM Tris-Cl, pH 8.0, 85 mM KCl, 0.5% NP40, 5 mM EDTA, 0.25% triton and 1× proteinase inhibitor). After 10 min incubation on ice, nuclei were harvested and re-suspended in LB3 buffer and sonicated to achieve DNA fragments of 200–500 base pairs. Magnetic beads coated with specific antibodies or IgG control were added to lysate and incubated overnight. Next day, beads were washed seven times with washing buffer (50 mM HEPES, pH 7.5, 500 mM LiCl, 1 mM EDTA, 1% NP-40 and 0.7% Na-deoxycholate) and once with TE buffer before the protein–DNA complex was eluted from the beads. After reverse crosslinking overnight at 55 °C, DNA was extracted and analysed by PCR followed by 2% agarose gel electrophoresis or by quantitative PCR.
RNA extraction, RT–PCR and sequencing of tumour samples
Total RNA was isolated using TRIzol (Invitrogen) according to the manufacturer's protocol. One microgram of total RNA was reverse transcribed by M-MuLV reverse transcriptase and Random Primer 9 (NEB) following manufacturer's protocol. Semi-quantitative RT–PCR was performed using Advantage 2 PCR kit (Clontech) within the linear range of PCR cycles for each primer pair. Quantitative PCR was done using a 7500 Fast Real-Time PCR System (Applied Biosystems) with standard protocol. To determine p53 mutational status, RNA was extracted and RT–PCR was performed for each patient tumour sample. Full length p53 PCR product was gel purified and sequenced using standard procedures.
PCR primers
For RT–PCR: human SLC7A11 forward, TCATTGGAGCAGGAATCTTCA, reverse, TTCAGCATAAGACAAAGCTCCA; human GAPDH forward, ATCAATGGAAATCCCATCACCA, reverse, GACTCCACGACGTACTCAGCG; mouse Slc7a11 forward, CCTCTGCCAGCTGTTATTGTT, reverse, CCTGGCAAAACTGAGGAAAT; mouse Hprt forward, TCCTCCTCAGACCGCTTTT, reverse, CCTGGTTCATCATCGCTAATC. For quantitative RT–PCR: human SLC7A11 forward, ATGCAGTGGCAGTGACCTTT, reverse, GGCAACAAAGATCGGAACTG; human GAPDH, same as primers used for RT–PCR; mouse Slc7a11 forward, TGGGTGGAACTGCTCGTAAT, reverse, AGGATGTAGCGTCCAAATGC; mouse Ptgs2 forward, GGGAGTCTGGAACATTGTGAA, reverse, GTGCACATTGTAAGTAGGTGGACT; mouse Puma forward, ACGACCTCAACGCGCAGTACG, reverse, GAGGAGTCCCATGAAGAGATTG; mouse Hprt, same as primers used for RT–PCR. For ChIP–PCR: human SLC7A11 forward, AGGCTTCTCATGTGGCTGAT, reverse, TGCATCGTGCTCTCAATTCT (same primers were used to generate probe for EMSA); human p21 forward, CTTTCACCATTCCCCTACCC, reverse, AATAGCCACCAGCCTCTTCT; human ChIP control region forward, AGGAGAGGACTTCGACAACCG, reverse, CAGGTCCTTCCCATGCTTCC; mouse Slc7a11 p53 RE1 forward, TGCCGAGACTGATAGCTGAG, reverse, AAAACTTCAAAGTGGGGTTAAAA; mouse Slc7a11 p53 RE2 forward, GTTCTGGGAAATGCTTTGGA, reverse, CGTGGAAGGCTCCG TATTTA; mouse Slc7a11 p53 RE3 forward, GTCATCGGATCAGGCATCTT, reverse, ACACACACTCACACCCCAGA.
Western blotting and antibodies
Proteins were lysed from cells using RIPA buffer containing 10 mM Tris-Cl, pH 8.0, 150 mM NaCl, 1% Triton X-100, 1% Na-deoxycholate, 1 mM EDTA, 0.05% SDS and fresh 1× proteinase inhibitor. Concentration was determined by the Bradford method using Bio-Rad protein assay before proteins were equally loaded and separated in polyacrylamide gels. Proteins were then transferred to Hybond ECL membrane (GE healthcare) and incubated overnight with primary antibodies against SLC7A11 (ab37185, abcam), p53 (human: Do-1, SantaCruz;mouse:CM5, Leica biosystems), MDM2 (Ab5, Millipore), TIGAR (E-2, Santa Cruz), PUMA (H-136, Santa Cruz), p21 (SX118, Santa Cruz), cleaved caspase 3 (9664, Cell Signaling), LC3B (3868, Cell Signaling), PARP (9532, Cell Signaling), β-actin (A3853, Sigma-Aldrich), vinculin (V9264, Sigma-Aldrich) and haemagglutinin (11867431001, Roche). HRP-conjugated secondary antibodies were used and western blot signals were detected on autoradiographic films after incubating with ECL (GE healthcare) or SuperSignal West Dura reagents (Thermo scientific).
Colony formation assay
H1299 cells were transfected with either empty vector or Flag-tagged p533KR,haemagglutinin-tagged SLC7A11 expression plasmids. Cells were split 48 h post-transfectionand seeded into 10-cm dishes at a density of 1,000 cells per dish and cultured in the presence of G418 (600 μg ml−1) for12 days. Cells were then fixed in ice-cold methanol and stained with crystal violet solution. Numbers of visible colonies were counted using ImageJ.
Electrophoretic mobility shift assay
Flag-tagged wild-type p53 protein was purified from transfected 293 cells. A DNA probe containing the p53 binding site for SLC7A11 was PCR-amplified, labelled with γ-32P-dATP by T4 kinase (NEB) and purified using Bio-Spin 30 columns (Bio-Rad). The protein–DNA binding reactions (total of 20 μl) contained 20 mM HEPES, pH 7.6, 80 mM NaCl, 0.1 mM EDTA, 12.5% glycerol, 2mM MgCl2, 2 mM spermidine, 0.7 mM DTT, 200 ng μl−1 BSA, 20 ng μl−1 sheared salmon sperm DNA, 10–20 fmol DNA probe and 200 ng Flag–p53.In supershift assays, 200 ng anti-p53 pAb421 antibody (Millipore) was added to the reaction. A non-radioactive labelled probe in excess of 100 or 200 fold was used to compete with the 32P-labelled radioactive probe.
Drugs, cell death inhibitors and ROS treatment
All drugs were ordered from Sigma-Aldrich unless otherwise indicated. Ferrostatin-1 was from Xcess Biosciences. Drugs or cell death inhibitors are used at the following concentrations: nutlin-3a, 10 μM; ferr-1, 2 μM; 3-methylademine,2 mM; necrostatin-1, 10 μg ml−1; Z-VAD-FMK, 10 μg ml−1; DFO, 100 μM; U0126, 5 μM; β-ME, 50 μM and NAC, 1 mM. ROS were generated by tert-butyl hydroperoxide (TBH). Concentrations of TBH used in experiments shown in Fig. 6 are: 60 μM for Fig. 6a, 100 μM for Fig. 6b, 350 μM for Fig. 6c and 200 μM for Fig. 6e with erastin at 1 μM. Cells were about 50% confluent when medium containing TBH was added. Specific cell death inhibitors were added at the same time when erastin or TBH treatment was started.
Cell death assay
For cell death assays involving p53 activation, p53 was pre-activated for 24 h by either doxycycline (in tet-on stable line cells) or nutlin (in cancer cells) followed by treatment with either erastin orTBH. For quantification of cell death, cells were trypsinized and stained with trypan blue followed by counting with a haemocytometer using standard protocol. Cells stained blue were considered as dead cells. Quantification of cell death was further confirmed by propidium iodide staining followed by FACS analysis.
Cystine uptake assay
Cells cultured in six-well plates were washed twice in pre-warmed Na+-free uptake buffer containing 137 mM choline chloride, 3 mM KCl, 1 mM CaCl2, 1 mM MgCl2,5 mM d-glucose, 0.7 mM K2HPO4 and 10 mM HEPES (pH 7.4). Cells were then incubated in 1 ml uptake buffer at 37 °C for 10 min. Buffer was replaced with 600 μl uptake buffer containing l-[3,3′-14C] cystine (0.2 μCi ml−1) (PerkinElmer) and incubated at 37 °C for 3 min. Cells were then washed three times with ice-cold uptake buffer followed by addition of 600 μl of NaOH (0.1M) to lyse the cells. Cell lysate (80 μl) was added into 1 ml scintillation fluid and radioactive 14C counts per minute (CPM) were obtained in a scintillation counter.
Immunofluorescence, immunohistochemistry, TUNEL, BrdU assay and transmission electron microscopy
Frozen human cancer tissues or fixed mouse deciduas from timed breeding were cut at 5 μm and immunostaining was performed according to standard procedures using antibodies against human SLC7A11 (no. 12691, Cell Signaling Technology), mouse p53 (CM5, Leica), BrdU (Ab6326, Abcam), Mki67 (Ab15580, Abcam) and cleaved caspase3 (9664, Cell Signaling). TUNEL assay was carried out using DeadEnd TUNEL system according to the manufacturer's instructions (Promega). Intraperitoneal injection of BrdU (BD Pharmagen) was given to pregnant mice at day E7.5 at 100 μg BrdU per g body weight. After 2 h, the embryos were collected and fixed in 10% formalin at 4 °C overnight. The embryos were embedded in paraffin and serial sections were collected for BrdU staining. Transmission electron microscopy was performed using standard procedures by the Microscopy Core at NYU. At least 20 images were acquired for each structure of interest and representative images are shown.
Senescence-associated β-galactosidase activity assay
Senescence-associated β-galactosidase activity was examined according to published procedure39. In brief, embryos were fixed with 0.2% glutaraldehyde in PBS, and washed in PBS supplemented with 2 mM MgCl2. Embryos were then stained in X-gal solution(1 mg ml−1 X-gal, 5 mM K3Fe(CN)6, 5 mM K4Fe(CN)6 and 2 mM MgCl2 in PBS) overnight at 37 °C. The embryos were then post fixed in 10% formalin overnight.
Slc7a11-BAC transgenic mice generation
Slc7a11-BAC transgenic mice were generated by pronuclear injection of mouse BAC (RP24-242E11 containing only the Slc7a11 gene) at the Transgenic Mouse Shared Resource at Columbia University using standard procedures. A total of three founders were identified and germline transmission was confirmed.
Rescue of p533KR/3KRMdm2−/− mice
Timed breeding was setup for p533KR/3KRMdm2+/− intercross. Starting on day E5.5, dimethyl sulfoxide control or ferr-1 (100 μl of 100 μM solution per 20 g body weight) was injected into the peritoneal cavity of pregnant mice once a day. Embryos were collected at day E14.5 and imaged. Genotype was determined using DNA extracted from the yolk sac. All mice used in this study are mixture of C57bl/6j and SV129 strain. All procedures performed in this study are approved by the Institutional Animal Care and Use Committee at Columbia University.
Mouse xenograft
Pooled stable cell lines were derived from H1299 tet-on p533KR cells by transfecting either control vector or vector overexpressing SLC7A11. Cells were selected by G418 (1 mg ml−1) for 2 weeks and then treated with or without doxycycline (0.5 μg ml−1) for 40 h. Cells (1.5 × 10⁶) were then mixed with Matrigel (BD Biosciences) at 1:1 ratio (volume) and injected subcutaneously into nude mice (NU/NU, Charles River). Mice were fed either with control food or food containing doxycycline hyclate (Harlan, 625 mg kg−1). Four weeks after injection, mice were euthanized and tumours were dissected from under the skin.
Extended Data
Extended Data Figure 1. SLC7A11expression is downregulated by p53 and identification of p53 binding sites for mouse Slc7a11gene.
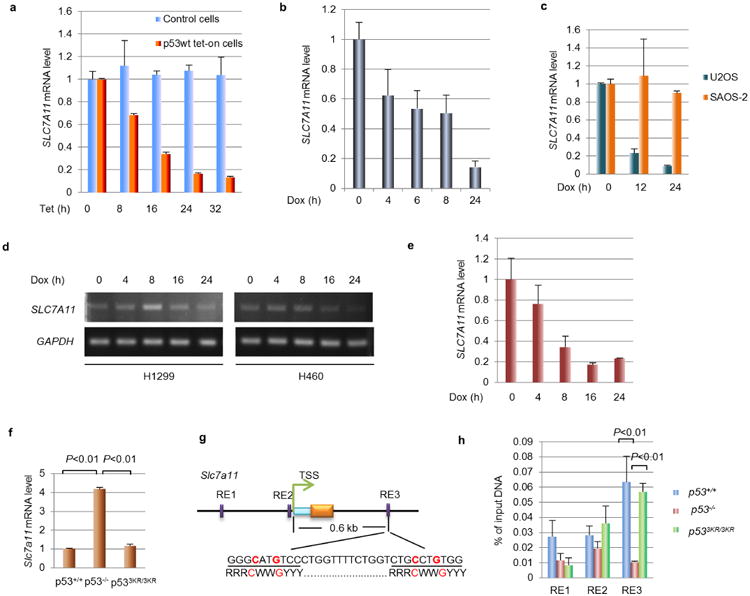
a, Messenger RNA levels of SLC7A11 in tet-on wild-type p53 stable line and parental H1299 cells treated with doxycycline (0.1 μg ml−1). b, U2OS cells were treated with doxorubicin (0.2 μg ml−1) and mRNA was quantified. c, Osteosarcoma cell lines, U2OS (p53 wild type) and SAOS-2 (p53 null) cells, were treated with doxorubicin (0.2 μg ml−1) and mRNA levels were determined. d, Lung cancer cell lines, H1299 (p53 null) and H460 (p53 wild type) cells, were treated with doxorubicin (0.2 μg ml−1) and RT–PCR was used to determine mRNA expression. e, The breast cancer cell line MCF7 was treated with doxorubicin (0.2 μg ml−1) for indicated duration and RT–qPCR was used to measure mRNA expression. f, RT–qPCR were used to determine the mRNA level of Slc7a11 in MEFs with indicated genotype. g, Schematic diagram representing potential p53 binding locations and sequences on the mouse Slc7a11 gene. TSS, transcription start site; light blue box, 5′-UTR. h, ChIP–qPCR was performed on MEFs that were treated with nutlin (10 μM) for 6 h. All qPCR was performed in two technical replicates and mean ± s.d. are shown. All experiments were repeated independently three times.
Extended Data Figure 2. Characterization of erastin-induced cell death in MEFs.
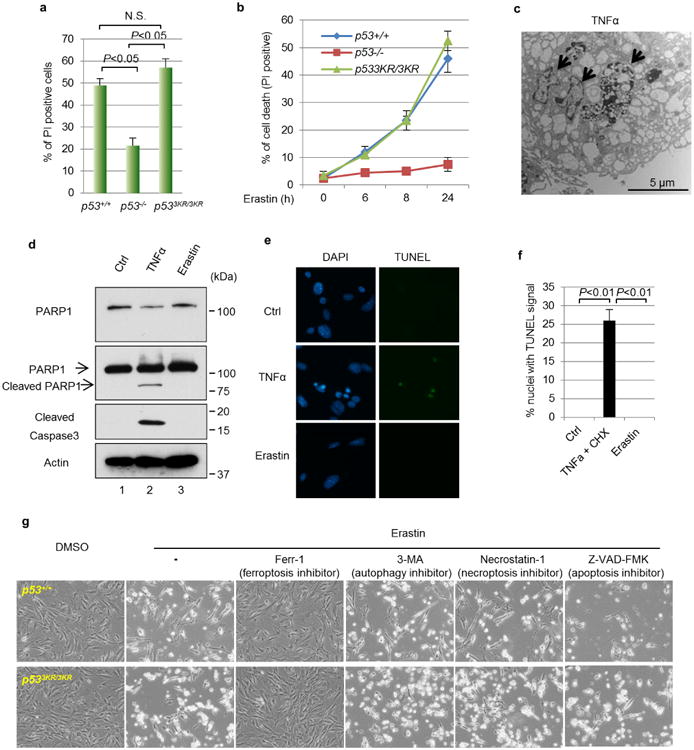
a, Quantification of cell death as shown in Fig. 3a. Error bars are s.d. from two technical replicates. b, Kinetics of cell death induced by erastin (1 μM) over a 24-h period in MEFs with indicated genotypes. Technical replicates were performed and mean ± s.d. are shown (n = 2). c, Transmission electron microscopy image of wild-type MEFs that were treated with TNFα (20 ng ml−1) and CHX (5 μg ml−1) for 16 h with arrows pointing to fragmented nuclei. d, Wild-type MEFs were treated with mouse TNFα (20 ng ml−1) and CHX (5 μg ml−1) or erastin (1 μM) for 8 h followed by western blots.e, TUNEL assay was carried out using wild-type MEFs treated as in d. f, Quantification of TUNEL signals for e. Mean ± s.d. from ten random microscope views are shown (magnification, ×20). g, MEFs with indicated p53 status were treated with erastin (4 μM) and specific cell death inhibitors for 8 h before images were taken (magnification, ×10). 3-MA, 3-methylademine. All experiments were repeated at least three times and representative data are shown.
Extended Data Figure 3. Effectiveness of cell death inhibitors.
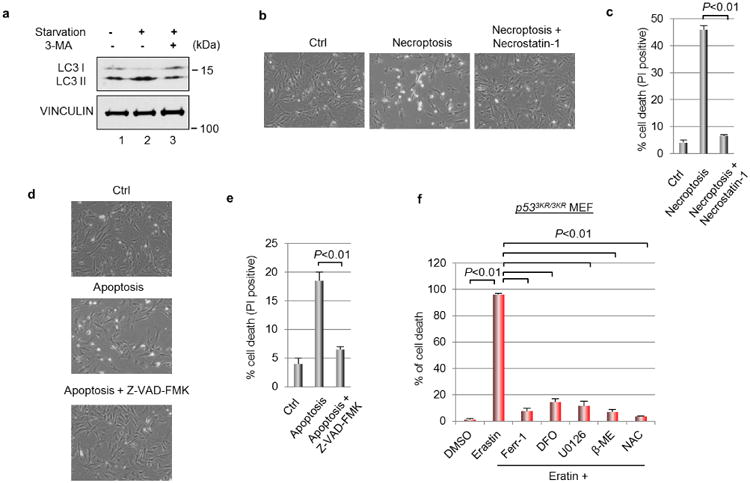
a, Wild-type MEF cells were starved in DMEM medium deprived of glucose, sodium pyruvate or l-glutamine for 2 h with or without 3-methylademine (2 mM) followed by western blots. b, Wild-type MEFs were treated for 48 h with TNFα (20 ng ml−1), SMAC mimetic (100 nM) and Z-VAD-FMK (10 μg ml−1) to induced necroptosis with or without the presence of necrostatin-1 (10 μg ml−1) (magnification, ×10). c, Quantification of cell death as shown in b. PI, propidium iodide. Mean ± s.d. from two technical replicates are shown. d, Wild-type MEFs were treated for 48 h with TNFα (20 ng ml−1), SMAC mimetic (100 nM) and necrostatin-1 (10 μg ml−1) to induce apoptosis with or without the presence of Z-VAD-FMK (10 μg ml−1) (magnification, ×10). e, Quantification of cell death as shown in d. Mean ± s.d. from two technical replicates are shown. f, p533KR/3KR MEFs were treated with erastin (4 μM) and various chemicals that block ferroptosis for 24 h before the percentage of cell death was determined; error bars, s.d. from two technical replicates. DMSO, dimethyl sulfoxide; DFO, deferoxamine; U0126, 1,4-diamino-2,3-dicyano-1,4-bis[2-aminophenylthio] butadiene; β-ME, β-mercaptoethanol; NAC, N-acetyl-l-cysteine. All experiments were independently repeated three times.
Extended Data Figure 4. SLC7A11 is overexpressed in tumours of human cancer patients.
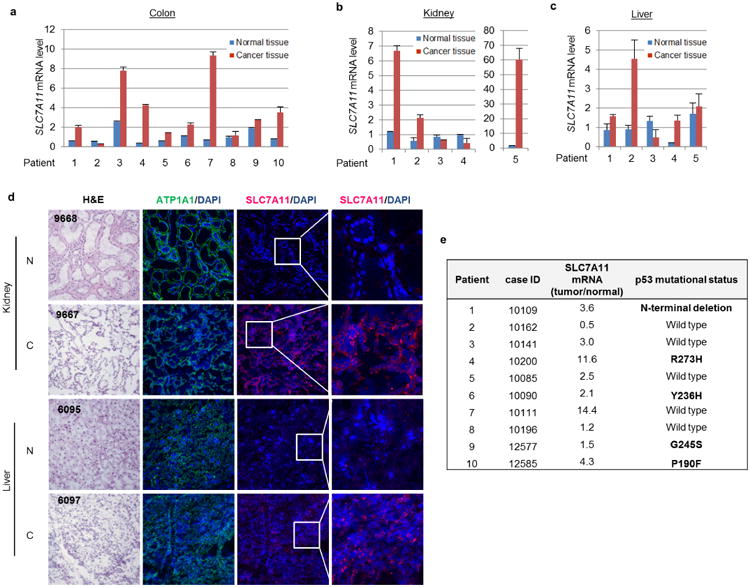
a–c, Quantitative RT–PCR was used to determine the expression levels of SLC7A11 in paired normal and cancer tissues from colon (a), kidney (b) and liver (c); average expression levels from normal tissues were normalized to 1 in each type of cancer. Mean ± s.d. from two technical replicates are shown. d, Representative heamotoxylin and eosin (H&E) and immunofluorescence staining of SLC7A11 on frozen sections of paired patient cancer and adjacent normal tissues. Magnifcation, ×20. N, normal tissue; C, cancer tissue. Blue, DAPI; green, anti-ATP1A1; red, anti-SLC7A11. e, DNA sequencing was performed on colon cancer samples and specific mutations were identified. Independent experiments were repeated three times and representative data are shown.
Extended Data Figure 5. Cell death induced by p533KR and erastin is ferroptosis and effect of SLC7A11 overexpression on colony formation.
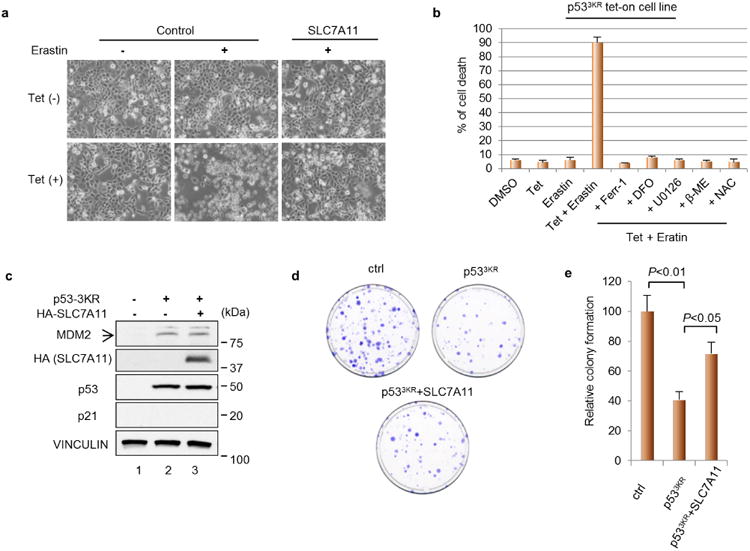
a, Representative phase-contrast images of cell cultures as treated in Fig. 4b (magnification, ×10). b, p533KR tet-on stable line cells were treated as indicated and the percentage of cell death was quantified (DFO, deferoxamine; U0126, 1,4-diamino-2,3-dicyano-1,4-bis[2-aminophenylthio] butadiene; β-ME, beta-mercaptoethanol; NAC, N-acetyl-l-cysteine). Mean ± s.d. from two technical replicates are shown. c, H1299 cells were transfected with indicated plasmids followed by western blot 24 h later. HA, haemagglutinin d, Representative images of colony formation assay in 10-cm plates as transfected in c. e, Quantification of colony formation assay as shown in d. Numbers of colonies formed in control plates were normalized to 100 and mean ± s.d. from two technical replicates are shown. All experiments were repeated three times with representative data shown.
Extended Data Figure 6. p533KR/3KRMdm2−/− mice are embryonic lethal.
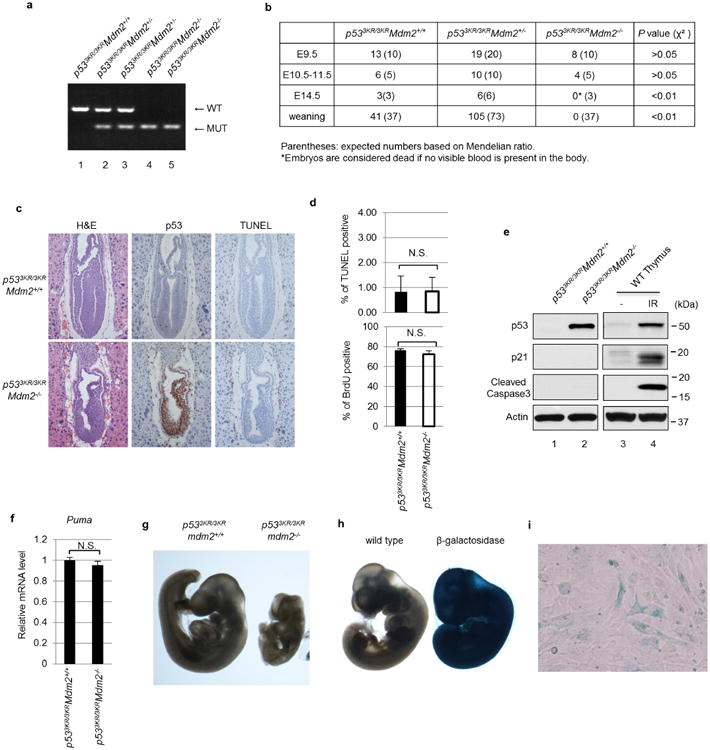
a, Representative gel images for genotyping of Mdm2 status in p533KR/3KR background mice. b, Summary of numbers of live embryos and pups recovered from p533KR/3KRMdm2+/− intercross breeding. c, Haematoxylin and eosin (H&E) and immunohistochemistry staining of p53 and TUNEL assay on E7.5 embryos of indicated genotype (magnification, ×20). d, Percentage of cells with positive TUNEL or BrdU were determined by counting 100 cells in each section from three different embryos. Error bars, s.d.; N.S., not significant. e, Whole-embryo extracts from E9.5 embryos were used for western blot. As positive controls, thymus protein lysate from irradiated (IR) wild-type mouse (8 Gy) was used. f, Messenger RNA expression levels of Puma were determined by RT–qPCR using E9.5 embryos with indicated genotype (n=3 for p533KR/3KRMdm2+/+ and n=5 for p533KR/3KRMdm2−/−; error bars, s.d.; N.S, not significant). g, Representative images of whole-mount senescence-associated β-galactosidase staining using E9.5 mouse embryos with indicated genotype (magnification, ×2). h, Same protocol as in g was used to stain control wild-type embryos and embryos of HAUSP heterozygous knockouts, which express β-galactosidase40 (magnification, ×2). i, Late passage senescent wild-type MEFs were stained for senescence-associated β-galactosidase activity using the same protocol as in g (magnification, ×10).
Extended Data Figure 7. Ferrostatin-1 partially rescues p533KR/3KRMdm2−/− mice.
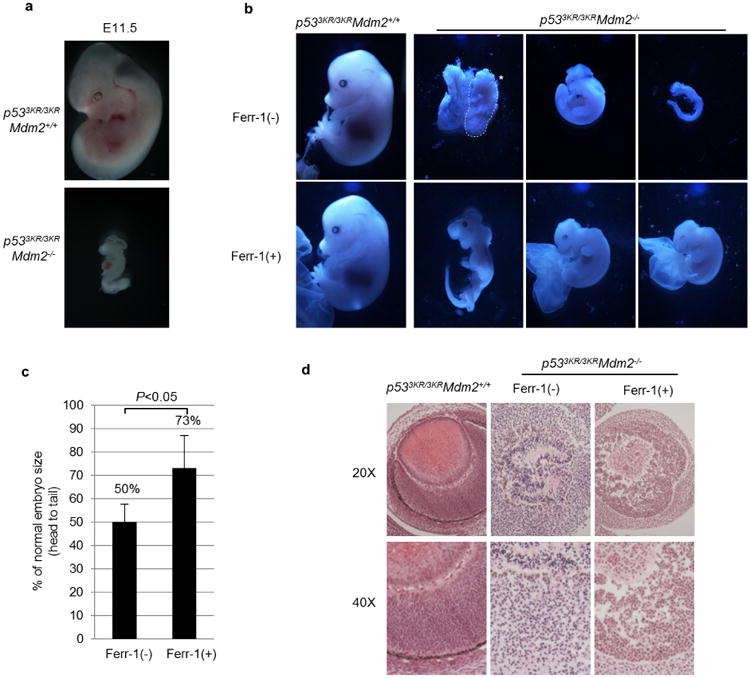
a, Representative morphologies of E11.5 mouse embryos of indicated genotype (magnification, ×3). b, Representative embryos recovered from p533KR/3KRMdm2+/− intercross with or without ferr-1 injection. The dashed line marked by an asterisk highlights the body of a dead p533KR/3KRMdm2−/− embryo, which disintegrated upon further dissection (magnification, ×1.5). c, Head-to-tail lengths of p533KR/3KRMdm2−/− embryos were measured and compared to p533KR/3KRMdm2+/+ controls (n = 4 for each group of p533KR/3KRMdm2−/− embryos with or without ferr-1 treatment; error bars, s.d.). d, Representative haematoxylin and eosin (H&E) staining of eye structures of p533KR/3KRMdm2+/+ and p533KR/3KRMdm2−/− mouse embryos (magnification, ×20 and ×40 as indicated).
Extended Data Figure 8. Synergized ferroptosis by nutlin/ROS.
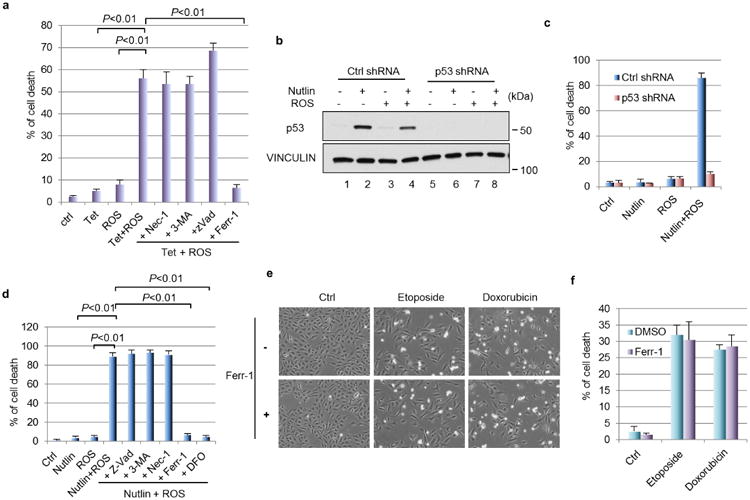
a, Percentage of cell death has shown in Fig. 6a was quantified. Mean ± s.d. from two technical replicates are shown. b, U2OS cells with stable knockdown of p53 were treated by nultin (10 μM) for 24 h followed by addition of ROS (tert-butyl hydroperoxide, 350 μM) for 4 h. Western blots were performed. c, Quantification of cell death as shown in Fig. 6c. Mean ± s.d. from two technical replicates are shown. d, U2OS cells were treated with nutlin (10 μM) for 24 h first, followed by ROS (tert-butyl hydroperoxide, 350 μM) along with indicated cell death inhibitors; cell death were quantified 24 h later. Error bars, s.d. from two technical replicates. e, U2OS cells were treated with DNA-damaging agents (etoposide, 20 μM; doxorubicin, 0.2 μg ml−1) for 48 h with or without the presence of ferr-1 (2 μM) (magnification, ×10); cell death was quantified in f with mean ± s.d. shown (n = 2 technical replicates). All data were repeated three times independently.
Extended Data Figure 9. Generation of BAC transgenic mice for Slc7a11 overexpression.
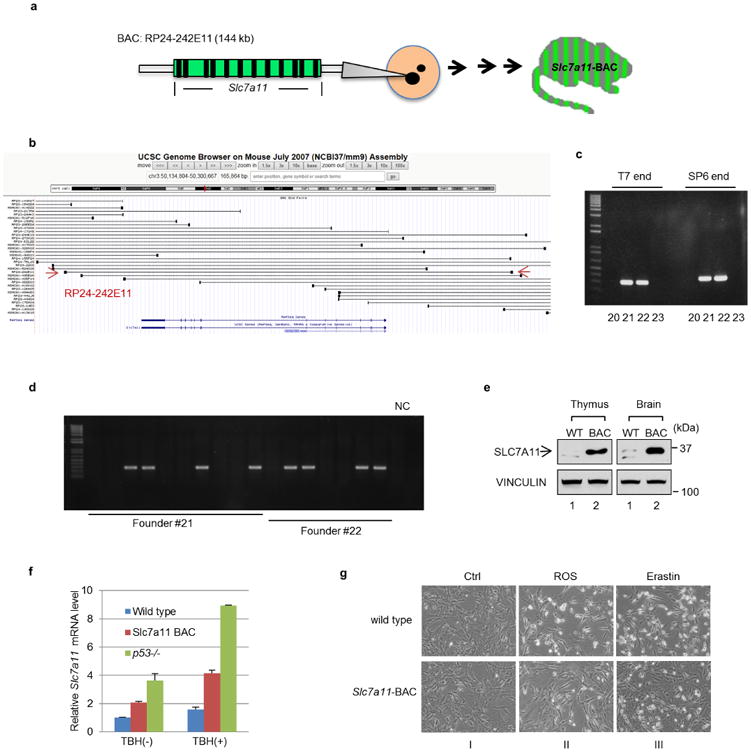
a, Schematic diagram showing the procedure for generation of Slc7a11-BAC transgenic mice. b, Snap shot of BACs surrounding mouse Slc7a11 genes. BAC (RP24-242E11) that contains only the Slc7a11 gene was selected for injection. c, PCR at both ends of the BAC construct identified founders (no. 21 and no. 22) as positive BAC transgenic mice. d, Germline transmission was confirmed from both founders identified in c. NC, no template control. e, Thymus and brain tissues from 3-week-old litter mates of control and Slc7a11-BAC transgenic mice were lysed and examined by western blots. f, MEF cells with indicated genotypes were treated as in Fig. 6e for 2 h and mRNA levels were determined by RT–qPCR. Mean ± s.d. from two technical replicates are shown. g, Representative images of cells treated as in Fig. 6e (magnification, ×10).
Acknowledgments
This work was supported by the National Cancer Institute of the National Institutes of Health under awards 5R01CA172023, 5RO1CA166294, 5RO1CA169246, 5RO1CA085533 and 2P01CA080058 to W.G. It was also supported by the National Cancer Institute under award 2P01CA097403 to R.B. and W.G. The content is solely the responsibility of the authors and does not necessarily represent the official views of the National Institutes of Health. L.J. and S.-J.W. were supported by NIH cancer biology training grant T32-CA09503. We thank S. Mendrysa for Mdm2 mutant mice.
Footnotes
Online Content Methods, along with any additional Extended Data display items and Source Data, are available in the online version of the paper; references unique to these sections appear only in the online paper.
Author Contributions The experiments were conceived and designed by L.J., N. K. and W.G. Experiments were performed mainly by L.J. and N.K. Some of the experiments were performed with help from T.L, S.-J.W., T.S., H.H. and R.B. The paper was written by J.L., N.K., R.B. and W.G.
Author Information Microarray data can be accessed through NCBI Gene Expression Omnibus (GEO) database with accession number GSE57841.
The authors declare no competing financial interests.
Readers are welcome to comment on the online version of the paper.
References
- 1.Berkers CR, Maddocks OD, Cheung EC, Mor I, Vousden KH. Metabolic regulation by p53 family members. Cell Metab. 2013;18:617–633. doi: 10.1016/j.cmet.2013.06.019. [DOI] [PMC free article] [PubMed] [Google Scholar]
- 2.Jackson JG, Lozano G. The mutant p53 mouse as a pre-clinical model. Oncogene. 2013;32:4325–4330. doi: 10.1038/onc.2012.610. [DOI] [PubMed] [Google Scholar]
- 3.Aylon Y, Oren M. New plays in the p53 theater. Curr Opin Genet Dev. 2011;21:86–92. doi: 10.1016/j.gde.2010.10.002. [DOI] [PMC free article] [PubMed] [Google Scholar]
- 4.Junttila MR, Evan G. I p53–a Jack of all trades but master of none Nature Rev Cancer. 2009;9:821–829. doi: 10.1038/nrc2728. [DOI] [PubMed] [Google Scholar]
- 5.Wang SJ, Gu W. To be, or not to be: functional dilemma of p53 metabolic regulation. Curr Opin Oncol. 2014;26:78–85. doi: 10.1097/CCO.0000000000000024. [DOI] [PMC free article] [PubMed] [Google Scholar]
- 6.Bieging KT, Attardi LD. Deconstructing p53 transcriptional networks in tumor suppression. Trends Cell Biol. 2012;22:97–106. doi: 10.1016/j.tcb.2011.10.006. [DOI] [PMC free article] [PubMed] [Google Scholar]
- 7.Brady CA, et al. Distinct p53 transcriptional programs dictate acute DNA-damage responses and tumor suppression. Cell. 2011;145:571–583. doi: 10.1016/j.cell.2011.03.035. [DOI] [PMC free article] [PubMed] [Google Scholar]
- 8.Valente LJ, et al. p53 efficiently suppresses tumor development in the complete absence of its cell-cycle inhibitory and proapoptotic effectors p21, Puma, and Noxa. Cell Rep. 2013;3:1339–1345. doi: 10.1016/j.celrep.2013.04.012. [DOI] [PubMed] [Google Scholar]
- 9.Kruse JP, Gu W. Modes of p53 regulation. Cell. 2009;137:609–622. doi: 10.1016/j.cell.2009.04.050. [DOI] [PMC free article] [PubMed] [Google Scholar]
- 10.Li T, et al. Tumor suppression in the absence of p53-mediated cell-cycle arrest, apoptosis, and senescence. Cell. 2012;149:1269–1283. doi: 10.1016/j.cell.2012.04.026. [DOI] [PMC free article] [PubMed] [Google Scholar]
- 11.Lo M, Wang YZ, Gout PW. The xc− cystine/glutamate antiporter: a potential target for therapy of cancer and other diseases. J Cell Physiol. 2008;215:593–602. doi: 10.1002/jcp.21366. [DOI] [PubMed] [Google Scholar]
- 12.Conrad M, Sato H. The oxidative stress-inducible cystine/glutamate antiporter, system xc− : cystine supplier and beyond. Amino Acids. 2012;42:231–246. doi: 10.1007/s00726-011-0867-5. [DOI] [PubMed] [Google Scholar]
- 13.Sato H, Tamba M, Kuriyama-Matsumura K, Okuno S, Bannai S. Molecular cloning and expression of human xCT, the light chain of amino acid transport system xc−. Antioxid Redox Signal. 2000;2:665–671. doi: 10.1089/ars.2000.2.4-665. [DOI] [PubMed] [Google Scholar]
- 14.Vu BT, Vassilev L. Small-molecule inhibitors of the p53–MDM2 interaction. Curr Top Microbiol Immunol. 2011;348:151–172. doi: 10.1007/82_2010_110. [DOI] [PubMed] [Google Scholar]
- 15.Dixon SJ, et al. Ferroptosis: an iron-dependent form of nonapoptotic cell death. Cell. 2012;149:1060–1072. doi: 10.1016/j.cell.2012.03.042. [DOI] [PMC free article] [PubMed] [Google Scholar]
- 16.Huang Y, Dai Z, Barbacioru C, Sadee W. Cystine-glutamate transporter SLC7A11 in cancer chemosensitivity and chemoresistance. Cancer Res. 2005;65:7446–7454. doi: 10.1158/0008-5472.CAN-04-4267. [DOI] [PubMed] [Google Scholar]
- 17.Liu XX, et al. MicroRNA-26b is underexpressed in human breast cancer and induces cell apoptosis by targeting SLC7A11. FEBS Lett. 2011;585:1363–1367. doi: 10.1016/j.febslet.2011.04.018. [DOI] [PubMed] [Google Scholar]
- 18.Guo W, et al. Disruption of xCT inhibits cell growth via the ROS/autophagy pathway in hepatocellular carcinoma. Cancer Lett. 2011;312:55–61. doi: 10.1016/j.canlet.2011.07.024. [DOI] [PubMed] [Google Scholar]
- 19.Montes de Oca Luna R, Wagner DS, Lozano G. Rescue of early embryonic lethality in mdm2-deficient mice by deletion of p53. Nature. 1995;378:203–206. doi: 10.1038/378203a0. [DOI] [PubMed] [Google Scholar]
- 20.Jones SN, Roe AE, Donehower LA, Bradley A. Rescue of embryonic lethality in Mdm2-deficient mice by absence of p53. Nature. 1995;378:206–208. doi: 10.1038/378206a0. [DOI] [PubMed] [Google Scholar]
- 21.Gannon HS, Jones SN. Using mouse models to explore MDM–p53 signaling in development, cell growth, and tumorigenesis. Genes Cancer. 2012;3:209–218. doi: 10.1177/1947601912455324. [DOI] [PMC free article] [PubMed] [Google Scholar]
- 22.Mendrysa SM, et al. Mdm2 is critical for inhibition of p53 during lymphopoiesis and the response to ionizing irradiation. Mol Cell Biol. 2003;23:462–472. doi: 10.1128/MCB.23.2.462-473.2003. [DOI] [PMC free article] [PubMed] [Google Scholar]
- 23.Marine JC, Lozano G. Mdm2-mediated ubiquitylation: p53 and beyond. Cell Death Differ. 2010;17:93–102. doi: 10.1038/cdd.2009.68. [DOI] [PubMed] [Google Scholar]
- 24.Chavez-Reyes A, et al. Switching mechanisms of cell death in mdm2- and mdm4-null mice by deletion of p53 downstream targets. Cancer Res. 2003;63:8664–8669. [PubMed] [Google Scholar]
- 25.Yang WS, et al. Regulation of ferroptotic cancer cell death by GPX4. Cell. 2014;156:317–331. doi: 10.1016/j.cell.2013.12.010. [DOI] [PMC free article] [PubMed] [Google Scholar]
- 26.Hughes RH, Silva VA, Ahmed I, Shreiber DI, Morrison B., III Neuroprotection by genipin against reactive oxygen and reactive nitrogen species-mediated injury in organotypic hippocampal slice cultures. Brain Res. 2014;1543:308–314. doi: 10.1016/j.brainres.2013.11.020. [DOI] [PubMed] [Google Scholar]
- 27.Wang Z, Jiang H, Chen S, Du F, Wang X. The mitochondrial phosphatase PGAM5 functions at the convergence point of multiple necrotic death pathways. Cell. 2012;148:228–243. doi: 10.1016/j.cell.2011.11.030. [DOI] [PubMed] [Google Scholar]
- 28.Lu M, et al. Restoring p53 function in human melanoma cells by inhibiting MDM2 and cyclin B1/CDK1-phosphorylated nuclear iASPP. Cancer Cell. 2013;23:618–633. doi: 10.1016/j.ccr.2013.03.013. [DOI] [PubMed] [Google Scholar]
- 29.Wade M, Wahl GM. Targeting Mdm2 and Mdmx in cancer therapy: better living through medicinal chemistry? Mol Cancer Res. 2009;7:1–11. doi: 10.1158/1541-7786.MCR-08-0423. [DOI] [PMC free article] [PubMed] [Google Scholar]
- 30.Wang PY, et al. Increased oxidative metabolism in the Li-Fraumeni syndrome. N Engl J Med. 2013;368:1027–1032. doi: 10.1056/NEJMoa1214091. [DOI] [PMC free article] [PubMed] [Google Scholar]
- 31.Liang Y, Liu J, Feng Z. The regulation of cellular metabolism by tumor suppressor p53. Cell Biosci. 2013;3:9. doi: 10.1186/2045-3701-3-9. [DOI] [PMC free article] [PubMed] [Google Scholar]
- 32.Bensaad K, et al. TIGAR, ap53-inducible regulator of glycolysis and apoptosis. Cell. 2006;126:107–120. doi: 10.1016/j.cell.2006.05.036. [DOI] [PubMed] [Google Scholar]
- 33.Cairns RA, Harris IS, Mak TW. Regulation of cancer cell metabolism. Nature Rev Cancer. 2011;11:85–95. doi: 10.1038/nrc2981. [DOI] [PubMed] [Google Scholar]
- 34.Cheung EC, Ludwig RL, Vousden KH. Mitochondrial localization of TIGAR under hypoxia stimulates HK2 and lowers ROS and cell death. Proc Natl Acad Sci USA. 2012;109:20491–20496. doi: 10.1073/pnas.1206530109. [DOI] [PMC free article] [PubMed] [Google Scholar]
- 35.Cheung EC, et al. TIGAR is required for efficient intestinal regeneration and tumorigenesis. Dev Cell. 2013;25:463–477. doi: 10.1016/j.devcel.2013.05.001. [DOI] [PMC free article] [PubMed] [Google Scholar]
- 36.Hu W, et al. Glutaminase 2, a novel p53 target gene regulating energy metabolism and antioxidant function. Proc Natl Acad Sci USA. 2010;107:7455–7460. doi: 10.1073/pnas.1001006107. [DOI] [PMC free article] [PubMed] [Google Scholar]
- 37.Suzuki S, et al. Phosphate-activated glutaminase (GLS2), a p53-inducible regulator of glutamine metabolism and reactive oxygen species. Proc Natl Acad Sci USA. 2010;107:7461–7466. doi: 10.1073/pnas.1002459107. [DOI] [PMC free article] [PubMed] [Google Scholar]
- 38.Schmidt D, et al. ChIP-seq: using high-throughput sequencing to discover protein-DNA interactions. Methods. 2009;48:240–248. doi: 10.1016/j.ymeth.2009.03.001. [DOI] [PMC free article] [PubMed] [Google Scholar]
- 39.Zheng H, et al. A posttranslational modification cascade involving p38, Tip60, and PRAK mediates oncogene-induced senescence. Mol Cell. 2013;50:699–710. doi: 10.1016/j.molcel.2013.04.013. [DOI] [PMC free article] [PubMed] [Google Scholar]
- 40.Kon N, et al. Inactivation of HAUSP in vivo modulates p53 function. Oncogene. 2010;29:1270–1279. doi: 10.1038/onc.2009.427. [DOI] [PMC free article] [PubMed] [Google Scholar]


