

Summary
Tissue homeostasis is achieved through a balance of cell production (growth) and elimination (regression)1,2. Contrary to tissue growth, the cells and molecular signals required for tissue regression remain unknown. To investigate physiological tissue regression, we use the mouse hair follicle, which cycles stereotypically between phases of growth and regression while maintaining a pool of stem cells to perpetuate tissue regeneration3. Here we show by intravital microscopy in live mice4–6 that the regression phase eliminates the majority of the epithelial cells by two distinct mechanisms: terminal differentiation of suprabasal cells and a spatial gradient of apoptosis of basal cells. Furthermore, we demonstrate that basal epithelial cells collectively act as phagocytes to clear dying epithelial neighbors. Through cellular and genetic ablation we show that epithelial cell death is extrinsically induced through TGFβ activation and mesenchymal crosstalk. Strikingly, our data show that regression acts to reduce the stem cell pool as inhibition of regression results in excess basal epithelial cells with regenerative abilities. This study identifies the cellular behaviors and molecular mechanisms of regression that counterbalance growth to maintain tissue homeostasis.
Keywords: Phagocytosis, Cell Death, Hair Follicle, Stem Cells, Intravital Microscopy
Tissue regression in the hair follicle is thought to be mediated through programmed cell death7. However, it is unclear which cells within the follicle are removed and whether this process is a result of intrinsic cellular exhaustion or active elimination by extrinsic factors. We utilized our established intravital microscopy technique4 to visualize cell behaviors non-invasively in live mice during hair follicle regression (Figure 1a; Extended Data Fig. 1; Supplementary Video 1). Unexpectedly, time-lapse recordings of epithelial nuclei (K14-H2BGFP) revealed a lack of cell death by nuclear fragmentation in the suprabasal (inner) layers. Furthermore, time-lapses and genetic lineage tracing approaches showed that inner layers were eliminated through upward terminal differentiation8 (Figure 1b–c, Extended Data Fig. 2, Supplementary Videos 2).
Figure 1. Basal epithelial cells collectively act as phagocytes to clear neighboring epithelial cell debris.

a) Schematic of hair follicle in regression, indicating the basal and suprabasal (inner) epithelial layers, using K14-H2BGFP mice. b) Single optical sections showing upward collective movement of inner layers in relation to surrounding basal epithelial cells at successive time points, 2.5 h apart (compare position of yellow and white dashed lines). c) Single-cell lineage tracing of inner layer cells during regression (n = 30 cells, in 4 mice. Labeled cells were revisited daily. Asterisk indicates mesenchymal dermal papilla. d) Single optical sections showing cell death (nuclear fragmentation) at successive time points. Note that fragments (green) relocate (white arrow) around neighboring epithelial nuclei (yellow, red, and blue). e) Whole mount staining showing engulfment of neighboring basal epithelial cellular content by phalloidin staining (blue) in with mosaic Cre-induction in basal layer. Nucleus (green) and cytoplasm (red). f) Electron micrograph illustrating multiple apoptotic bodies (red arrowhead) present in basal epithelial cells. Der, dermis. Basal, basal epithelial cell. Inset shows high magnification electron micrograph depicting desmosomal junctions (arrowhead) of phagocytic epithelial cells. Scale bar, 500 nm. g) Single optical sections of both coronal and transverse planes (x,y and x,z) at successive time points 4 min apart showing internalization of an apoptotic body (yellow border) by a neighboring basal epithelial cell. Nucleus (red) and cell cortex (green). h) Scheme of the two modes of elimination of epithelial cells and collective phagocytic uptake of basal epithelial apoptotic bodies by neighboring basal epithelial cells during regression. Scale bars, 20 μm.
In contrast, we captured cell death in the basal epithelial layer in vivo. Furthermore, we found that apoptotic debris was retained within the basal epithelium and relocated around neighboring nuclei, suggesting that basal epithelial cells may act as phagocytes to remove epithelial cellular debris during hair follicle regression (Figure 1d, Supplementary Video 3). To test this, we induced mosaic expression of a cytoplasmic tdTomato fluorescent reporter in the basal layer. This showed internalization of tdTomato+ epithelial debris into neighboring tdTomato− basal epithelial cells (Figure 1e). Ultrastructure analysis confirmed phagocytosis of apoptotic bodies by basal epithelial cells (Figure 1f, Extended Data Fig. 3). Tracking this process in real-time with cytoskeletal and nuclear labeling demonstrated that apoptotic debris from a single cell were dispersed within the surrounding epithelium and collectively internalized by neighboring basal epithelial cells (Figure 1g, Supplementary Videos 4–6). Consistent with these findings, professional phagocytes9 were neither present inside the regressing hair follicles nor co-localized with epithelial cell debris (Extended Data Fig. 4; Supplementary Videos 7–8). Taken together, these data reveal two modes of epithelial cell elimination during hair follicle regression. While suprabasal cells undergo terminal differentiation, basal epithelial cells undergo apoptosis and are collectively removed by their basal epithelial neighbors. These findings, along with work in the mammary gland10,11, support a new paradigm of physiological epithelial self-clearance.
Thus far, we have demonstrated that the basal epithelium adopts new cellular behaviors from growth to regression4,5. During growth, downwards extension of the basal epithelium relies on highly mitotic cells located in the lower portion of the follicle. Additionally, these basal cells are more likely to be eliminated during regression, suggesting a model where mitotic exhaustion primes cells for death12. An alternative model could be that cell death is driven by extrinsic cues based on spatial location in the basal epithelium. To test these models, we promoted survival intrinsically in the basal epithelium using the Wnt/β-catenin signaling pathway, which is expressed in the suprabasal layers and has been implicated in survival of these cells13 (Figure 2a, Extended Data Fig. 5). We used a Cre-inducible genetic model to activate β-catenin signaling ectopically in single cells of the basal epithelium6 and track survival during regression in vivo (Figure 2b). Control experiments confirmed a spatial bias of cell survival in the upper basal layer, as suggested by previous work12. Though β-catenin activation was observed to enhance cell survival throughout the follicle, the spatial bias of cell survival seen in controls was retained in the β-catenin activated follicles (Figure 2c–d). These data suggest that cell intrinsic factors such as Wnt/β-catenin signaling alone do not explain the pattern of cell survival observed and implicate extrinsic factors to induce cell death in the basal epithelium.
Figure 2. β-catenin activation not sufficient to overcome extrinsic gradient of basal epithelial survival.

a) Wnt/β-catenin activation is restricted to inner layers. Immunofluorescent staining of Lef1 in regressing hair follicle. Lef1 (red) and P-cadherin (green). b) Scheme of basal and inner layer behaviors and β-catenin activation during hair follicle regression. c) Lineage tracing of basal epithelial cells revisited at the beginning and end of regression. Representative examples of either a single control or β-catenin activated cell traced during regression. d) Graphical representation of cell survival as a function of initial position within the regressing hair follicle (n = 235 or 135 in control or β-catenin, respectively, in 4 mice). Scale bars, 25 μm.
These results prompted us to ask whether the observed pattern of basal cell survival was the result of spatially regulated induction of cell death. Quantifications of cell death events in time-lapse recordings of various stages of regression revealed an initial localized induction of cell death at the bottom of the follicle, which is in direct contact with the hair follicle mesenchymal dermal papilla (DP) niche (Figure 3a; Supplementary Video 9). Therefore, we hypothesized that interaction with the DP promotes cell death along the basal epithelium of the hair follicle. To test this, we utilized two-photon laser ablation4 to specifically remove the DP at the onset of regression and revisited the same hair follicles over time (Figure 3b). DP-ablation resulted in significantly reduced death of basal epithelial cells as measured by hair follicle length when compared to neighboring unablated hair follicles (Figure 3c; Extended Data Fig. 6). Significant differences in ablated and unablated hair follicle lengths are seen as early as two days after ablation, suggesting that the DP directly promotes regression (Figure 3d). The difference in length of ablated and unablated hair follicles could be attributed to a reduction in cell death or reduction in cell clearance. To be able to distinguish the effect of the DP on these two processes, we quantified the number of apoptotic debris sites in ablated follicles two days after ablation and found that the amount of cellular debris was significantly reduced compared to control follicles at this initial time point. The debris generated from these follicles by Day 2 were cleared by Day 4, similar to control follicles, suggesting cell clearance is relatively unaffected by DP removal (Figure 3e). Collectively, this establishes a functional role for the mesenchymal niche to promote basal epithelial cell death.
Figure 3. Mesenchymal DP crosstalk and TGFβ signaling are required for cell death in the basal epithelium.

a) Graphical representation and quantification of spatial distribution of cell death in the basal layer at three stages of regression using time-lapse recordings (n = 9 follicles, in 5 mice). b) Scheme of laser ablation experiment. c) Sequential revisits of hair follicles after DP ablation during regression. Yellow arrowhead indicates laser ablation site. Asterisk indicates auto-fluorescence from the two-photon laser. d) Dot plot quantification of the hair follicle length at Day 0, 2 and 4 after DP ablation, and e) of the number of apoptotic fragmentation sites at Day 2 and 4 after DP ablation (n = 36 follicles, in 6 mice; mean ± SD). f) mRNA levels of TGFβ1 ligand expression in the mesenchymal DP and g) Smad7 expression in hair follicle basal layer throughout the hair cycle (p<0.005; mean ± SD; n = 3 technical replicates). h) Localized TGFβ activation by immunofluorescent staining of pSmad2 at the onset of hair follicle regression. DAPI (blue), pSmad2 (red), and P-cadherin (green). i) Hair follicles after Cre-induced recombination in TGFβR1fl/fl and TGFβR1fl/+ mice at the end of regression. j) Dot plot quantification of the hair follicle length, and k) of the number of apoptotic fragmentation sites at the end of regression (n = 31 follicles, in 4 mice; mean ± SD). Scale bars, 25 μm.
To understand the molecular signaling that facilitates basal epithelial cell death, we investigated the TGFβ signaling pathway, as exogenous administration of TGFβ1 ligand has been shown to induce precocious hair follicle regression14. We found that TGFβ ligands are expressed by the mesenchymal DP, while TGFβ signaling is active in the basal epithelium during the regression phase (Figure 3f–h; Extended Data Fig. 7, 8a). To test the functional role of TGFβ signaling in basal epithelial cell death during regression, we conditionally eliminated TGFβ receptor I (TGFβRI) in the basal layer15 (Extended Data Fig. 8b–c). Removal of TGFβRI at the onset of regression resulted in aberrant accumulation of basal cells by the end of regression when compared to control littermates (Figure 3i–k). Together these data demonstrate that extrinsic regulation through TGFβ signaling and epithelial-mesenchymal crosstalk induces cell death along the basal epithelium while sparing a restricted pool of stem cells.
This work raises the question of whether hair follicle regression serves to eliminate either exhausted basal cells or functional cells from an expanded stem cell pool. To address this question, we utilized an approach to remove the DP transiently16 during regression (Figure 4a). Strikingly, as neighboring unablated follicles began a new round of growth, DP-ablated follicles that had failed to complete regression also initiated hair growth from the bottom of their aberrantly long basal epithelium. Furthermore, ablated hair follicles appeared grossly normal with proper generation of differentiated suprabasal layers, similar to neighboring unablated hair follicles (Figure 4b). These findings demonstrate that basal epithelial cells of the hair follicle are not intrinsically committed for cell death, but rather retain a capacity to regenerate tissue. This suggests that regression functions to reduce the stem cell pool following expansion during growth.
Figure 4. Basal epithelial cells targeted for cell death retain regenerative potential.
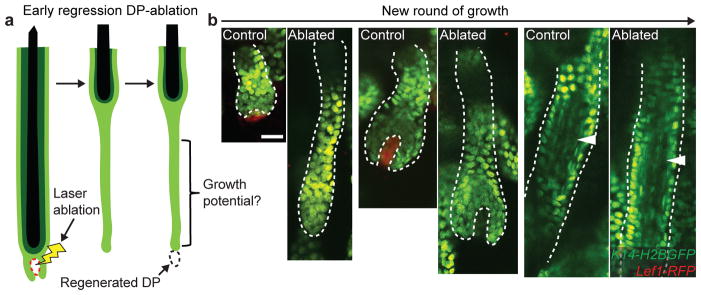
a) Scheme of laser ablation experiment. b) Sequential revisits of hair follicles after DP-ablation during the next round of growth (P22–P35). White arrowhead indicates differentiated inner layers. Observations shown represent n = 3 mice. Scale bars, 25 μm.
In summary, we show that physiological regression is an extrinsically regulated process that reduces the size of the hair follicle stem cell compartment while not affecting terminal differentiation programs. Regression is regulated through TGFβ signaling initiated by the mesenchymal niche to induce spatially restricted cell death in the basal epithelium. Clearance of apoptotic cells is a self-contained process driven by epithelial phagocytosis within the regressing basal epithelium. Finally, inhibition of regression through transient loss of the mesenchymal niche demonstrates that cells throughout the hair follicle basal epithelium maintain regenerative competency when in proximity to the mesenchymal niche (Extended Data Fig. 9). All together, we demonstrate that tissue regression relies on spatially coordinated cellular behaviors, and establish a new understanding of the extrinsic regulation that counterbalances tissue growth over the lifespan of an organism.
Methods
Mice
K14-H2BGFP17, Lef1-RFP18 and K14-GFPActin19 were obtained from the Fuchs Laboratory. TGFβRIfl/fl mice were obtained from Vesa Kaartinen15. β-catnflox(Ex3)/+ mice were obtained from Makoto Taketo20. Lgr5-CreER (Clevers Lab), Shh-CreER (Tabin Lab), LysM-Cre (Foerster Lab), CX3CR1-GFP (Littman Lab) and Rosa-stop-tdTomato (Zeng Lab) were obtained from Jackson Laboratory (JAX)21–25. The Yale Transgenic Facility generated the K14-H2BmCherry mice. All studies and procedures involving animal subjects were approved by the Institutional Animal Care and Use Committee at Yale School of Medicine and conducted in accordance with the approved animal handling protocol. Lgr5-CreER and Shh-CreER were used to recombine alleles and label cells conditionally within specific hair follicle populations and temporally during the regression phase. Cre-induction for the lineage tracing experiments was induced with a single intraperitoneal injection of Tamoxifen (1μg/g in corn oil) at postnatal day 14. TGFβRIfl/fl recombination was induced with three intraperitoneal injection of Tamoxifen (100μg/g in corn oil) at postnatal day 10, 12 and 14. Intravital microscopy and laser ablation procedures were carried out as described previously4,5. For lineage tracing experiments only cells that were unambiguously separated from other were sampled to ensure the identity of individual lineages. Mice from experimental and control groups were randomly selected for live imaging experiments. No blinding was done. All lineage tracing and ablation experiments were repeated in at least three different mice.
Generation of K14H2BmCherry mice
Transgenic mice expressing H2BmCherry under the control of the Keratin 14 promoter (K14-H2BmCherry) were generated using the following procedure. The H2BmCherry insert (provided by D. Egli) was amplified by PCR from the TopoTA vector (Life Technologies) using primers 5′-CGGCGGATCCATGCCAGAGCCAGC and 3′-CGCTCTAGATTACTTGTACAGCTCGTCC, which introduced cleavage sites for BamHI and XbaI restriction enzymes immediately upstream and downstream, respectively, of the open reading frame. The 1.1Kb PCR product was inserted between the BamHI and XbaI sites in the pG3Z*K14cassette vector (provided by E. Fuchs). The resulting transgene was digested with SacI and SphI, and the 4.3Kb fragment was injected into blastocysts at the Yale Transgenic Facility (T. Nottoli). Chimeric mice were screened initially by PCR and founder mice were selected to establish transgenic mouse lines. These initial lines were subsequently screened by histological analysis, and the line displaying the highest expression levels of the K14H2BmCherry reporter was selected to establish the final colony.
In vivo imaging and laser ablation
Mice between postnatal day 17 and 35 were anesthetized with intraperitoneal injection of 7 μl/g of ketamine/xylazine cocktail mix (15mg/ml and 1mg/ml, respectively in PBS). Anesthesia was maintained throughout the course of the experiment with vaporized isofluorane delivered by a nose cone as previously described10. Image stacks were acquired with a LaVision TriM Scope II (LaVision Biotec, Germany) microscope equipped with a tunable Chameleon Ultra (Coherent, USA) Ti:Sapphire laser. To acquire serial optical sections a laser beam (740nm for Alexafluor 350; 940 nm for H2BGFP; 1040 nm for RFP and tdTomato; 990 nm for simultaneous excitation of GFPActin and H2BmCherry) was focused through a 20X or 40X water immersion lens (N.A. 1.0 and 1.1 respectively; Zeiss, USA) and scanned with a field of view of 0.5 or 0.25 mm2 respectively at 600Hz. Z-stacks were acquired in 1–3 μm steps to image a total depth of 150 μm of tissue. We revisited the same hair follicles in separate experiments as previously described10. For time-lapse recordings, serial optical sections were obtained between 1 to 5 minute intervals, depending on the experimental setup. Laser ablation was carried out with the same optics as used for acquisition. An 800nm laser beam was used to scan the target area (10–50 μm2) and ablation was achieved using 30–50% laser power for ~1sec. Ablation parameters were adjusted according to the depth of the target (50–100 μm).
Image Analysis
Raw image stacks were imported into Fiji (NIH, USA) or Imaris software (Bitplane/Perkin Elmer) for further analysis. Provided images and supplementary videos are typically presented as a maximal projection of 3 to 6 μm optical sections. For visualizing individual labeled cells expressing the tdTomato Cre reporter, the brightness and contrast were adjusted accordingly for the green (GFP) and red (RFP/tdTomato) channels and composite serial image sequences were assembled as previously described. Hair follicle length and labeled cell position values were measured from the top of the stem cell compartment. Apoptotic cell tracking analysis was performed in Imaris software (Bitplane).
Electron Microscopy
Trimmed skin samples were fixed (2% gluteraldehyde and 2%paraformaldehyde in 0.1M sodium cacodylate buffer pH7.4) for 1 hour. The samples were rinsed in sodium cacodylate buffer and were post-fixed in 1% osmium tetroxide for 1 hour. The samples were rinsed and en-bloc stained in aqueous 2% uranyl acetate for an hour further, followed by rinsing, dehydrating in an ethanol series to 100%, and rinsing several times in 100% propylene. Then samples were infiltrated with Embed 812 (Electron Microscopy Sciences) resin and baked overnight at 60° C. Hardened blocks were cut using a Leica UltraCut UC7. 60 nm sections were collected and stained using 2% uranyl acetate and lead citrate for transmission microscopy, and 250 nm thick sections were stained with either Richardson’s stain or 1% Toluidine Blue for light microscopy. For immunolabeled electron microscopy, dissected skin samples were fixed in 4% paraformaldehyde/0.1% gluteraldehyde in phosphate buffer for 30 minutes and then in 4% paraformaldehyde/PB overnight at 4° C. The samples were rinsed in 0.1M HEPES. To quench, aldehydes were placed in 50mM NH4Cl +100mM glycine +2% sucrose for 1 hour then washed in Hepes buffer and placed in 0.1% Tannic Acid/0.1M Hepes for 1 hour, then rinsed in 50mMTris/50mM Maleate and placed 2% UA/50mMTris/50mM Maleate for a 1 hour. After rinsing, they were dehydrated through a graded series 50 % to 95% of ethanol at 4C, then infiltrated with 50:50 ethanol/LR White (EMS) for 1 hour followed by several changes of pure 100% LR White overnight on a rotator at 4°C. Samples were polymerized at 60°C for 18 hours. 50nm resin sections were cut on a Leica UC7 ultra-microtome and collected on nickel formvar/carbon grids, and immunolabeled using a primary chicken anti-GFP (Abcam) diluted to 1:50 for 1 hour, rinsed and placed on protein A gold secondary 1:50 (University of Utrecht). The sections were counterstained with 2% uranyl acetate and lead citrate. Grids were viewed FEI Tencai Biotwin TEM at 80Kv. Images were taken using Morada CCD and iTEM (Olympus) software.
Immunostaining on paraffin sections and whole mount skin
Skin was fixed in 4% PFA for whole mount or in 10% formalin for paraffin embedding and used for histological analysis as previously described26. Immunohistochemistry was performed by incubating sections at 4°C overnight with primary antibodies as follows: mouse anti-β-catenin (1:100, BD #610153; 14/Beta-Catenin), rat anti-CD11b (1:250, eBioscience #14-0112; M1/70), goat anti-P-cadherin (1:100, R&D #AF761), rabbit anti-pSmad2 (Ser465/467) (1:1000, Cell Signaling #3108; 138D4), and rabbit anti-Lef-1 (1:100, Cell Signaling #2286; C18A7). pSmad2 immunostaining required TSA Plus kit (PerkinElmer). For brightfield immunohistochemistry, biotinylated species-specific secondary antibodies, followed by detection using the ABC kit (Vector Labs) and DAB kit (Vector Labs), were used according to the manufacturer’s instructions. M.O.M. kit was used for mouse antibodies (Vector Laboratories). Secondary antibodies conjugated with FITC, RRX and Cy5 (Jackson Immunoresearch Laboratories) were used at a concentration of 1:100 for 1 hour at room temperature. Alexafluor 350 phalloidin (Life Technologies) was used according to the manufacturer’s instructions.
FACS
Back skins of K14-H2BGFP; Lef1-RFP and Lgr5-CreER; TGFβRIfl/fl or TGFβRIfl/+; tdTomato; K14-H2BGFP mice were harvested at P12, P16, or P20 and were placed dermis down on 0.2% collagenase (Sigma) at 37°C for 20 minutes, and then 0.25% trypsin (Gibco) at 37°C for 10 minutes to obtain epithelial cells as previously described27. Cells were stained for 10 minutes with biotinylated rat anti-CD34 (1:50, eBiosciences #14-0341; RAM34), biotinylated rat anti-CD45 (1:50, BD #553077; 30-F11), biotinylated rat anti-CD117 (1:50, BD #553353; 2B8), and goat anti-Integrin alpha 9 (1:50, R&D #AF3827). Cells were washed for 5 minutes and then incubated with streptavidin-Pacific blue (1:200, Invitrogen) and Alexafluor 647 donkey anti-goat IgG (Jackson Immunoresearch Laboratories). Cells were isolated on DAPI exclusion and as follows: DP = RFP+, CD34−, CD45−, CD117−, Integrin-alpha 9+ and enriched ORS = RFP−, GFPHigh using a FACSAria II Cell Sorter (BioScience), as previously described28. Cells were sorted into RNA lysis buffer for RNA isolation (RNease Mini Kit, Qiagen). FACS profiles were analyzed through FlowJo software.
RT-qPCR
cDNA was made using Superscript III First-Strand Synthesis kit (Invitrogen). RT-qPCR was performed in triplicate with SYBER Green I reagents (Invitrogen) using 5.0ng cDNA per reaction on the ViiATM 7 Real-Time PCR system (Invitrogen – Life Technologies). Data were analyzed by ViiATM software, Microsoft Excel and PRISM. Gene-specific primers were designed and are listed in Supplementary Table 1.
Statistical Analysis
Data are expressed as percentages, box and whisker plots (error bars represent max and min), or mean ± SD. An unpaired Student’s t-test was used to analyze data sets with two groups and *p < 0.005 to **** p<0.0001 indicated a significant difference. Statistical calculations were performed using the Prism software package (GraphPad, USA).
Extended Data
Extended Data Fig. 1. Hair follicle regeneration cycle.

Hair follicle growth (Anagen) is characterized by downward expansion and generation of several epithelial layers. The most external layer, the outer root sheath (ORS), consists of relatively undifferentiated basal epithelial cells. Inner layers are generated by a committed progenitor pool, the matrix, which gives rise to several differentiated layers including: companion layer, inner root sheath (IRS) and hair shaft. Following growth, the majority of the newly formed layers are lost during the regression phase (Catagen), leaving a small surviving fraction of cells that reconstitute a new stem cell/progeny (Bulge/Hair Germ) compartment at the rest phase (Telogen).
Extended Data Fig. 2. Hair follicle inner layers resist apoptosis and continue upward terminal differentiation.

a) Upward movement of hair follicle inner layers during growth and regression. Single optical sections show upward collective movement of inner layers relative to surrounding basal cells at two time points 130 mins apart. Compare the position of labeled cells and dashed line of basal (red) to inner layers (yellow). b) Upward movement of hair shaft during regression. Optical sections of top view (epidermis) and side view (hair follicle) at two time points, one day apart. Note the extrusion of hair shafts from regressing hair follicles. Observations shown represent n = 3 mice. c) Companion layer lineage tracing during regression. Representative example of matrix progenitors of the companion layer traced during regression, in Lgr5-CreER;tdTomato;K14-H2BGFP mice. (n = 20 or 7 lineages, in 4 mice) d) Terminal differentiation of inner layer progenitor cells. Representative example of single-cell lineages (n = 35 or 9 lineages, in 3 mice) traced during the initial transition of hair follicle growth to regression, in Shh-CreER;tdTomato; K14-H2BGFP mice. Scale bars, 25 μm.
Extended Data Fig. 3. Apoptotic bodies are cleared by neighboring basal epithelial cells.

a) Toluidine blue stained section of regressing hair follicles used for ultrastructure analysis. b) Electron micrograph illustrating multiple apoptotic bodies (red arrowheads) present in hair follicle basal epithelium, but absent in inner layers. c) Electron micrograph showing a hair follicle in regression (white dashed line). d) Electron micrograph showing the restriction of apoptotic bodies (red arrowheads) and phagocytic activity to the basal epithelium. e) High magnification electron micrograph with immune-gold labeling for GFP protein expressed by K14-H2BGFP+ cells. Positive GFP labeling is present in both apoptotic bodies (Ap) and phagocytic basal epithelial nuclei (n). Observations shown represent n = 2 mice. Scale bars, 25 μm.
Extended Data Fig. 4. Professional phagocytes are not present in regressing hair follicles.

a) Professional phagocytes do not enter regressing hair follicles. Single optical sections showing absence of myeloid populations inside the hair follicle 2.5 h after epithelial cell death (arrowhead), in LysM-Cre; tdTomato;K14-H2BGFP mice. b) Immunofluorescent staining of myeloid populations in skin during hair follicle regression. DAPI (blue), CD11b (red), and P-cadherin (green). Observations shown represent n = 4 mice. Scale bar, 25 μm
Extended Data Fig. 5. Wnt/β-catenin activity is restricted to the inner layers during regression.

a) Immunohistochemistry and b) immunofluorescent staining highlighting active (nuclear) β-catenin of hair follicle inner layers (dashed line) at the onset of regression. c) Immunofluorescent staining of the Wnt/β-catenin target gene, Lef1, during hair follicle regression. DAPI (blue), Lef1 (red), and P-cadherin (green). Asterisk indicates mesenchymal DP. Observations shown represent n = 2 mice. Scale bars, 50 μm.
Extended Data Fig. 6. Late and partial mesenchymal DP removal does not affect hair follicle regression.

a) Sequential revisits of hair follicles after DP-ablation during late regression. b) Box plot quantification of hair follicle length immediately following ablation, 4 days, and 11 days after DP-ablation (n = 20 follicles, in 4 mice; error bars represent max and min). c) Sequential revisits of hair follicles after partial DP-ablation during early regression (n = 12 follicles, in 3 mice). d) Schematic illustration of the results from mesenchymal DP-ablation experiments. DP-ablation during early regression results in failed elimination of the basal epithelium, while the inner layers continue upward in terminal differentiation, yet DP-ablation during late regression does not impair hair follicle regression. Asterisk indicates auto-fluorescence from the two-photon laser. Scale bars, 25 μm.
Extended Data Fig. 7. Characterization of TGFβ pathway in mesenchymal DP and basal epithelial cell populations during regression.

a) Schematic of skin digestion and cell isolation with representative images before and after tissue digestion, in K14-H2BGFP;Lef1-RFP mice. b) Representative FACS scheme for isolating mesenchymal DP (RFP+, CD34−, CD45−, CD117−, Integrin-alpha 9+) and enriched hair follicle basal epithelium (RFP−, GFPHigh) cells. c) Validation of mesenchymal DP sorted population enrichment by Sox2 expression. d) Validation of basal epithelial sorted population enrichment by keratin-14 (K14) expression. e) TGFβ ligand 2 and 3 expression in the mesenchymal DP throughout the hair cycle. TGFβ-1 expression in basal epithelium, mesenchymal DP, and all sorted cells during regression. f) Differential expression of TGFβ target genes: Smad7, Tmeff1, p15INK4B and in the hair follicle basal epithelium throughout the hair cycle (p<0.005 mean ± SD; n = 3 technical replicates). Scale bars, 100μm.
Extended Data Fig. 8. Local TGFβ activation during regression and validation of Cre-induced loss of TGFβ receptor I expression.

a) TGFβ activation shown by immunofluorescent staining of pSmad2 during the transition from hair follicle growth to regression. DAPI (blue), pSmad2 (red), and P-cadherin (green). Observations shown represent n = 4 mice. b) Representative FACS scheme for isolating tdTomato-Cre reporter positive basal epithelial cells (tdTomato+, GFPHigh) from TGFβR1fl/fl and TGFβR1fl/+ mice. c) Expression of TGFβR1 and the TGFβ target gene, Smad7, in Cre-recombined basal epithelial cells from TGFβR1fl/fl and TGFβR1fl/+ mice ((p<0.005 mean ± SD; n = 3 technical replicates). Scale bar, 50 μm.
Extended Data Fig. 9. Extrinsic induction of hair follicle regression dictates the regenerative (stem cell) pool.
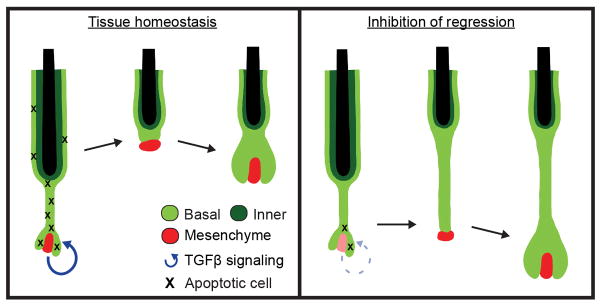
Crosstalk with the mesenchymal niche during regression results in localized TGFβ activation, promoting a spatially restricted gradient of cell death in the basal epithelium. Clearance of apoptotic cells by neighboring basal epithelial cells results in a limited pool of surviving stem cells. Inhibition of this regression process results in excessive amounts of basal epithelial cells capable of fueling a new round of growth when in contact with a mesenchymal DP.
Supplementary Material
Acknowledgments
We thank Elaine Fuchs for the K14-H2BGFP, Lef1-RFP, and K14-GFPActin mice; Makoto Taketo for the β-catnflox(Ex3)/+ mice; Art Horwich and Allison Mesa for critical feedback; Michael Rendl (MSSM) for technical advice. Morven Graham and Xinran Liu from the Yale Electron Microscopy Facility for technical support with EM. Dieter Egli (NYSCF) for the H2BmCherry construct and Timothy Nottoli from the Yale Animal Transgenic Facility for generating the K14-H2BmCherry mouse line. K.R.M. was supported by the NIH Predoctoral Program in Cellular and Molecular Biology, grant no. 5T32 GM007223 and is currently a NSF Graduate Research Fellow. This work is supported by the American Cancer Society, grant no. RSG-12-059-02; Yale Spore Grant National Cancer Institute, NIH, grant no. 2P50CA121974; the National Institute of Arthritis and Musculoskeletal and Skin Diseases (NIAMS), NIH, grant no. 1R01AR063663-01 and by The New York Stem Cell Foundation. V.G. is a New York Stem Cell Foundation – Robertson Investigator. P.R. is a New York Stem Cell Foundation – Druckenmiller Fellow. A.H. is supported by NIAMS Rheumatic Diseases Research Core Centers grant 5 P30 AR053495-07. K.B. was supported by the National Science Foundation. The National Science Foundation had no role in study design, data collection and analysis, decision to publish, or preparation of the manuscript. The views presented here are not those of the National Science Foundation and represent solely the views of the authors.
Footnotes
Supplementary Information is available in the online version of the paper.
Author Contributions K.R.M. and V.G. designed experiments and wrote the manuscript; K.R.M. performed the experiments and analyzed the data. P.R. generated the K14-H2BmCherry mouse line and assisted with two-photon time-lapse imaging. G.Z. and P.M. performed immunofluorescence. S.B. performed skin whole mount staining. T.S. assisted with technical aspects. K.R.M, D.G. and A.H. performed 3D imaging analysis. K.B. helped with data analysis.
References
- 1.Bergmann A, Steller H. Apoptosis, stem cells, and tissue regeneration. Science signaling. 2010;3:re8. doi: 10.1126/scisignal.3145re8. [DOI] [PMC free article] [PubMed] [Google Scholar]
- 2.Poon IK, Lucas CD, Rossi AG, Ravichandran KS. Apoptotic cell clearance: basic biology and therapeutic potential. Nature Reviews Immunology. 2014 doi: 10.1038/nri3607. [DOI] [PMC free article] [PubMed] [Google Scholar]
- 3.Müller-Röver S, et al. A comprehensive guide for the accurate classification of murine hair follicles in distinct hair cycle stages. Journal of Investigative Dermatology. 2001;117:3–15. doi: 10.1046/j.0022-202x.2001.01377.x. [DOI] [PubMed] [Google Scholar]
- 4.Rompolas P, et al. Live imaging of stem cell and progeny behaviour in physiological hair-follicle regeneration. Nature. 2012;487:496–499. doi: 10.1038/nature11218. [DOI] [PMC free article] [PubMed] [Google Scholar]
- 5.Rompolas P, Mesa KR, Greco V. Spatial organization within a niche as a determinant of stem-cell fate. Nature. 2013 doi: 10.1038/nature12602. [DOI] [PMC free article] [PubMed] [Google Scholar]
- 6.Deschene ER, et al. β-Catenin Activation Regulates Tissue Growth Non–Cell Autonomously in the Hair Stem Cell Niche. Science. 2014;343:1353–1356. doi: 10.1126/science.1248373. [DOI] [PMC free article] [PubMed] [Google Scholar]
- 7.Lindner G, et al. Analysis of apoptosis during hair follicle regression (catagen) The American journal of pathology. 1997;151:1601. [PMC free article] [PubMed] [Google Scholar]
- 8.Rogers GE. Hair follicle differentiation and regulation. International Journal of Developmental Biology. 2004;48:163–170. doi: 10.1387/ijdb.15272381. [DOI] [PubMed] [Google Scholar]
- 9.Li JL, et al. Intravital multiphoton imaging of immune responses in the mouse ear skin. Nature protocols. 2012;7:221–234. doi: 10.1038/nprot.2011.438. [DOI] [PubMed] [Google Scholar]
- 10.Monks J, et al. Epithelial cells as phagocytes: apoptotic epithelial cells are engulfed by mammary alveolar epithelial cells and repress inflammatory mediator release. Cell Death & Differentiation. 2005;12:107–114. doi: 10.1038/sj.cdd.4401517. [DOI] [PubMed] [Google Scholar]
- 11.Monks J, Smith-Steinhart C, Kruk ER, Fadok VA, Henson PM. Epithelial cells remove apoptotic epithelial cells during post-lactation involution of the mouse mammary gland. Biology of reproduction. 2008;78:586–594. doi: 10.1095/biolreprod.107.065045. [DOI] [PubMed] [Google Scholar]
- 12.Hsu YC, Pasolli HA, Fuchs E. Dynamics between stem cells, niche, and progeny in the hair follicle. Cell. 2011;144:92–105. doi: 10.1016/j.cell.2010.11.049. [DOI] [PMC free article] [PubMed] [Google Scholar]
- 13.Choi YS, et al. Distinct Functions for Wnt/β-Catenin in Hair Follicle Stem Cell Proliferation and Survival and Interfollicular Epidermal Homeostasis. Cell stem cell. 2013;13:720–733. doi: 10.1016/j.stem.2013.10.003. [DOI] [PMC free article] [PubMed] [Google Scholar]
- 14.Foitzik K, et al. Control of murine hair follicle regression (catagen) by TGF-β1 in vivo. The FASEB Journal. 2000;14:752–760. doi: 10.1096/fasebj.14.5.752. [DOI] [PubMed] [Google Scholar]
- 15.Larsson J, et al. TGF-β signaling–deficient hematopoietic stem cells have normal self-renewal and regenerative ability in vivo despite increased proliferative capacity in vitro. Blood. 2003;102:3129–3135. doi: 10.1182/blood-2003-04-1300. [DOI] [PubMed] [Google Scholar]
- 16.Rahmani W, et al. Hair follicle mesenchymal stem cells regenerate the dermal sheath, replenish the dermal papilla and specify hair type. Developmental Cell. 2014 doi: 10.1016/j.devcel.2014.10.022. in press. [DOI] [PubMed] [Google Scholar]
- 17.Tumbar T, et al. Defining the epithelial stem cell niche in skin. Science. 2004;303:359–363. doi: 10.1126/science.1092436. [DOI] [PMC free article] [PubMed] [Google Scholar]
- 18.Rendl M, Lewis L, Fuchs E. Molecular dissection of mesenchymal–epithelial interactions in the hair follicle. PLoS biology. 2005;3:e331. doi: 10.1371/journal.pbio.0030331. [DOI] [PMC free article] [PubMed] [Google Scholar]
- 19.Vaezi A, Bauer C, Vasioukhin V, Fuchs E. Actin cable dynamics and Rho/Rock orchestrate a polarized cytoskeletal architecture in the early steps of assembling a stratified epithelium. Developmental cell. 2002;3:367–381. doi: 10.1016/s1534-5807(02)00259-9. [DOI] [PubMed] [Google Scholar]
- 20.Harada N, et al. Intestinal polyposis in mice with a dominant stable mutation of the β-catenin gene. The EMBO journal. 1999;18:5931–5942. doi: 10.1093/emboj/18.21.5931. [DOI] [PMC free article] [PubMed] [Google Scholar]
- 21.Barker N, et al. Identification of stem cells in small intestine and colon by marker gene Lgr5. Nature. 2007;449:1003–1007. doi: 10.1038/nature06196. [DOI] [PubMed] [Google Scholar]
- 22.Harfe BD, et al. Evidence for an expansion-based temporal Shh gradient in specifying vertebrate digit identities. Cell. 2004;118:517–528. doi: 10.1016/j.cell.2004.07.024. [DOI] [PubMed] [Google Scholar]
- 23.Clausen B, Burkhardt C, Reith W, Renkawitz R, Förster I. Conditional gene targeting in macrophages and granulocytes using LysMcre mice. Transgenic research. 1999;8:265–277. doi: 10.1023/a:1008942828960. [DOI] [PubMed] [Google Scholar]
- 24.Jung S, et al. Analysis of fractalkine receptor CX3CR1 function by targeted deletion and green fluorescent protein reporter gene insertion. Molecular and cellular biology. 2000;20:4106–4114. doi: 10.1128/mcb.20.11.4106-4114.2000. [DOI] [PMC free article] [PubMed] [Google Scholar]
- 25.Madisen L, et al. A robust and high-throughput Cre reporting and characterization system for the whole mouse brain. Nature neuroscience. 2010;13:133–140. doi: 10.1038/nn.2467. [DOI] [PMC free article] [PubMed] [Google Scholar]
- 26.Zito G, et al. Spontaneous tumour regression in keratoacanthomas is driven by Wnt/retinoic acid signalling cross-talk. Nature communications. 2014;5 doi: 10.1038/ncomms4543. [DOI] [PMC free article] [PubMed] [Google Scholar]
- 27.Greco V, et al. A two-step mechanism for stem cell activation during hair regeneration. Cell stem cell. 2009;4:155–169. doi: 10.1016/j.stem.2008.12.009. [DOI] [PMC free article] [PubMed] [Google Scholar]
- 28.Clavel C, et al. Sox2 in the Dermal Papilla Niche Controls Hair Growth by Fine-Tuning BMP Signaling in Differentiating Hair Shaft Progenitors. Developmental cell. 2012;23:981–994. doi: 10.1016/j.devcel.2012.10.013. [DOI] [PMC free article] [PubMed] [Google Scholar]
Associated Data
This section collects any data citations, data availability statements, or supplementary materials included in this article.