

Abstract
The development of auditory temporal processing is important for processing complex sounds as well as for acquiring reading and language skills. Neuronal properties and sound processing change dramatically in auditory cortex neurons after the onset of hearing. However, the development of the auditory thalamus or medial geniculate body (MGB) has not been well studied over this critical time window. Since synaptic inhibition has been shown to be crucial for auditory temporal processing, this study examined the development of a feedforward, GABAergic connection to the MGB from the inferior colliculus (IC), which is also the source of sensory glutamatergic inputs to the MGB. IC-MGB inhibition was studied using whole cell patch-clamp recordings from rat brain slices in current-clamp and voltage-clamp modes at three age groups: a prehearing group [postnatal day (P)7–P9], an immediate posthearing group (P15–P17), and a juvenile group (P22–P32) whose neuronal properties are largely mature. Membrane properties matured substantially across the ages studied. GABAA and GABAB inhibitory postsynaptic potentials were present at all ages and were similar in amplitude. Inhibitory postsynaptic potentials became faster to single shocks, showed less depression to train stimuli at 5 and 10 Hz, and were overall more efficacious in controlling excitability with age. Overall, IC-MGB inhibition becomes faster and more precise during a time period of rapid changes across the auditory system due to the codevelopment of membrane properties and synaptic properties.
Keywords: critical window, midbrain, paired pulse, tectothalamic, thalamocortical
rapid changes in anatomy and physiology occur throughout the postnatal auditory pathway during development, with each auditory nucleus exhibiting a unique developmental profile. The developing auditory cortex (AC), in particular, has been the focus of several studies. Cortical sound-evoked response properties (Chang et al. 2005; de Villers-Sidani et al. 2007; Dorrn et al. 2010; Rosen et al. 2010; Sun et al. 2010; Zhang et al. 2003) as well as cellular intrinsic and synaptic properties (Oswald and Reyes 2011, 2008; Takesian et al. 2012, 2010) change sharply with age. The auditory thalamus is the primary sensory input to the AC. The importance of thalamic inputs in shaping AC development has been shown by a study that found that visual orientation maps develop in the AC after rerouting retinal inputs in place of collicular inputs to the auditory thalamus (Sharma et al. 2000). However, it is unclear whether the maturation of auditory cortical responses reflects the concurrent development of thalamic neurons, because development in the auditory thalamus has not been well studied.
Synaptic inhibition in the auditory system shapes spectral, temporal, and spatial selectivity properties of in vivo sound-evoked responses to simple and complex sounds (Chang et al. 2005; D'Angelo et al. 2005; LeBeau et al. 2001; Razak and Fuzessery 2009; Wang et al. 2002; Williams and Fuzessery 2011). Developmental studies in the superior olivary and lateral lemniscal nuclei have shown that inhibitory synaptic properties generally become faster and more precise with age, with each auditory synapse following a unique developmental timetable (Ammer et al. 2012; Awatramani et al. 2005; Chirila et al. 2007; Kapfer et al. 2002; Magnusson et al. 2005; Noh et al. 2010; Walcher et al. 2011). However, there is a strong inhibitory connection from the inferior colliculus (IC) to the auditory thalamus (Peruzzi et al. 1997; Winer et al. 1996), whose development has not been studied to date and is the focus of this study.
The connectivity of the auditory thalamus or medial geniculate body (MGB) is intriguing because it is both excited and inhibited by the IC. Excitatory information to MGB neurons is conveyed via glutamatergic inputs from the IC. However, the MGB also receives a unique, feedforward, monosynaptic, GABAergic input from the IC, which constitutes approximately one-third of the total projections from the IC to the rat and cat MGB (Bartlett and Smith 1999; Peruzzi et al. 1997; Winer et al. 1996). The IC-MGB inhibitory connection consists predominantly of large GABAergic neurons in the central nucleus of the IC, dorsal and lateral cortices on the input side (Geis and Borst 2012; Ito et al. 2009; Ito and Oliver 2012; Peruzzi et al. 1997), that project to thalamocortical relay neurons mainly in the MGB ventral (MGBv) and dorsal (MGBd) subdivisions (Bartlett and Smith 1999; Lee and Sherman 2010; Peruzzi et al. 1997). These are the two largest subdivisions in MGB and are considered to be lemniscal and nonlemniscal, respectively (Anderson and Linden 2011; Bartlett and Wang 2011; Bordi and LeDoux 1994; Calford 1983; Calford and Aitkin 1983; Edeline et al. 1999; Morel et al. 1987).
A feedforward inhibitory connection such as the IC-MGB input is not present in the visual or somatosensory thalamic nuclei, and its function in the auditory system is unknown. The IC-MGB GABAergic input is difficult to isolate in vivo, due to the presence of GABAergic inputs from the auditory sector of the thalamic reticular nucleus (TRN) (Bartlett and Smith 1999; Bartlett et al. 2000; Montero 1983; Zhang et al. 2008). However, the two inhibitory connections are spatially separated in a brain slice preparation. The overall aim of this study was to characterize the IC-MGB inhibitory synapse during development, when sound-evoked responses throughout the auditory system are known to become sharper and improve in fidelity. The overall hypothesis of this study was that IC-MGB inhibitory response properties will undergo developmental changes rapidly around hearing onset. Specifically, we expected age-related increases in the amplitude of inhibition, fidelity to repetitive stimulation, and overall potency in inhibiting action potentials, especially shortly after hearing onset, at approximately postnatal day (P)12 in rats (Blatchley et al. 1987). To test the above hypotheses, the physiology of the IC-MGB inhibitory synapse was studied at different ages using whole cell patch-clamp techniques in current-clamp and voltage-clamp modes, recording from neurons in brain slices containing MGB.
METHODS
Subjects
All protocols were approved by the Purdue Animal Care and Use Committee (no. 06-105). Pregnant Long-Evans hooded rats (Harlan) were monitored to determine the date of birth (designated as P0). Experiments were performed at three age groups: P7–P9, P15–P17, and P22–P32. Since hearing onset in rats can occur anytime between P11 and P13, the P7–P9 and P15–P17 ages in this study were chosen to represent pre- and posthearing onset groups, respectively. Rats were weaned at P21 and housed in small groups of two to four animals.
Surgery
Rats were overdosed with Beuthanasia and confirmed to be fully areflexive to a foot pinch. The brain was removed in ice-cold oxygenated sucrose solution and sectioned using a Leica VT-1000S vibratome (Leica Microsystems). Horizontal sections were obtained at a thickness of 300–350 μm at P7–P9 and 400–450 μm at all other ages. Slices were transferred to oxygenated artificial cerebrospinal fluid (aCSF) at 35°C for 30–55 min and kept at room temperature thereafter (Moyer and Brown 1998). To improve slice health for the P22–P32 group, two additional measures were used: 1) a sucrose-saline solution (described below) was transcardially perfused through the left ventricle while the right auricle was cut (Aghajanian and Rasmussen 1989; Moyer and Brown 1998); and 2) in some experiments, 2 mM kyneurenic acid was added to the sucrose-saline solution to reduce glutamate-induced excitotoxicity (Li et al. 1999; Richardson et al. 2011).
Solutions
Concentrations of extracellular and intracellular solutions were adapted from Paul and Cox (2010). The intracellular solution consisted of (in mM) 120 K-gluconate, 4 KCl, 1 MgCl2, 0.07 CaCl2, 0.1 EGTA, 10 HEPES, 2 disodium ATP, and 0.4 sodium GTP with 0.03–0.05% Neurobiotin (pH of 7.2 and osmolarity of 290 mosM). Recording aCSF consisted of (in mM) 2.5 KCl, 1.25 MgCl2, 2 CaCl2, 1.25 NaHPO4, 26 NaHCO3, 10 glucose, and 126 NaCl. Sucrose saline solution differed from aCSF in the concentrations of MgCl2 (10 mM), CaCl2 (0.5 mM), and glucose (11 mM) and contained 234 mM sucrose instead of NaCl. The chemicals used were purchased from Sigma-Aldrich. The following drugs were used: glutamatergic blockers 6,7-dinitroquinoxaline-2,3-dione (DNQX; 25–50 μM, Sigma-Aldrich) and dl-2-amino-5-phosphonopentanoic acid (APV; 50 μM, Sigma-Aldrich and Santa Cruz Biotechnology), GABAA receptor antagonist picrotoxin (100 μM, Sigma-Aldrich), and GABAB receptor antagonist CGP-52432 (1 μM, Tocris Bioscience).
Recordings
Slices were transferred to a RC 27 LD chamber (Warner Instruments) continuously perfused with oxygenated aCSF and maintained at 35 ± 2°C using a feedback controlled inline heater (Warner Instruments). A bipolar stimulating electrode (concentric at ages P7–P9 and P15–P17; parallel at ages P22–P32) was placed in the brachium of the IC to stimulate afferent axons from the IC, either in single shocks or repetitively. Bipolar stimulation electrodes were coupled to a Grass stimulator and a stimulus isolation unit (Grass Instruments).
Recording glass electrodes (World Precision Instruments) were pulled to have a resistance within the range of 1.5–4 MΩ (P97, Sutter Instruments) and guided using a micromanipulator (Siskiyou) to MGB neurons visualized with differential interference contrast optics (Olympus BX51-WI). After a stable seal resistance >1 GΩ had been obtained, whole cell configuration was obtained through brief mouth suction.
Passive membrane properties were determined from a small hyperpolarizing current (−40 or −50 pA in amplitude and 200 or 250 ms in duration). Synaptic responses of the cell were first obtained in normal aCSF with single shocks (or repetitive shocks in a few cells). This was done to characterize the cell based on the presence of excitatory postsynaptic potentials (EPSPs) and/or inhibitory postsynaptic potentials (IPSPs). After initial characterization, the glutamatergic blockers APV and DNQX were added to record isolated IPSPs. In certain experiments, picrotoxin and/or CGP-52432 were added to block GABAA and GABAB receptors, respectively. In the voltage-clamp mode, only isolated GABAA currents were recorded with APV + DNQX + CGP-52432. Recordings were made 10 min after drug addition.
To visualize IPSPs clearly, recordings were made from a base membrane potential (before synaptic stimulation) of approximately −50 mV for all protocols, adjusted by small current injection. At P7–P9, Cl− reversal potentials were depolarized, resulting in reversal near −50 mV in two to three cells, for which base potentials were suitably adjusted. Recruitment of inhibitory fibers was evaluated with single shocks of 50–300 μs in duration. Stimulus duration was chosen for each cell such that antidromic spikes were avoided at higher stimulation amplitudes and was unchanged throughout the recording session. To study the recruitment of fibers at different stimulation strengths, single shocks were applied at stimulation amplitudes from 10 V to a maximum voltage that did not evoke antidromic spiking or to a maximum of 150 V, in steps of 10 V. Temporal properties were determined from IPSPs at least −3 mV in amplitude (2 mV in the case of depolarizing P7–P9 IPSPs). Responses to repetitive stimulation were recorded at three stimulation frequencies of 5, 10, and 50 Hz. Stimulation amplitude was adjusted to produce IPSPs at least 3 mV in amplitude when possible to clearly see effects of short-term plasticity. Reversal potential was determined by single shocks by polarizing the membrane around rest. The efficacy of inhibition was measured as the ability of a −5-mV IPSP to block action potentials generated by a 10-ms depolarizing current pulse delivered at various time windows relative to the IPSP (IPSP preceding the current pulse by 500, 200, 100, 50, 25, 10, 5, 3, and 1 ms; IPSP simultaneous with the current pulse, i.e., 0-ms delay). The amplitude of the depolarizing current pulse was set at 30 pA greater than the smallest current amplitude required to reliably generate action potentials across trials. Voltage-clamp protocols were similar to current-clamp protocols, and the clamp potential in voltage-clamp mode was maintained at −50 mV at P15–P17 and P22–P32. At P7–P9, all cells obtained in voltage-clamp mode reversed near −50 mV (range: −43 to −56 mV), and hence the clamp potential was chosen as −70 mV at this age. Maximal inhibitory postsynaptic currents (IPSCs) differed considerably between age groups, and hence IPSC repetitive responses and temporal properties were determined at a stimulation voltage of 70 V (90 V for one P22–P32 cell) at all ages. The stimulation amplitude of 70 V was typically at (threshold + 40/50) V for most cells (10 of 12 cells across all ages).
Data Analysis
Whole cell recordings were made with a Multi Clamp 700B amplifier (Molecular Devices), filtered at 10 kHz, and digitized at 25 kHz. Voltage-clamp traces were further filtered at 2 kHz offline. Series resistance was monitored via the bridge balance in current-clamp mode using pClamp 10 software (Molecular Devices), and the recording was ceased when values increased above 20 MΩ. In voltage-clamp mode, pipette and cell capacitances were compensated, and 60–70% series resistance compensation was typically performed.
Cells were chosen for analysis if the following criteria were satisfied: 1) a minimum seal resistance of 1 GΩ, 2) series resistance at all times was <20 MΩ, 3) cells were capable of generating action potentials overshooting 0 mV, and 4) resting membrane potential (Vrest) for P22–P32 cells was more hyperpolarized than −50 mV.
IPSPs (and IPSCs) recorded at increasing stimulation amplitudes consisted of five trials that were averaged at each stimulation voltage. Averaged IPSPs were considered to be nonfailures if 1) the IPSP amplitude was greater than three times the SD of the membrane potential before stimulation and 2) the time of peak IPSP amplitude occurred between 2 and 40 ms poststimulation. Averaged IPSCs were considered to be nonfailures if 1) the IPSC amplitude was greater than three times the SD of the membrane current before stimulation and 2) the time of IPSC peak amplitude occurred between +5 and − 5 ms of the time of peak at 70-V stimulation.
IPSP/IPSC temporal properties were determined from single shock data. IPSP latencies were measured from the onset of the stimulus artifact to where the PSP consistently changed the membrane potential (Bartlett and Smith 1999). Rise times were calculated as the 10–90% rise time of IPSPs. Decay times were calculated by a single-exponential fit from the peak to the offset of the IPSP after normalization to a peak amplitude of −1 mV. The fit was a good indicator of the presence of postsynaptic GABAB. In the absence of GABAB, a single exponential was sufficient to fit the decay phase. GABAA IPSC latency, rise, and decay times were similarly measured.
Responses to repetitive stimulation were measured from an average of three trials at each frequency, where the intertrial interval was typically 5 s. Paired-pulse (PP) ratios were measured using two different baseline measurements, referred to as the “individual baseline” and “common baseline” methods. In the individual baseline method, the peak amplitude of each IPSP in a train was calculated relative to the membrane potential 2 ms before the respective stimulus artifact. The PP ratio of the nth IPSP in the train was calculated as (amplitude of IPSPn)/(amplitude of IPSP1). In the common baseline method, the peak amplitude of each IPSP in a train was calculated relative to Vrest before the first stimulus artifact. The PP ratio of the nth IPSP in the train was calculated as (amplitude of IPSPn)/(amplitude of IPSP1). The train recovery time was measured for 50-Hz trains as the total time required for the membrane potential to return to within 0.5 mV of Vrest. PP ratios of IPSC trains were measured similarly.
The efficacy of inhibition was determined in current-clamp mode, when IPSPs occurred relative to action potentials generated through depolarizing current injection. Three trials were recorded at each time window between the IPSP and the depolarizing current pulse, and the number of spiking failures was counted in each trial. The time window of 100% blockade was measured as the highest time window at which the IPSP blocked spiking across all three trials. The percentage of spikes blocked by inhibition was measured as the total number of spiking failures for windows between 0 and 50 ms divided by the total number of trials between 0 and 50 ms. Statistical comparisons were performed between each pair of age groups (P7–P9 vs. P15–P17, P7–P9 vs. P22–P32, and P15–P17 vs. P22–P32) using the Wilcoxon rank-sum test, and P < 0.05 was the minimum criterion for statistical significance. The Wilcoxon signed-rank test was used to compare data pairs in dual drug recordings. The Holm-Bonferroni stepwise correction for multiple comparisons was performed to determine significance [i.e., P/(correction factor)], and P values stated in the text are original P values.
Data Presentation
All results are expressed as means ± SE. In the subsequent text, combined GABAA + GABAB IPSPs recorded in the presence of aCSF + APV + DNQX are denoted as IPSPs. Isolated GABAA IPSPs recorded with aCSF + APV + DNQX + CGP-52432 are denoted as GABAA IPSPs. In voltage-clamp mode, isolated GABAA IPSCs were recorded (with aCSF + APV + DNQX + CGP-52432) and are denoted as GABAA IPSCs. In the text, figures, and tables, P8, P16, and P27 are used to denote the age groups P7–P9, P15–P17, and P22–P32, respectively.
Histology and Recording Locations
Typically, one cell was recorded per slice, and the slice was stored in 4% paraformaldehyde immediately after being recorded. Processing for histology was adapted from a protocol provided by Dr. Anne Takesian and Dr. Vibhakar C. Kotak (Takesian et al. 2010). Briefly, slices were washed in 0.12 M PBS, blocked with 1% hydrogen peroxide, and incubated overnight in ABC solution (Vectastain elite kit, Vector Labs) in 0.12 M PBS with 3% Triton X-100. Slices were thoroughly washed the following day, treated with diaminobenzidine, washed overnight, and then mounted on plastic slides with glycerol and PBS at a 1:1 ratio.
MGB subdivision information was identified when possible. Eighteen MGBv and eight MGBd neurons were confirmed across ages based on matching the recorded slice with that of the rat atlas of Paxinos and Watson (2006), so the two largest MGB subdivisions were represented in the recordings. At younger ages, dye spreading often obscured filled neurons. In addition to neurobiotin, the position of the recording electrode was also used to identify the recorded region of the MGB. The majority of recordings at all ages occurred in the caudolateral region closest to thickest profusion of IC axons and hence most likely to maintain the IC-MGB synaptic connection.
RESULTS
Passive Membrane Properties
Clear trends emerged in the development of passive membrane properties of MGB neurons (statistics are shown in Table 1). Vrest was most depolarized and membrane resistance (Rin) was highest at P8. Vrest hyperpolarized (Fig. 1A) and Rin decreased (Fig. 1B) between P8 and P16 and then again between P16 and P27. Paired comparisons between the three age groups revealed highly significant differences, indicating that each age group represented a distinct developmental time point with respect to Vrest and Rin.
Table 1.
Development of passive properties
| Property | P8 | P16 | P27 |
|---|---|---|---|
| Resting membrane potential, mV | −34.8 ± 1.8*† (n = 27) | −51.8 ± 0.9‡ (n = 25) | −61.2 ± 0.9 (n = 39) |
| Input resistance, MΩ | 642.2 ± 32.7*† (n = 27) | 350.2 ± 15.2‡ (n = 25) | 249.2 ± 17.3 (n = 39) |
| Membrane time constant, ms | 49.3 ± 2.7† (n = 24) | 56 ± 2.1‡ (n = 26) | 33 ± 1.6 (n = 39) |
Values are shown as means ± SE; n, number of cells.
P < 0.001, postnatal day (P)8 vs. P16;
P < 0.001, P8 vs. P27;
P < 0.001, P16 vs. P27.
Fig. 1.
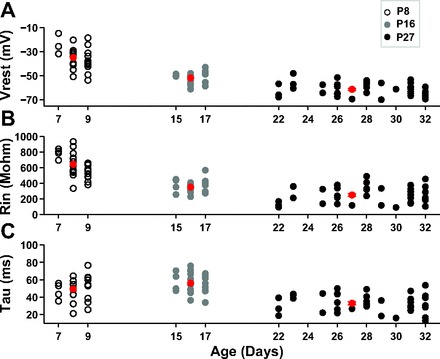
Development of membrane properties. A: resting membrane potential (Vrest; in mV) as a function of age. In A–C, the open circles show postnatal day (P)7–P9 neurons, gray circles show P15–P17 neurons, and filled circles show P22–32 neurons. Red symbols in A–C are means for each age group. B: input resistance (Rin; in MΩ) as a function of age. C: membrane time constant (τ; in ms) as a function of age.
The trend for the membrane time constant (τ) was different from those of Vrest and Rin, because τ of P8 and P16 neurons did not significantly differ. However, τ values at both these ages were significantly higher than those of P27 neurons (Fig. 1C). Thus, the membrane was slower to respond to changes in currents in both younger age groups compared with P27 neurons, which influences temporal processing.
The above findings have two main implications in our experimental design:
Implication 1.
Postsynaptic currents may be differentially shaped by the membrane at different ages. For instance, a low-amplitude postsynaptic current at P8 in conjunction with the high Rin at this age could still result in a large-amplitude postsynaptic potential that could significantly alter a cell's spiking response or ability to spike. Moreover, a rapidly changing postsynaptic current at P8 could be significantly slowed by τ, resulting in a slower postsynaptic potential, which, in turn, could affect responses to repetitive stimulation. To address this issue, we recorded both IPSPs in current-clamp mode and IPSCs in voltage-clamp mode.
Implication 2.
Vrest dramatically differed with age (Fig. 1A), whereas the Nernst potential for Cl− was fixed at −82 mV with the solutions that were used and the recording temperature of ∼35°C. The reversal potential for GABA (EGABA) was experimentally measured at each age group and is discussed below. All cells were maintained at a base membrane potential of approximately −50 mV while IPSPs and IPSCs were recorded, and the mean base membrane potential was confirmed to be −51.96 ± 0.23 mV before single shocks (n = 46 across ages) and −51.90 ± 0.25 mV before repetitive shocks (n = 39 across ages). A base membrane potential of approximately −50 mV was chosen so that the driving force for Cl− would be roughly similar at all ages and additionally to ensure that the Cl− driving force was high enough to clearly observe IPSPs. Passive membrane properties were also measured from a base membrane potential of −50 mV and showed identical statistical trends during development, as assessed by the Vrest measurements (data not shown). All correlations with IPSP parameters in subsequent sections were made with respect to passive properties measured at −50 mV.
Cell Types/Synaptic Responses
IC axons were stimulated with single shocks, and postsynaptic potentials were recorded in normal aCSF from a base membrane potential near −50 mV (adjusted by current injection as needed). Similar to an earlier study in P21–P42 MGB neurons (Bartlett and Smith 1999), MGB cells were classified based on the presence and latencies of EPSPs and IPSPs, respectively. Purely excitatory (EX/0) cells were rarely encountered in this study. A purely inhibitory (IN/0) response with only an IPSP (Fig. 2A) was observed only in P16 and P27 neurons and not in P8 neurons. Mixed cells with both EPSPs and IPSPs were present at all ages. Mixed cells were classified as IN/EX cells if the IPSP preceded the EPSP (Fig. 2B) and as EX/IN cells in the opposite case (Fig. 2C). At all ages, the EPSP was glutamatergic and eliminated by the addition of APV and DNQX. Figure 2, A–D, bottom, shows the responses of the same cells after excitation was blocked. A variation of the mixed responses was observed in the P8 age group (and in one P15 cell), where the postsynaptic potential consisted of a large depolarizing component that could drive one or multiple action potentials, even at low stimulation amplitudes. An inhibitory component was not readily perceptible in this response type in normal aCSF from a base membrane potential of −50 mV (Fig. 2D). This response type was not EX/0 because blockade of glutamatergic receptors with APV and DNQX revealed an underlying IPSP in all cells tested (n = 21 of 21 cells). Hence, this response type, which consisted of a dominant excitatory component, was termed as EXDOM. Spiking patterns of EXDOM cells were sensitive to Vrest, and single shocks produced two or more well-defined spikes near −60 mV (3 of 4 cells), whereas base membrane potentials near −65 mV prevented spiking (6 of 6 cells). In P8 neurons, even large hyperpolarizing IPSPs were masked and dominated by EPSPs. Figure 2, E–G, shows the proportions of each cell type at the three age groups. Mixed cells predominated at P27 (n = 22; Fig. 2E) and P16 (n = 23; Fig. 2F), whereas IN/0 cells constituted the remainder. At P8 (n = 21; Fig. 2G), 52% were mixed cells and 48% were EXDOM cells.
Fig. 2.

Cell types based on synaptic responses to stimulation of inferior colliculus (IC) axons. Current-clamp responses to single synaptic stimuli are shown. The top traces in A–D show cells in standard artificial cerebrospinal fluid (aCSF). The bottom traces in A–D show the same cells when ionotropic glutamate receptors were blocked with dl-2-amino-5-phosphonopentanoic acid (APV) + 6,7-dinitroquinoxaline-2,3-dione (DNQX). A: a P29 cell with a purely inhibitory response type (IN/0 cell). B: a P16 mixed type cell where the inhibitory postsynaptic potential (IPSP) preceded the excitatory postsynaptic potential (EPSP) (IN/EX cell). C: a P17 mixed type cell where the EPSP preceded the IPSP (EX/IN cell). D: a P9 cell with a dominant excitatory component (EXDOM cell). E–G: proportions of cell types at P27 (E), P16 (F), and P8 (G).
IPSPs at all ages were found to be GABAergic. All cells contained a short-latency picrotoxin-sensitive GABAA component (confirmed in 11 of 11 cells across ages). Most cells (15 of 16 cells at P8, 19 of 19 cells at P16, and 20 of 21 cells at P27) also demonstrated a longer-latency hyperpolarizing component, which occurred in the decay phase of the initial GABAA component (see Fig. 2D, bottom). This component was sensitive to the GABAB blocker CGP-52432, as confirmed in 10 of 10 cells across ages. The addition of APV, DNQX, picrotoxin, and CGP-52432 eliminated all postsynaptic potentials to single shocks (n = 3 of 3 cells).
Properties of IC-MGB Inhibition: Reversal and Amplitude
The reversal potential of the peak IPSP amplitude was calculated at all ages. IPSP reversal potential was significantly more depolarized at P8 (−57.9 ± 3.3 mV, n = 14) compared with P16 (−74.4 ± 2.1 mV, n = 15, P = 0.0004) and P27 (−75.2 ± 3.2 mV, n = 13, P = 0.0009). Further analysis of reversal potentials at P8 showed that EXDOM cells at P8 exhibited more depolarized values (−52.2 ± 5.5 mV, n = 6) compared with mixed cells (−64.1 ± 3.7 mV, n = 7), although this difference did not reach statistical significance (P = 0.07). Consequently, IPSP polarity from a base membrane potential near −50 mV in P8 EXDOM cells was variable, and depolarizing IPSPs were sometimes encountered at P8 (4 of 10 cells). The depolarizing IPSPs at P8 were still inhibitory in that they were unable to drive spiking on their own (in the presence of APV and DNQX), even at stimulation amplitudes equal or higher than those evoking multiple spiking response in the absence of drugs (n = 4 of 4 cells). This shows that the IPSP reversal potential was below spiking threshold (shunting inhibition).
Only P8 cells that had a clearly hyperpolarizing IPSP from a base membrane potential of −50 mV were included in the analysis for IPSP amplitude (9 of 13 cells) to enable comparisons with the older ages. Increasing stimulation amplitude resulted in gradual increased IPSP amplitudes, denoting the recruitment of fibers at all ages (Fig. 3A). Peak IPSP amplitudes were compared between ages at threshold stimulation and at various suprathreshold levels. Peak IPSP amplitude at threshold or suprathreshold stimulation voltages [calculated at (threshold + 40) V, (threshold + 50) V, and (threshold + 60) V] were not different between any age groups (Table 2). This result indicates that the masking of IPSPs by EPSPs observed only at P8 was not necessarily due to low IPSP amplitudes at this age. Given this finding and the higher Rin values of P8 neurons, synaptic currents were estimated from IPSPs at (threshold + 40) V using cell-specific reversal potential and Rin values. Inhibitory currents estimated in this manner were lower at P8 compared with both older age groups (n = 7, 10, and 6 cells for P8, P16, and P27 respectively) and were significantly so between P8 and P16 (P = 0.01). This trend was also reflected in GABAA IPSCs from voltage-clamp measurements (Fig. 3B and Table 2). Figure 3B also shows the increase in IPSC amplitude with increasing stimulus strength. Overall, these results indicate that IPSC amplitude is lower at P8 but that IPSP amplitudes do not differ with age.
Fig. 3.
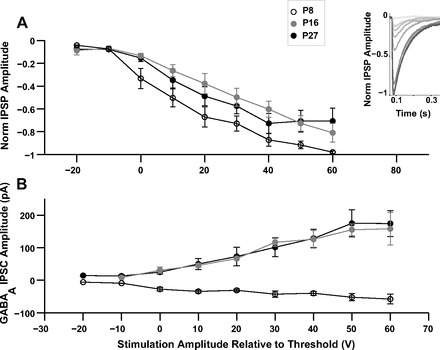
Amplitude of IC-medial geniculate body (MGB) inhibition. A: mean normalized IPSP amplitude at increasing stimulation amplitudes at P8 (open circles), P16 (gray circles), and P27 (filled circles). 0 V on the x-axis represents the threshold stimulation voltage. The inset shows normalized IPSPs at increasing stimulation amplitudes for a P8 cell where the peak IPSP amplitude was −13.6 mV. B: mean GABAA inhibitory postsynaptic current (IPSC) amplitude at P8 (open circles), P16 (gray circles), and P27 (filled circles) at increasing stimulation amplitudes. Clamp potential was −70 mV for cells at P8 and −50 mV for cells at P27 and P16.
Table 2.
Development of IPSP and IPSC amplitudes
| Property | Stimulation Amplitude, V | P8 | P16 | P27 |
|---|---|---|---|---|
| Threshold IPSP amplitude, mV | Threshold | −1.8 ± 0.4 (n = 9) | −0.8 ± 0.1 (n = 11) | −1.1 ± 0.3 (n = 12) |
| Suprathreshold IPSP amplitude, mV | Threshold + 40 | −5.7 ± 1.2 (n = 9) | −4.3 ± 0.8 (n = 11) | −4.8 ± 0.6 (n = 10) |
| Threshold GABAA IPSC amplitude, pA | Threshold | −27.3 ± 5.9 (n = 4) | 30.8 ± 10 (n = 4) | 25 ± 5.8 (n = 4) |
| Suprathreshold GABAA IPSC amplitude, pA | Threshold + 40 | −39.8 ± 6.4 (n = 4) | 125.9 ± 26.9 (n = 3) | 128.4 ± 28.1 (n = 4) |
Values are shown as means ± SE; n, number of cells.
IPSP, inhibitory postsynaptic potential; IPSC, inhibitory postsynaptic current.
Temporal Properties of IC-MGB Inhibition
The temporal properties of IPSPs and IPSCs evoked by single shocks were analyzed. Voltage-clamp recordings were made in four neurons at each age and are shown as scatterplots that show all cells recorded, mainly to assist interpreting how synaptic currents interact with membrane properties to produce the observed IPSPs. Figure 4, A–C, shows one neuron from each age group from which both voltage-clamp and current-clamp recordings were made where GABAA IPSPs and IPSCs were evoked at the same stimulation parameters for each neuron. Clamp potential was −70 mV at P8 and −50 mV at P16 and P27 (see methods). Table 3 shows the temporal properties for the various recording conditions.
Fig. 4.
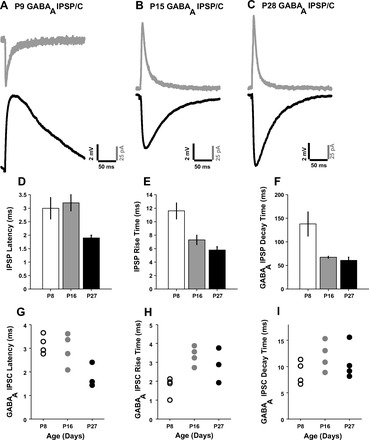
Temporal properties of IC-MGB inhibition to single shocks. GABAB and ionotropic glutamate receptors were blocked to isolate GABAA components. A: P9 neuron GABAA IPSC (gray trace, Vclamp = −70 mV) and GABAA IPSP [black trace, membrane potential (Vmem) = −72.4 mV]. B: P15 neuron GABAA IPSC (gray trace, Vclamp = −50 mV) and GABAA IPSP (black trace). C: P28 neuron GABAA IPSC (gray trace, Vclamp = −50 mV) and GABAA IPSP (black trace). In D–F, open bars indicate P8, gray bars indicate P16, and filled bars indicate P27. Error bars are SEs. D: mean IPSP latency at the ages shown. E: mean IPSP rise time. F: mean GABAA IPSP decay time. In G–I, each symbol represents a measurement from an individual neuron. G: GABAA IPSC latency. H: GABAA IPSC rise time. I: GABAA IPSC decay time.
Table 3.
Development of IPSP and IPSC amplitudes
| P8 | P16 | P27 | |
|---|---|---|---|
| Latency | |||
| Combined IPSP latency, ms | 3.0 ± 0.4b (n = 11) | 3.2 ± 0.3e (n = 17) | 1.9 ± 0.1 (n = 16) |
| GABAA IPSP latency, ms | 2.9 ± 0.7 (n = 4) | 3.3 ± 0.6 (n = 6) | 2.0 ± 0.2 (n = 6) |
| Latency of GABAA IPSC, ms | 3.2 ± 0.2 (n = 4) | 3.0 ± 0.3 (n = 4) | 2.2 ± 0.4 (n = 4) |
| Rise time | |||
| Combined IPSP rise time, ms | 11.6 ± 1.2a,d (n = 11) | 7.3 ± 0.7 (n = 17) | 5.8 ± 0.5 (n = 16) |
| GABAA IPSP rise time, ms | 14.5 ± 2.8c (n = 4) | 9.2 ± 1.8 (n = 6) | 7.1 ± 0.6 (n = 6) |
| GABAA IPSC rise time, ms | 1.7 ± 0.3 (n = 4) | 3.4 ± 0.2 (n = 4) | 2.9 ± 0.5 (n = 3) |
| Decay time | |||
| Decay time of GABAA IPSP from all cells, ms | 138.0 ± 25.7a,b (n = 4) | 67.6 ± 2 (n = 6) | 61.1 ± 6.4 (n = 6) |
| Decay time of GABAA IPSC, ms | 8.9 ± 1.1 (n = 4) | 12 ± 1.4 (n = 4) | 10.8 ± 1.7 (n = 4) |
Values are shown as means ± SE; n, number of cells.
P < 0.01, P8 vs. P16;
P < 0.05,
P < 0.01, and
P < 0.001, P8 vs. P27;
P < 0.01, P16 vs. P27.
Latency.
IPSP latencies remained long until P17 and decreased thereafter (Fig. 4D). IPSP latencies were similar for P8 neurons (3.0 ± 0.4 ms, n = 11) and P16 neurons (3.2 ± 0.3 ms, n = 17). At both these ages, latencies were significantly longer than those of P27 neurons (1.9 ± 0.1 ms, n = 16, P = 0.0203 between P8 and P27 and P = 0.001 between P16 and P27). Voltage-clamp recordings of isolated GABAA currents in four cells at each age showed similar trends as found in current-clamp recordings (Fig. 4G).
Rise time.
IPSP rise time decreased between P9 and P15 and did not significantly change after that (Fig. 4E). The IPSP rise time of P8 neurons was 11.6 ± 1.2 ms (n = 11), which was significantly higher than values of P16 neurons (7.3 ± 0.7 ms, n = 17) and P27 neurons (5.8 ± 0.5 ms, n = 16, P = 0.003 between P8 and P16 and P = 0.0003 between P8 and P27). Voltage-clamp recordings of isolated GABAA currents in four cells did not show the same trends as observed in current-clamp recordings and instead showed a slight peaking at P16 (Fig. 4H). These differences may reflect, in part, the age-related changes in τ. The correlation coefficient between τ and IPSP rise time was significant (R = 0.50, P < 0.001). IPSP rise time and amplitude were also correlated (R = 0.57, P < 0.001).
Decay time.
The decay phase of the IPSP consisted of both GABAA and (postsynaptic) GABAB and varied greatly between cells depending on the extent of activation of GABAB during the decay phase of GABAA. Hence, decay time was calculated after blockade of GABAB with CGP-52432, and the decay phase of the isolated GABAA IPSP was fitted with an exponential fit. Single exponentials fit the decay phase with R2 > 0.97 at all ages. GABAA IPSP decay time decreased after P9 and stabilized by P15 (Fig. 4F). The GABAA IPSP decay time decreased from 138.0 ± 25.7 ms at P8 (n = 4) to 67.6 ± 2.0 ms at P16 (n = 6) and remained stable at P27 (61.1 ± 6.4 ms, n = 6, P = 0.0095 between P8 and P16 and P = 0.019 between P8 and P27). GABAA IPSP rise and decay times were strongly correlated (R = 0.79, P = 0.0003). Voltage-clamp recordings did not reveal a similar clear development trend, with decay times that were similar at all ages and peaking slightly at P16 (Fig. 4I). Thus, the differences in GABAA IPSP decay time may reflect, in part, the age-related changes in τ. The correlation coefficient between τ and GABAA IPSP decay time was significant (R = 0.55, P = 0.0273). Overall, these results show that IPSPs become faster with age in all properties, whereas GABAA IPSC latency reduces with age.
Temporal Properties of IC-MGB Inhibition: Repetitive Stimulation
The development of responses to repetitive shocks was examined at three stimulation frequencies of 5, 10, and 50 Hz. These frequencies correspond to those of thalamocortical oscillations (Steriade et al. 1993) and to frequencies that can demonstrate differences in short-term plasticity. Figure 5 shows examples of repetitive responses under different recording conditions. Figure 5, A–C, shows IPSP trains at 10 Hz at the three age groups. Figure 5, D–F, shows three pairs of isolated GABAA IPSPs/IPSCs at 10 Hz at the three age groups. Each pair shown in Fig. 5 consists of current-clamp and voltage-clamp recordings from the same cell at the same stimulation parameters. Two types of PP measurements were performed on repetitive responses, as detailed in methods and as performed in an earlier study (Bartlett and Smith 2002). In the text below, stimulation number refers to the position of the IPSP in a train of 10 pulses.
Fig. 5.
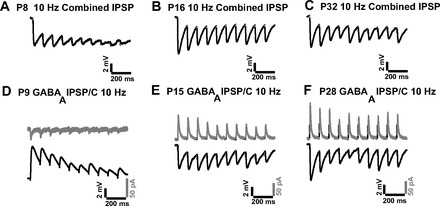
Examples of inhibitory responses to repetitive shocks of IC axons. A–C: IPSP trains (recorded with aCSF + APV + DNQX) at P8 (A), P16 (B), and P32 (C). D–F: GABAB and ionotropic glutamate receptors were blocked to isolate GABAA components. Three pairs of GABAA IPSC trains (top traces) and GABAA IPSP trains (bottom traces) recorded at P9 (D; Vmem = −71.9 mV and Vclamp = −70 mV), P15 (E; Vclamp = −50 mV), and P28 (F; Vclamp = −50 mV). The same stimulation parameters were used for each pair in current-clamp and voltage-clamp modes.
PP ratios using the individual baseline method.
In the first type of measurement, referred to as the individual baseline method, IPSP (IPSC) amplitudes were measured from a baseline membrane potential (current in voltage clamp) that immediately preceded the stimulus artifact for that IPSP (IPSC) (see Fig. 6A). PP ratios calculated using the individual baseline method are a typical measure of synaptic short-term plasticity and showed clear developmental trends, which are shown in Table 4. Even at a low stimulation frequency of 5 Hz, IPSPs of P8 neurons depressed rapidly, as shown in Fig. 6B. PP ratios for all IPSPs in the train (relative to IPSP1) at P8 were significantly lower than those of P16 (P < 0.001). PP ratios at P8 were comparable with those of P27 for the first 3 pulses but were significantly lower than those of P27 from the 4th through 10th IPSP in the train (P < 0.01). One surprising result at 5 Hz was that P16 neurons showed significantly lesser depression than P27 neurons at several IPSPs in the train.
Fig. 6.

Paired-pulse (PP) ratios computed using the individual baseline method. A: illustration of the PP ratio measurement with respect to an individual baseline for each IPSP, determined from the prestimulation artifact for that particular IPSP. In B–J, the open circles show mean P8 ratios, gray circles show mean P16 ratios, and filled circles show mean P27 ratios. B–D: mean PP ratios for combined IPSPs at 5 Hz (B), 10 Hz (C) and 50 Hz (D). n = 10, 15, and 12 cells for P8, P16, and P27, respectively. n values after PP2 were slightly lower at 5 and 10 Hz. PP ratios were lower at P8 at 5 and 10Hz, and PP ratios were lower at all ages at 50 Hz. E–G: mean PP ratios for GABAA IPSPs at 5 Hz (E), 10 Hz (F), and 50 Hz (G). n = 6, 8, and 6 cells for P8, P16, and P27, respectively. H–J: mean PP ratios for GABAA IPSCs at 5 Hz (H), 10 Hz (I), and 50 Hz (J). n = 4, 4, and 3 cells for P8, P16, and P27, respectively.
Table 4.
Development of inhibitory paired-pulse ratios
| P8 | P16 | P27 | |
|---|---|---|---|
| Stimulation frequency of 5 Hz | |||
| IPSP2/IPSP1 | 0.53 ± 0.06b | 0.78 ± 0.03f | 0.66 ± 0.03 |
| IPSP5/IPSP1 | 0.31 ± 0.04b,d | 0.68 ± 0.05e | 0.53 ± 0.05 |
| IPSP10/IPSP1 | 0.23 ± 0.03b,d | 0.63 ± 0.04e | 0.49 ± 0.04 |
| Stimulation frequency of 10 Hz | |||
| IPSP2/IPSP1 | 0.52 ± 0.05c | 0.60 ± 0.02 | 0.64 ± 0.03 |
| IPSP5/IPSP1 | 0.34 ± 0.05 | 0.45 ± 0.02 | 0.45 ± 0.05 |
| IPSP10/IPSP1 | 0.23 ± 0.04a,c | 0.41 ± 0.03 | 0.38 ± 0.03 |
| Stimulation frequency of 50 Hz | |||
| IPSP2/IPSP1 | 0.33 ± 0.07 | 0.4 ± 0.06 | 0.32 ± 0.04 |
| IPSP5/IPSP1 | 0.06 ± 0.03 | 0.09 ± 0.04 | 0.13 ± 0.03 |
| IPSP10/IPSP1 | 0.07 ± 0.03 | 0.09 ± 0.04 | 0.11 ± 0.03 |
Values are shown as means ± SE; n, number of cells.
P < 0.01 and
P < 0.001, P8 vs. P16;
P < 0.05 and
P < 0.01, P8 vs. P27;
P < 0.05 and
P < 0.01, P16 vs. P27.
At a stimulation frequency of 10 Hz, P8 MGB neurons were again significantly more depressed than P16 and P27 MGB neurons for most IPSPs in the train (P < 0.05; Fig. 6C). At 10 Hz, the ratios between P16 and P27 neurons were quite similar.
At 50 Hz, rapid depression was observed at all ages. PP ratios were slightly higher (i.e., depression was lower) at P27 than other ages (Fig. 6D), but significant differences were generally not observed.
When repetitive stimulation was performed after blockade of GABAB, the developmental trends in GABAA IPSP PP ratios from an individual baseline were similar to those observed with the IPSP PP ratios described above (compare Fig. 6, E–G with B–D). In voltage-clamp mode, GABAA IPSC PP ratios (Fig. 6, H–J) at 5 and 50 Hz showed similar trends as observed in current-clamp mode (n = 4, 4, and 3 for P8, P16, and P27, respectively). At 10 Hz, trends were not clear due to greater variability at the youngest age (Fig. 6I). Additionally, IPSC2/IPSC1 at 10 Hz showed facilitation or was close to 1 at P8 alone. Overall, P8 neurons showed greater depression to repetitive stimulation at 5 and 10 Hz, while all ages showed depression at 50 Hz.
PP ratios using the common baseline method.
In the second type of PP ratio measurement, which we refer to as the common baseline method, a common baseline [determined from the membrane potential (current) preceding the first IPSP (IPSC)] was used to measure IPSP (IPSC) amplitudes in a train (see Fig. 7A). Inhibitory PP ratios calculated using the common baseline method provide a measure of the net membrane hyperpolarization resulting from summation during a train. Common baseline PP ratios did not reveal developmental trends, and hence data were pooled across ages. Overall, there appeared to be two populations of responses from this analysis depending on the extent of hyperpolarization observed at the end of the train, which can be obtained from the IPSP10-to-IPSP1 ratio. A histogram of common baseline IPSP10-to-IPSP1 ratios (Fig. 8A, pooled across ages) showed a wide range of values. In contrast, individual baseline IPSP10-to-IPSP1 ratios (Fig. 8B) generally clustered around 0.5.
Fig. 7.
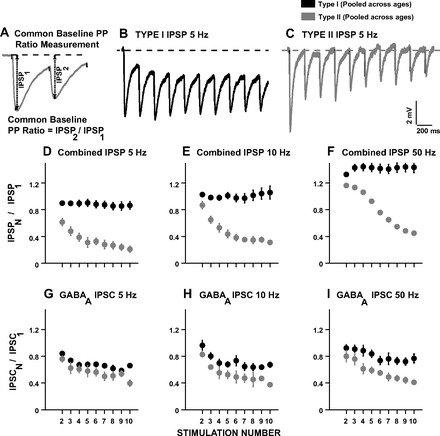
Type I and type II PP ratios computed using the common baseline method (data were pooled across ages for D–I). A: illustration of the PP ratio measurement with respect to a common baseline determined from the pretrain membrane potential in current-clamp mode. B: type I IPSP response in a P26 neuron at 5 Hz. C: type II IPSP response in a P25 neuron at 5 Hz. The dotted lines in B and C show the common baseline used for PP ratio calculation. D: mean pp ratios of combined IPSPs at 5 Hz for type I responses (filled circles, n = 24 cells across ages) and type II responses (gray circles, n = 7 cells across ages). Note that the average PP ratio for type I responses remained around 1, whereas type II neurons showed reduced PP ratios across the train. E: mean PP ratios of combined IPSPs at 10 Hz for type I responses (filled circles, n = 22 cells across ages) and type II responses (gray circles, n = 8 cells across ages). F: mean PP ratios of combined IPSPs at 50 Hz for type I responses (filled circles, n = 30 cells across ages). Only one type II response (gray circles) was observed at 50 Hz. G: mean PP ratios of GABAA IPSCs at 5 Hz for type I responses (filled circles, n = 6 cells) and type II responses (gray circles, n = 5 cells). H: mean PP ratios of GABAA IPSCs at 10 Hz for type I responses (filled circles, n = 9 cells) and type II responses (gray circles, n = 2 cells). I: mean PP ratios of GABAA IPSCs at 50 Hz for type I responses (filled circles, n = 8 cells) and type II responses (gray circles, n = 3 cells).
Fig. 8.

Histograms of PP ratios at the end of a stimulus train using the common baseline and individual baseline methods. A: histogram of cells (pooled across ages) based on IPSP10-to-IPSP1 (IPSP10/IPSP1) ratios measured using the common baseline method. An IPSP10/IPSP1 ratio of 0.5 was used to differentiate a type I response (IPSP10/IPSP1 ≥ 0.5) and a type II response (IPSP10/IPSP1 < 0.5). B: histogram of cells (pooled across ages) based on IPSP10/IPSP1 ratios measured using the individual baseline method.
In the majority of responses (called type I), the common baseline IPSP10-to-IPSP1 ratio was >0.5 because IPSPs summated, resulting in a hyperpolarization lasting until the last pulse in the train. Figure 7B shows a type I response at P26 at 5-Hz stimulation, where membrane hyperpolarization at the 10th pulse measured from a common baseline (dotted line) was similar to that at the beginning of the train, although the amplitude of IPSP10 measured from an individual baseline was clearly smaller. In type II responses, membrane hyperpolarization was reduced in the latter part of the train, and IPSP10-to-IPSP1 ratios were <0.5. Figure 7C shows a type II response at P25 at 5-Hz stimulation, where the membrane potential returned near the prestimulus baseline by the end of the IPSP train. Figure 7, D–F, shows mean IPSP PP ratios calculated from a common baseline at 5, 10, and 50 Hz, respectively. The filled circles show type I PP ratios that remained steady across the train, and the gray circles show the contrasting type II PP ratios that depressed across the train. Similarly, Fig. 7, G–I, shows mean GABAA IPSC PP ratios of type I responses (filled circles) and type II responses (gray circles) in voltage-clamp mode.
Based on IPSP10-to-IPSP1 values, type I responses were the dominant response type observed (5 Hz: 5 of 9 cells at P8, 10 of 11 cells at P16, and 9 of 11 cells at P27; 10 Hz: 5 of 9 cells at P8, 9 of 10 cells at P16, and 8 of 11 cells at P27). A developmental trend was observed with our sample at 5 and 10 Hz, with similar numbers of type I and type II responses only at P8, in contrast to the older ages, where type I numbers were much greater, although differences were not significant. At 50 Hz, only one cell at P16 (gray circles in Fig. 7F) showed a type II IPSP response, and the remainder (n = 30 across ages) were type I responses, indicating the greater summation of synaptic potentials at increasing stimulation frequencies.
Modulation of GABAA by GABAB
Dual drug changes were made in a subset of cells to determine the effect of GABAB blockade on IPSP properties. Responses were first obtained with aCSF + APV + DNQX and then with aCSF + APV + DNQX + CGP-52432 to block GABAB receptors, using the same stimulation parameters. Results were similar across ages, and hence data were pooled. GABAB can modulate GABAA inhibitory responses via presynaptic receptors through presynaptic Ca2+ regulation (Takahashi et al. 1998). GABAB can also modulate inhibitory responses via postsynaptic receptors, which are visible in the cell's synaptic response as a long-lasting postsynaptic GABAB IPSP. CGP-52432 added to aCSF can block both pre- and postsynaptic GABAB receptors. However, the two GABAB receptor mechanisms may be roughly differentiated based on the latency of activation of the postsynaptic GABAB response. Single shocks activated the postsynaptic GABAB IPSP with a latency of ∼50 ms (data recorded with aCSF + APV + DNQX + picrotoxin; data not shown). Hence, modulation of the GABAA IPSP peak amplitude that occurs before 50 ms may be attributed to presynaptic GABAB, whereas blockade of late hyperpolarization may be attributed to postsynaptic GABAB.
Modulation of IPSP amplitude by GABAB.
Blockade of GABAB significantly increased the peak GABAA IPSP amplitude compared with the IPSP amplitude observed without CGP-52432 (P = 0.04, n = 10 pooled across ages and at a stimulation amplitude of 40–50 V above threshold). The ratio of peak GABAA IPSP amplitude (with CGP-52432) to peak IPSP amplitude (without CGP-52432) was 1.5 ± 0.2. Figure 9A, left, shows IPSPs evoked at (threshold + 90) V stimulation from a P28 neuron. The black trace shows responses in aCSF + APV + DNQX, whereas the gray trace shows the increase in amplitude after CGP-52432 was added. Figure 9A, right, shows the responses of the same neuron shown in Fig. 9A, left, at different stimulation levels relative to threshold in the absence (filled circles) and presence (gray stars) of CGP-52432. The effect of CGP-52432 was greater at increasing stimulation amplitudes.
Fig. 9.
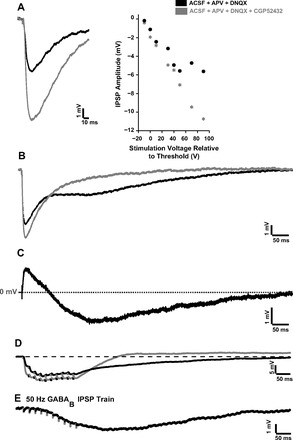
Modulatory effects of GABAB. A: GABAB modulated peak IPSP amplitude. Left, responses of a P28 neuron at (threshold + 90) V stimulation in aCSF + APV + DNQX (black trace) to isolate the IPSP and in aCSF + APV + DNQX + CGP-52432 (gray trace) to block GABAB receptors. Right, responses of the same neuron at varying stimulation amplitudes. Note the increase of IPSP amplitude after GABAB blockade. B: GABAB modulated IPSP temporal properties. Shown is a P17 neuron at (threshold + 50) V stimulation in aCSF + APV + DNQX (black trace) and in ACSF + APV + DNQX + CGP-52432 (gray trace). C: difference waveform of the two traces shown in B. The positive component of the difference waveform corresponds to the increased GABAA IPSP peak amplitude when GABAB receptors are blocked. The negative longer-lasting component of the difference waveform corresponds to the postsynaptic GABAB IPSP that is eliminated with CGP-52432. D: GABAB modulated recovery after repetitive stimulation. P16 neuron responses at 50 Hz in aCSF + APV + DNQX (black trace) and aCSF + APV + DNQX + CGP-52432 (gray trace) are shown. E: GABAB response of a P17 neuron to a 50-Hz train isolated with aCSF + APV + DNQX + picrotoxin.
Modulation of IPSP temporal parameters by GABAB.
GABAB blockade with CGP-52432 did not significantly affect IPSP latency or rise time (n = 11 pooled across ages). Removal of the postsynaptic GABAB component significantly reduced the overall IPSP duration (P = 0.0039, n = 9 pooled across ages). The reduction in duration was variable between cells and depended on the extent of activation of postsynaptic GABAB but was typically several hundreds of milliseconds (7 of 9 cells). In the only P23 cell that did not have a postsynaptic GABAB component in this study, IPSP durations before (102.2 ms) and after (113.2 ms) CGP-52432 did not differ. Figure 9B shows the effects of GABAB blockade on the IPSP of a P17 neuron, with the black and gray traces showing recordings in the absence and presence of CGP-52432, respectively. Figure 9C shows the waveform obtained by subtracting the gray trace in Fig. 9B from the black trace in Fig. 9B. The positive component of the difference waveform shows the increase in peak IPSP amplitude after GABAB blockade, whereas the negative longer-lasting component shows the reduction in IPSP duration after GABAB blockade.
Modulation of repetitive responses by GABAB.
Although presynaptic GABAB receptors can potentially modulate inhibitory PP ratios (measured by the individual baseline method) (Takesian et al. 2010), no consistent effect of GABAB blockade was seen in current-clamp mode for paired pulse ratio 2 (PP2) at 5, 10, or 50 Hz.
The postsynaptic GABAB component is strongly activated in response to high-frequency stimulation. Removal of the postsynaptic GABAB component can reduce the time required for the membrane potential to return to Vrest after the cessation of stimulation, which significantly influences the firing properties of thalamocortical neurons. Paired comparisons between pre- and post-CGP-52432 recovery times showed a significant reduction in recovery time after GABAB receptors were blocked (P = 0.01, n = 9). The extent of reduction depended on the extent of GABAB activation and was >250 ms in 7 of 9 neurons. Figure 9D shows the reduction in recovery time at 50-Hz stimulation in a P16 neuron, after GABAB receptors were blocked. Since postsynaptic GABAB had a strong effect on IPSP recovery time after high-frequency stimulation, we examined the recovery times of isolated GABAB IPSPs (recorded in the presence of APV + DNQX + picrotoxin; see Fig. 9E) in P16 neurons. Mean recovery time was 1,083.9 ± 198.7 ms at 50-Hz stimulation (n = 3) and 872.6 ± 55 ms at 100-Hz stimulation (n = 4). Additionally, GABAB recovery time was strongly correlated with peak GABAB amplitude (R = 0.86, P = 0.01).
Efficacy of Inhibition
Inhibition and intrinsic spikes.
Using injected currents as a proxy for excitatory inputs, the efficacy of inhibition was tested by presenting IPSPs simultaneously or at a fixed time window preceding the onset of suprathreshold depolarizing current pulses of 10 ms in width. These durations are comparable with IC-evoked excitatory postsynaptic currents (EPSCs) (Y. Venkataraman, C. F. Rabang, and E. L. Bartlett, unpublished observations). The base membrane potential before the start of the protocol was held at approximately −50 mV for all cells (mean membrane potential for this protocol was −51.8 ± 0.9 mV at P8, −52.5 ± 0.8 mV at P16, and −52.3 ± 1.0 mV at P27, means ± SD). The synaptic stimulation amplitude was adjusted to produce an IPSP of approximately −5 to −6 mV in amplitude at all ages (−5.0 ± 0.8 at P8, −6.3 ± 0.6 at P16, and −5.8 ± 1.6 at P27). The amplitude of the injected current pulse was 30 pA greater than the spiking threshold for the recorded neuron, and its ability to produce spikes was confirmed to be 100% across trials at the beginning and end of the protocol.
At all ages, simultaneous presentation of action potentials and IPSPs resulted in the suppression of action potentials (n = 3, 4, and 4 at P8, P16, and P27, respectively). When the IPSP preceded the current pulse at windows ranging from 500 to 1 ms, the maximum time window at which spikes were completely blocked across trials was calculated (Fig. 10A). This time window was higher at P8 (28.3 ± 11.7 ms, n = 3) and P16 (26.2 ± 9.2 ms, n = 4) versus P27 (10.3 ± 5.3 ms, n = 4). The total percentage of spikes blocked across all trials from time windows of 50 to 0 ms was calculated at each age group (Fig. 10B). This was also higher at P8 and P16 than at P27. Taken together from these data, IPSPs at P8 and P16 are equally or more efficacious than P27 neurons in blocking single action potentials evoked by near-threshold current injection that simulate EPSCs.
Fig. 10.
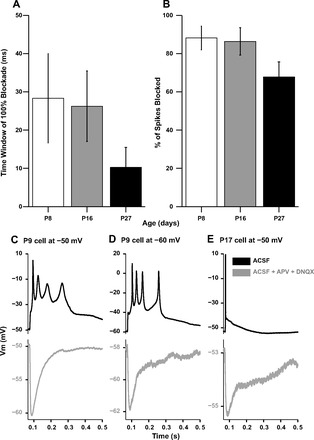
Potency of inhibition in suppressing spikes. A: time window of 100% action potential blockade by preceding IPSPs at P7–P9, P15–P17, and P22–P32, where the action potential was evoked by a depolarizing current pulse at varying intervals after synaptic stimulation. B: percentage of spikes blocked by IPSPs at P7–P9, P15–P17, and P22–P32, averaged over the time window of 0–50 ms preceding the current pulse onset. C: P9 neuron multiple spiking responses in normal aCSF (black trace, top) and in the presence of APV + DNQX (gray trace, bottom). D: the same P9 neuron as in C from a more hyperpolarized base potential. E: single spiking response of a P17 neuron in aCSF (black trace, top) and the underlying IPSP in aCSF + APV + DNQX (gray trace, bottom).
Inhibition and synaptic spikes.
The ability of IPSPs to block action potentials of synaptic origin was tested in mixed type cells with excitatory and inhibitory responses by recording synaptic responses in the absence of any drugs from a base membrane potential near −50 mV. In 22 mixed P8 neurons, 5 of 22 cells did not spike, although they did produce depolarizing postsynaptic potentials. Of the remaining mixed P8 neurons, 17 of 22 neurons produced one spike (n = 3), two spikes (n = 6), or multiple spikes (n = 8). At −50 mV, many of the late spikes observed in P8 neurons were broad. The black traces in Fig. 10, C and D, show a P9 neuron that produced multiple action potentials from a base membrane potential of −50 mV (Fig. 10C) and also at −60 mV (Fig. 10D) to a single shock. The gray traces in Fig. 10, C and D, show the underlying IPSP uncovered with the addition of APV and DNQX to aCSF. These responses can be contrasted to the single spike at P17 from a base membrane potential of −50 mV (Fig. 10E). In mixed cells at P16, 4 of 16 cells produced one spike, 11 of 16 cells did not spike, and multiple spiking was only observed in one P15 cell, which was EXDOM in type. At P27, single shocks produced a single spike in 3 of 13 mixed cells, whereas the remainder did not spike when inhibition was coactivated. Overall, these results show that IPSPs at P8 may be less efficacious in controlling action potentials of synaptic origin.
DISCUSSION
Here, we studied the postnatal development of MGB membrane properties in conjunction with the development of the IC-MGB inhibitory connection. We found that 1) Rin and τ decreased with age, whereas Vrest became more hyperpolarized with age; 2) IC-MGB IPSPs were present from the earliest age recorded (P7) and surprisingly did not differ in amplitude with age; 3) IPSP latency, rise time, and decay time decreased with age; 4) short-term synaptic depression during repetitive stimulation decreased with age, particularly between P8 and P16; 5) membrane properties interacted with synaptic currents and significantly influenced the response to single shocks and repetitive shocks (in a frequency-dependent manner); and 6) metabotropic GABAB receptors modulated the amplitude and temporal properties of GABAA responses and produced lasting hyperpolarization in response to repetitive stimulation that typically persisted for hundreds of milliseconds after stimulation.
Development of MGB Passive Properties
Declines in Rin and τ are a typical occurrence during the first 2–4 wk of development and have been reported across brain regions and across species (Ammer et al. 2012; Lee et al. 2010; Oswald and Reyes 2008; Perez Velazquez and Carlen 1996; Ramoa and McCormick 1994; Yamada et al. 2012). An earlier study on the rat MGB, Tennigkeit et al. (1998) also reported a decrease in Rin and τ during the first 2 wk (although P21 was the oldest age used in that study). The decrease in τ with age may be attributable in part to the decrease in Rin (R = 0.53, P < 0.001, n = 87 cells across ages). Depolarized membrane potentials during development have also been reported in the rat MGB (Tennigkeit et al. 1998), ferret and mouse dorsal lateral geniculate nucleus (LGN) (MacLeod et al. 1996; Ramoa and McCormick 1994), and rat ventrobasal (VB) nucleus (Lee et al. 2010; Perez Velazquez and Carlen 1996). Changes in Vrest with age may be attributed to ion gradients maintained between hyperpolarization-activated cation channels and K+ leak channels (Meuth et al. 2006) as well as Cl− extrusion via the K+-Cl− (KCC2) cotransporter, which has been found in other developing auditory structures (Blaesse et al. 2006). One possibility is that dialyzing the cytosol during whole cell patch clamp with the same intracellular solution at all ages eliminates age-dependent differences in cytoplasmic concentrations. However, trends in Vrest were similar to those obtained with nondialyzing intracellular recording techniques (MacLeod et al. 1996). The persistence of Vrest differences with age despite the use of consistent intracellular solutions argues for differences in the number or function of ion channels. Such changes have been observed in the thalamus and other auditory nuclei, in hyperpolarization-activated cation channels (Kanyshkova et al. 2009), KCC2 (Blaesse et al. 2006), and the Na+-K+-Cl− cotransporter (Yan et al. 2001), to name a few.
Development of IC-MBG Inhibition Versus Inhibition in the Auditory Brain Stem and AC
EGABA was significantly more depolarized in P8 MGB neurons, similar to auditory brain stem nuclei (Kandler and Friauf 1995; Kullmann and Kandler 2001; Milenković et al. 2007), but not in the AC (Kotak et al. 2007; Oswald and Reyes 2011). The EGABA of MGB neurons at P8 (−57.9 ± 3.3 mV) and P16 (−74.4 ± 2.1 mV) with an extracellular Cl− concentration of 135 mM was comparable with the EGABA of rat cochlear nucleus cells from perforated-patch recordings when a similar extracellular Cl− concentration was used (Song et al. 2012). The hyperpolarization of EGABA with age has been attributed to improved Cl− extrusion via KCC2. In the diencephalon, as in the lateral superior olive, KCC2 is present at P4, but in an inactive monomeric form that undergoes oligomerization during development (Blaesse et al. 2006).
Development of IC-MGB Inhibition Versus Other Sources of Inhibition in the MGB
One stereotypic inhibitory connection across sensory systems is the GABAergic input from the sensory sectors of the TRN to the respective sensory thalamus. While the development of TRN-MGB synaptic properties has not been studied to date, GABA immunoreactivity has been reported in all sensory sectors of the TRN from P0 (De Biasi et al. 1997). In the VB nucleus of rodents, TRN-VB IPSPs are composed of GABAA and GABAB components, both present from P0 (Evrard and Ropert 2009; Warren et al. 1997; Warren and Jones 1997).
An additional source of inhibition is from GABAergic interneurons that form distinctive triadic synapses with afferent inputs on relay neurons, which are found in the visual thalamus across species and in the cat and monkey MGB (Majorossy and Kiss 1976; Winer and Larue 1996). These neurons are rare in the rat MGB (Winer and Larue 1996). Interneuron-mediated GABAA inhibition develops in dorsal LGN neurons within the first postnatal week, and GABAB responses develop subsequently (Perreault et al. 2003; Ziburkus et al. 2003). We observed IC-mediated GABAA and GABAB responses at all ages in the MGB.
IC-MGB IPSPs Become Faster With Age
IC-MGB IPSP latencies decreased by a factor of 1.7 in the third postnatal week (and a similar trend was observed in voltage clamp), similar to what has been observed in several auditory nuclei (Kandler and Friauf 1995; Oswald and Reyes 2011; Wu and Oertel 1987). The reduced latencies are likely due mainly to increased myelination of IC axons, which can be seen in the brain slices, possibly with additional potential contributions from faster presynaptic action potentials (Oswald and Reyes 2011; Tennigkeit et al. 1998) or increased vesicle exocytosis (Johnson et al. 2005).
IPSP rise time and GABAA IPSP decay time were significantly higher at P8 compared with both other age groups and decreased with age. This result partly reflected concurrent changes in τ. Rise and decay times of P16 neurons showed deviations from the fitted lines to τ, and the correlation between rise/decay time and τ became even stronger when only P8 and P27 data were used (R = 0.65, P < 0.001 for rise time vs. τ; R = 0.75, P < 0.05 for decay time vs. τ) This deviation at P16 may reflect the presence of multiple GABA R subunits (α1, α2, and α3) at this intermediate age that promote high kinetic variability (Eyre et al. 2012). Thalamic nuclei undergo a sharp development shift from α2 [and to a lesser extent from α3 (Laurie et al. 1992)] to α1 between P10 and P20 (Fritschy et al. 1994; Peden et al. 2008). Overall, evoked GABAA IPSC temporal properties did not show much change with age [similar to TRN-VB IPSCs between ages P8-P12 and P21-P30 (Huntsman and Huguenard 2000)], but further study is needed to characterize developmental changes in receptor subunit composition.
Reduced Synaptic Depression With Age
Similar to the data shown in Fig. 6, in other auditory nuclei, reduced depression to repetitive stimulation during development has also been observed in both excitatory synapses (Crins et al. 2011; Joshi and Wang 2002; Oswald and Reyes 2011, 2008; Wang and Manis 2008; Yang and Xu-Friedman 2008) and inhibitory synapses (Takesian et al. 2010).
Presynaptic GABAB has been reported to be a mechanism underlying the development of inhibitory plasticity in the AC (Takesian et al. 2010). In the MGB, we found developmental trends in PP ratios to be similar before and after GABAB blockade (Fig. 6, B–G). Our results differ from those of a previous study (Luo et al. 2011), which concluded that GABAA PP2 ratios at 20 Hz were governed by presynaptic GABAB at P8–P10 but not in P15–P18 MGB neurons. However, we additionally recorded current-clamp responses at 25 Hz in five cells pooled across the oldest two age groups. IPSP2-to-IPSP1 ratios at 25 Hz were in agreement with GABAA IPSC2/IPSC1 P15–P18 values obtained by Luo et al. (2011) at 20 Hz. Our findings suggest the involvement of mechanisms other than GABAB at P8 that may contribute to the increased depression. This can include reduced presynaptic vesicle depletion, less effective GABA reuptake (Vitellaro-Zuccarello et al. 2003), or GABA receptor desensitization (Jones and Westbrook 1995).
A second type of measurement of PP ratios was made with respect to a common prestimulation baseline. As reported in an earlier study (Bartlett and Smith 2002), most IPSPs maintained a PP ratio close to 1 from a common baseline, implying that the extent of membrane hyperpolarization does not change or increases across a train stimulus when summation occurs. Therefore, sustained spiking of IC inhibitory inputs will produce a sustained hyperpolarization that will dampen MGB neuron excitability. A small number of cells showed strong depression of common baseline PP ratios (called type II responses; see Fig. 7, D–I). Further work needs to be done to determine whether, for example, postsynaptic subunit composition is different in neurons with type II responses.
Significance and Functional Implications of IC-MGB Inhibition
Overall, we found that IC-MGB inhibition is present from P7 and becomes faster and exhibits reduced depression with age. IPSPs also become more potent in controlling the rising phase of excitation.
Age-related changes in the properties of IC inhibition mostly occurred between the youngest (P8) and intermediate (P16) ages, but some, such as latency, continued through the first postnatal month. In vivo recordings (Barkat et al. 2011) found that P11–P15 was a period of plasticity in the mouse MGBv with respect to frequency tuning curve bandwidths (but not in tonotopic maps). Thus, the maturation of IC inhibition follows the time course of maturation of MGBv single tone tuning precision, which is known to be shaped by inhibition (Bartlett et al. 2011; Bartlett and Wang 2011).
Being monosynaptic and feedforward, IC inhibition can shape the onset and sustained tuning of MGB neurons rather than being restricted to sustained tuning, as would be expected for feedback TRN inhibition. Sustained activation of the IC inhibitory inputs will produce a sustained hyperpolarization at all ages, whose steady-state amplitude increases for higher frequencies (Fig. 7, D–F). This could potentially result in a prolonged reduction or suppression of spiking or a rebound upon its cessation, similar to feedback inhibition to LGN neurons (Kim and McCormick 1998; Kim et al. 1997) or feedforward inhibition to higher-order sensory thalamic nuclei (Lavallée et al. 2005; Trageser and Keller 2004). Activation of postsynaptic GABAB can lead to similar effects and can generate rebound spikes mediated by the low-threshold Ca2+ channel in thalamocortical neurons (Ulrich and Huguenard 1996). Significantly, a postsynaptic GABAB response was observed in most neurons at all ages. Moreover, tonic GABAA inhibition via receptors containing δ-subunits may play a significant role in controlling the excitability of MGB neurons in older posthearing animals (Richardson et al. 2011, 2013). The developmental time course for tonic inhibition is not known for the MGB, but there is a sharp increase in the amount of tonic GABAA current in the somatosensory thalamus between the second and third postnatal weeks (Peden et al. 2008).
A recent in vivo study of GABAergic neurons in the dorsal cortex of the IC (projecting to the MGBv and MGBd) found short spike latencies in response to tones (Geis and Borst 2012), demonstrating that the IC-MGB inhibitory pathway is active during sensory stimulation. This early IC inhibition may control the latency of MGB neurons or it may selectively gate sound-evoked responses, such as in shaping selectivity of awake marmoset MGB neurons to tone or noise stimuli (Bartlett and Wang 2011). Bartlett and Wang (2011) reported that 25% MGBd neurons were inhibited by tones and noise, whereas 30% were inhibited by tones and excited by noise. IC inhibition may also play a role in more complex stimulus paradigms, such as stimulus specific adaptation, which has been shown to be prominent in the nonlemniscal MGB (Antunes et al. 2010) and independent of cortical feedback (Antunes and Malmierca 2011). Moreover, GABAA inhibition has recently been shown to contribute to stimulus-specific adaptation in the IC (Pérez-González et al. 2012).
GRANTS
This work was supported by a Hearing Health Foundation grant (to E. L. Bartlett).
DISCLOSURES
No conflicts of interest, financial or otherwise, are declared by the author(s).
AUTHOR CONTRIBUTIONS
Author contributions: Y.V. and E.L.B. conception and design of research; Y.V. performed experiments; Y.V. analyzed data; Y.V. and E.L.B. interpreted results of experiments; Y.V. prepared figures; Y.V. drafted manuscript; Y.V. and E.L.B. edited and revised manuscript; Y.V. and E.L.B. approved final version of manuscript.
ACKNOWLEDGMENTS
The authors thank Tess Loraine Funke for help with Neurobiotin slice processing. The authors also thank Dr. Donna Fekete, Dr. Laurie Iten, and Dr. Pedro Irazoqui (Purdue University) for the use of microscopy for imaging of filled cells.
REFERENCES
- Aghajanian GK, Rasmussen K. Intracellular studies in the facial nucleus illustrating a simple new method for obtaining viable motoneurons in adult rat brain slices. Synapse 3: 331–338, 1989. [DOI] [PubMed] [Google Scholar]
- Ammer JJ, Grothe B, Felmy F. Late postnatal development of intrinsic and synaptic properties promotes fast and precise signaling in the dorsal nucleus of the lateral lemniscus. J Neurophysiol 107: 1172–1185, 2012. [DOI] [PubMed] [Google Scholar]
- Anderson LA, Linden JF. Physiological differences between histologically defined subdivisions in the mouse auditory thalamus. Hear Res 274: 48–60, 2011. [DOI] [PMC free article] [PubMed] [Google Scholar]
- Antunes FM, Malmierca MS. Effect of auditory cortex deactivation on stimulus-specific adaptation in the medial geniculate body. J Neurosci 31: 17306–17316, 2011. [DOI] [PMC free article] [PubMed] [Google Scholar]
- Antunes FM, Nelken I, Covey E, Malmierca MS. Stimulus-specific adaptation in the auditory thalamus of the anesthetized rat. PLos One 5: e14071, 2010. [DOI] [PMC free article] [PubMed] [Google Scholar]
- Awatramani GB, Turecek R, Trussell LO. Staggered development of GABAergic and glycinergic transmission in the MNTB. J Neurophysiol 93: 819–828, 2005. [DOI] [PubMed] [Google Scholar]
- Barkat TR, Polley DB, Hensch TK. A critical period for auditory thalamocortical connectivity. Nat Neurosci 14: 1189–1194, 2011. [DOI] [PMC free article] [PubMed] [Google Scholar]
- Bartlett EL, Sadagopan S, Wang X. Fine frequency tuning in monkey auditory cortex and thalamus. J Neurophysiol 106: 849–859, 2011. [DOI] [PMC free article] [PubMed] [Google Scholar]
- Bartlett EL, Smith PH. Anatomic, intrinsic, and synaptic properties of dorsal and ventral division neurons in rat medial geniculate body. J Neurophysiol 81: 1999–2016, 1999. [DOI] [PubMed] [Google Scholar]
- Bartlett EL, Smith PH. Effects of paired-pulse and repetitive stimulation on neurons in the rat medial geniculate body. Neuroscience 113: 957–974, 2002. [DOI] [PubMed] [Google Scholar]
- Bartlett EL, Stark JM, Guillery RW, Smith PH. Comparison of the fine structure of cortical and collicular terminals in the rat medial geniculate body. Neuroscience 100: 811–828, 2000. [DOI] [PubMed] [Google Scholar]
- Bartlett EL, Wang X. Correlation of neural response properties with auditory thalamus subdivisions in the awake marmoset. J Neurophysiol 105: 2647–2667, 2011. [DOI] [PMC free article] [PubMed] [Google Scholar]
- Blaesse P, Guillemin I, Schindler J, Schweizer M, Delpire E, Khiroug L, Friauf E, Nothwang HG. Oligomerization of KCC2 correlates with development of inhibitory neurotransmission. J Neurosci 26: 10407–10419, 2006. [DOI] [PMC free article] [PubMed] [Google Scholar]
- Blatchley BJ, Cooper WA, Coleman JR. Development of auditory brainstem response to tone pip stimuli in the rat. Brain Res 429: 75–84, 1987. [DOI] [PubMed] [Google Scholar]
- Bordi F, LeDoux JE. Response properties of single units in areas of rat auditory thalamus that project to the amygdala. I. Acoustic discharge patterns and frequency receptive fields. Exp Brain Res 98: 261–274, 1994. [DOI] [PubMed] [Google Scholar]
- Calford MB. The parcellation of the medial geniculate body of the cat defined by the auditory response properties of single units. J Neurosci 3: 2350–2364, 1983. [DOI] [PMC free article] [PubMed] [Google Scholar]
- Calford MB, Aitkin LM. Ascending projections to the medial geniculate body of the cat: evidence for multiple, parallel auditory pathways through thalamus. J Neurosci 3: 2365–2380, 1983. [DOI] [PMC free article] [PubMed] [Google Scholar]
- Chang EF, Bao S, Imaizumi K, Schreiner CE, Merzenich MM. Development of spectral and temporal response selectivity in the auditory cortex. Proc Natl Acad Sci USA 102: 16460–16465, 2005. [DOI] [PMC free article] [PubMed] [Google Scholar]
- Chirila FV, Rowland KC, Thompson JM, Spirou GA. Development of gerbil medial superior olive: integration of temporally delayed excitation and inhibition at physiological temperature. J Physiol 584: 167–190, 2007. [DOI] [PMC free article] [PubMed] [Google Scholar]
- Crins TT, Rusu SI, Rodríguez-Contreras A, Borst JG. Developmental changes in short-term plasticity at the rat calyx of Held synapse. J Neurosci 31: 11706–11717, 2011. [DOI] [PMC free article] [PubMed] [Google Scholar]
- D'Angelo WR, Sterbing SJ, Ostapoff EM, Kuwada S. Role of GABAergic inhibition in the coding of interaural time differences of low-frequency sounds in the inferior colliculus. J Neurophysiol 93: 3390–3400, 2005. [DOI] [PubMed] [Google Scholar]
- De Biasi S, Amadeo A, Arcelli P, Frassoni C, Spreafico R. Postnatal development of GABA-immunoreactive terminals in the reticular and ventrobasal nuclei of the rat thalamus: a light and electron microscopic study. Neuroscience 76: 503–515, 1997. [DOI] [PubMed] [Google Scholar]
- de Villers-Sidani E, Chang EF, Bao S, Merzenich MM. Critical period window for spectral tuning defined in the primary auditory cortex (A1) in the rat. J Neurosci 27: 180–189, 2007. [DOI] [PMC free article] [PubMed] [Google Scholar]
- Dorrn AL, Yuan K, Barker AJ, Schreiner CE, Froemke RC. Developmental sensory experience balances cortical excitation and inhibition. Nature 465: 932–936, 2010. [DOI] [PMC free article] [PubMed] [Google Scholar]
- Edeline JM, Manunta Y, Nodal FR, Bajo VM. Do auditory responses recorded from awake animals reflect the anatomical parcellation of the auditory thalamus? Hear Res 131: 135–152, 1999. [DOI] [PubMed] [Google Scholar]
- Evrard A, Ropert N. Early development of the thalamic inhibitory feedback loop in the primary somatosensory system of the newborn mice. J Neurosci 29: 9930–9940, 2009. [DOI] [PMC free article] [PubMed] [Google Scholar]
- Eyre MD, Renzi M, Farrant M, Nusser Z. Setting the time course of inhibitory synaptic currents by mixing multiple GABAA receptor α subunit isoforms. J Neurosci 32: 5853–5867, 2012. [DOI] [PMC free article] [PubMed] [Google Scholar]
- Fritschy JM, Paysan J, Enna A, Mohler H. Switch in the expression of rat GABAA-receptor subtypes during postnatal development: an immunohistochemical study. J Neurosci 14: 5302–5324, 1994. [DOI] [PMC free article] [PubMed] [Google Scholar]
- Geis HR, Borst JG. Large GABAergic neurons form a distinct subclass within the mouse dorsal cortex of the inferior colliculus with respect to intrinsic properties, synaptic inputs, sound responses, and projections. J Comp Neurol 521: 189–202, 2013. [DOI] [PubMed] [Google Scholar]
- Huntsman MM, Huguenard JR. Nucleus-specific differences in GABAA-receptor-mediated inhibition are enhanced during thalamic development. J Neurophysiol 83: 350–358, 2000. [DOI] [PubMed] [Google Scholar]
- Ito T, Bishop DC, Oliver DL. Two classes of GABAergic neurons in the inferior colliculus. J Neurosci 29: 13860–13869, 2009. [DOI] [PMC free article] [PubMed] [Google Scholar]
- Ito T, Oliver DL. The basic circuit of the IC: tectothalamic neurons with different patterns of synaptic organization send different messages to the thalamus. Front Neural Circuits 6: 48, 2012. [DOI] [PMC free article] [PubMed] [Google Scholar]
- Johnson SL, Marcotti W, Kros CJ. Increase in efficiency and reduction in Ca2+ dependence of exocytosis during development of mouse inner hair cells. J Physiol 563: 177–191, 2005. [DOI] [PMC free article] [PubMed] [Google Scholar]
- Jones MV, Westbrook GL. Desensitized states prolong GABAA channel responses to brief agonist pulses. Neuron 15: 181–191, 1995. [DOI] [PubMed] [Google Scholar]
- Joshi I, Wang LY. Developmental profiles of glutamate receptors and synaptic transmission at a single synapse in the mouse auditory brainstem. J Physiol 540: 861–873, 2002. [DOI] [PMC free article] [PubMed] [Google Scholar]
- Kandler K, Friauf E. Development of glycinergic and glutamatergic synaptic transmission in the auditory brainstem of perinatal rats. J Neurosci 15: 6890–6904, 1995. [DOI] [PMC free article] [PubMed] [Google Scholar]
- Kanyshkova T, Pawlowski M, Meuth P, Dubé C, Bender RA, Brewster AL, Baumann A, Baram TZ, Pape HC, Budde T. Postnatal expression pattern of HCN channel isoforms in thalamic neurons: relationship to maturation of thalamocortical oscillations. J Neurosci 29: 8847–8857, 2009. [DOI] [PMC free article] [PubMed] [Google Scholar]
- Kapfer C, Seidl AH, Schweizer H, Grothe B. Experience-dependent refinement of inhibitory inputs to auditory coincidence-detector neurons. Nat Neurosci 5: 247–253, 2002. [DOI] [PubMed] [Google Scholar]
- Kim U, McCormick DA. The functional influence of burst and tonic firing mode on synaptic interactions in the thalamus. J Neurosci 18: 9500–9516, 1998. [DOI] [PMC free article] [PubMed] [Google Scholar]
- Kim U, Sanchez-Vives MV, McCormick DA. Functional dynamics of GABAergic inhibition in the thalamus. Science 278: 130–134, 1997. [DOI] [PubMed] [Google Scholar]
- Kotak VC, Sadahiro M, Fall CP. Developmental expression of endogenous oscillations and waves in the auditory cortex involves calcium, gap junctions, and GABA. Neuroscience 146: 1629–1639, 2007. [DOI] [PubMed] [Google Scholar]
- Kullmann PH, Kandler K. Glycinergic/GABAergic synapses in the lateral superior olive are excitatory in neonatal C57Bl/6J mice. Brain Res Dev Brain Res 131: 143–147, 2001. [DOI] [PMC free article] [PubMed] [Google Scholar]
- Laurie DJ, Wisden W, Seeburg PH. The distribution of thirteen GABAA receptor subunit mRNAs in the rat brain. III. Embryonic and postnatal development. J Neurosci 12: 4151–4172, 1992. [DOI] [PMC free article] [PubMed] [Google Scholar]
- Lavallée P, Urbain N, Dufresne C, Bokor H, Acsády L, Deschênes M. Feedforward inhibitory control of sensory information in higher-order thalamic nuclei. J Neurosci 25: 7489–7498, 2005. [DOI] [PMC free article] [PubMed] [Google Scholar]
- LeBeau FE, Malmierca MS, Rees A. Iontophoresis in vivo demonstrates a key role for GABAA and glycinergic inhibition in shaping frequency response areas in the inferior colliculus of guinea pig. J Neurosci 21: 7303–7312, 2001. [DOI] [PMC free article] [PubMed] [Google Scholar]
- Lee CC, Sherman SM. Topography and physiology of ascending streams in the auditory tectothalamic pathway. Proc Natl Acad Sci USA 107: 372–377, 2010. [DOI] [PMC free article] [PubMed] [Google Scholar]
- Lee SC, Cruikshank SJ, Connors BW. Electrical and chemical synapses between relay neurons in developing thalamus. J Physiol 588: 2403–2415, 2010. [DOI] [PMC free article] [PubMed] [Google Scholar]
- Li S, Mealing GA, Morley P, Stys PK. Novel injury mechanism in anoxia and trauma of spinal cord white matter: glutamate release via reverse Na+-dependent glutamate transport. J Neurosci 19: RC16, 1999. [DOI] [PMC free article] [PubMed] [Google Scholar]
- Luo B, Wang HT, Su YY, Wu SH, Chen L. Activation of presynaptic GABAB receptors modulates GABAergic and glutamatergic inputs to the medial geniculate body. Hear Res 280: 157–165, 2011. [DOI] [PubMed] [Google Scholar]
- MacLeod N, Turner C, Edgar J. Properties of developing lateral geniculate neurones in the mouse. Int J Dev Neurosci 15: 205–224, 1996. [DOI] [PubMed] [Google Scholar]
- Magnusson AK, Kapfer C, Grothe B, Koch U. Maturation of glycinergic inhibition in the gerbil medial superior olive after hearing onset. J Physiol 568: 497–512, 2005. [DOI] [PMC free article] [PubMed] [Google Scholar]
- Majorossy K, Kiss A. Types of interneurons and their participation in the neuronal network of the medial geniculate body. Exp Brain Res 26: 19–37, 1976. [DOI] [PubMed] [Google Scholar]
- Meuth SG, Kanyshkova T, Meuth P, Landgraf P, Munsch T, Ludwig A, Hofmann F, Pape HC, Budde T. Membrane resting potential of thalamocortical relay neurons is shaped by the interaction among TASK3 and HCN2 channels. J Neurophysiol 96: 1517–1529, 2006. [DOI] [PubMed] [Google Scholar]
- Milenković I, Witte M, Turecek R, Heinrich M, Reinert T, Rübsamen R. Development of chloride-mediated inhibition in neurons of the anteroventral cochlear nucleus of gerbil (Meriones unguiculatus). J Neurophysiol 98: 1634–1644, 2007. [DOI] [PubMed] [Google Scholar]
- Montero VM. Ultrastructural identification of axon terminals from the thalamic reticular nucleus in the medial geniculate body in the rat: an EM autoradiographic study. Exp Brain Res 51: 338–342, 1983. [Google Scholar]
- Morel A, Rouiller E, de Ribaupierre Y, de Ribaupierre F. Tonotopic organization in the medial geniculate body (MGB) of lightly anesthetized cats. Exp Brain Res 69: 24–42, 1987. [DOI] [PubMed] [Google Scholar]
- Moyer JR, Brown TH. Methods for whole-cell recording from visually preselected neurons of perirhinal cortex in brain slices from young and aging rats. J Neurosci Methods 86: 35–54, 1998. [DOI] [PubMed] [Google Scholar]
- Noh J, Seal RP, Garver JA, Edwards RH, Kandler K. Glutamate co-release at GABA/glycinergic synapses is crucial for the refinement of an inhibitory map. Nat Neurosci 13: 232–238, 2010. [DOI] [PMC free article] [PubMed] [Google Scholar]
- Oswald AM, Reyes AD. Development of inhibitory timescales in auditory cortex. Cereb Cortex 21: 1351–1361, 2011. [DOI] [PMC free article] [PubMed] [Google Scholar]
- Oswald AM, Reyes AD. Maturation of intrinsic and synaptic properties of layer 2/3 pyramidal neurons in mouse auditory cortex. J Neurophysiol 99: 2998–3008, 2008. [DOI] [PMC free article] [PubMed] [Google Scholar]
- Paul K, Cox CL. Excitatory actions of substance P in the rat lateral posterior nucleus. Eur J Neurosci 31: 1–13, 2010. [DOI] [PubMed] [Google Scholar]
- Peden DR, Petitjean CM, Herd MB, Durakoglugil MS, Rosahl TW, Wafford K, Homanics GE, Belelli D, Fritschy JM, Lambert JJ. Developmental maturation of synaptic and extrasynaptic GABAA receptors in mouse thalamic ventrobasal neurones. J Physiol 586: 965–987, 2008. [DOI] [PMC free article] [PubMed] [Google Scholar]
- Pérez-González D, Hernández O, Covey E, Malmierca MS. GABAA-mediated inhibition modulates stimulus-specific adaptation in the inferior colliculus. PLos One 7: e34297, 2012. [DOI] [PMC free article] [PubMed] [Google Scholar]
- Perez Velazquez JL, Carlen PL. Development of firing patterns and electrical properties in neurons of the rat ventrobasal thalamus. Brain Res Dev Brain Res 91: 164–170, 1996. [DOI] [PubMed] [Google Scholar]
- Perreault MC, Qin Y, Heggelund P, Zhu JJ. Postnatal development of GABAergic signalling in the rat lateral geniculate nucleus: presynaptic dendritic mechanisms. J Physiol 546: 137–148, 2003. [DOI] [PMC free article] [PubMed] [Google Scholar]
- Peruzzi D, Bartlett E, Smith PH, Oliver DL. A monosynaptic GABAergic input from the inferior colliculus to the medial geniculate body in rat. J Neurosci 17: 3766–3777, 1997. [DOI] [PMC free article] [PubMed] [Google Scholar]
- Ramoa AS, McCormick DA. Developmental changes in electrophysiological properties of LGNd neurons during reorganization of retinogeniculate connections. J Neurosci 14: 2089–2097, 1994. [DOI] [PMC free article] [PubMed] [Google Scholar]
- Razak KA, Fuzessery ZM. GABA shapes selectivity for the rate and direction of frequency-modulated sweeps in the auditory cortex. J Neurophysiol 102: 1366–1378, 2009. [DOI] [PMC free article] [PubMed] [Google Scholar]
- Richardson BD, Ling LL, Uteshev VV, Caspary DM. Extrasynaptic GABAA receptors and tonic inhibition in rat auditory thalamus. PLos One 6: e16508, 2011. [DOI] [PMC free article] [PubMed] [Google Scholar]
- Richardson BD, Ling LL, Uteshev VV, Caspary DM. Reduced GABAA receptor-mediated tonic inhibition in aged rat auditory thalamus. J Neurosci 33: 1218–1227, 2013. [DOI] [PMC free article] [PubMed] [Google Scholar]
- Rosen MJ, Semple MN, Sanes DH. Exploiting development to evaluate auditory encoding of amplitude modulation. J Neurosci 30: 15509–15520, 2010. [DOI] [PMC free article] [PubMed] [Google Scholar]
- Sharma J, Angelucci A, Sur M. Induction of visual orientation modules in auditory cortex. Nature 404: 841–847, 2000. [DOI] [PubMed] [Google Scholar]
- Song NY, Shi HB, Li CY, Yin SK. Differences in developmental changes in GABAergic response between bushy and stellate cells in the rat anteroventral cochlear nucleus. Int J Dev Neurosci 30: 397–403, 2012. [DOI] [PubMed] [Google Scholar]
- Steriade M, McCormick DA, Sejnowski TJ. Thalamocortical oscillations in the sleeping and aroused brain. Science 262: 679–685, 1993. [DOI] [PubMed] [Google Scholar]
- Sun YJ, Wu GK, Liu BH, Li P, Zhou M, Xiao Z, Tao HW, Zhang LI. Fine-tuning of pre-balanced excitation and inhibition during auditory cortical development. Nature 465: 927–931, 2010. [DOI] [PMC free article] [PubMed] [Google Scholar]
- Takahashi T, Kajikawa Y, Tsujimoto T. G-Protein-coupled modulation of presynaptic calcium currents and transmitter release by a GABAB receptor. J Neurosci 18: 3138–3146, 1998. [DOI] [PMC free article] [PubMed] [Google Scholar]
- Takesian AE, Kotak VC, Sanes DH. Age-dependent effect of hearing loss on cortical inhibitory synapse function. J Neurophysiol 107: 937–947, 2012. [DOI] [PMC free article] [PubMed] [Google Scholar]
- Takesian AE, Kotak VC, Sanes DH. Presynaptic GABAB receptors regulate experience-dependent development of inhibitory short-term plasticity. J Neurosci 30: 2716–2727, 2010. [DOI] [PMC free article] [PubMed] [Google Scholar]
- Tennigkeit F, Schwarz DW, Puil E. Postnatal development of signal generation in auditory thalamic neurons. Brain Res Dev Brain Res 109: 255–263, 1998. [DOI] [PubMed] [Google Scholar]
- Trageser JC, Keller A. Reducing the uncertainty: gating of peripheral inputs by zona incerta. J Neurosci 24: 8911–8915, 2004. [DOI] [PMC free article] [PubMed] [Google Scholar]
- Ulrich D, Huguenard JR. Gamma-aminobutyric acid type B receptor-dependent burst-firing in thalamic neurons: a dynamic clamp study. Proc Natl Acad Sci USA 93: 13245–13249, 1996. [DOI] [PMC free article] [PubMed] [Google Scholar]
- Vitellaro-Zuccarello L, Calvaresi N, De Biasi S. Expression of GABA transporters, GAT-1 and GAT-3, in the cerebral cortex and thalamus of the rat during postnatal development. Cell Tissue Res 313: 245–257, 2003. [DOI] [PubMed] [Google Scholar]
- Walcher J, Hassfurth B, Grothe B, Koch U. Comparative posthearing development of inhibitory inputs to the lateral superior olive in gerbils and mice. J Neurophysiol 106: 1443–1453, 2011. [DOI] [PubMed] [Google Scholar]
- Wang J, McFadden SL, Caspary D, Salvi R. Gamma-aminobutyric acid circuits shape response properties of auditory cortex neurons. Brain Res 944: 219–231, 2002. [DOI] [PubMed] [Google Scholar]
- Wang Y, Manis PB. Short-term synaptic depression and recovery at the mature mammalian endbulb of Held synapse in mice. J Neurophysiol 100: 1255–1264, 2008. [DOI] [PMC free article] [PubMed] [Google Scholar]
- Warren RA, Golshani P, Jones EG. GABAB-receptor-mediated inhibition in developing mouse ventral posterior thalamic nucleus. J Neurophysiol 78: 550–553, 1997. [DOI] [PubMed] [Google Scholar]
- Warren RA, Jones EG. Maturation of neuronal form and function in a mouse thalamo-cortical circuit. J Neurosci 17: 277–295, 1997. [DOI] [PMC free article] [PubMed] [Google Scholar]
- Williams AJ, Fuzessery ZM. Differential roles of GABAergic and glycinergic input on FM selectivity in the inferior colliculus of the pallid bat. J Neurophysiol 106: 2523–2535, 2011. [DOI] [PMC free article] [PubMed] [Google Scholar]
- Winer JA, Larue DT. Evolution of GABAergic circuitry in the mammalian medial geniculate body. Proc Natl Acad Sci USA 93: 3083–3087, 1996. [DOI] [PMC free article] [PubMed] [Google Scholar]
- Winer JA, Saint Marie RL, Larue DT, Oliver DL. GABAergic feedforward projections from the inferior colliculus to the medial geniculate body. Proc Natl Acad Sci USA 93: 8005–8010, 1996. [DOI] [PMC free article] [PubMed] [Google Scholar]
- Wu SH, Oertel D. Maturation of synapses and electrical properties of cells in the cochlear nuclei. Hear Res 30: 99–110, 1987. [DOI] [PubMed] [Google Scholar]
- Yamada D, Miyajima M, Ishibashi H, Wada K, Seki K, Sekiguchi M. Adult-like action potential properties and abundant GABAergic synaptic responses in amygdala neurons from newborn marmosets. J Physiol 2012. [DOI] [PMC free article] [PubMed] [Google Scholar]
- Yan Y, Dempsey RJ, Sun D. Expression of Na+-K+-Cl− cotransporter in rat brain during development and its localization in mature astrocytes. Brain Res 911: 43–55, 2001. [DOI] [PubMed] [Google Scholar]
- Yang H, Xu-Friedman MA. Relative roles of different mechanisms of depression at the mouse endbulb of Held. J Neurophysiol 99: 2510–2521, 2008. [DOI] [PMC free article] [PubMed] [Google Scholar]
- Zhang LI, Tan AY, Schreiner CE, Merzenich MM. Topography and synaptic shaping of direction selectivity in primary auditory cortex. Nature 424: 201–205, 2003. [DOI] [PubMed] [Google Scholar]
- Zhang Z, Liu CH, Yu YQ, Fujimoto K, Chan YS, He J. Corticofugal projection inhibits the auditory thalamus through the thalamic reticular nucleus. J Neurophysiol 99: 2938–2945, 2008. [DOI] [PubMed] [Google Scholar]
- Ziburkus J, Lo FS, Guido W. Nature of inhibitory postsynaptic activity in developing relay cells of the lateral geniculate nucleus. J Neurophysiol 90: 1063–1070, 2003. [DOI] [PubMed] [Google Scholar]