Abstract
Shear wave elasticity imaging (SWEI) has found success in liver fibrosis staging. This work evaluates hepatic SWEI measurement success as a function of push pulse energy using 2 Mechanical Index (MI) values (1.6 and 2.2) over a range of pulse durations. Shear wave speed (SWS) was measured in the livers of 26 study subjects with known or potential chronic liver diseases. Each measurement consisted of 8 SWEI sequences, each with different push energy configurations. The rate of successful SWS estimation was linearly proportional to the push energy. SWEI measurements with higher push energy were successful in patients for whom standard push energy levels failed. The findings also suggest that liver capsule depth could be used prospectively to identify patients who would benefit from elevated output. We conclude that there is clinical benefit to using elevated acoustic output for hepatic SWS measurement in patients with deeper livers.
Keywords: Shear Wave Elasticity Imaging, Liver fibrosis, Mechanical Index, acoustic radiation force energy
Introduction
Liver biopsy has been the gold standard for staging liver fibrosis (Wieckowska et al., 2007), with common disease etiologies such as viral hepatitis (Tong et al., 1995; Poynard et al., 1997), metabolic diseases (Ishak, 2002: Bugianesi et al., 2005), autoimmune diseases (Manns and Kruger, 1994) and toxin-related causes (Mukaiya et al., 1998). However, due to its invasiveness, risk of patient discomfort and lack of sensitivity (Arena et al., 2013), liver biopsy is poorly suited as a diagnostic test for longitudinal monitoring. Recently, Shear Wave Elasticity Imaging (SWEI) (Sarvazyan et al., 1998), has found success in the staging of liver fibrosis (Palmeri et al., 2011, 2008: Lazebnik, 2008; Piscaglia et al., 2011; Friedrich-Rust et al., 2009; Haque et al., 2010; Horster et al., 2010; Lupsor et al., 2009; Fierbinteanu-Braticevici et al., 2009). However, studies routinely report depth penetration limitations and exclude patients with livers and hepatic lesions deeper than 6–8 cm (Park et al., 2013), and technical failure and unreliable measurement rates for liver stiffness have been reported to increase both with elevated patient BMI (a measure of obesity) (Yoon et al., 2014), and in the presence of significant hepatic fibrosis (Poynard et al., 2013). These challenges likely result from: (1) significant propagation distances of ultrasound waves through subcutaneous fat in patients with higher BMIs, which can attenuate acoustic radiation force impulse (ARFI) excitations and abberate tracking ultrasound beams, and (2) smaller displacement amplitudes in stiffer livers. Current clinical SWEI protocols require 10 successful measurements for each patient, and record the median value of the 10 measurements (Sporea et al., 2014). Herein we test the hypothesis that a stronger acoustic radiation force excitation will increase the SNR of the shear wave signal as well as increasing the percentage of successful SWS estimates.
The tissue displacement magnitude is proportional to the amount of momentum change induced by the ‘acoustic radiation force impulse’, which is given by:
| (1) |
where α represents the ultrasonic attenuation of the tissue, I represents the pulse-average intensity of the acoustic beam, c is the sound speed, and t is the duration of ARFI push. In a given material, where α and c are fixed, increasing the tissue displacement is achieved by using an ARFI push with higher impulse. Technical approaches to increase the push impulse include: (1) generating higher intensities (I) and (2) increasing the duration of the ARFI excitation. The peak pressure, and thus intensity, of commercial systems is limited by the U.S Food and Drug Administration (FDA) guidelines on Mechanical Index (, where P−.3 is the peak-rarefactional pressure derated by α = 0.3 dB/cm/MHz, and fc is the center frequency) (FDA, 1993).
The acoustic output of diagnostic ultrasonic imaging systems in the United States has been limited to an MI of 1.9 by FDA guidelines based on substantial equivalence with commercial products in the market prior to 1976 (AIUM/NEMA, 1992). The MI guideline is intended to minimize the potential risks of non-thermal bioeffects, such as inertial cavitation, during diagnostic ultrasound exams. Inertial cavitation, i.e., bubble motion characterized by a large expansion followed by a rapid, violent collapse, can radiate damaging shock waves and raise the local temperature to as high as 5000 K, producing large numbers of reactive free radicals (Church et al., 2012). The MI formulation is based on the assumption of pre-existing bubbles in water (Apfel and Holland, 1991), but the cavitation threshold in viscoelastic tissues, such as liver, can be twice compared to that in water (Church, 2002). A recent theoretical analysis of pressure thresholds for cavitation with pulses typically employed in ARFI imaging in tissue-like viscoelastic materials with a bubble present indicated that an MI value of 1.9 represents a conservative guideline in the context of hepatic imaging (Church et al., 2015). Further, endogeneous cavitation nuclei are rare in most soft tissues (O’Brien, 2007). In tissues such as the liver that are not known to contain well defined gas bubbles, theoretical models indicate that the likelihood of inducing a cavitation related bioeffect with an ultrasound signal with an MI of 4.0 is 1 in 10,000,000 (Fowlkes, 2008).
This work presents a clinical study that evaluates hepatic SWEI measurement success as a function of ARFI push energy using 2 MI values (1.6 and 2.2) over a range of pulse durations. The goal is to quantify the effect of increasing push energy on measurement success and to determine if there is clinical benefit in exceeding the current MI FDA guideline of 1.9 in the context of hepatic SWEI measurements.
Methods
Data acquisition sequence and SWS calculation
Group SWS was measured using a modified Siemens Acuson SC2000™ ultrasound scanner (Siemens Healthcare, Ultrasound Business Unit, Mountain View, CA, USA) and an Acuson 4C1 curvilinear transducer. Each measurement consisted of 8 SWEI sequences, each with different ARFI push energy configurations. Four of 8 pushes had an MI of 1.6, which is typical of ARFI/SWEI on commercial scanners; through increased excitation voltage, the other four pushes had a higher MI of 2.2. Pairs of MI 1.6 and 2.2 sequences had matched scanner excitation transmit energy (E) by adjusting the pulse duration. The scanner excitation transmit energy (E) was calculated as the energy used to generate the push impulse,
| (2) |
where Vrms is the root mean square of the excitation voltage, Z is the transducer impedance at the center frequency of the push pulse as specified on the scanner, and t is the push duration. Table 1 presents a summary of the 8 push pulses. The smallest energy used in this study was 4.0 mJ (Sequence 1), which is typical of commercial SWEI. In this study, we have encountered scanner power droop over the course of ARFI pushes. The pressure amplitude gradually decays towards the end of the push pulses. All of the sequences were characterized for scanner droop, which was incorporated into the energy calculations in Table 1. The push pulse was transmitted with a center frequency of 2.2 MHz, and had a fixed F/1.5 focus near 50 mm axially.
Table 1.
Configurations of 8 SWEI excitations, Sequence #1 is similar to the energy used in current commercial SWEI implementations, Sequence #3 and #5 (bold) are a pair of high and low MI sequences that have the same excitation transmit energy (E), which was computed using Equation 2.
| Seq Number | MI | Isppa(W/cm2) | duration (µs) | E (mJ) |
|---|---|---|---|---|
| 1 | 1.6 | 420 | 364 | 4.0 |
| 2 | 1.6 | 420 | 546 | 6.0 |
| 3 | 1.6 | 420 | 727 | 8.0 |
| 4 | 1.6 | 420 | 1000 | 10.2 |
| 5 | 2.2 | 730 | 157 | 8.0 |
| 6 | 2.2 | 730 | 176 | 9.0 |
| 7 | 2.2 | 730 | 309 | 15.2 |
| 8 | 2.2 | 730 | 411 | 17.5 |
Pulse-inversion harmonic tracking at 4 MHz was used for all sequences to reduce the clutter in tracking data (Doherty et al., 2013). The pulse repetition frequency (PRF) was 5 kHz. Due to equipment limitations, the MI for both pushing and tracking beams was the same for a given sequence. Eight repeated measurements were performed in each patient, and the order of the 8 pushes within each measurement was randomized to avoid systematic errors.
All post-processing tasks were completed offline using Matlab (R2012a, MathWorks®, Natick, MA). Displacement estimation was performed using a phase-shift estimator on the beamformed in-phase and quadrature (IQ) data (Loupas et al., 1995; Pinton et al., 2006). SWS was reconstructed using the Random Sample Consensus (RANSAC) (Wang et al., 2010) algorithm applied to arrival times of the peak particle velocities, and the Radon Sum (Rouze et al., 2010) algorithm applied to the particle velocity data.
SWS yield
In this study, SWEI measurements with less than 50% inliers in the RANSAC algorithm were considered unsuccessful and were rejected, consistent with previously published in vivo liver data (Wang et al., 2010). In addition, it has been shown that the RANSAC and Radon sum algorithms reconstruct SWS estimates with good agreement, with a correlation coefficient of 0.91 (Rouze et al., 2010). Therefore, acquisitions were also rejected when the SWS estimates from the two algorithms differed by more than 15%.
Differences between SWS measurements as a function of energy level were determined using a one-way ANOVA for each patient. A p-value exceeding 0.05 meant that the SWS measurements were not significantly different. A post-hoc Tukey’s range test was applied in conjunction with an ANOVA for patients that had p < 0.05, to find the push energy level that produced SWS measurements significantly different from others.
MI measurement
Acoustic output pressure measurements were made in accordance with the AIUM/NEMA standard (AIUM/NEMA, 1998). The measurements were performed in a water tank with the 4C1 transducer directly coupled to a 3D stepper motor-controlled translation stage (Newport, Irvine, CA). The transducer was configured to transmit 10-cycle push pulses at a PRF of 10 Hz to avoid heating of the transducer. The pressure waveform was measured with a calibrated membrane hydrophone (PVDF, with a 0.6 mm spot size, Sonic Technologies, Wyndmoor, PA). Custom LabView (National Instruments, Austin, TX) programs were written to translate the hydrophone and automatically trigger the scanner to transmit the desired pulses and the oscilloscope to record pressure waveforms. Five repeated measurements were acquired and averaged at each position in a 3D grid (3.9 mm × 1.2 mm × 1.5 mm, axial × lateral × elevational) centered around the focal point using a step size of 0.3 mm, in order to capture the global maximum of the acoustic pressure.
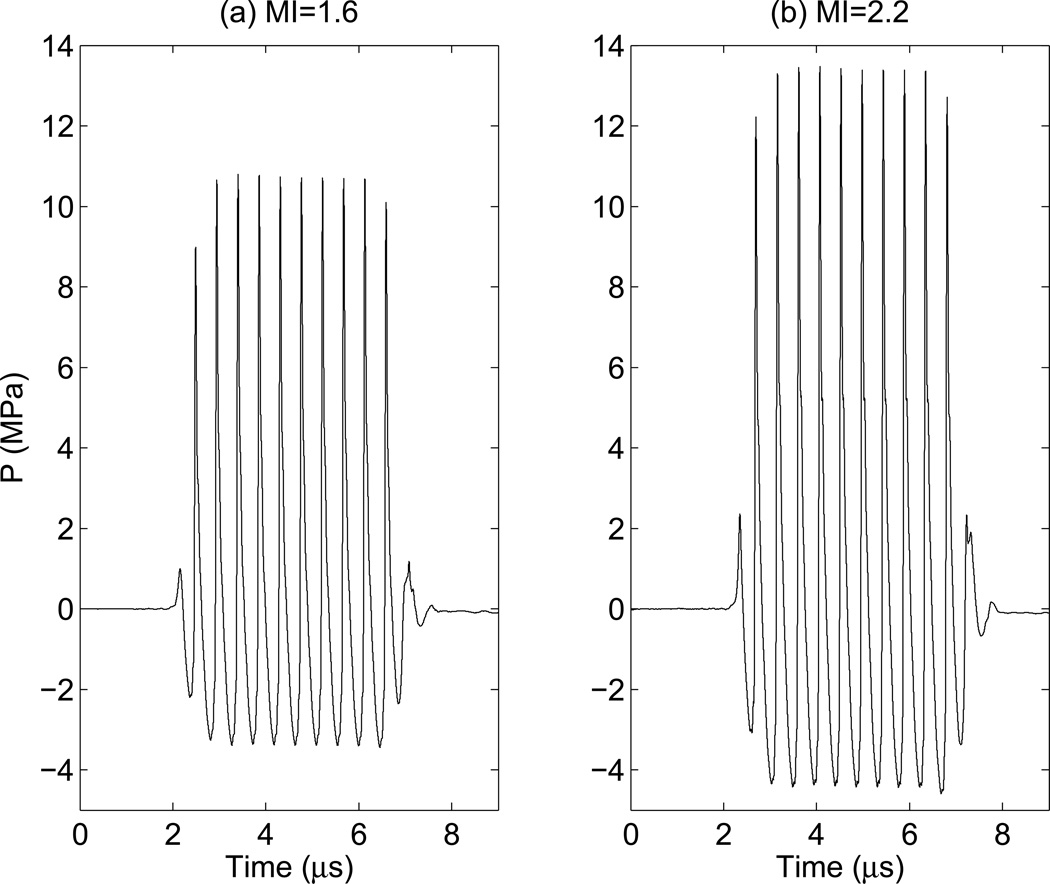
The pressure waveform was estimated from the recorded voltage waveform by deconvolution based on the magnitude of the sensitivity of the hydrophone (Wear et al., 2014). This deconvolution method reduces overestimation of the peak negative pressure arising from non-uniform hydrophone sensitivity. After voltage to pressure conversion, the MI was obtained by derating the peak-rarefactional pressure by 0.3 dB/cm/MHz at the center frequency (2.2 MHz) of the transmit waveform, and then dividing by the square root of center frequency of the push pulse (FDA, 1993). Figure 1 shows example pressure waveforms of 10-cycle pulses at both MIs. The pressure waveforms were also measured in lossy media (a solution of evaporated milk and water with α = 0.5 dB/cm/MHz) to more closely match in vivo imaging (Stiles et al., 2008).
Figure 1.
Ten cycles of the pressure waveforms measured in water that were used in this study, (a): peak-rarefactional pressure = 3.43 MPa. which corresponds to MI = 1.6 and Isppa.3 = 420 W/cm2. (b): peak-rarefactional pressure = 4.59 MPa, which corresponds to MI = 2.2 and Isppa.3 = 730 W/cm2.
Clinical study design and population
Twenty six study subjects with known or potential chronic liver diseases were recruited. This clinical study was approved by the Institutional Review Board at the Duke University, and each study subject provided written informed consent prior to enrollment. Patient age, BMI, and fibrosis stage (if a liver biopsy had been performed) were recorded. Liver capsule depth was measured from the Bmode image for each study subject.
All 8 repeated SWEI measurements per study subject were performed at the inferior-intercostal location (i.e., 10–1lth rib intercostals space coinciding most often with the location of the liver biopsy needle insertion), and a single trained imager completed all imaging tasks to avoid inter-operator variability. Study subjects were asked to pause breathing during each data acquisition, which lasted approximately 8 seconds. After the study subject paused breathing, an imaging location was targeted in a homogeneous liver region on Bmode imaging, devoid of any vessels or other structures. The study subject was instructed to resume breathing after each measurement.
Results
Table 2 summarizes patient demographics in this study. The study subjects cover a wide range of BMI and all fibrosis stages.
Table 2.
Patient demographics
| Gender | Total # |
| Male | 13 |
| Female | 13 |
| BMI (kg/m2) | Total # |
| <25 | 0 |
| 25–30 | 8 |
| 31–40 | 14 |
| >40 | 4 |
| Fibrosis stage | Total # |
| F0 | 5 |
| F 1–2 | 8 |
| F 3–4 | 11 |
| N/A | 2 |
| Liver capsule depth (mm) | Total # |
| 20–34 | 13 |
| 35–59 | 13 |
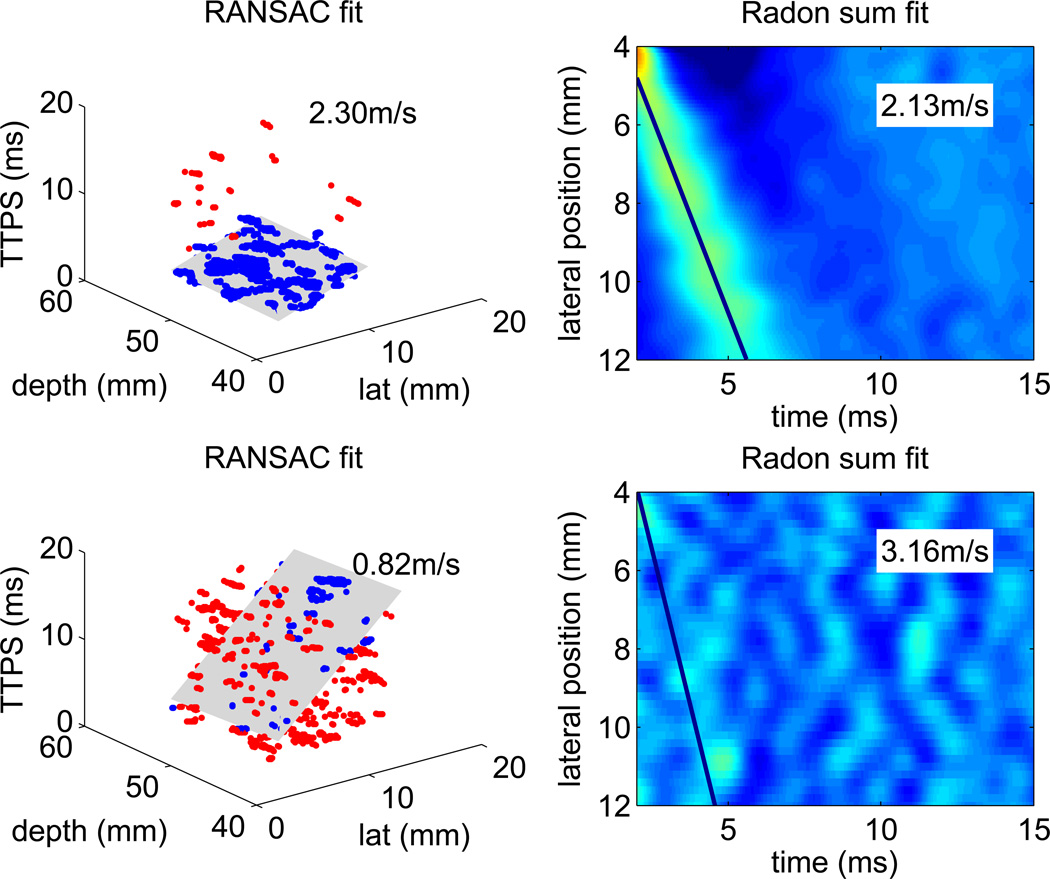
Figure 2 shows example RANSAC and Radon sum results. The top row portrays data from a successful SWS measurement, whereas the bottom row shows a dataset that was rejected due to its low percentage of inliers and the disparity between the two SWS estimation methods.
Figure 2.
Example RANSAC and Radon sum SWS reconstructions. In the RANSAC data, the blue points depict inliers of shear wave arrival times, while the red points depict outliers. The gray plane shows the 3D plane that best fits the arrival time profile. In the Radon sum data, which was averaged through depth, the line depicts the best fit that approximates the shear wave trajectory. Each pixel indicates the peak particle velocity ranging from −5 – 15 mm/s, The top row shows the RANSAC and Radon sum fit of a successful SWS reconstruction, there were 98% inliers in the RANSAC fit, and the estimates are within 8% of each other. The bottom row shows an unsuccessful SWS reconstruction, where the data is so noisy that no shear wave propagation is evident. There were only 28% inliers in RANSAC fit, and the RANSAC and Radon sum fits were arbitrary, with the SWS estimates differing by 75%.
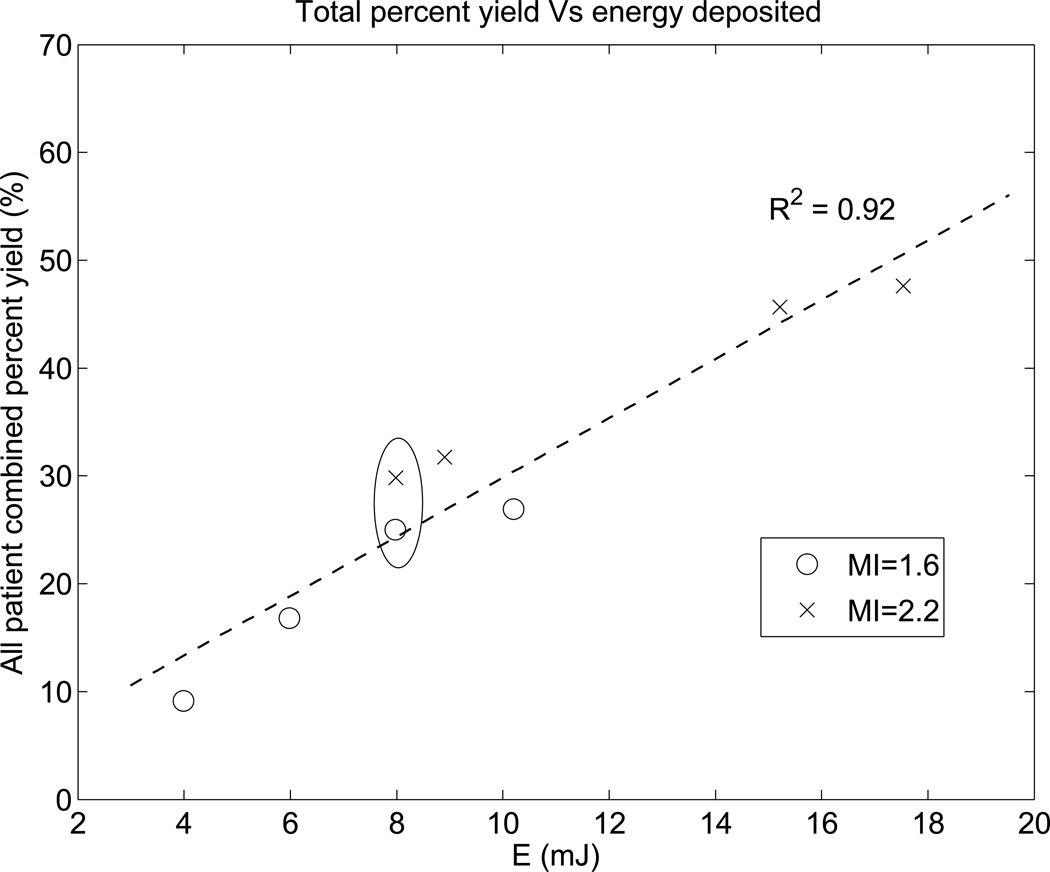
Figure 3 shows the total percent yield of successful SWS measurements as a function of scanner energy (E). The number of successful SWS reconstructions was summed over 8 repeated measurements for all 26 subjects to determine the total yield at each push energy level. The percent yield was then calculated by normalizing the total yield by the total number of measurements at each energy level (8 repeated measurements × 26 study subjects = 208). The total percent yield for the highest energy excitation was 48%. and that for the lowest energy excitation was only 9%. Figure 3 indicates that the rate of successful SWS reconstruction is linearly proportional to the magnitude of the push energy deposition in the liver.
Figure 3.
The combined percent yield across all patients linearly increases with increasing push energy. Of the 8 excitation energy levels used in each patient, four had an MI of 1.6 and four had an MI of 2.2. Generally MI 2.2 excitations have higher push energy than MI 1.6 excitations. There is a pair of high and low MI excitations (circled) that have the same energy level of 8 mJ. The dashed line shows the linear fit.
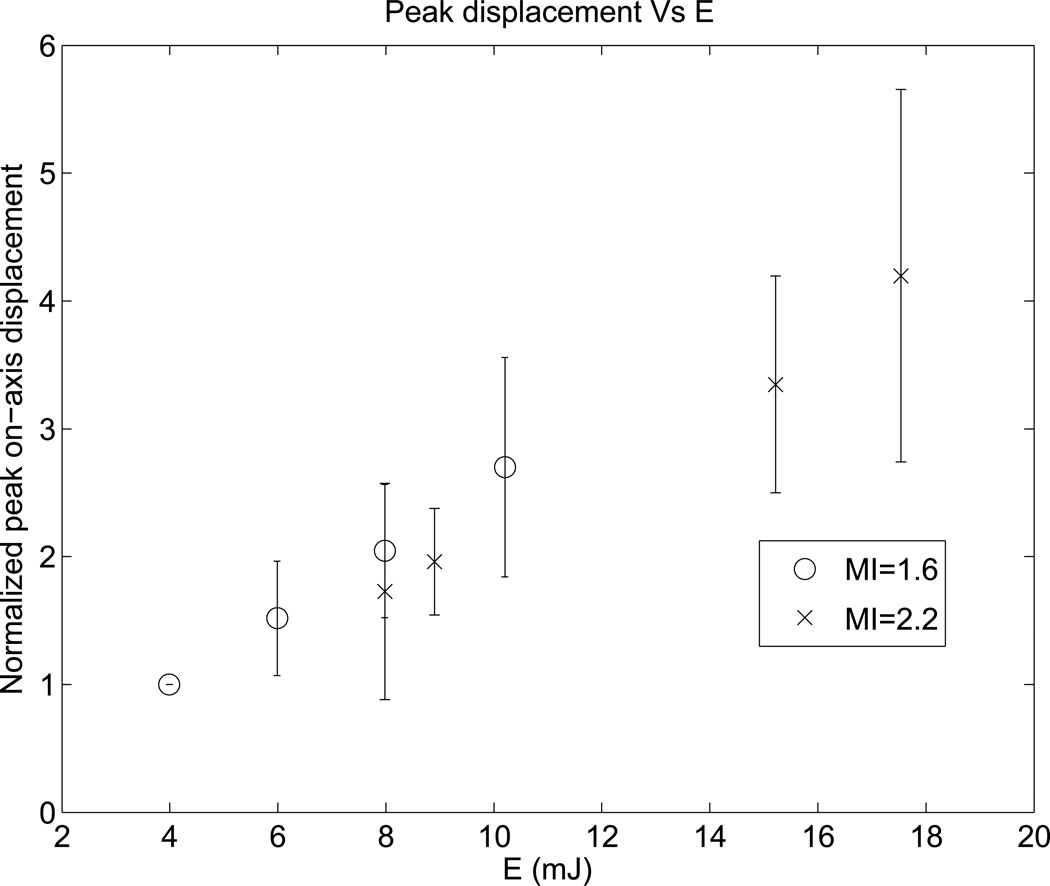
Figure 4 shows the normalized peak displacements resulting from ARFI excitations with various push energy levels. For each patient, the peak displacements were normalized to the displacement level at the lowest energy level. The peak displacements increase with increasing transmit excitation energy, as expected.
Figure 4.
Normalized peak ARFI displacement versus transmit push energy. The error bars represent variation across the 26 study subjects. For each subject, the displacements were normalized to the amplitude at the lowest push energy level. As expected, peak displacements increase with increasing push energy.
An ANOVA analysis was performed on the data from the 19 study subjects that produced successful SWS estimates at more than one push energy level. The SWS estimates from each push energy level were not significantly different in 17 of the 19 subjects (p > 0.05). The two subjects that yielded different SWS estimates between sequences both had limited successful measurements with outliers at the lower energy levels. Subject 1 produced 2 SWS estimates at E = 6 mJ described in Table 1, and one of them was 42% higher than the mean of the other estimates. Subject 4 produced only 1 SWS estimate at 6 mJ energy, and it was 62% higher than the mean of the other estimates.
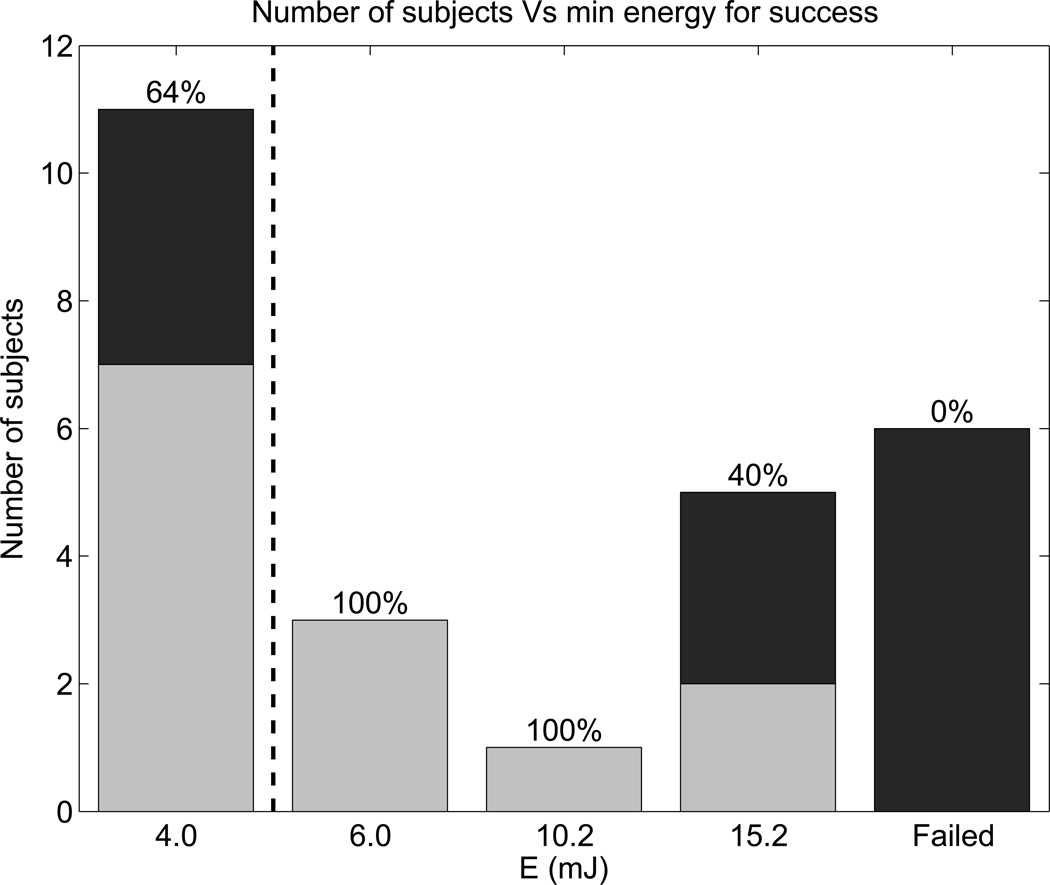
Figure 5 further evaluates the energy threshold in the data and includes liver depth information. Figure 5 shows the number of study subjects for whom the energy level specified was the smallest energy level that produced a successful SWS estimate, and the color of the bars represents liver capsule depth. Out of the 26 study subjects, 11 had successful SWS estimates at E = 4.0 mJ (typical of commercial SWEI), 9 had successful SWS estimates only at elevated push energy levels (E ≥ 6.0 mJ), and 6 subjects failed to yield any successful SWS reconstructions. Table 3 provides details from the 6 failed patients. Deep liver capsules and advanced fibrosis stages are highlighted in bold in Table 3. The 6 failed patients had significantly deeper liver capsules than the rest of the study population (45.0 ± 6.3 mm versus 33.5 ± 7.3 mm, p < 0.001), and 3 of them had advanced fibrosis.
Figure 5.
Number of subjects for whom the energy level was the minimum for SWS measurement success. Light gray bars represent patients with shallow liver capsules (< 35 mm), and black bars represent patients with deeper liver capsules. Percentages indicate the proportion of patients with shallow livers for each energy level. The dashed line separates the energy level typical of commercial SWEI products from the elevated energies used in this study.
Table 3.
Patient details from the 6 patients without any successful SWS measurements.
| Number | BMI (kg/m2) | Liver capsule depth (mm) | Fibrosis stage |
|---|---|---|---|
| 1 | 33 | 35 | 3 |
| 2 | 36 | 40 | N/A |
| 3 | 32 | 45 | 4 |
| 4 | 39 | 50 | 2 |
| 5 | 55 | 50 | 1 |
| 6 | 56 | 50 | 4 |
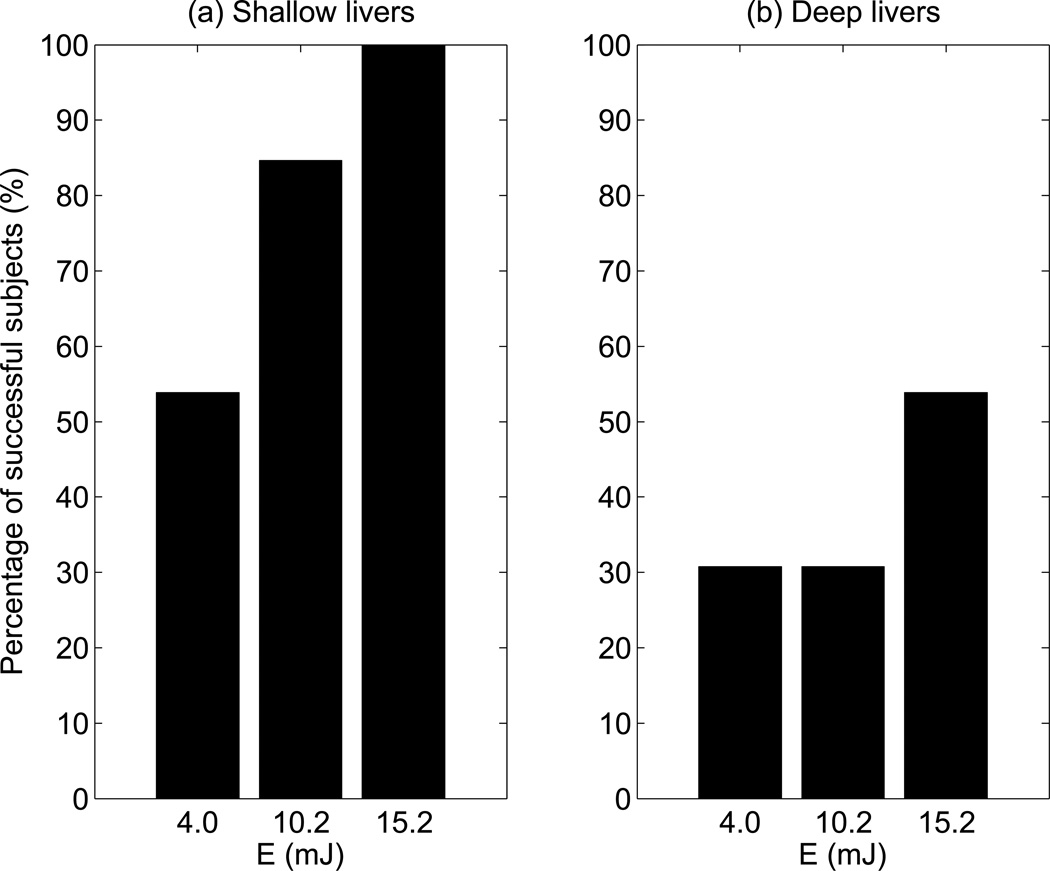
In order to determine whether patients with deep liver capsules had lower yield, the 26 study subjects were divided into 2 groups: one with shallow liver capsule depths less than 35 mm (light gray bars), and the other with liver capsule depths greater than 35 mm (black bars). The percentages in Figure 5 show the proportion of patients with shallow livers at each energy cut-off (i.e., the ratio of gray to black in each bar). The 5 patients that only succeeded at E ≥ 15.2 mJ and 6 failed patients had 60% and 100% deep livers, respectively. Figure 6 shows the percentage of study subjects that produced at least one SWS estimate at each push energy level for both shallow and deep livers. For patients with shallow livers, 54% succeeded at E = 4.0 mJ, and 100% succeeded at E = 15.2 mJ. In contrast, 31% of the patients with deep livers succeeded at E = 4.0 mJ, increasing to only 54% at E = 15.2 mJ.
Figure 6.
Percentage of successful subjects versus push energy levels for (a) patients with shallow livers (liver capsule depth < 35 mm), and for (b) patients with deep livers (liver capsule depth ≥ 35 mm).
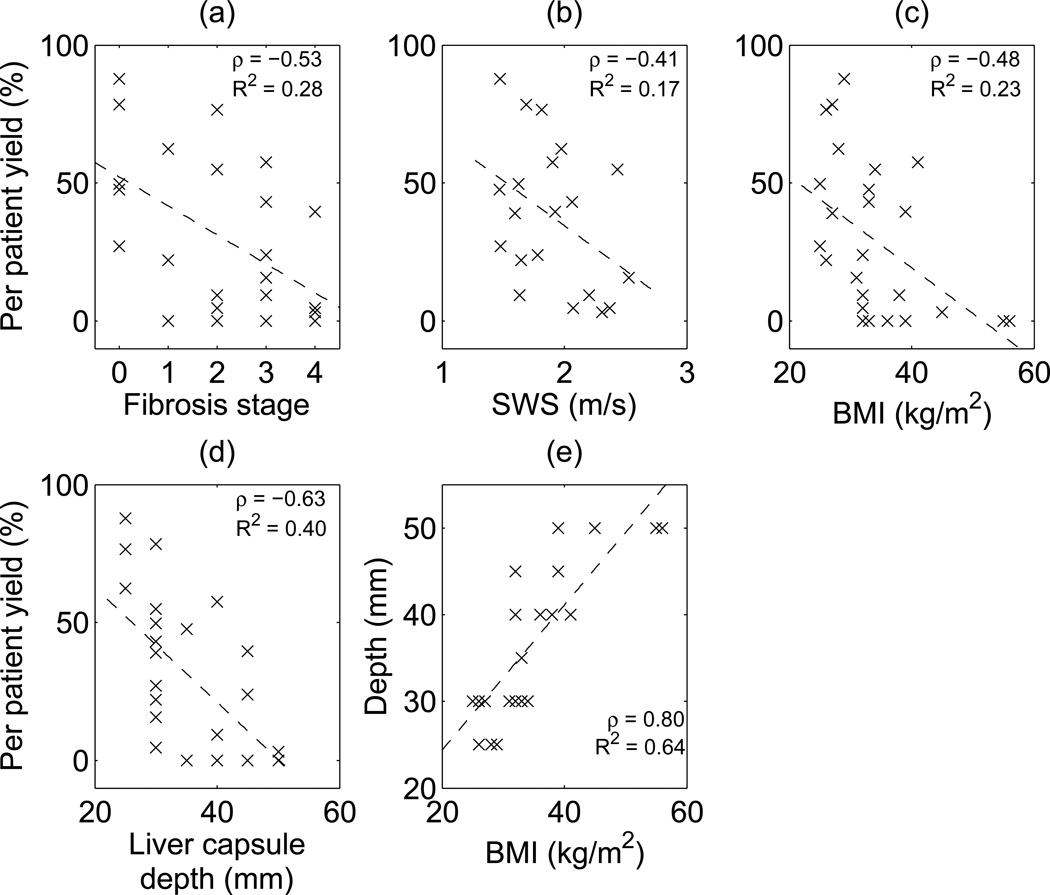
To further investigate other factors leading to lower yield, Figure 7 shows scatter plots of per-patient percent yield out of 64 SWEI measurements (8 repeated measurement × 8 energy levels) as a function of fibrosis stage, SWS, BMI and liver capsule depth, as well as a scatter plot of liver capsule depth versus BMI. Per-patient percent yield is moderately negatively correlated with fibrosis stage, SWS, and BMI; it is more strongly negatively correlated with liver capsule depth. There is also a strong positive correlation between BMI and liver capsule depth.
Figure 7.
Per patient percent yield (out of 8 repeated measurements × 8 energy levels = 64) versus (a) fibrosis stage, (b) SWS, (c) BMI and (d) liver capsule depth respectively. Dashed lines show the linear correlation, (e) shows the correlation between liver capsule depth and BMI. Correlation coefficients ρ and R2 values are shown for each plot.
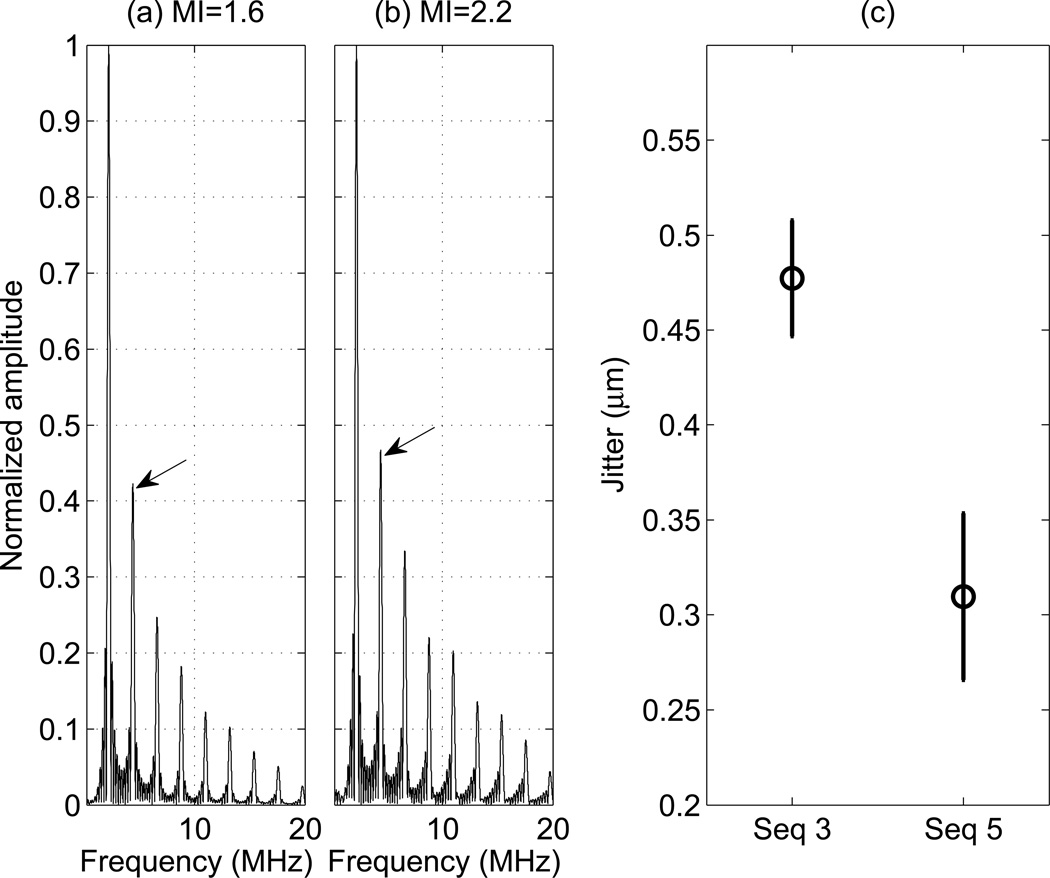
In order to assess the possible impact of increased track beam signal strength on yield, we evaluated both the jitter magnitude and harmonic content of tracking beams with different MI values in matched push energy sequences. Figure 8 shows the normalized frequency spectra of 10-cycle pressure waveforms at both MIs measured in an attenuating tissue mimicking fluid. The arrows point to the peaks of the second harmonics at 4.4 MHz. There is an 11% increase in the relative magnitude of the second harmonics comparing MI 2.2 to 1.6. Figure 8 (c) shows the jitter level for sequences 3 (MI = 1.6) and 5 (MI = 2.2), which each had an energy level of 8 mJ (Table 1), measured on a CIRS Zerdine™ homogeneous elastic phantom in a location away from the push with zero displacement. The jitter level of Seq 5 is significantly lower than that in Seq 3.
Figure 8.
(a)-(b): Normalized frequency spectra of the push pressure waveforms measured in a solution of evaporated milk and water with α = 0.5 dB/cm/MHz. The arrows point to the 2nd harmonics at 4.4 MHz. (c): The jitter level for Seq 3 and 5 specified in Table 1, measured on a tissue mimicking phantom with a shear modulus of 4 kPa. Seq 3 has MI 1.6 and Seq 5 has MI 2.2. The errorbars arise from repeated measurements from 5 independent speckle realizations.
Discussion
The Mechanical Index (MI) was developed to gauge the likelihood of inertial cavitation associated with diagnostic ultrasound, and its calculation is based upon the assumption of a pre-existing gas bubble in the path of the acoustic beam (Apfel and Holland, 1991). There are tissues in the body that naturally harbor gas bubbles, such as lungs and intestines. However, other biological tissues, such as the liver, are generally free of gas bubbles (O’Brien, 2007; Church et al., 2008). In such tissues, the requisite amplitude of the ultrasound field for inducing cavitation is relatively high, with one analysis indicating that the likelihood of cavitation using an MI of 4.0 in such tissues is 1 in 10,000,000,000 (Church et al., 2008). In 2012, the American Institute of Ultrasound in Medicine (AIUM) Technical Standards Committee convened a working group of its Output Standards Subcommittee to examine and report on the potential risks and benefits of increasing acoustic output levels under specific clinical imaging scenarios where there is strong expectation of a relatively high benefit-to-risk ratio. Liver imaging is one such scenario, and in this study, we compared SWEI performance using MIs of 1.6 and 2.2 in livers, where inertial cavitation is unlikely to occur due to the lack of pre-existing gas bubbles (O’Brien, 2007; Church et al., 2008).
From a tissue heating standpoint, these sequences were designed to operate within FDA guidelines, and temperature rises were less than 1 °C. The temperature rise at the transducer’s face for 1 measurement that consisted of all 8 SWEI sequences was measured to be 0.43 °C. This temperature rise was well tolerated by the study subjects. There was no report of patient discomfort due to transducer face heating during the study. The tissue focal temperature rise due to absorption was calculated to be 0.15 °C for each measurement of 8 SWEI sequences, using Equation (3) below (Palmeri and Nightingale, 2004).
| (3) |
Where ΔT is the focal temperature change, α is the ultrasonic attenuation of the tissue, I is the pulse-average intensity of the acoustic beam, cυ is the specific heat capacity for soft tissue (4.2 W·s/cm3/°C), and t is the pulse duration. No significant, adverse biological effects are expected from such small in vivo temperature rises (AIUM, 2009).
Figure 3 shows that percent yield linearly increases with increasing push energy. Figure 4 indicates that higher push energy leads to higher displacement, which provides higher signal level of the shear waves. Therefore, the SNR of the shear wave signal increases with increasing push energy. Based on these findings, we conclude that in the clinical environment, the number of repeated acquisitions necessary to obtain 10 successful SWS estimates would likely decrease with increasing push energy. Further, the total energy deposited into patients would decrease due to the corresponding decrease in the number of repeated acquisitions.
The ANOVA analysis indicated that the SWS estimates from different push energy levels are in agreement. Seventeen out of 19 subjects produced p-value > 0.05, indicating that there is no difference between SWS estimates from the 8 push energy levels in a given subject. Both of the remaining 2 subjects had few successful measurements and outliers for low energy levels. In other words, the SWS estimates obtained in this study from all push energy levels were in agreement when reproducible measurements were obtained (≥ 3 successful SWS estimates out of 8 repeated measures). We thus conclude that SWS is not dependent on pulse duration or MI, at least over the range of values explored herein.
The current FDA guidance specifies that acoustic pressure measurements be made in water, and derated by a factor of α = 0.3 dB/cm/MHz to account for frequency-dependent attenuation in tissue. In practice, a wide range of energy levels occur in vivo for a given system output due to differences in imaging location and patient-to-patient variability in attenuation. In this study, SWS was measured at a fixed depth (50 mm). However, due to liver capsule depth variability, the acoustic path from the transducer to the SWS imaging window varied significantly across study subjects. For the patient with the shallowest liver capsule, ultrasound waves traveled through 20 mm of subcutaneous tissue and 30 mm of liver tissue to reach the imaging window. On the other hand, for the patient with the deepest liver capsule, ultrasound waves traveled through 45 mm of subcutaneous tissue and only 5 mm of liver. Liver has a typical attenuation of 0.5 dB/cm/MHz, while connective tissue and fat have different attenuations of 0.68 dB/cm/MHz and 0.40 dB/cm/MHz respectively (Goss et al., 1978). Other factors such as liver fibrosis, inflammation, and steatosis further alter the in vivo energy level. As a result, a wide range of energy levels could occur for the same scanner energy (E) across study subjects, and the current derating approach using a single attenuation coefficient likely overestimates in situ acoustic energy levels in many cases. This is the reason displacement amplitudes were normalized in each patient for comparison across patients in Figure 4. Given this variability, one might consider using the liver capsule depth as an indicator of when the use of elevated energy might be beneficial, as discussed below.
All 6 subjects that failed at all energy levels had high BMIs and deep liver capsules, and three of these 6 subjects had advanced fibrosis, as shown in Table 3. This is consistent with previous studies (Yoon et al., 2014; Poynard et al., 2013). High liver capsule depth means that the ultrasound waves have to travel through more intervening tissue to reach the liver, leading to more pre-liver attenuation and thus smaller applied force. In addition, high BMI is typically associated with increased abberation both of the pushing and tracking pulses, which leads to decreased displacement magnitude and tracking SNR. Advanced fibrosis is associated with higher shear modulus (Palmeri et al., 2011), resulting in smaller displacements under the same magnitude of ARFI excitation. As shown in Figure 7, yield was moderately correlated with fibrosis stage (ρ = −0.53), SWS (ρ = −0.41) and BMI (ρ = −0.48), and yield was more strongly correlated with liver capsule depth (ρ = −0.63).
On the other hand, the elevated energy sequences (E ≥ 6.0 mJ) successfully obtained SWS estimates from 9 patients who otherwise failed, which comprised 35% the population in this study. Therefore, we conclude that there would be clinical benefit to using elevated output for SWEI measurements in these patients. Since the clinician would not have prior knowledge about a patient’s fibrosis stage or SWS information before SWEI is performed, liver capsule depth (or BMI, which were strongly correlated in these data (ρ = 0.80, Figure 7e)), could serve as a marker for the need of elevated output. Liver capsule depth describes the distance that the ultrasound wave has to travel to reach the liver, which is a direct indicator of the amount of attenuation and aberration caused by the adipose tissue above the liver. BMI, on the other hand, describes the human body as a whole. The actual distribution of the body weight can vary across the patient population. Figure 7 shows that per patient yield is more highly correlated to liver capsule depth (ρ = −0.63) than to BMI (ρ = −0.48). In this study, liver capsule depth higher than 35 mm was arbitrarily chosen as a marker for a difficult patient who would potentially benefit from SWS measurement with elevated energy levels. In Figure 5, 60% of the 5 patients who only produced successful SWS estimates at the highest energy level (E ≥ 15.2 mJ) and all of the 6 failed patients had deep livers. Figure 6 shows that 54% of patients with shallow livers had successful measurements at the energy level close to commercial systems (E = 4.0 mJ), in contrast to only 31% of patients with deep livers at this energy level. We thus conclude that SWS measurements in patients with deep livers are more likely to fail using standard push energy levels, where elevated output could enable successful SWS measurements.
For the pair of SWEI excitations with the same total energy (Seq 3 and 5 in Table 1, E = 8 mJ), high and low MI sequences were expected to produce similar numbers of successful SWS reconstructions. Figure 3 shows that the higher MI excitation had a moderately higher yield (30% total percent yield, 62 successful SWS reconstructions out of 208 measurements) compared to the same energy sequence with lower MI, longer pulses (25% total percent yield, 52 successful SWS reconstructions out of 208 measurements), as determined with a t-test (p < 0.07). We hypothesized that this could be explained by nonlinear enhancement of the radiation force impulse in higher MI excitations (Starritt et al., 1986), and/or by the improved tracking signal strength due to increased harmonic generation at the higher MI. If nonlinear force enhancement were present, then we would expect larger displacements in the higher MI sequence; however, no significant differences in displacement amplitude were observed between Seq 3 and 5 (Figure 4).
Since the displacement amplitudes were not significantly different between these sequences, the improved yield suggests a difference in tracking performance. To assess the signal quality of the tissue harmonic imaging (THI) tracking pulses, we quantified the jitter level in the data with matching push energies and differing MIs (Seq 3 and 5). In this study, both the push and tracking beams in a given sequence had the same MI due to experimental limitations. For tracking, a higher MI is preferable because it leads to improved harmonic imaging SNR. Figure 8 (a)-(b) show the frequency spectra of acoustic pulses measured in attenuating media. These measurements were made in a milk solution rather than water to more closely match the acoustic attenuation of tissue. Seq 5 (MI = 2.2) produced 11% higher energy in the second harmonics compared to Seq 3 (MI = 1.6). The enhanced harmonic generation associated with the higher excitation voltages used in Seq 5 results in increased ultrasound tracking signal amplitudes and reduced jitter levels. Figure 8(c) is consistent with this assessment, in that the jitter level of seq 5 is significantly lower than that of seq 3. We thus conclude that the decreased jitter associated with the MI = 2.2 sequences also contributed to improving the SWS measurement yield. Further studies are required to tease apart the impact of pushing versus tracking signal benefits in SWEI with elevated MI levels.
Conclusions
This study investigated the clinical benefit of using elevated push energy in hepatic SWEI measurements. Both the ARFI displacement magnitude and the rate of successful SWS reconstruction are shown to increase with increasing push energy level. Elevated push energy would require fewer trials to obtain a specified number of successful SWS estimates and would enable SWS measurement in previously failed patients. The successful SWS estimates from different energy levels are in agreement. The SWS yield was moderately correlated to fibrosis stage, SWS, BMI and was more strongly correlated with liver capsule depth. Liver capsule depth ≥ 35 mm was an indicator of lower yield in this study. Patients with deep liver capsules were more likely to fail at standard push energy levels and thus we conclude that these patients would benefit from elevated output.
Acknowledgements
We would like to thank Dawn Piercy and Yiping Pan for their help on patient recruitment and data collection during the study, as well as Siemens Medical Solutions USA, Ultrasound Division for their in-kind technical support. This work was supported by NIH grant R01EB002132.
Footnotes
Publisher's Disclaimer: This is a PDF file of an unedited manuscript that has been accepted for publication. As a service to our customers we are providing this early version of the manuscript. The manuscript will undergo copyediting, typesetting, and review of the resulting proof before it is published in its final citable form. Please note that during the production process errors may be discovered which could affect the content, and all legal disclaimers that apply to the journal pertain.
Disclosures
Some of the authors on this manuscript hold intellectual property related to ARFI imaging, and commercial licenses of this technology with Duke University exist.
References
- AIUM. American Institute of Ultrasound in Medicine Statement on Heat. 2009 [Google Scholar]
- AIUM/NEMA. Standard for Real-Time Display of Thermal and Mechanical Acoustic Output Indicies on Diagnostic Ultrasound Equipment. 1992 [Google Scholar]
- AIUM/NEMA. Acoustic output measurement standard for diagnostic ultrasound equipment. 1998 [Google Scholar]
- Apfel RE, Holland CK. Gauging the likelihood of cavitation from short-pulse, low-duty cycle diagnostic ultrasound. Ultrasound in Medicine and Biology. 1991;17:179–185. doi: 10.1016/0301-5629(91)90125-g. [DOI] [PubMed] [Google Scholar]
- Arena U, Platon ML, Stasi C, Moscarella S, Assarat A, Bedogni G, Piazzolla V, Badea R, Laffi G, Marra F, Mangia A, Pinzani M. Liver stiffness is influenced by a standardized meal in patients with chronic hepatitis C virus at different stages of fibrotic evolution. Hepatology. 2013;58:65–72. doi: 10.1002/hep.26343. [DOI] [PubMed] [Google Scholar]
- Bugianesi E, McCullough AJ, Marchesini G. Insulin resistance: a metabolic pathway to chronic liver disease. Hepatology (Baltimore, Md.) 2005;42:987–1000. doi: 10.1002/hep.20920. [DOI] [PubMed] [Google Scholar]
- Church CC. Spontaneous homogeneous nucleation, inertial cavitation and the safety of diagnostic ultrasound. Ultrasound in Medicine and Biology. 2002;28:1349–1364. doi: 10.1016/s0301-5629(02)00579-3. [DOI] [PubMed] [Google Scholar]
- Church CC, Carstensen EL, Nyborg WL, Carson PL, Frizzell LA, Bailey MR. The risk of exposure to diagnostic ultrasound in postnatal subjects: nonthermal mechanisms. Journal of ultrasound in medicine. 2008;27:565–592. doi: 10.7863/jum.2008.27.4.565. [DOI] [PubMed] [Google Scholar]
- Church CC, Labuda C, Nightingale K. A theoretical study of inertial cavitation from acoustic radiation force impulse imaging and implications for the mechanical index. Ultrasound in medicine & biology. 2015;41:472–85. doi: 10.1016/j.ultrasmedbio.2014.09.012. [DOI] [PMC free article] [PubMed] [Google Scholar]
- Church CC, Labuda C, Nightingale KR. Should the mechanical index be revised for ARFI imaging? IEEE International Ultrasonics Symposium : [proceedings] IEEE International Ultrasonics Symposium. 2012;2012:17–20. doi: 10.1109/ULTSYM.2012.0005. [DOI] [PMC free article] [PubMed] [Google Scholar]
- Doherty JR, Dahl JJ, Trahey GE. Harmonic tracking of acoustic radiation force-induced displacements. IEEE Transactions on Ultrasonics, Ferroelectrics, and Frequency Control. 2013;60:2347–2358. doi: 10.1109/TUFFC.2013.6644738. [DOI] [PMC free article] [PubMed] [Google Scholar]
- FDA. Diagnostic Ultrasound Guidance for 1993 [February 17, 1993, Revised 510 (k)] Rockville, MD: Center for Devices and Radiological Health. Food and Drug Administration, US Department of Health and Human Services; 1993. [Google Scholar]
- Fierbinteanu-Braticevici C, Andronescu D, Usvat R, Cretoiu D, Baicus C, Marinoschi G. Acoustic radiation force imaging sonoelastography for non-invasive staging of liver fibrosis. Bucharest, Romania: Tech. Rep. 44, Medical Clinic II and Gastroenterology, University Hospital; 2009. [DOI] [PMC free article] [PubMed] [Google Scholar]
- Fowlkes JB. Journal of ultrasound in medicine. Vol. 27. Basic Radiological Sciences Division. Ann Arbor: Department of Radiology, University of Michigan Health System, Kresge III, Room 3320, 200 Zina Pitcher PI; 2008. American Institute of Ultrasound in Medicine consensus report on potential bioeffects of diagnostic ultrasound: executive summary; pp. 503–515. MI 48109-0553 USA. fowlkes@umich.edu. [DOI] [PubMed] [Google Scholar]
- Friedrich-Rust M, Wunder K, Kriener S, Sotoudeh F, Richter S, Bojunga J, Herrmann E, Poynard T, Dietrich CF, Vermehren J, Zeuzem S, Sarrazin C. Liver fibrosis in viral hepatitis: noninvasive assessment with acoustic radiation force impulse imaging versus transient elastography. Radiology. 2009;252:595–604. doi: 10.1148/radiol.2523081928. [DOI] [PubMed] [Google Scholar]
- Goss SA, Johnston RL, Dunn F. Comprehensive compilation of empirical ultrasonic properties of mammalian tissues. The Journal of the Acoustical Society of America. 1978;64:423–457. doi: 10.1121/1.382016. [DOI] [PubMed] [Google Scholar]
- Haque M, Robinson C, Owen D, Yoshida EM, Harris A. Comparison of acoustic radiation force impulse imaging (ARFI) to liver biopsy histologic scores in the evaluation of chronic liver disease: A pilot study. Annals of hepatology. 2010;9:289–293. [PubMed] [Google Scholar]
- Horster S, Mandel P, Zachoval R, Clevert DA. Comparing Acoustic Radiation Force Impulse Imaging to transient elastography to assess liver stiffness in healthy volunteers with and without valsalva manoeuvre. Clinical Hemorheology and Microcirculation. 2010;46:159–168. doi: 10.3233/CH-2010-1342. [DOI] [PubMed] [Google Scholar]
- Ishak KG. Inherited metabolic diseases of the liver. Clinics in Liver Disease. 2002;6:455–479. doi: 10.1016/s1089-3261(02)00013-2. [DOI] [PubMed] [Google Scholar]
- Lazebnik R. Tissue Strain Analytics Virtual Touch Tissue Imaging and Quantification Tissue Strain Analytics Virtual Touch Tissue Imaging and Quantification. Malvern, PA: Siemens Healthcare; 2008. [Google Scholar]
- Loupas T, Powers J, Gill R. An axial velocity estimator for ultrasound blood flow imaging, based on a full evaluation of the Doppler Equation by Means of a Two-Dimensional Autocorrelation Approach. Ultrasonics. 1995 [Google Scholar]
- Lupsor M, Badea R, Stefanescu H, Sparchez Z, Branda H, Serban A, Maniu A. Performance of a new elastographic method (ARFI technology) compared to unidimensional transient elastography in the noninvasive assessment of chronic hepatitis C. Preliminary results. Journal of gastrointestinal and liver diseases. 2009;18:303–310. [PubMed] [Google Scholar]
- Manns MP, Kruger M. Immunogenetics of chronic liver diseases. Gastroenterology. 1994;106:1676–1697. doi: 10.1016/0016-5085(94)90427-8. [DOI] [PubMed] [Google Scholar]
- Mukaiya M, Nishi M, Miyake H, Hirata K. Chronic liver diseases for the risk of hepatocellular carcinoma: a case-control study in Japan. Etiologic association of alcohol consumption, cigarette smoking and the development of chronic liver diseases. 1998 [PubMed] [Google Scholar]
- O’Brien WD. Ultrasound-biophysics mechanisms. Progress in Biophysics and Molecular Biology. 2007;93:212–255. doi: 10.1016/j.pbiomolbio.2006.07.010. [DOI] [PMC free article] [PubMed] [Google Scholar]
- Palmeri ML, Nightingale KR. On the thermal effects associated with radiation force imaging of soft tissue. IEEE Transactions on Ultrasonics, Ferroelectrics, and Frequency Control. 2004;51:551–565. [PubMed] [Google Scholar]
- Palmeri ML, Wang MH, Dahl JJ, Frinkley KD, Nightingale KR. Quantifying hepatic shear modulus in vivo using acoustic radiation force. Ultrasound in medicine & biology. 2008;34:546–558. doi: 10.1016/j.ultrasmedbio.2007.10.009. [DOI] [PMC free article] [PubMed] [Google Scholar]
- Palmeri ML, Wang MH, Rouze NC, Abdelmalek MF, Guy CD, Moser B, Diehl AM, Nightingale KR. Noninvasive evaluation of hepatic fibrosis using acoustic radiation force-based shear stiffness in patients with nonalcoholic fatty liver disease. Journal of Hepatology. 2011;55:666–672. doi: 10.1016/j.jhep.2010.12.019. [DOI] [PMC free article] [PubMed] [Google Scholar]
- Park H, Park JY, Kim DY, Ahn SH, Chon CY, Han KH, Kim SU. Characterization of focal liver masses using acoustic radiation force impulse elastography. World journal of gastroenterology : WJG. 2013;19:219–226. doi: 10.3748/wjg.v19.i2.219. [DOI] [PMC free article] [PubMed] [Google Scholar]
- Pinton GF, Dahl JJ, Trahey GE. Rapid tracking of small displacements with ultrasound. IEEE Trans. Ultrason.,Ferroelec.,Freq. Contr. 2006;53:1103–1117. doi: 10.1109/tuffc.2006.1642509. [DOI] [PubMed] [Google Scholar]
- Piscaglia F, Salvatore V, Di Donato R, D'Onofrio M, Gualandi S, Gallotti A, Peri E, Borghi A, Conti F, Fattovich G, Sagrini E, Cucchetti A, Andreone P, Bolondi L. Accuracy of virtualTouch acoustic radiation force impulse (ARFI) imaging for the diagnosis of cirrhosis during liver ultrasonography. Ultraschall in der Medizin. 2011;32:167–175. doi: 10.1055/s-0029-1245948. [DOI] [PubMed] [Google Scholar]
- Poynard T, Bedossa P, Opolon P. Natural history of liver fibrosis progression in patients with chronic hepatitis C. Lancet. 1997;349:825–832. doi: 10.1016/s0140-6736(96)07642-8. [DOI] [PubMed] [Google Scholar]
- Poynard T, Munteanu M, Luckina E, Perazzo H, Ngo Y, Royer L, Fedchuk L, Sattonnet F, Pais R, Lebray P, Rudler M, Thabut D, Ratziu V. Liver fibrosis evaluation using real-time shear wave elastography: Applicability and diagnostic performance using methods without a gold standard. Journal of Hepatology. 2013;58:928–935. doi: 10.1016/j.jhep.2012.12.021. [DOI] [PubMed] [Google Scholar]
- Rouze NC, Wang MH, Palmeri ML, Nightingale KR. Robust estimation of time-of-flight shear wave speed using a Radon sum transformation. IEEE Trans. Ultrason.,Ferroelec.,Freq. Contr. 2010;57:2662–2670. doi: 10.1109/TUFFC.2010.1740. [DOI] [PMC free article] [PubMed] [Google Scholar]
- Sarvazyan AP, Rudenko OV, Swanson SD, Fowlkes JB, Emelianov SY. Shear wave elasticity imaging: A new ultrasonic technology of medical diagnostics. Ultrasound in Medicine and Biology. 1998;24:1419–1435. doi: 10.1016/s0301-5629(98)00110-0. [DOI] [PubMed] [Google Scholar]
- Sporea I, Bota S, Sftoiu A, Sirli R, Gradinaru-Tascau O, Popescu A, Lupsor Platon M, Fierbinteanu-Braticevici C, Gheonea DI, Sandulescu L, Badea R. Romanian national guidelines and practical recommendations on liver elastography. Medical ultrasonography. 2014;16:123–38. doi: 10.11152/mu.201.3.2066.162.is1sb2. [DOI] [PubMed] [Google Scholar]
- Starritt HC, Duck FA, Hawkins AJ, Humphrey VF. The development of harmonic distortion in pulsed finite-amplitude ultrasound passing through liver. Physics in medicine and biology. 1986;31:1401–1409. doi: 10.1088/0031-9155/31/12/007. [DOI] [PubMed] [Google Scholar]
- Stiles TA, Madsen EL, Frank GR. An Exposimetry System Using Tissue-Mimicking Liquid. Ultrasound in Medicine and Biology. 2008;34:123–136. doi: 10.1016/j.ultrasmedbio.2007.06.023. [DOI] [PubMed] [Google Scholar]
- Tong MJ, El-Farra NS, Reikes AR, Co RL. Clinical outcomes after transfusion-associated hepatitis C. The New England journal of medicine. 1995;332:1463–1466. doi: 10.1056/NEJM199506013322202. [DOI] [PubMed] [Google Scholar]
- Wang MH, Palmeri ML, Rotemberg VM, Rouze NC, Nightingale KR. Improving the robustness of time-of-flight based shear wave speed reconstruction methods using RANSAC in human liver in vivo. Ultrasound in Medicine and Biology. 2010;36:802–813. doi: 10.1016/j.ultrasmedbio.2010.02.007. [DOI] [PMC free article] [PubMed] [Google Scholar]
- Wear KA, Gammell PM, Maruvada S, Liu Y, Harris GR. Improved measurement of acoustic output using complex deconvolution of hydrophone sensitivity. IEEE transactions on ultrasonics, ferroelectrics, and frequency control. 2014;61:62–75. doi: 10.1109/TUFFC.2014.6689776. [DOI] [PMC free article] [PubMed] [Google Scholar]
- Wieckowska A, McCullough AJ, Feldstein AE. Noninvasive diagnosis and monitoring of nonalcoholic steatohepatitis: present and future. Hepatology (Baltimore, Md.) 2007;46:582–589. doi: 10.1002/hep.21768. [DOI] [PubMed] [Google Scholar]
- Yoon JH, Lee JM, Han JK, Choi BI. Shear wave elastography for liver stiffness measurement in clinical sonographic examinations: evaluation of intraobserver reproducibility, technical failure, and unreliable stiffness measurements. Journal of ultrasound in medicine. 2014;33:437–447. doi: 10.7863/ultra.33.3.437. [DOI] [PubMed] [Google Scholar]


