

Abstract
Objective:
To evaluate the possible early consequences of impaired glucose metabolism on the brain by assessing the relationship of diabetes, fasting blood glucose (FBG) levels, and insulin resistance with cognitive performance and brain integrity in healthy young and middle-aged adults.
Methods:
The sample included dementia-free participants (mean age 40 ± 9 years; 53% women) of the Framingham Heart Study third-generation cohort with cognitive testing of memory, abstract reasoning, visual perception, attention, and executive function (n = 2,126). In addition, brain MRI examination (n = 1,597) was used to determine white matter, gray matter, and white matter hyperintensity (WMH) volumes and fractional anisotropy measures. We used linear regression models to assess relationships between diabetes, FBG, and insulin resistance with cognition, lobar gray matter, and WMH volumes as well as voxel-based microstructural white matter integrity and gray matter density, adjusting for potential confounders. Mediating effect of brain lesions on the association of diabetes with cognitive performance was also tested.
Results:
Diabetes was associated with worse memory, visual perception, and attention performance; increased WMH; and decreased total cerebral brain and occipital lobar gray matter volumes. The link of diabetes with attention and memory was mediated through occipital and frontal atrophy, and the latter also through hippocampal atrophy. Both diabetes and increased FBG were associated with large areas of reductions in gray matter density and fractional anisotropy on voxel-based analyses.
Conclusions:
We found that hyperglycemia is associated with subtle brain injury and impaired attention and memory even in young adults, indicating that brain injury is an early manifestation of impaired glucose metabolism.
Type 2 diabetes has been consistently associated with an increased risk of incident dementia,1,e1 as well as with cognitive deficits2,3,e2,e3 and increased brain atrophy, even in individuals without dementia.3–5,e4–e6 Similarly, hyperglycemia and insulin resistance without clinically diagnosed diabetes have been related to poorer cognitive and brain measures, particularly atrophy of the hippocampus.6,e7,e8
It is clear that dementia risk factors impose their effect from the earliest stages of life,7 and indeed, midlife exposure to diabetes and to other dementia risk factors is more strongly predictive of dementia than late-life exposure.8,e9 Nevertheless, data on early implications of impaired glucose metabolism on cognitive function and structural brain aging in young adults are scarce.9,10
The third generation of the Framingham Heart Study was recruited when the participants were 40 years of age on average.11 In spite of the relatively young age of the participants, high systolic blood pressure was shown to be associated with subtle vascular brain injury in this sample, suggesting that newer imaging techniques may be able to identify structural brain differences in association with vascular risk factors years before symptomatic disease expression.12 Accordingly, we sought to assess the relationship of diabetes, fasting blood glucose (FBG), and insulin resistance with early cognitive and structural brain measures in this cohort, and to examine whether specific brain injuries mediate the association of diabetes with cognition. Our findings may emphasize the need for early and optimal control of glucose metabolism indices in order to prevent brain injury and thus possibly late-life dementia.
METHODS
Study sample.
The Framingham Heart Study is a single-site, longitudinal community-based cohort study which was initiated in 1948. Since its inception, 3 generations of participants have been enrolled, and participants from the third-generation cohort are included in the current study (figure e-1 on the Neurology® Web site at Neurology.org). Of 6,553 participants eligible for enrollment, 4,095 participants attended the first examination between 2002 and 2005 (53.3% women; mean age 40 ± 9 years; age range 19–72 years).11 Information on prevalent diabetes, levels of FBG and fasting insulin, as well as the covariates used in the current study have been ascertained from the first examination. Participants who also attended examination 2 (n = 3,411, between 2008 and 2011) underwent a cognitive screening that included the Consortium to Establish a Registry for Alzheimer's Disease Word List Memory Task (CERAD-WL) and the Victoria Stroop test. Forty-nine participants were excluded and the rest were re-invited to participate in a detailed cognitive evaluation (n = 2,126) as well as MRI examination (n = 1,597). The reasons for lower number of participants with MRI data were refusals and contraindications.
Standard protocol approvals, registrations, and patient consents.
Data were obtained under a protocol approved by the institutional review board of the Boston University Medical Center, and written informed consent was obtained from all participants.
Independent variables and covariate assessment.
FBG and insulin were measured in fasting morning blood samples. Diabetes mellitus was defined as blood glucose ≥200 mg/dL or FBG ≥126 mg/dL or use of an antidiabetic therapy; FBG <100 mg/dL and 100–126 mg/dL were defined as normoglycemia and prediabetes, respectively; Homeostatic Model Assessment–Insulin Resistance (HOMA-IR) was calculated as (FBG × fasting insulin)/22.5. Body mass index (BMI) was defined as weight (kg) divided by the square of height (m). Hypertension was defined as systolic blood pressure ≥140 mm Hg, diastolic blood pressure ≥90 mm Hg, or use of antihypertensive medications. Educational achievement was defined as a 3-class variable (no high school degree, high school degree only, or at least a college degree).
Methodology for cognitive evaluation.
Participants were administered a cognitive test battery using standard administration protocols and trained examiners. The CERAD-WL (total, recall, and retention scores)13 and the Victoria Stroop test (interference score) were included as part of a screening evaluation performed between 2008 and 2011. A more detailed neuropsychological battery was obtained at or near the time of MRI and consisted of the following: the delayed recall component of the Visual Reproductions test (VR-d), similarities (SIM), Hooper visual organization test (HVOT), Trails A (TrA), and digit span forward (DSF) and backwards (DSB). These tests asses cognitive performance in logical and visual memory, abstract reasoning, visual perception, attention, and executive function.
Methodology for brain MRI evaluation.
Participants were evaluated with a 1.5-T Siemens Avanto scanner. Three sequences were used: 3D T1-weighted coronal spoiled gradient-recalled echo acquisition, fluid-attenuated inversion recovery (FLAIR) sequence, and diffusion tensor imaging (DTI). Methods for segmentation and quantification of total cerebral brain, hippocampal, white matter hyperintensities (WMH), and gray matter have been described previously.14,e10–e13 Total cranial volume based on FLAIR was used to correct for differences in head size, total cerebral brain, and WMH volumes.
Fractional anisotropy (FA) was calculated from DTI.12,15 FA and gray matter density maps were coregistered to a minimum deformation template.15,16 In these coregistered images, each voxel corresponds to the same location in the brain across all individuals, enabling the association of both FA and gray matter density measures to various independent variables. FA values range between 0 and 1.
Statistical analyses.
We used linear regression models to relate each vascular risk factor to measures of cognitive performance and brain structure. Cognitive scores were standardized to allow comparisons between performances in different cognitive tests.17 FBG and HOMA-IR were inversely transformed to account for skewness. TrA, DSF, and DSB scores are time to completion; however, they are presented such that lower score indicates poorer performance in order to be consistent with the other measures. Adjustments were made for age, sex, and time between exposure and outcome measurements, and additionally for hypertension and BMI in a subsequent model. Models that included cognitive measures as the dependent variable were also adjusted for education.
Linear regression models were also used to test for significance (p < 0.05) of the associations between FA and gray matter density at each voxel with the 3 independent variables (FBG, diabetes, and HOMA-IR) adjusting for covariates. Resulting T-maps were evaluated for statistical significance using threshold free cluster enhancement at the p < 0.05 level and corrected for multiple comparison using permutation-based correction (n = 1,000).18 Corrected T-maps were then overlaid with The Johns Hopkins University probabilistic fiber map19 and the Brodmann area (BA) atlases, warped to the minimum deformation template space, to provide a post hoc description of white matter tracts or gray matter regions to which the significant voxels likely belonged.
A post hoc mediation analysis was conducted in order to assess whether the association between diabetes and cognitive outcomes in the current study was mediated through certain structural brain measures. We have run mediation analysis using linear regression models adjusting for age, sex, and time between measurements only for cognitive outcomes for which diabetes was significantly related to directly (without mediation). A standard path analytic approach was followed to assess the relationship between diabetes and the mediator, the mediator and the dependent variable while controlling for the independent variable, and finally, the direct effect of diabetes on the dependent variable, controlling for the mediator. We have generated bias-corrected estimate of the indirect effects from 2,000 bootstrap iterations, a method that is recommended since it does not assume normality distribution of the indirect effect.20
We generated a composite measure of brain integrity by using a principal component analysis on FA and gray matter density measures from regions in which these measures were significantly associated with FBG.21 We examined the relationship of the first principal component with age and FBG categories (normoglycemia, prediabetes, and diabetes) adjusting for sex, hypertension, and BMI. The goodness of fit of the model, as assessed by the likelihood ratio test, was better when we entered both linear and quadratic terms rather than the linear effect of age alone (p = 0.021), and thus we included the age-squared term in this regression model. Since a statistically significant interaction between age and FBG categories was not observed, we removed the interaction term from the model. This model enables the estimation of number of years necessary to achieve the same loss of brain integrity (years of brain aging) comparing one FBG category to another, for a specific age.
RESULTS
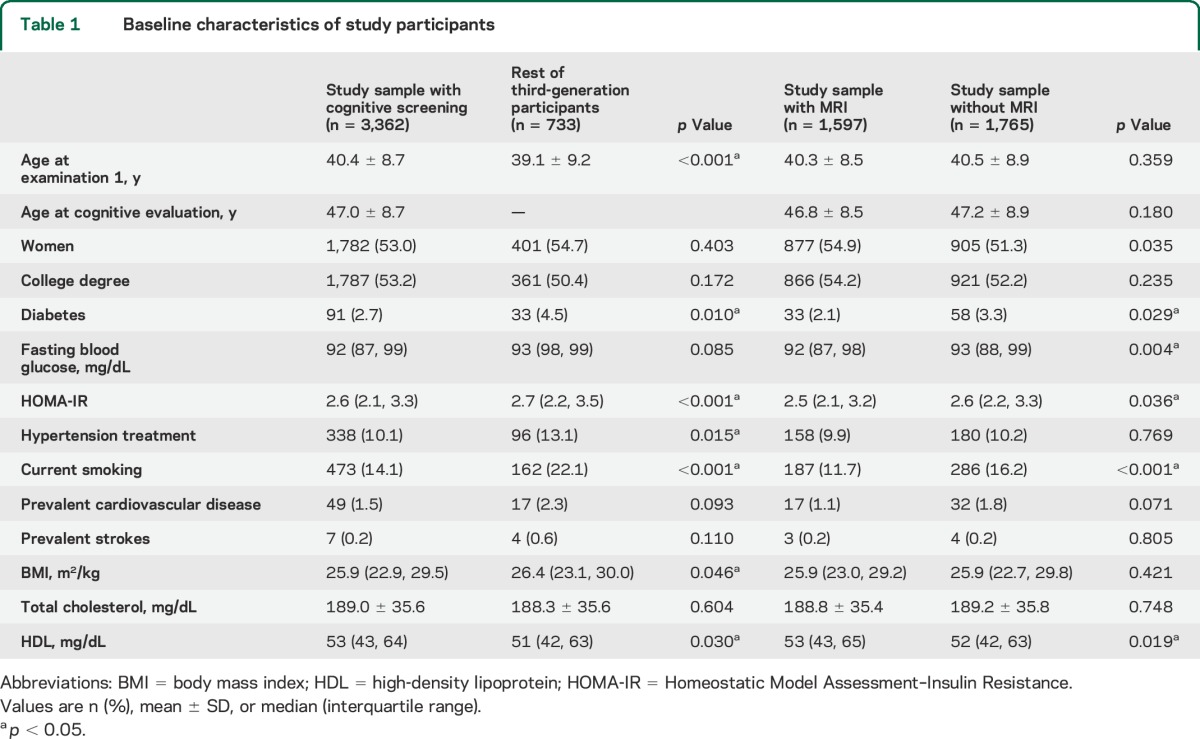
At the first assessment of the third generation (n = 4,095; between 2002 and 2005), 53.3% were women and their mean age was 40 ± 9 years (range 19–72 years). The characteristics of the study samples at examination 1 and a comparison between those who did and did not attend cognitive screening and MRI are presented in table 1. The mean time durations between examination 1 and cognitive and brain MRI assessments were 6.1 ± 0.6 and 7.4 ± 0.7 years, respectively.
Table 1.
Baseline characteristics of study participants
Cognition.
After adjustment for potential confounders, diabetes was significantly associated with poorer performance on CERAD-WL, VR-d, SIM, HVOT, TrA, and DSF (table 2). All associations except that of diabetes with HVOT were still significant after exclusion of individuals aged 55 years and over (data not tabulated). The most pronounced association was of diabetes with attention deficit as assessed by the TrA test. We did not observe statistically significant associations between either FBG or HOMA-IR and cognitive measures in the fully adjusted models (table 2).
Table 2.
Associations of diabetes, fasting blood glucose, and insulin resistance with cognitive and brain MRI measures
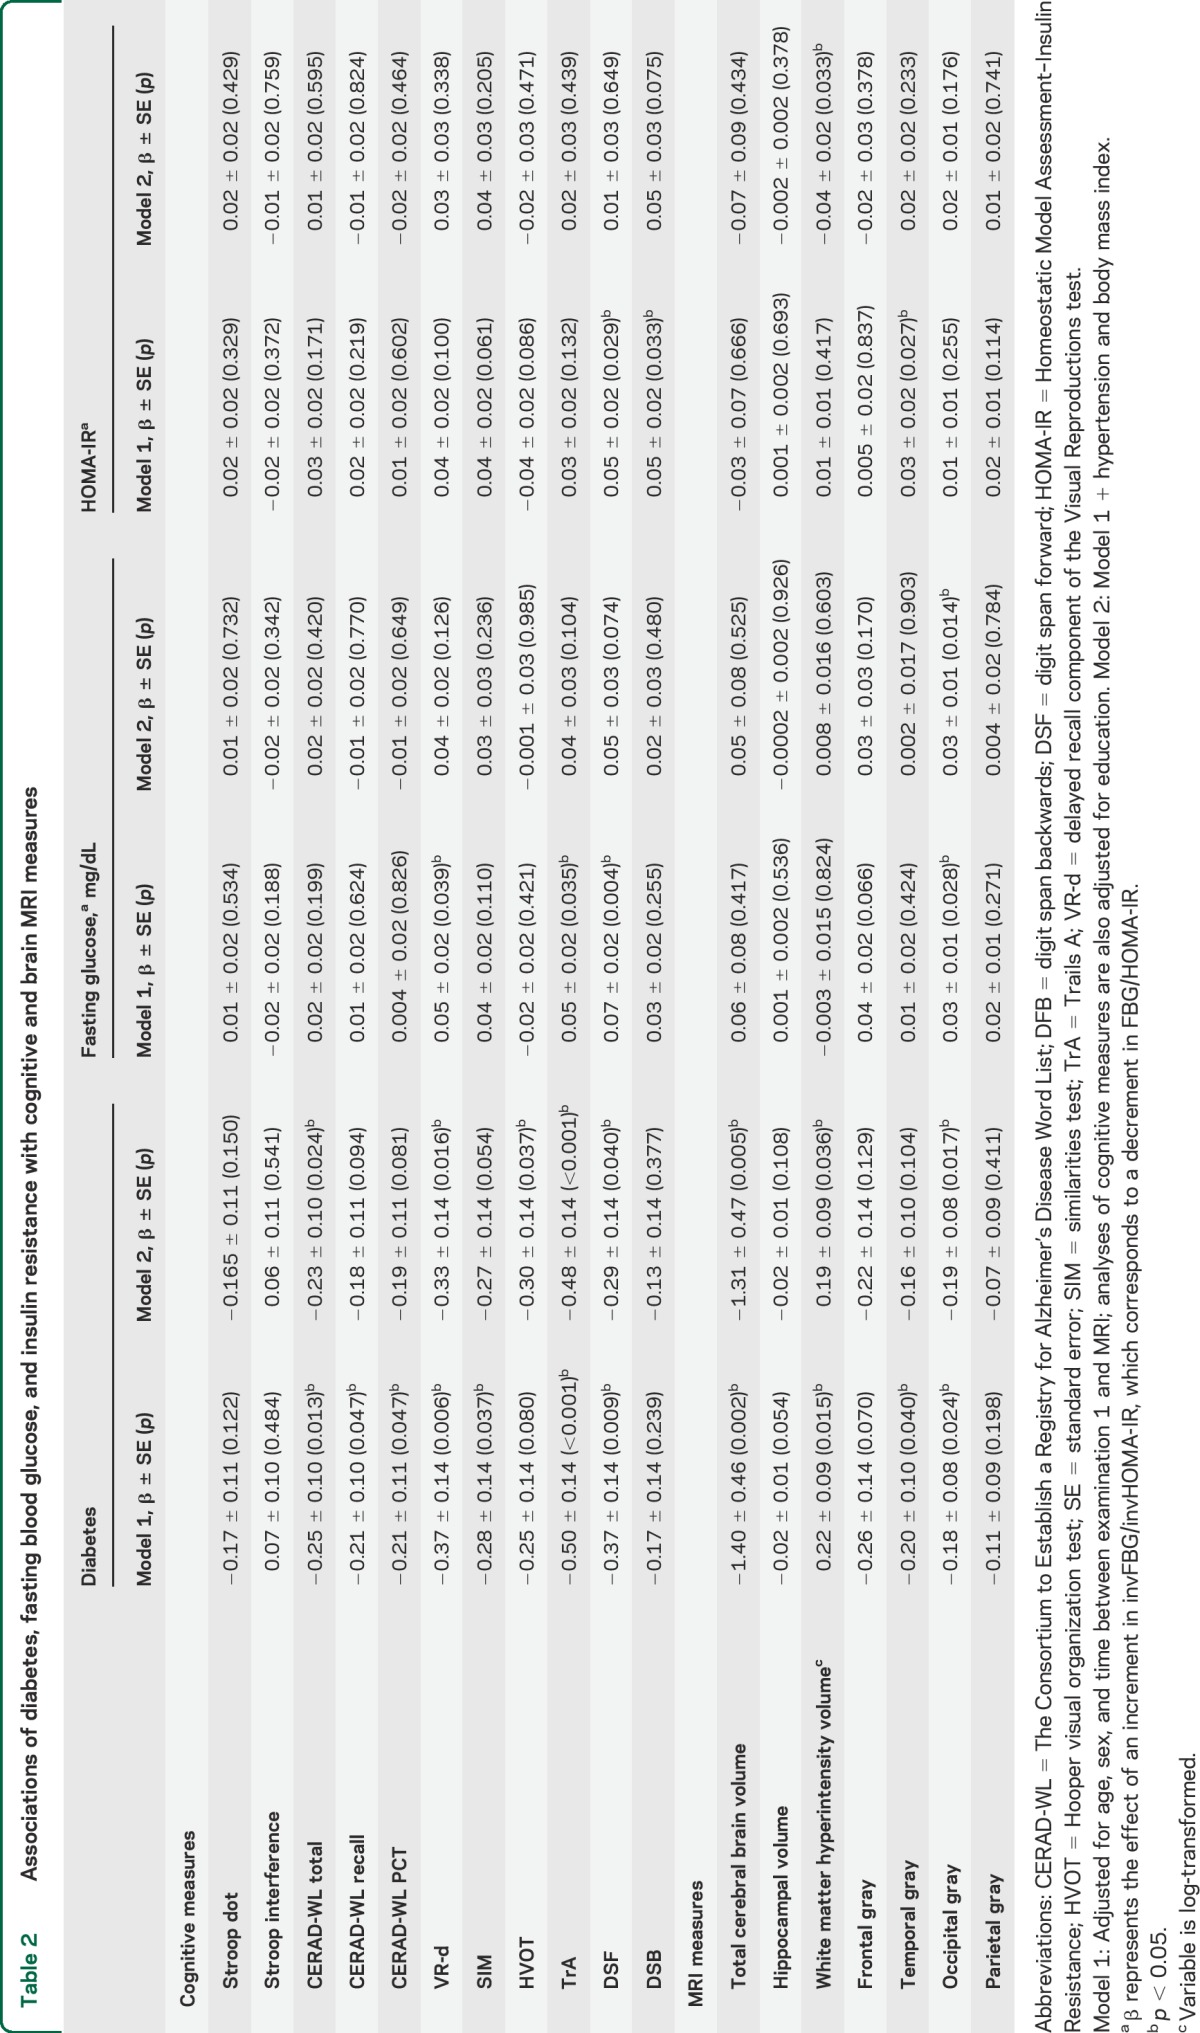
MRI measures.
After adjusting for potential confounders, diabetes was significantly associated with lower total cerebral brain and occipital gray matter volumes and with larger WMH volume, although the latter was not significant when only people younger than 55 years were included. Increased FBG levels were associated with smaller occipital gray matter volume (table 2). Insulin resistance was related to larger WMH volume, but only in the model that includes additional adjustment for hypertension and BMI (table 2).
At the voxel-based level, diabetes and greater FBG were each independently associated with lower FA within white matter tracts that covered 124 cm3 and 46.8 cm3, respectively (figures 1 and e-2; table e-1). Tracts mostly implicated in those associations were the short association fibers, the inferior longitudinal fasciculus, the thalamic radiations, and the corpus callosum (figure e-2, A and B; table e-1).
Figure 1. 3D view of cerebral regions in which increased fasting blood glucose and diabetes are associated with decreased fractional anisotropy and gray matter density.

(A–D) The voxel-based regression included fractional anisotropy or gray matter density as the dependent variable and blood glucose or diabetes as independent variables. Age, sex, time between examination 1 and MRI, hypertension, and body mass index were covariates.
Diabetes and increasing FBG also were associated with lower gray matter density within voxels that covered 114.0 cm3 and 42.9 cm3, respectively. The strongest associations with FBG were found in the occipital and temporal regions and included BA 37, 19, and 20. The strongest associations between gray matter density and diabetes were similarly found in the occipital and temporal regions but not within the frontal and parietal regions (figure e-2, C and D; table e-1).
The relationship between diabetes and poorer attention performance (TrA) was mediated through smaller total cerebral brain, frontal lobe, and occipital gray volumes. The association of diabetes with deficit in visual memory was mediated through the same brain measures and also by hippocampal atrophy. Although abstract reasoning performance was also poorer in people with diabetes, neither total nor regional brain volume measures assessed in this study mediated this association.
Brain integrity was associated with younger age (β = −8.7 × 10⁻⁴, 95% confidence interval [CI] −1.4 × 10⁻³ to −3.2 × 10⁻⁴; p = 0.0021). Moreover, there was a dose-dependent relationship between brain integrity and categories of FBG levels, such that people with normal levels had higher measure of brain integrity, followed by people with prediabetes (β = −0.23, 95% CI −0.35 to −0.11; p = 0.00028) and those with diabetes (β = −0.54, 95% CI −0.67 to −0.41; p < 0.0001). There was no interaction between FBG categories and brain integrity in relation to age (figure 2; p = 0.83), suggesting an increasing but only additive effect within this relatively young age group of participants.
Figure 2. Regression curves.

Regression curves relating brain integrity as expressed by the first principal component as a function of fasting blood glucose category and age of the individual (A) and the difference in brain aging increase between glucose categories according to age (B). Red dotted lines indicate brain integrity of a 40-year-old patient by glucose level category. Brain integrity of a 40-year-old prediabetic individual corresponds to that of a normoglycemic individual 6.1 years older, and this difference is 23.2 years when comparing the brain integrity of 40-year-old diabetic and normoglycemic individuals. Brain integrity is calculated from brain regions in which fractional anisotropy and gray matter density are significantly associated with fasting blood glucose. aNormoglycemia (fasting blood glucose <100 mg/dL). bPrediabetes (fasting blood glucose between 100 and 126 mg/dL). cDiabetes (fasting blood glucose >126 mg/dL).
No significant associations of HOMA-IR with FA or gray matter density were found.
Voxel-based analysis results excluding individuals aged 55 years and over did not significantly affect the findings (data not tabulated).
DISCUSSION
Our findings suggest that young adults and middle-aged persons with diabetes perform worse on tasks of verbal and visual memory, visual perception, and attention, and have greater brain atrophy (total and regional), WMH, and injury to white matter microstructure compared to persons without diabetes. Diabetes was related to attention deficit through the mediation of neurodegeneration of the total brain as well as the frontal and occipital brain, and the deficit in memory also by hippocampal atrophy. FBG and insulin resistance were not associated with cognitive performance in this young sample; however, gray matter atrophy and reduced white matter integrity were already observed in people with higher FBG levels in similar regions, albeit to a lesser extent compared to diabetic people. Finally, we found a graded association between FBG in the normal, prediabetic, and diabetic ranges and a summary measure of brain integrity.
Many studies suggest that an association between diabetes and cognition is present only in older adults (>60 years of age) and hypothesize that substantial exposure to diabetes is necessary to cause impairment.22,23,e9 To our knowledge, we are the first study to suggest a possible role of glucose metabolism impairment on brain integrity and cognition in people in their third to early fifth decades of life. Other attempts to explore the early consequences of diabetes were done by demonstrating an effect of diabetes on cognition among elderly individuals with newly diagnosed diabetes9,24 or by showing that cognitive performance in persons with incident diabetes is worse compared to those without but better than those with prevalent diabetes.2,e14 These studies, as well as a previous study among obese adolescents,10 suggest that memory may be the first domain affected by diabetes. We expand these findings by showing that in addition to memory, deficits in attention and visual perception may also occur early.
In line with our findings, associations with smaller brain volume in various regions as well as with increased WMH have been frequently reported among older people.25,26,e15–e18 Although consistent data suggest that hippocampal atrophy is evident early in diabetes9 and is even present in older people with prediabetes,6,e7 our study did not find a robust association between diabetes or FBG and hippocampus volume. This can be explained by the relatively short exposure in young participants. It is also possible that subtle changes such as subregional hippocampal atrophy,27 or early neuronal or synaptic loss,28,e19 occur independently of total hippocampal volume changes, and could not be detected using the current methods. Alternatively, injury to white matter tracts seen in our participants may have also impaired information transfer from frontal to hippocampal systems, thereby impairing recall.29,e20
Nevertheless, hippocampal volume in the current sample did act as a mediator, linking diabetes to memory deficit, but not to attention and visual perception.
Although several endocrine, metabolic, and vascular abnormalities have been inferred to underlie the structural changes in diabetic brains, the causal pathway remains unknown. The fact that no association between insulin resistance and cognitive or structural measures was demonstrated in the current study is supported by recent findings in which measures of glucose and insulin homeostasis were not associated with Alzheimer disease pathology at autopsy.30 Nevertheless, since insulin resistance in the brain does not necessarily reflect its peripheral correlate,31 this mechanism, as well as the possible contribution of insulin itself, its transport, or degradation to cerebral atrophy and neurodegeneration, cannot be excluded.32 The apparent increase in WMH in people with increased FBG and diabetes may reflect ischemic cerebrovascular disease, which in turn may cause neuronal apoptosis and brain atrophy through impaired blood flow to the neurovascular unit. This is consistent with postmortem studies that suggest that cognitive decline associated with diabetes is due to vascular brain injury.33,e21 Hyperglycemia may also increase the formation of advanced glycation end products, which promote oxidative stress, cross-linking of amyloid fibrils, modification of cytoskeletal tau proteins, and inflammation.34,35 Likewise, inflammatory cytokines associated with diabetes such as interleukin-6, C-reactive protein, and homocysteine have been shown to be associated with cerebral atrophy.35
Our findings suggest the strongest associations of diabetes and FBG with reduced FA and gray matter density diffusely in white matter, but more specific to temporal, parietal, and occipital cortex gray matter. As expected, the associations in these brain regions are stronger in diabetes as compared to FBG levels. Reduced FA in these brain regions (particularly the corpus callosum) has been reported among elderly people with Alzheimer disease,36,e22 and thus may explain the poor cognitive performance among diabetic participants in the current study. The impact of diabetes on reduced posterior cingulate gray matter (figure e-2, C and D) may have similar effects.
The strengths of this study are the large, population-based setting with quantitative and sensitive measurements of white and gray matter volumes. Original features are the younger age of the study sample compared with previous publications and simultaneous measurements of cognitive and structural brain indices, which enabled a post hoc mediation analysis. Because of the participants' young age, however, only a relatively small number of persons with diabetes were included in the sample, leading to possible overestimation of diabetes effect on brain and cognition. This is less likely given that a similar although less strong effect was found when examining FBG as a continuous measure. Moreover, the cross-sectional design did not permit exploration of the association between duration of diabetes or hyperglycemia, cognitive, and brain MRI measures. In addition, people who underwent cognitive and MRI evaluations were slightly healthier than the rest of the third-generation participants. This, however, suggests that these findings likely underestimate the effect of impaired glucose metabolism on brain structure and cognition within the general population. Finally, a substantial number of associations between diabetes and cognitive performance were made without correction for multiple comparisons. It is likely that a small fraction of the associations are falsely positive, but the number of significant associations was much more than could be expected by chance and the veracity of these associations was supported by similar significant findings when fasting glucose levels were considered as a continuous variable. Given the relatively young age of this cohort, we believe these findings are real; however, longitudinal cognitive assessment of these individuals would help to confirm them.
The current results, in combination with our prior report on the effects of hypertension on brain structure,12 highlight the importance of controlling vascular risk factors among younger individuals with the aim to preventing accelerated brain aging and cognitive impairment. In studies among elderly individuals, improvements in diabetes control have been associated with mixed results.37–39 For example, in the ACCORD Memory in Diabetes study, 2,977 individuals with type 2 diabetes (mean age 62.3 years) were randomized either to an intensive glycemic therapeutic strategy targeting (HbA1c to <6%) or to a standard strategy targeting (HbA1c between 7% and 7.9%). Intensive glycemic control was associated with increased mortality and therefore discontinued. Over a follow-up of 40 months, however, there was no evidence that intensive glycemic control improved cognitive ability, although a small difference in brain volume atrophy was observed in favor of the intensive therapy arm.37 These results suggest that late-life treatment of chronic disease may not be nearly as effective as preventive strategies aimed at treatment of individuals, either earlier in the course of the illness or at a younger age. The long-term effects of prevention of vascular risk factors on later life cognition are not certain, but accruing evidence suggests that early prevention of brain injury and reduced cognitive performance are likely to reduce later-life impairments. These results reaffirm the notion that the brain is an important end-organ of vascular disease.40
Supplementary Material
GLOSSARY
- BA
Brodmann area
- BMI
body mass index
- CERAD-WL
Consortium to Establish a Registry for Alzheimer's Disease Word List Memory Task
- CI
confidence interval
- DSB
digit span backward
- DSF
forward
- DTI
diffusion tensor imaging
- FA
fractional anisotropy
- FBG
fasting blood glucose
- FLAIR
fluid-attenuated inversion recovery
- HOMA-IR
Homeostatic Model Assessment–Insulin Resistance
- HVOT
Hooper visual organization test
- SIM
similarities test
- TrA
Trails A
- VR-d
delayed recall component of the Visual Reproductions test
- WMH
white matter hyperintensity
Footnotes
Editorial, page 2300
Supplemental data at Neurology.org
AUTHOR CONTRIBUTIONS
Drs. DeCarli and Seshadri had full access to all the data in the study and take responsibility for the integrity of the data and the accuracy of the data analysis. Study concept and design: Drs. Weinstein, Maillard, Wolf, Seshadri, DeCarli. Acquisition of data: Drs. Weinstein, Beiser, Au, DeCarli, Wolf, Seshadri. Analysis and interpretation of data: Drs. Weinstein, Maillard, Himali, Beiser. Drafting of the manuscript: Dr. Weinstein. Critical revision of the manuscript for important intellectual content: Drs. Weinstein, Beiser, Au, Wolf, Seshadri, DeCarli. Statistical analysis: Drs. Maillard, Beiser. Obtained funding: Drs. Wolf, Seshadri. Study supervision: Drs. Seshadri, DeCarli.
STUDY FUNDING
Supported by the dedication of the Framingham Heart Study participants, the National Heart, Lung and Blood Institute's Framingham Heart Study (contract no. N01-HC-25195), and grants from the National Institute of Neurological Disorders and Stroke (NS017950), the National Heart, Lung and Blood Association (HL93029, U01HL 096917), and the National Institute on Aging (AG008122, AG016495, AG033193, AG033040, P30AG013846). The content is solely the responsibility of the authors and does not necessarily represent the official views of the National Institute of Neurological Disorders and Stroke, the National Heart Lung and Blood Institute, the National Institute of Aging, or the NIH.
DISCLOSURE
The authors report no disclosures relevant to the manuscript. Go to Neurology.org for full disclosures.
REFERENCES
- 1.Lu FP, Lin KP, Kuo HK. Diabetes and the risk of multi-system aging phenotypes: a systematic review and meta-analysis. PLoS One 2009;4:e4144. [DOI] [PMC free article] [PubMed] [Google Scholar]
- 2.Yaffe K, Falvey C, Hamilton N, et al. Diabetes, glucose control, and 9-year cognitive decline among older adults without dementia. Arch Neurol 2012;69:1170–1175. [DOI] [PMC free article] [PubMed] [Google Scholar]
- 3.Qiu C, Sigurdsson S, Zhang Q, et al. Diabetes, markers of brain pathology, and cognitive cognition: the AGES-Reykjavik Study. Ann Neurol 2014;75:138–146. [DOI] [PMC free article] [PubMed] [Google Scholar]
- 4.Debette S, Seshadri S, Beiser A, et al. Midlife vascular risk factor exposure accelerates structural brain aging and cognitive decline. Neurology 2011;77:461–468. [DOI] [PMC free article] [PubMed] [Google Scholar]
- 5.Falvey CM, Rosano C, Simonsick EM, et al. Macro- and microstructural magnetic resonance imaging indices associated with diabetes among community-dwelling older adults. Diabetes Care 2013;36:677–682. [DOI] [PMC free article] [PubMed] [Google Scholar]
- 6.Kerti L, Witte AV, Winkler A, Grittner U, Rujescu D, Floel A. Higher glucose levels associated with lower memory and reduced hippocampal microstructure. Neurology 2013;81:1746–1752. [DOI] [PubMed] [Google Scholar]
- 7.Barnett JH, Hachinski V, Blackwell AD. Cognitive health begins at conception: addressing dementia as a lifelong and preventable condition. BMC Med 2013;11:246. [DOI] [PMC free article] [PubMed] [Google Scholar]
- 8.Tolppanen AM, Solomon A, Soininen H, Kivipelto M. Midlife vascular risk factors and Alzheimer's disease: evidence from epidemiological studies. J Alzheimers Dis 2012;32:531–540. [DOI] [PubMed] [Google Scholar]
- 9.Gold SM, Dziobek I, Sweat V, et al. Hippocampal damage and memory impairments as possible early brain complications of type 2 diabetes. Diabetologia 2007;50:711–719. [DOI] [PubMed] [Google Scholar]
- 10.Yau PL, Javier DC, Ryan CM, et al. Preliminary evidence for brain complications in obese adolescents with type 2 diabetes mellitus. Diabetologia 2010;53:2298–2306. [DOI] [PMC free article] [PubMed] [Google Scholar]
- 11.Splansky GL, Corey D, Yang Q, et al. The third generation cohort of the National Heart, Lung, and Blood Institute's Framingham Heart Study: design, recruitment, and initial examination. Am J Epidemiol 2007;165:1327–1335. [DOI] [PubMed] [Google Scholar]
- 12.Maillard P, Seshadri S, Beiser A, et al. Effects of systolic blood pressure on white-matter integrity in young adults in the Framingham Heart Study: a cross-sectional study. Lancet Neurol 2012;11:1039–1047. [DOI] [PMC free article] [PubMed] [Google Scholar]
- 13.Morris JC, Heyman A, Mohs RC, et al. The Consortium to Establish a Registry for Alzheimer's Disease (CERAD): part I: clinical and neuropsychological assessment of Alzheimer's disease. Neurology 1989;39:1159–1165. [DOI] [PubMed] [Google Scholar]
- 14.DeCarli C, Massaro J, Harvey D, et al. Measures of brain morphology and infarction in the Framingham Heart Study: establishing what is normal. Neurobiol Aging 2005;26:491–510. [DOI] [PubMed] [Google Scholar]
- 15.Lee DY, Fletcher E, Martinez O, et al. Regional pattern of white matter microstructural changes in normal aging, MCI, and AD. Neurology 2009;73:1722–1728. [DOI] [PMC free article] [PubMed] [Google Scholar]
- 16.Kochunov P, Lancaster JL, Thompson P, et al. Regional spatial normalization: toward an optimal target. J Comput Assist Tomogr 2001;25:805–816. [DOI] [PubMed] [Google Scholar]
- 17.Au R, Seshadri S, Wolf PA, et al. New norms for a new generation: cognitive performance in the Framingham offspring cohort. Exp Aging Res 2004;30:333–358. [DOI] [PubMed] [Google Scholar]
- 18.Smith SM, Nichols TE. Threshold-free cluster enhancement: addressing problems of smoothing, threshold dependence and localisation in cluster inference. Neuroimage 2009;44:83–98. [DOI] [PubMed] [Google Scholar]
- 19.Zhang Y, Zhang J, Oishi K, et al. Atlas-guided tract reconstruction for automated and comprehensive examination of the white matter anatomy. Neuroimage 2010;52:1289–1301. [DOI] [PMC free article] [PubMed] [Google Scholar]
- 20.Preacher KJ, Hayes AF. Asymptotic and resampling strategies for assessing and comparing indirect effects in multiple mediator models. Behav Res Methods 2008;40:879–891. [DOI] [PubMed] [Google Scholar]
- 21.Venables WN, Ripley BD. Modern Applied Statistics with S, 4th ed New York: Springer; 2002. [Google Scholar]
- 22.Ryan CM, Geckle M. Why is learning and memory dysfunction in type 2 diabetes limited to older adults? Diabetes Metab Res Rev 2000;16:308–315. [DOI] [PubMed] [Google Scholar]
- 23.Biessels GJ, Deary IJ, Ryan CM. Cognition and diabetes: a lifespan perspective. Lancet Neurol 2008;7:184–190. [DOI] [PubMed] [Google Scholar]
- 24.Ruis C, Biessels GJ, Gorter KJ, van den Donk M, Kappelle LJ, Rutten GE. Cognition in the early stage of type 2 diabetes. Diabetes Care 2009;32:1261–1265. [DOI] [PMC free article] [PubMed] [Google Scholar]
- 25.Tan ZS, Beiser AS, Fox CS, et al. Association of metabolic dysregulation with volumetric brain magnetic resonance imaging and cognitive markers of subclinical brain aging in middle-aged adults: the Framingham Offspring Study. Diabetes Care 2011;34:1766–1770. [DOI] [PMC free article] [PubMed] [Google Scholar]
- 26.King KS, Peshock RM, Rossetti HC, et al. Effect of normal aging versus hypertension, abnormal body mass index, and diabetes mellitus on white matter hyperintensity volume. Stroke 2014;45:255–257. [DOI] [PMC free article] [PubMed] [Google Scholar]
- 27.Carmichael O, Xie J, Fletcher E, Singh B, DeCarli C. Localized hippocampus measures are associated with Alzheimer pathology and cognition independent of total hippocampal volume. Neurobiol Aging 2012;33:1124.e1131–1124.e1141. [DOI] [PMC free article] [PubMed] [Google Scholar]
- 28.Andrade-Moraes CH, Oliveira-Pinto AV, Castro-Fonseca E, et al. Cell number changes in Alzheimer's disease relate to dementia, not to plaques and tangles. Brain 2013;136:3738–3752. [DOI] [PMC free article] [PubMed] [Google Scholar]
- 29.Lockhart SN, Mayda AB, Roach AE, et al. Episodic memory function is associated with multiple measures of white matter integrity in cognitive aging. Front Hum Neurosci 2012;6:56. [DOI] [PMC free article] [PubMed] [Google Scholar]
- 30.Thambisetty M, Jeffrey Metter E, Yang A, et al. Glucose intolerance, insulin resistance, and pathological features of Alzheimer disease in the Baltimore Longitudinal Study of Aging. JAMA Neurol 2013;70:1167–1172. [DOI] [PMC free article] [PubMed] [Google Scholar]
- 31.Talbot K, Wang HY, Kazi H, et al. Demonstrated brain insulin resistance in Alzheimer's disease patients is associated with IGF-1 resistance, IRS-1 dysregulation, and cognitive decline. J Clin Invest 2012;122:1316–1338. [DOI] [PMC free article] [PubMed] [Google Scholar]
- 32.Cholerton B, Baker LD, Craft S. Insulin resistance and pathological brain ageing. Diabet Med 2011;28:1463–1475. [DOI] [PubMed] [Google Scholar]
- 33.Arvanitakis Z, Wilson RS, Bennett DA. Diabetes mellitus, dementia, and cognitive function in older persons. J Nutr Health Aging 2006;10:287–291. [PubMed] [Google Scholar]
- 34.Srikanth V, Maczurek A, Phan T, et al. Advanced glycation endproducts and their receptor RAGE in Alzheimer's disease. Neurobiol Aging 2011;32:763–777. [DOI] [PubMed] [Google Scholar]
- 35.Whitmer RA. Type 2 diabetes and risk of cognitive impairment and dementia. Curr Neurol Neurosci Rep 2007;7:373–380. [DOI] [PubMed] [Google Scholar]
- 36.Nir TM, Jahanshad N, Villalon-Reina JE, et al. Effectiveness of regional DTI measures in distinguishing Alzheimer's disease, MCI, and normal aging. Neuroimage Clin 2013;3:180–195. [DOI] [PMC free article] [PubMed] [Google Scholar]
- 37.Launer LJ, Miller ME, Williamson JD, et al. Effects of intensive glucose lowering on brain structure and function in people with type 2 diabetes (ACCORD MIND): a randomised open-label substudy. Lancet Neurol 2011;10:969–977. [DOI] [PMC free article] [PubMed] [Google Scholar]
- 38.Meneilly GS, Cheung E, Tessier D, Yakura C, Tuokko H. The effect of improved glycemic control on cognitive functions in the elderly patient with diabetes. J Gerontol 1993;48:M117–M121. [DOI] [PubMed] [Google Scholar]
- 39.Gradman TJ, Laws A, Thompson LW, Reaven GM. Verbal learning and/or memory improves with glycemic control in older subjects with non-insulin-dependent diabetes mellitus. J Am Geriatr Soc 1993;41:1305–1312. [DOI] [PubMed] [Google Scholar]
- 40.DeCarli C. Cerebrovascular disease: assessing the brain as an end-organ of vascular disease. Nat Rev Cardiol 2012;9:435–436. [DOI] [PMC free article] [PubMed] [Google Scholar]
Associated Data
This section collects any data citations, data availability statements, or supplementary materials included in this article.