

Abstract
Background
Binge alcohol consumption is associated with multiple neurobiological consequences, including altered neurophysiology, brain structure and functional activation. Magnetic resonance spectroscopy (MRS) studies have demonstrated neurochemical alterations in the frontal lobe of alcohol users, although most studies focused on older, alcohol dependent subjects.
Methods
In this study, neurochemical data were acquired using MRS at 4T from emerging adults (18–24 years old) who were binge alcohol drinkers (BD, n=23) or light drinkers (LD, n=31). Since binge drinking is also associated with increased prevalence of experiencing an alcohol-induced blackout, BD were stratified into alcohol-induced blackout (BDBO) and non-blackout groups (BDN).
Results
Overall, BD had significantly lower gamma amino-butyric acid (GABA) and N-acetyl-aspartate (NAA) in the anterior cingulate cortex (ACC) than LD. When stratified by blackout history, BDBO also had lower ACC glutamate (Glu) than LD. No group differences in MRS metabolites were observed in the parietal-occipital cortex. Lower ACC GABA and glutamate remained significant after accounting for lower grey matter content in BD, however NAA differences were no longer evident. In addition, low ACC GABA levels were associated with greater alcohol use consequences, and worse response inhibition and attention/mental flexibility in BD.
Conclusions
These data indicate that binge drinking affects frontal lobe neurochemistry, more so in those who had experienced an alcohol-induced blackout. Characterization of the neurochemical profiles associated with binge alcohol consumption and blackout history may help identify unique risk factors for the later manifestation of alcohol abuse and dependence, in young individuals who are heavy, frequent drinkers, but who do not meet the criteria for alcohol use disorders.
Keywords: emerging adult, MRS, GABA, ACC, binge alcohol
Introduction
Alcohol use is linked to the third highest number of preventable deaths in the United States (Mokdad et al., 2004). Alcohol experimentation typically begins during adolescence, increasing from 2.6% of 12 year-olds to 67.5% of 21 year-olds reporting consumption (SAMHSA, 2010). As prevalence of use increases with age, drinking patterns and quantity of alcohol consumed likewise increase, reaching heavy episodic, or binge-like, levels. Binge consumption is a pattern of drinking that generally increases blood alcohols levels to 0.08 gram% or greater over a two hour period, which is typically 5+ drinks for adult men and 4+ drinks for adult women (NIAAA, 2004). Binge alcohol consumption reaches a prevalence of 38.7% in individuals 18–24 years of age, peaking at 48.2% at age 21 (SAMHSA, 2010). Reported adverse consequences of binge drinking 18–24 years old include unintentional deaths, alcohol-related injuries, assaults, cases of sexual abuse, reports of unsafe sex, and alcohol-related health problems (Hingson et al., 2009). Heavy episodic alcohol consumption may also lead to the development of alcohol abuse and dependence (Knight et al., 2002). It is therefore not surprising that the highest rate of alcohol dependence also occurs within this 18–24 year old age group.
The period of ages 18–24 has been referred to as “emerging adulthood”, a time characterized as having greater functional independence and competence than adolescence, but less so than adulthood (Arnett, 2001). Magnetic resonance techniques applied to characterize brain development have demonstrated that rapid structural and functional brain changes associated with adolescence do not plateau until after age 20, with the majority of the fine-tuning continuing to occur primarily frontal and association cortices (Giedd et al., 1996). Such brain changes permit improvements in frontally-mediated cognitive abilities including decision-making and response inhibition, while decreasing impulsive behavior (Casey et al., 2000). Therefore, investigation of the dynamic vulnerability of the developing brain beyond what is often referred to as adulthood (age 18+) is warranted, particularly given the exceedingly high prevalence of heavy alcohol use during this age span.
Heavy alcohol consumption is associated with significant structural and functional brain abnormalities (Oscar-Berman and Marinkovic, 2007; Sullivan and Pfefferbaum, 2005), as well as altered cerebral metabolites (Meyerhoff et al., 2013) in adult populations. Alterations are particularly prominent in the prefrontal cortex, likely contributing to alcohol-related executive function deficits and supporting a frontal dysfunction hypothesis in alcohol use disorders (Moselhy et al., 2001). To date, the majority of magnetic resonance spectroscopy (MRS) studies examining neurochemical changes associated with alcohol dependence report reductions in N-acetyl-aspartate (NAA) and choline (Cho) in frontal lobe regions of active heavy drinkers and alcohol dependent individuals, relative to light drinkers or non-drinking comparison subjects (Meyerhoff et al., 2013). Reductions in NAA are thought to reflect neuronal loss or altered cerebral metabolism (Moffett et al., 2007), whereas reductions in Cho may reflect altered cellular membrane synthesis and degradation (Bayindir et al., 2012). There is less evidence for abnormalities in creatine (Cr) and myo-Inositol (mI) associated with chronic alcohol use, although decreased Cr likely reflects altered cell bioenergetics (Andres et al., 2008) and elevated mI reflects proliferation of glial cells (Coupland et al., 2005). Importantly, recovery of metabolite levels has been observed in association with increasing length of alcohol abstinence and recovery of neurocognitive function (Meyerhoff and Durazzo, 2008).
Of the existing MRS studies in alcohol-dependent populations, only five studies to date have reported on brain gamma amino-butyric acid (GABA) (Abe et al., 2013; Behar et al., 1999; Gomez et al., 2011; Mason et al., 2006; Mon et al., 2012), despite advances in detection and quantification methods. It has been well established that GABA is relevant to alcohol responsiveness, dependence, alcoholism vulnerability, and pharmacological interventions for alcoholism (Krystal et al., 2006). For instance, healthy young adult social drinkers administered alcohol via intravenous infusion exhibit decreased GABA in occipital cortex (OCC), which is consistent with alcohol’s ability to potentiate the GABA system (Gomez et al., 2011). Levels of GABA+homocarnosine were lower in recently detoxified alcohol-dependent patients (34±20 days sober) relative to comparison subjects (Behar et al., 1999), however, no GABA differences were observed in alcohol-dependent patients after one-week or one-month of abstinence in a later study, although GABA changes associated with duration of abstinence were dependent on smoking status (Mason et al., 2006). More recently, no GABA differences were observed between one-month abstinent alcohol dependent individuals compared to healthy non-users in the anterior cingulate cortex (ACC), dorsolateral prefrontal cortex (DLPFC) or parieto-occipital cortex (POC) (Mon et al., 2012). A trend for lower ACC GABA was observed, however, in alcohol-dependent poly-substance users compared to alcohol dependent patients and healthy comparison subjects (Abe et al., 2013). Thus, MRS-derived GABA levels in recently abstinent older adults appear largely unaffected relative to similarly-aged healthy comparison subjects, with GABA abnormalities in the ACC trending towards significance in concurrent alcohol and illicit drug users.
Existing MRS GABA studies have generally included older alcohol dependent or recently abstinent alcoholic males, and limited studies have included adequate numbers of females to examine sex differences. In light of recent data indicating that frontal lobe GABA levels rise developmentally from adolescence to emerging adulthood (Silveri et al., 2013), the objective of the present study was to examine the impact of heavy episodic alcohol use on GABA and other ACC proton metabolites in emerging adult binge alcohol drinkers (BD) relative to light drinkers (LD). The POC was included as a comparison region to test the hypothesis that the late-maturing prefrontal cortex is differentially sensitive to the neurobiological consequences of binge alcohol consumption. Binge drinking is commonly associated with increased prevalence of experiencing an alcohol-induced blackout (Read et al., 2013), a phenomenon in which intake of a substance, alcohol in this case, is associated with impairment of memory formation or retrieval. Given evidence of alterations in brain activation during inhibitory processing and contextual memory associated with blackout status in individuals who consume alcohol (Wetherill et al., 2013; Wetherill and Fromme, 2011), BD in the current study were stratified into those reporting having experienced an alcohol-induced blackout (BDBO) and those who had never experienced an alcohol-induced blackout (BDN). It was hypothesized that BD would exhibit lower GABA levels than LD in the ACC but not POC, and that there would be a greater magnitude of neurochemical alterations in BD self-reporting alcohol-induced blackouts. Alterations in frontal lobe metabolites were hypothesized to correlate with worse neuropsychological functioning on frontally-mediated cognitive tasks.
Methods and Materials
Participants
Participants included were fifty-four 18–24 year-old BD (n=23) and LD (n=31), with the former further stratified into BDBO (n=14) and BDN (n=9) groups. Participant demographic information and drinking experience are provided in Table 1. The clinical research protocol was approved by the Institutional Review Board of McLean Hospital. After complete study description, participants provided written informed consent. Participants completed urine screening prior to scanning to rule out current psychoactive substance use and pregnancy, and a breath alcohol screen to confirm no recent alcohol use (Alco Sensor II, Intoxicometers Inc.). Participants were free of psychiatric diagnoses based on the Structured Clinical Interview for DSM-IV Non-Patient Edition (First et al., 2002). Participants had no prior head trauma or loss of consciousness, and were free of radiologic brain abnormalities, MR scanning contraindications, or current psychoactive substance use, including nicotine, except one BDBO female who reported smoking one cigarette per day. Given that menstrual cycle phase is reported to influence brain GABA levels (Silveri et al., 2013), the majority of women in this study were recruited and scanned during the follicular phase (89%, cycle days 2–9, average day at scanning 5.9±2.8), with the exception of n=2 LD women scanned in the luteal phase (cycle days 13–32, average day at scanning 17.0±1.4) and n=1 LD for whom menstrual cycle information was not provided.
Table 1.
Demographic and Alcohol Use Measures
| Measures | LD (n=27)a | BD (n=21)b | p |
|---|---|---|---|
| % Female | 48% | 48% | ns |
| Age | 21.6±1.7 | 21.9±1.2 | ns |
| Education | 14.6±1.5 | 14.9±1.2 | ns |
| College Attendance (current, completed 4 year degree, some attendance) | 59.3%, 37.0%, 3.7% | 90.5%, 4.8%, 4.8% | – |
| SES | 50.4±11.9 | 55.2±9.3 | ns |
| Handedness | 27R, 0L | 20R, 1L | – |
| BMI | 22.8±3.3 | 24.2±2.8 | ns |
| % FH+ for alcoholism | 26% | 29% | ns |
| BDN: 35% | |||
| BDBO: 23% | |||
| FH density | 0.15±0.30 | 0.14±0.26 | ns |
| Age of onset of alcohol use | 18.3±2.1 | 17.3±1.4 | .06 |
| Days since last use | 13.1±15.0 | 5.9±4.8 | .04 |
| Average # of drinks/drinking episode (past 3 mo) | 1.7±1.1 | 5.0±2.0 | <.0001 |
| Average # of drinks/week (past 3 mo) | 1.4±1.6 | 11.8±14.2 | <.0001 |
| Average # of drinking days/week (past 3 mo) | 0.7±0.5 | 1.8±0.7 | <.0001 |
| Average number of drinking occasions per month (past 3 mo) | 2.6±2.2 | 7.3±3.1 | <.0001 |
| Estimated blood alcohol level | 0.02±0.03 | 0.11±0.06 | <.0001 |
| Lifetime episodes: alcohol-induced vomiting | 1.3±1.5 | 3.2±3.6 | .01 |
| BDN: 1.7±1.7 | |||
| BDBO: 4.5±4.5* | |||
| Lifetime episodes: alcohol-induced blackout | 0.0±0.0 | 1.2±2.3 | .008 |
| BDN: 0.0±0.0, BDBO: 1.9±2.8* | |||
| AUDIT scorec | 2.7±1.8 | 7.8±2.0 | <.0001 |
Data represent mean values±SD. Abbreviations: LD, light drinkers; BD, binge drinker; ns, not statistically significant. Subject numbers reflect
n=3 LD not included in analyses because of positive blackout status and n=1 LD had poor spectral data;
n=2 BD had poor spectral data.
AUDIT scores reported from n=17 LD, n=16 BD (n=5 BDN, n=11 BDBO).
BDBO only significantly different from LD and BDN groups.
Alcohol Use, Clinical and Cognitive Measures
Participants completed an alcohol use questionnaire using the Time Line Follow-Back protocol (Sobell and Sobell, 1995) and blood alcohol levels (BALs) were estimated for each day of drinking over the past 30 days (Hustad and Carey, 2005). Participants were administered the Alcohol Use Disorders Identification Test (AUDIT) to gauge binge drinking, dependence symptoms, and alcohol-related problems (Saunders et al., 1993) and completed the Young Adult Alcohol Consequences Questionnaire (YAACQ), which is categorized into eight dimensions: social–interpersonal consequences, impaired control, self-perception, self-care, risk behaviors, academic/occupational consequences, physical dependence, and blackout drinking (Read et al., 2007) (Table 2). Blackout status in BD was determined based on self-report of lifetime blackouts, and from a question on the AUDIT: “How often during the last year have you been unable to remember what happened the night before because you had been drinking?” and from questions from the YAACQ: Q24 – “I have woken up in an unexpected place after heavy drinking.”; Q32 – “I’ve not been able to remember large stretches of time while drinking heavily.”; Q37 – “I have awakened the day after drinking and found that I could not remember a part of the evening before.”; Q47 – “I have had a blackout after drinking heavily (i.e., could not remember hours at a time)”. Three LD reported having experienced a blackout according to these measures, and were subsequently excluded from analyses. Family history of alcoholism status was determined during the clinical interview. Participants met criteria for FH+ status if a history of alcohol abuse or dependence was reported in parents or grandparents, and family history density of alcoholism was then calculated (Zucker et al., 1994).
Table 2.
Alcohol Consequences Questionnaire (YAACQ)
| Measures | LD (n=27) | BD (n=20)a | p | BDN (n=8) | BDBO (n=12)a | p |
|---|---|---|---|---|---|---|
| YAACQ | ||||||
| Social-Interpersonal Consequences | 1.0±1.3 | 6.4±4.4 | <.0001 | 4.1±2.4 | 7.9±4.8 | <.0001 |
| Impaired Control | 1.4±1.6 | 7.2±4.6 | <.0001 | 4.6±2.1 | 8.8±5.1 | <.0001 |
| Self-Perception | 1.6±1.6 | 7.8±4.8 | <.0001 | 5.1±2.6 | 9.6±5.1 | <.0001 |
| Self-Care | 1.4±1.6 | 7.1±4.7 | <.0001 | 4.5±2.5 | 8.8±5.1 | <.0001 |
| Risk Behaviors | 1.5±1.6 | 6.9±4.5 | <.0001 | 4.6±2.0 | 8.4±5.2 | <.0001 |
| Academic/Occupational Consequences | 1.6±1.7 | 7.8±4.9 | <.0001 | 5.1±2.6 | 9.6±5.4 | <.0001 |
| Physical Dependence | 1.6±1.6 | 7.7±5.2 | <.0001 | 4.9±2.5 | 9.5±5.8* | <.0001 |
| Blackout Drinking | 1.0±1.2 | 5.2±4.1 | <.0001 | 2.9±2.1 | 6.8±4.4* | <.0001 |
| Total Score | 1.6±1.7 | 8.0±5.2 | <.0001 | 5.1±2.6 | 9.9±5.8 | <.0001 |
Data represent mean values±SD. Abbreviations: LD, light drinkers; BD, binge drinker; ns, not statistically significant.
YAACQ scores not available for n=1 BDBO.
BDBO significantly different from LD and BDN, but no difference between LD and BDN.
Depression, mood state and anxiety were measured using the Beck Depression Inventory (BDI-II) (Beck et al., 1996), Profile of Mood States (POMS) (McNair et al., 1971) and State Trait Anxiety Inventory (STAI) (Spielberger et al., 1983), respectively. Impulsivity was assessed using the Barratt Impulsiveness Scale (BIS-11) (Patton et al., 1995) (Table 3).
Table 3.
Clinical Measures
| Measures | LD (n=27) | BD (n=21) | p | |
|---|---|---|---|---|
| BIS | Attention | 14.7±4.6 | 13.9±3.0 | ns |
| Motor | 20.1±3.5 | 21.4±3.5 | ns | |
| Non-Planning | 20.9±4.9 | 20.6±4.7 | ns | |
| Total | 55.8±10.9 | 56.0±8.1 | ns | |
| BDI-IIa | Depression Severity | 3.7±6.5 | 2.2±2.9 | ns |
| POMSb | Tension | 7.1±4.3 | 7.4±5.1 | ns |
| Depression | 5.7±9.4 | 6.1±7.7 | ns | |
| Anger | 4.0±6.8 | 5.9±5.7 | ns | |
| Vigor | 17.7±5.9 | 20.7±4.1 | ns | |
| Fatigue | 4.4±4.5 | 5.2±4.9 | ns | |
| Confusion | 6.1±3.6 | 5.8±2.4 | ns | |
| Total Mood Disturbance | 8.6±26.6 | 8.5±21.1 | ns | |
| STAIc | State Total | 29.7±10.8 | 29.5±7.4 | ns |
| Trait Total | 34.2±11.1 | 32.7±7.3 | ns |
Data represent mean values±SD. Abbreviations: LD, light drinkers; BD, binge drinkers; p, p-value; BIS, Barratt Impulsiveness Scale; BDI-II, Beck Depression Inventory; POMS, Profile of Mood States; STAI, State and Trait Anxiety Inventory; ns, not statistically significant. Clinical data not available for
n=1 LD for BDI-II,
n=4 LD and 4 BD for POMS,
n=4 LD and n=5 BD for STAI.
All participants also completed a neurocognitive battery on scan day to assess cognitive functioning. Relevant to the ACC, executive functioning was assessed using the Trail Making Test (TMT) to measure attention, speed and mental flexibility (Tombaugh, 2004) and the Go No-Go (GNG) test to assess response inhibition (Silveri et al., 2013). Relevant to the POC, visuospatial functioning was assessed using the Wechsler Abbreviated Scale of Intelligence (WASI) Block Design subtest (Wechsler, 1999) and the Mental Rotation Test (Sneider et al., in press). Performance on WASI vocabulary and matrix reasoning were used to estimate IQ (Wechsler, 1999). Raw scores are provided for TMT (time to completion (sec) and errors for Part A and Part B, and derived scores: difference score, TMTB-TMTA time; ratio, TMTB/TMTA time X 100 (Strauss et al., 2006)), GNG (percent correct, reaction time (msec)), Mental Rotations Test (percent correct), and WASI Block Design subtest (T-scores based on normative data) in Table 4.
Table 4.
Cognitive Measures
| Measures | LD (n=27) | BD (n=21) | p | |
|---|---|---|---|---|
|
| ||||
| General Intelligence | IQ | 116.7±12.1 | 123.4±11.1 | ns |
| Executive Function (ACC) | ||||
| TMT | TMT-A time and errors | 24.2±9.4 sec | 22.3±7.6sec/0.1±0.3 | ns |
| 0.2±0.5 errors | ||||
| TMT-B time and errors | 53.2±24.4sec | 47.6±23.4sec/0.2±0.5 | ns | |
| 0.3±0.7 errors | ||||
| TMT-B – TMT-A time | 29.0±20.2 sec | 25.3±19.5 | ns | |
| TMT-B/TMT-A *100 ratio | 227.2±84.0 sec | 218.1±79.4 | ns | |
|
| ||||
| GNGa | Go Percent Correct | 94.6±4.0% | 93.5±4.0% | ns |
| NoGo Percent Correct | 86.4±9.2% | 83.9±8.0% | ns | |
| Go Reaction Time | 415.8±68.5 msec | 376.5±47.5 msec | .03 | |
| BDN: 351.4±29.2 msec | ||||
| BDBO: 391.9±50.9 msec | ||||
|
| ||||
| Visuospatial Function (POC) | ||||
| Block Designb | T-score | 55.8±12.7 | 58.6±8.2 | ns |
| Mental Rotationc | Percent Correct | 76.7±18.7 | 83.2±20.7 | ns |
Data represent mean values±SD. Abbreviations: LD, light drinkers; BD, binge drinkers; p, p-value; ACC, anterior cingulated cortex; POC, parieto-occipital cortex; TMT, Trails Making Test; sec, seconds; msec, milliseconds; ns, not statistically significant. Cognitive data not included for
n=1 statistical outlier LD for GNG, not available for
n=10 LD and n=4 BD for Block Design, and
n=3 LD and n=4 BD for Mental Rotation.
Magnetic Resonance Imaging/Magnetic Resonance Spectroscopy
Magnetic resonance imaging (MRI) and 1H-MRS data were acquired at 4.0 Tesla using a Varian Unity/INOVA whole-body MRI/MRS scanner (Varian Inc., Palo Alto, CA) and a volumetric head coil (XLR Imaging, London, Canada). Head placement was confirmed using three-plane scout images. Following global shimming, high-contrast 3D fast low-angle shot T1-weighted images were acquired for voxel prescription: 20mm × 20mm × 30mm voxel placed in ACC along the midline, with the inferior voxel parallel to the descending surface of the corpus callosum; 20mm × 20mm × 30mm voxel placed in POC, with the inferior voxel edge aligned with the anterior commissure–posterior commissure (Figure 1a). Manual voxel shimming resulted in water linewidths of 9–12Hz. MEGAPRESS (Mescher et al., 1998) (Figures 1b, c) was used to obtain difference-edited GABA-optimized spectra, as described previously (Silveri et al., 2013). Unsuppressed water spectra were then acquired using 2D-JPRESS (Jensen et al., 2009) to collect 24 TE-stepped water scans using MEGAPRESS parameters, but with 4 averages per TE-step.
Figure 1. MRS Voxel Placement and Proton Spectra.
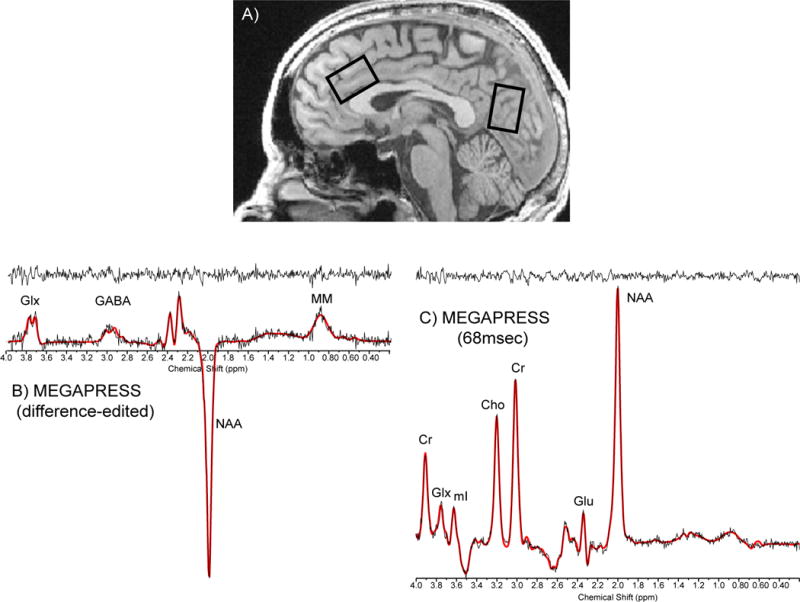
A) Sagittal image illustrating the placement of 20mm × 30mm × 20 mm single voxels in the ACC and POC. Sample raw (no exponential filter) spectral ACC data: B) difference-edited GABA and C) 68msec spectrum from MEGAPRESS. Abbreviations: ACC, anterior cingulate cortex; POC, parieto-occipital cortex; Cr, creatine; GLX, glutamate + glutamine; Glu, glutamate; NAA, N-acetyl-aspartate; GABA, gamma-aminobutyric acid; MM, macromolecule.
The MEGAPRESS-edited GABA difference spectrum was exponentially-filtered with a 5Hz time-filter and area under the 3.00ppm GABA doublet was numerically integrated between 2.89–3.19ppm, which yields improved accuracy and lower variance in GABA measures over LCModel (Rosso et al., in press). Cramer Rao lower bounds are not available for GABA integrals, however test-retest reliability from five healthy young adults, scanned twice at a 1-week interval, demonstrated intra-subject coefficient-of-variance for MEGAPRESS GABA =16.0±3.0%. The 68msec “OFF” sub-spectra were fitted using LCModel to yield values for NAA, Cr and Glu, with average Cramer Rao lower bounds=2.0±0.6%, 9.9±8.7% and 2.5±0.8%, respectively, which did not differ between groups or regions. Spectral data from 1 LD and 2 BD were excluded due to poor spectral quality, likely resulting from subject movement. One LD did not complete the POC scan.
Unsuppressed water T2 values were derived for each voxel using TE-stepped datasets and a least-squares algorithm to make group comparisons. T1-weighted axial image sets were segmented into grey matter (GM), white matter (WM) and cerebrospinal fluid (CSF) binary-tissue maps (FSL, Oxford, UK), and partial tissue percentages were extracted for ACC and POC voxels (Silveri et al., 2013), to quantitatively estimate potential tissue-percentage differences on metabolite:Cr ratios, which only correct for total tissue content (Jensen et al., 2005).
Statistical Analyses
In order to examine the a priori measures of interest, 2 group (LD, BD) univariate analyses of covariance (ANCOVAs), with sex as a covariate, were conducted for demographic, clinical and cognitive variables, and for ACC and POC GABA/Cr, Glu/Cr, and NAA/Cr. Subsequent follow-up univariate analyses with Bonferroni post hoc comparisons were conducted to test for effects of blackout status (LD, BDN, and BDBO). Effect size f (ES) was calculated for significant main effects and interactions using G*power (Version 3.0.6). Pearson’s correlation coefficients (one-tailed based on a priori hypotheses) were used to examine metabolite relationships. Bootstrap confidence intervals (BSCI) at 90% were calculated for significant correlations. Alpha levels (α=0.05) for univariate analyses were corrected to account for multiple metabolite comparisons (GABA, NAA and glutamate) in each region via modified Bonferroni procedure (Abe et al., 2013), which yielded adjusted alpha levels based on the three metabolites and their average inter-correlation coefficients (ACC: r=.37, POC: r=.41), α=0.025 (ACC) and α=0.026 (POC). Statistical analyses were conducted using SPSS18.0 (SPSS, Chicago, IL).
Results
Demographic Variables
Groups did not differ significantly on demographic variables. Significant group differences were observed for all alcohol use variables, with the BD group exhibiting significantly greater indices of alcohol use than the LD group. Within the BD group, no significant differences were observed between BDBO and BDN for any alcohol use variables, other than lifetime blackout status, which was significantly higher in BDBO than LD and BDN (Table 1).
Alcohol Use Consequences, Clinical and Cognitive Variables
Significant differences were observed for each domain of the YAACQ, with LD exhibiting significantly lower scores than BD (Table 2). When subsequent follow-up analyses were conducted to investigate blackout history, YAACQ scores were significantly different between each group, with LD<BDN< BDBO, with the exception of the blackout-drinking dimension, in which BDBO had significantly higher scores than LD and BDN, who did not differ significantly from one another.
No significant group differences were observed for any of the questionnaire measures examined (BDI, POMS, STAI or BIS), and no differences were observed when the BD group was stratified based on blackout history (Table 3).
No significant group differences were observed for cognitive variables (Table 4), with the exception of reaction time on Go Trials for the GNG test, with BD exhibiting significantly faster reaction times than LD [F(1,44)=4.87, p=.033; ES=.33]. Subsequent follow-up analyses demonstrated that significant differences were observed only between LD and BDN [F(2,44)=3.72, p=.032; ES=.48].
MRI/MRS Measures
There were significant differences in ACC GM and WM voxel content, with significantly lower ACC GM [F(1,45)=6.98, p=.011; ES=.39] and higher ACC WM [F(1,45)=5.72, p=.021; ES=.37] in BD versus LD (Table 5). Neither ACC CSF nor ACC voxel tissue percentage differed between groups. No significant group differences were observed for POC GM, WM, CSF or tissue percentage. Post hoc analyses based on blackout status confirmed significant group differences in ACC GM and WM between LD and BDBO, with BDN being intermediate between the two groups, but not significantly different from either [GM: F(2,45)=4.42, p=.018; ES=.44; WM: F(2,45)=3.31, p=.046; ES=.31]. A significant difference based on blackout status also emerged for POC WM [F(2,44)=4.05, p=.024; ES=.36], with BDBO exhibiting significantly lower POC WM compared to LD and BDN.
Table 5.
Tissue Segmentation
| ACC | LD (n=27) | BD (n=21) | p | BDN (n=8) | BDBO (n=13) | p |
|---|---|---|---|---|---|---|
| GM | 63.6±6.3 | 58.7±6.1 | .011 | 60.9±5.2 | 57.4±6.5* | .018 |
| WM | 28.6±6.9 | 33.0±5.0 | .021 | 31.5±5.4 | 33.9±4.8* | .046 |
| CSF | 7.8±3.4 | 8.3±3.1 | ns | 7.6±3.0 | 8.7±3.1 | ns |
| Tissue Percentage | 92.2±3.4 | 91.7±3.1 | ns | 92.4±3.0 | 91.3±3.1 | ns |
|
| ||||||
| POC | LD (n=26) | BD (n=21) | p | BDN (n=8) | BDBO (n=13) | p |
|
| ||||||
| GM | 55.3±4.9 | 56.9±4.1 | ns | 54.7±4.9 | 58.3±3.0 | ns |
| WM | 40.4±5.0 | 38.3±5.4 | ns | 41.7±6.2 | 36.2±3.7** | .024 |
| CSF | 4.4±2.0 | 4.8±2.6 | ns | 3.6±2.4 | 5.5±2.5 | ns |
| Tissue Percentage | 95.6±2.0 | 95.2±2.6 | ns | 96.4±2.4 | 94.5±2.6 | ns |
Data represent mean values±standard deviation. Abbreviations: LD, light drinkers; BD, binge drinker; ACC, anterior cingulate cortex; POC, parieto-occipital cortex; p, p-value; GM, grey matter; WM, white matter; CSF, cerebral spinal fluid; ns, not statistically significant, p >.05.
Tissue percentage was calculated as (((GM+WM)/(GM + WM + CSF))100).
BDBO significantly different from LD and BDN groups. Tissue data not reported for
n=1 LD who did not complete the POC scan.
Significantly longer ACC unsuppressed water T2 [F(1,45)=7.13, p=.011; ES=.39] was evident in BD [64.54±5.65msec] relative to LD [60.68±4.22msec]. Follow-up analyses stratifying by blackout group demonstrated that only BDBO [65.53±6.63msec] had significantly longer T2 than LD, whereas BDN [62.93±3.32msec] did not differ from either group [F(2,45)=4.41, p=.018; ES=.44]. Given that Cr/total proton signal did not differ between groups in either region, with or without stratification by blackout status [LD=0.258±0.016; BD=0.266±0.024; p=.19] or POC [LD=0.268±0.015; BD=0.270±0.024; p=.84], 68msec Cr was used to determine metabolite ratios. Neither full width half max [FWHM: ACC 0.054±0.009, POC 0.052±0.012] nor signal-to-noise ratios [SNR, height of NAA/noise standard deviation in residual: ACC 27.40±10.36, POC 32.32±9.54] differed between groups or regions.
Significantly lower ACC GABA/Cr [F(1,45)=5.60, p=.022; ES=.33] and NAA/Cr [F(1,45)=5.49, p=.024; ES=.34] was observed in BD compared to LD (Table 6), both of which survived corrections for multiple comparisons. Although GM content entered as a covariate in ACC GABA/Cr analyses was not significant, the main effect of alcohol group persisted, with GABA/Cr remaining significantly lower in BD. In contrast, GM content was a significant covariate for ACC NAA/Cr analyses, and accordingly, group differences in NAA/Cr were no longer significant when covaried for GM. No group differences were evident for ACC Glu/Cr. When stratified by blackout status, significantly lower ACC GABA/Cr [F(2,44)=4.01, p=.025; ES=.48] and NAA/Cr [F(2,44)=4.44, p=.018; ES=.44] were observed in BDBO compared to LD. Significantly lower ACC Glu/Cr in BDBO versus LD also emerged as significant [F(2,44)=3.93, p=.027; ES=.43], however this finding did not survive correction for multiple comparisons. No significant group differences were observed in any POC metabolites analyses.
Table 6.
ACC and POC Metabolite:Cr Ratios
| ACC | LD (n=27) | BD (n=21) | p | Cohen’s d | BDN (n=8) | BDBO (n=13) | p | Cohen’s d |
|---|---|---|---|---|---|---|---|---|
| GABA/Cr | 0.11±0.03 | 0.09±0.03 | .022 | .67 | 0.10±0.02 | 0.08±0.03* | .025 | .78 |
| Glu/Cr | 1.00±0.12 | 0.93±0.24 | ns | .39 | 1.05±0.11 | 0.85±0.28* | .027 | .94 |
| NAA/Cr | 1.19±0.12 | 1.10±0.14 | .024 | .69 | 1.16±0.12 | 1.06±0.14* | .018 | .77 |
|
| ||||||||
| POCa | LD (n=26) | BD (n=21) | p | BDN (n=8) | BDBO (n=13) | p | ||
| GABA/Cr | 0.12±0.03 | 0.12±0.05 | ns | 0 | 0.14±0.06 | 0.11±0.03 | ns | .63 |
| Glu/Cr | 0.91±0.14 | 0.84±0.17 | ns | .45 | 0.87±0.21 | 0.81±0.15 | ns | .16 |
| NAA/Cr | 1.37±0.09 | 1.33±0.12 | ns | .38 | 1.33±0.14 | 1.33±0.12 | ns | 0 |
Data represent mean values ± standard deviation. Abbreviations: LD, light drinkers; BD, binge drinker; p, p-value; ACC, anterior cingulate cortex; POC, parieto-occipital cortex; GABA, gamma amino-butyric acid; Cr, creatine; Glu, glutamate; NAA, N-acetyl-aspartate; ns, not statistically significant, p >.05.
BDBO only significantly different from LD group.
POC metabolite data not for available for n=1 LD.
Correlations between ACC Metabolites, Clinical and Cognitive Measures
Significant correlations were observed between ACC GABA/Cr, YAACQ total score, TMT ratio, and accuracy on NoGo trials. Specifically, in the BD group, lower ACC GABA/Cr was associated with higher total YAACQ scores [r(20)= −.479, p=.016, BSCI r=−0.726 to −0.122] (Fig 2a), worse TMT ratios [r(21)= −.725, p<.0001, BSCI r=−0.863 to −0.486] (Fig 2b), and worse NoGo accuracy [r(21)=.407, p=.034, BSCI r=.044 to 0.675] (Fig 2c). Relationships between cognitive measures and ACC GABA/Cr were observed within each BD group stratified by blackout history, except for ACC GABA/Cr and YAACQ total score, which was significant in BDBO (p=.043) but not in BDN (p=.40) (Fig 2a). Correlations with POC GABA/Cr did not reach significance for cognitive variables, however lower POC GABA/Cr was associated with higher YAACQ total scores [r(20)= −.425, p=.031, BSCI r=−0.693 to−0.055] in BD, which was driven by a significant association in BDN (p=.018), but not in BDBO (p=.14). No significant correlations between metabolites were observed in LD.
Figure 2. Correlations: ACC GABA/Cr, Clinical and Cognitive Measures.
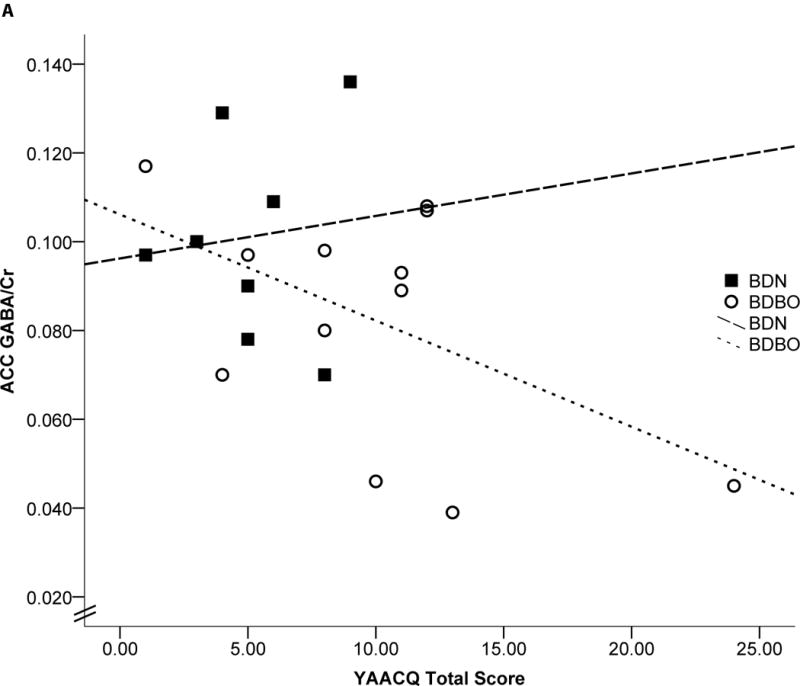
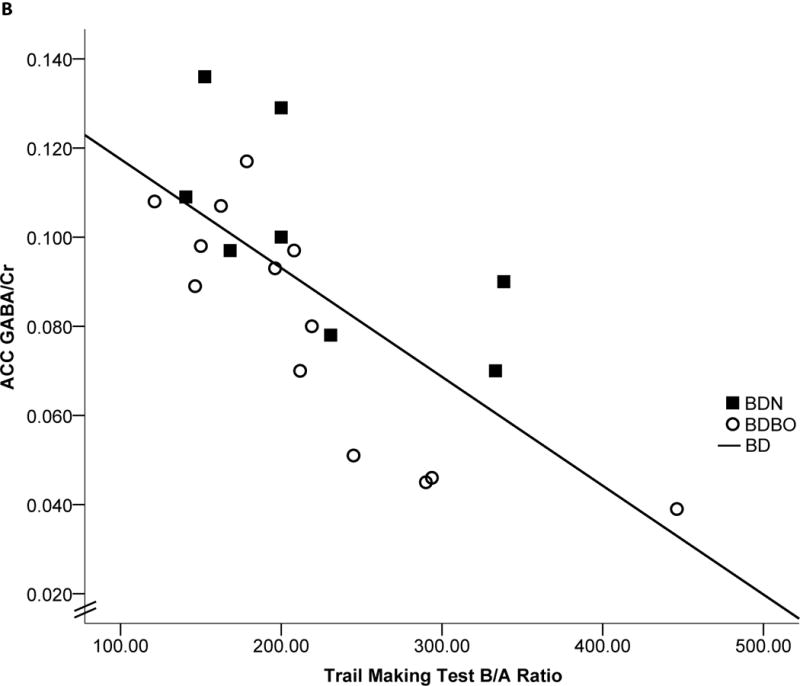
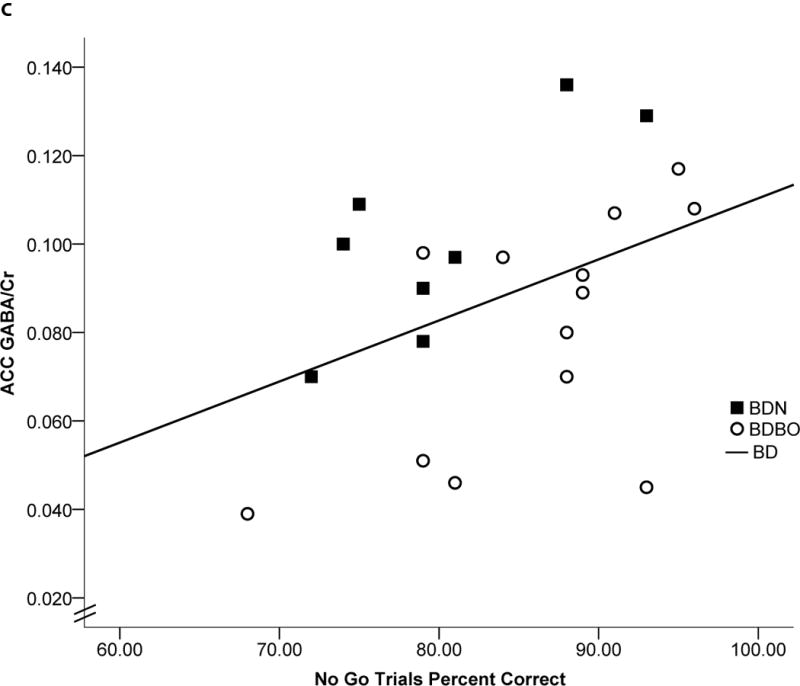
Scatterplots representing individual BD subject data and linear regressions of the relationship between ACC GABA/Cr and a) YAACQ total score, where higher scores reflect greater alcohol-related consequences [r(20)= −.479, p=.016], b) Trail Making Test ratio, where higher scores reflect worse performance [r(21)= −.725, p<.0001], and c) GNG NoGo percent accuracy, where lower scores reflect worse response inhibition [r(21)=.407, p=.034]. Open circles represent BDBO (n=13) and filled squares represent BDN (n=8) individual subject data. Dotted (BDBO), dashed (BDN) and solid (BD total group) lines represent the linear regression between variables.
Although exploratory, relationships between ACC and POC Glu/Cr and NAA/Cr, total YAACQ scores and cognitive measures did not reach significance in BD or LD, except for a significant relationship observed between POC NAA/Cr and worse TMT ratios [r(21)= −.545, p=.011, BSCI r=−0.761 to −0.220], only in the BD group.
Discussion
This study provides the first in vivo evidence of lower frontal lobe GABA in emerging adult binge drinkers relative to demographically-matched light drinkers. Lower GABA/Cr was observed in ACC but not POC of BD, which remained significant when correcting for tissue contribution and multiple comparisons. Significantly lower ACC NAA/Cr was also evident in BD, although this group difference was no longer apparent when correcting for GM content. Interestingly, when blackout status was included in follow-up exploratory analyses, effect sizes for metabolite group differences were larger than for BD versus LD comparisons, with post hoc comparisons revealing that low ACC GABA/Cr and NAA/Cr were driven by BDBO. Significantly lower glutamate in BD emerged when stratifying by blackout status, again with differences only observed between LD and BDBO. This glutamate finding did not survive correction for multiple comparisons.
Consistent with the a priori study hypotheses, metabolite alterations in BD, regardless of blackout status, were regionally specific to the ACC, suggesting that the frontal lobe is differentially vulnerable to binge alcohol use. It is noteworthy that both groups ranged between average-very superior IQ (LD: 94–137; BD: 96–138, BDN: 96–138; BDBO: 103–134). While the average IQ of BD was in the superior range compared to the high average IQ of LD (Table 1), groups did not differ significantly on any cognitive measures (except faster Go trial reaction times in BD). While IQ range differences suggest a potential difference in functional ability, lower ACC GABA and NAA levels in BD likely reflect compromised functionality of the PFC, given significant relationships between lower ACC GABA/Cr, lower POC NAA/Cr and worse executive functioning (NoGo trials (GABA only) and TMT ratio) in BD. It is also interesting that a larger percentage of BD were current students compared to LD, who had a greater percentage of completed 4-year degrees, however this difference did not impact metabolite findings. Nonetheless, all LD and BD subjects enrolled in the current study had college experience. In contrast, significant group differences were evident for alcohol use and alcohol-related consequence variables. Lower GABA/Cr in the ACC and POC predicted higher alcohol-related consequence scores on the YAACQ in the entire sample of BD, although when broken down by blackout status, relationships differed between BD subgroups. Since no relationships were evident for other metabolites or study variables, GABA and cognition relationships appear to have unique regional significance in emerging adults who self-report binge drinking, whereas alcohol-related consequences across a wide range of personal and social functioning (academic, self-care, etc) may be related to GABA levels on a more global level.
Lower ACC GABA/Cr in the current BD emerging adults differs from previous GABA MRS investigations in alcohol dependent patients. For instance, no ACC GABA differences were observed in recently abstinent alcohol dependent patients at 9±4 days or 34±7 days of abstinence, while lower ACC Glu, NAA and Cr normalized to control levels after one-month of sobriety (Mon et al., 2012). A trend for lower ACC GABA was observed in abstinent polysubstance abusers who were also alcohol dependent, suggesting that GABA alterations emerge in ploydrug addictions (Abe et al., 2013). There are several important differences likely contributing to this discrepancy in GABA findings. First, prior studies included patients that met clinical criteria for alcohol dependence, whereas the present study enrolled BD with no history of alcohol abuse or dependence. Second, subjects in this study were active drinkers required to abstain from alcohol use for at least 48 hours prior to scanning, whereas lengths of abstinence in previous work ranged from weeks to months. Most notably, alcohol dependent cohorts examined in previous studies were generally 45 years and older, compared to the current cohort. The present findings could reflect acute neurotoxic effects of binge drinking on ACC GABA and NAA, which could resolve with abstinence (Mon et al., 2012). This hypothesis would be consistent with observed reductions in OCC GABA and NAA an hour after an acute alcohol challenge in young adult light drinkers (Gomez et al., 2011). Alternatively, pre-existing developmental differences in ACC GABA (Silveri et al., 2013) could have contributed to the initiation of hazardous drinking patterns. For instance, low ACC GABA that predates alcohol use could increase the chances of a person engaging in binge drinking (e.g, lowering inhibitory control, elevating tolerance for soporific alcohol effects to allow higher consumption), as opposed to reflecting acute alcohol-related neurotoxicity. Clearly longitudinal studies in emerging adults with varying alcohol use patterns are needed to examine the time course of acute alcohol effects on metabolites, and potential neurochemical risk markers that may predate initiation and maintenance of heavy episodic alcohol consumption patterns.
While the combined sample of BD exhibited lower ACC GABA and NAA than the LD comparison group, exploratory analyses revealed that metabolite alterations were more pronounced in BD with a positive blackout history. Links have been demonstrated between blackouts and rapidly rising blood alcohol levels (White, 2003), although there were no differences in alcohol consumption measures, or clinical or congitive measures, between BDBO and BDN. The BDBO group did report significantly more alcohol related consequences. This preliminary finding merits additional investigation in a larger sample, particularly in light of evidence that prior to initiating substance use at age 13, youth who went on to experience an alcohol-induced blackout by age 18 exhibited greater frontal and cerebellar activation during inhibitory processing at baseline, compared to nondrinkers and those who initiated alcohol use but had a negative blackout history (Wetherill et al., 2013). It was hypothesized that greater brain activation observed in the context of comparable behavioral performance is consistent with the notion of functional compensation. This notion could be applied to the current findings, in that altered frontal lobe metabolites were observed despite a lack of cognitive differences. Thus, a low level neurochemical profile may make some individuals more vulnerable to experiencing blackouts than others.
Brain GABA measured in the current study likely reflects intracellular rather than synaptic levels, since the majority of the GABA pool exists within GABAergic neurons (Stagg et al., 2011). Lower ACC GABA levels were evident in BD when accounting for lower GM content in the ACC, which is consistent with frontal lobe GM shrinkage reported in alcohol dependent patients (Le Berre et al., 2012). It is plausible that lower ACC GM content in BD could reflect a premorbid developmental difference between groups rather than reflecting a neurotoxic effect of alcohol. Indeed, implications of lower GM, but higher WM content in the ACC of BD versus LD could have significant functional ramifications. Although tissue content did not predict GABA levels, tissue differences could reflect advanced pruning and myelination associated with adolescent brain development, particularly given the high estimated IQ of the BD group. Again, longitudinal investigations are needed to parse out these speculations. Given that the ACC is involved in detecting conflict, i.e., identifying that a prepotent response needs to be inhibited, the vulnerability of the ACC GABA circuitry to alcohol likely reduces effectiveness for inhibiting incorrect responses. It is also possible that reduced GABA is associated with worse cognitive control in BD via interactions with glutamatergic activity, given the trend for lower glutamate in the BDBO group. Reductions in NAA, however, are thought to reflect loss of neurons or compromised neural integrity, and have been widely reported in MRS studies of alcohol dependent patients (Meyerhoff et al., 2013). NAA levels were tightly coupled with GM voxel content in the current study, with NAA levels no longer differing between groups when accounting for GM content, suggesting that lower ACC NAA associated with BD and blackout history may be secondary to GM loss.
Notable strengths of the study include use of MEGAPRESS at 4.0T, which permits improved spatial and spectral resolution, high SNR afforded by high field MRS and optimal detection of GABA. The current investigation included a large sample size of healthy individudals with no other substance use. Subjects in the current sample also did not use nicotine, with the exception of one female BD. Significant metabolite differences were maintained when this one female was removed from analyses. Overall, no sex differences or interactions with alcohol group were detected among the measures examined, despite the suggestion that neurobiology in women may be more impacted by alcohol use than in men (Sharrett-Field et al., 2013). The majority of women were scanned in their follicular phase, so perhaps sex by alcohol interactions may have emerged had women been tested in the luteal phase.
There are also study limitations to consider. While normalizing GABA to Cr has its disadvantages, Cr:total metabolite ratios did not differ significantly between groups. It would have been ideal to calculate absolute metabolite concentrations (Abe et al., 2013; Jensen et al., 2005; Mon et al., 2012), however, T2 of unsuppressed water was significantly longer in BD than LD, reducing the feasibility of this quantification strategy. While unsuppressed water T2 was not significantly associated with %GM or %WM in either ACC or POC in either group, longer unsuppressed water T2 could reflect neuronal swelling in BD, which should be investigated further in future studies. Co-editing of macromolecules, that resonate near the detected GABA peak, complicates accurate quantification of the edited GABA signal (Cudalbu et al., 2012). Given that macromolcule contributions to the GABA peak have been documented (Edden et al., 2012), future studies should correct for macromolecules to reliably interpret differences in GABA associated with heavy alcohol consumption. It should also be acknowledged that tissue segmentation for a single voxel placed in ACC or POC is not a reliable indicator of tissue content for the whole ACC or POC. However, segmentation provided a necessary indicator of tissue content for interpreting metabolite levels. Finally, the small sample sizes of BDN and BDBO groups should be considered a study limitation. Despite corrections for multiple comparisons and large effect sizes observed between these groups, small sample sizes could lead to increased chances of Type 1 errors.
These results suggest that the frontal cortex is differentially sensitive to binge alcohol consumption, particularly in individuals who have experienced an alcohol-induced blackout. Further, GABAergic alterations observed in ACC, a region critical to response monitoring and inhibition, were associated with worse executive functioning, which is in line with previous relationships reported between neurocognitive deficits and metabolite abnormalities in alcohol abusing populations (Meyerhoff and Durazzo, 2008). The LD and BD cohorts in the current study had similar levels of cognitive functioning and mental health, but differed in terms of quantities and frequency of alcohol consumption. Thus, these metabolite findings have important public health relevance, as alterations in neurochemical levels, particularly GABA, may serve as early markers of risk for continued hazardous drinking behaviors in a population that demonstrates not only the highest rate of binge drinking, but also the highest rate of alcohol abuse and dependence. These data may also contribute to the development of novel interventions that target GABA, which could have increased efficacy in treating alcohol abuse disorders in emerging adults.
Acknowledgments
This study was supported by K01 AA014651 and R01 AA018153 grants (MMS). The authors wish to acknowledge Dr. William D.S. Killgore for development of the GNG paradigm and Ms. Alexandra McCaffrey for early contributions to study coordination.
Footnotes
Financial Disclosures
There are no disclosures to declare.
References
- Abe C, Mon A, Durazzo TC, Pennington DL, Schmidt TP, Meyerhoff DJ. Polysubstance and alcohol dependence: Unique abnormalities of magnetic resonance-derived brain metabolite levels. Drug Alcohol Depend. 2013;130(1–3):30–7. doi: 10.1016/j.drugalcdep.2012.10.004. [DOI] [PMC free article] [PubMed] [Google Scholar]
- Andres RH, Ducray AD, Schlattner U, Wallimann T, Widmer HR. Functions and effects of creatine in the central nervous system. Brain Res Bull. 2008;76(4):329–43. doi: 10.1016/j.brainresbull.2008.02.035. [DOI] [PubMed] [Google Scholar]
- Arnett JJ. Conceptions of the transition to adulthood: Perspectives from adolescence through midlife. J Adult Dev. 2001;8(2):133–143. [Google Scholar]
- Bayindir Y, Firat AK, Kayabas U, Alkan A, Yetkin F, Karakas HM, Yologlu S. Increased membrane turnover in the brain in cutaneous anthrax without central nervous system disorder: a magnetic resonance spectroscopy study. Med Hypotheses. 2012;79(1):43–6. doi: 10.1016/j.mehy.2012.03.027. [DOI] [PubMed] [Google Scholar]
- Beck AT, Steer RA, Brown GK. Manual for the Beck Depression Inventory–II. Psychological Corporation; San Antonio, TX: 1996. [Google Scholar]
- Behar KL, Rothman DL, Petersen KF, Hooten M, Delaney R, Petroff OA, Shulman GI, Navarro V, Petrakis IL, Charney DS, Krystal JH. Preliminary evidence of low cortical GABA levels in localized 1H-MR spectra of alcohol-dependent and hepatic encephalopathy patients. Am J Psychiatry. 1999;156(6):952–4. doi: 10.1176/ajp.156.6.952. [DOI] [PubMed] [Google Scholar]
- Casey BJ, Giedd JN, Thomas KM. Structural and functional brain development and its relation to cognitive development. Biol Psychol. 2000;54(1–3):241–57. doi: 10.1016/s0301-0511(00)00058-2. [DOI] [PubMed] [Google Scholar]
- Coupland NJ, Ogilvie CJ, Hegadoren KM, Seres P, Hanstock CC, Allen PS. Decreased prefrontal Myo-inositol in major depressive disorder. Biol Psychiatry. 2005;57(12):1526–34. doi: 10.1016/j.biopsych.2005.02.027. [DOI] [PubMed] [Google Scholar]
- Cudalbu C, Mlynarik V, Gruetter R. Handling macromolecule signals in the quantification of the neurochemical profile. J Alzheimers Dis. 2012;31(Suppl 3):S101–15. doi: 10.3233/JAD-2012-120100. [DOI] [PubMed] [Google Scholar]
- Edden RA, Puts NA, Barker PB. Macromolecule-suppressed GABA-edited magnetic resonance spectroscopy at 3T. Magn Reson Med. 2012;68(3):657–61. doi: 10.1002/mrm.24391. [DOI] [PMC free article] [PubMed] [Google Scholar]
- First MB, Spitzer RL, Gibbon M, Williams JB. Structured Clinical Interview for DSM-IV-TR Axis I Disorders, Research Version, Non-patient Edition (SCID-I/NP) New York Psychiatric Institute; New York: 2002. [Google Scholar]
- Giedd JN, Snell JW, Lange N, Rajapakse JC, Casey BJ, Kozuch PL, Vaituzis AC, Vauss YC, Hamburger SD, Kaysen D, Rapoport JL. Quantitative magnetic resonance imaging of human brain development: ages 4–18. Cereb Cortex. 1996;6(4):551–60. doi: 10.1093/cercor/6.4.551. [DOI] [PubMed] [Google Scholar]
- Gomez R, Behar KL, Watzl J, Weinzimer SA, Gulanski B, Sanacora G, Koretski J, Guidone E, Jiang L, Petrakis IL, Pittman B, Krystal JH, Mason GF. Intravenous ethanol infusion decreases human cortical gamma-aminobutyric acid and N-acetylaspartate as measured with proton magnetic resonance spectroscopy at 4 tesla. Biol Psychiatry. 2011;71(3):239–46. doi: 10.1016/j.biopsych.2011.06.026. [DOI] [PMC free article] [PubMed] [Google Scholar]
- Hingson RW, Zha W, Weitzman ER. Magnitude of and trends in alcohol-related mortality and morbidity among U.S. college students ages 18–24, 1998–2005. J Stud Alcohol Drugs Suppl. 2009;16:12–20. doi: 10.15288/jsads.2009.s16.12. [DOI] [PMC free article] [PubMed] [Google Scholar]
- Hustad JT, Carey KB. Using calculations to estimate blood alcohol concentrations for naturally occurring drinking episodes: a validity study. J Stud Alcohol. 2005;66(1):130–8. doi: 10.15288/jsa.2005.66.130. [DOI] [PubMed] [Google Scholar]
- Jensen JE, Frederick Bde B, Renshaw PF. Grey and white matter GABA level differences in the human brain using two-dimensional, J-resolved spectroscopic imaging. NMR Biomed. 2005;18(8):570–6. doi: 10.1002/nbm.994. [DOI] [PubMed] [Google Scholar]
- Jensen JE, Licata SC, Ongur D, Friedman SD, Prescot AP, Henry ME, Renshaw PF. Quantification of J-resolved proton spectra in two-dimensions with LCModel using GAMMA-simulated basis sets at 4 Tesla. NMR Biomed. 2009;22(7):762–9. doi: 10.1002/nbm.1390. [DOI] [PubMed] [Google Scholar]
- Knight JR, Wechsler H, Kuo M, Seibring M, Weitzman ER, Schuckit MA. Alcohol abuse and dependence among U.S. college students. J Stud Alcohol. 2002;63(3):263–70. doi: 10.15288/jsa.2002.63.263. [DOI] [PubMed] [Google Scholar]
- Krystal JH, Staley J, Mason G, Petrakis IL, Kaufman J, Harris RA, Gelernter J, Lappalainen J. Gamma-aminobutyric acid type A receptors and alcoholism: intoxication, dependence, vulnerability, and treatment. Arch Gen Psychiatry. 2006;63(9):957–68. doi: 10.1001/archpsyc.63.9.957. [DOI] [PubMed] [Google Scholar]
- Le Berre AP, Rauchs G, La Joie R, Mezenge F, Boudehent C, Vabret F, Segobin S, Viader F, Allain P, Eustache F, Pitel AL, Beaunieux H. Impaired decision-making and brain shrinkage in alcoholism. Eur Psychiatry. 2012 doi: 10.1016/j.eurpsy.2012.10.002. [DOI] [PubMed] [Google Scholar]
- Mason GF, Petrakis IL, de Graaf RA, Gueorguieva R, Guidone E, Coric V, Epperson CN, Rothman DL, Krystal JH. Cortical gamma-aminobutyric acid levels and the recovery from ethanol dependence: preliminary evidence of modification by cigarette smoking. Biol Psychiatry. 2006;59(1):85–93. doi: 10.1016/j.biopsych.2005.06.009. [DOI] [PubMed] [Google Scholar]
- McNair DM, Lorr M, Droppleman LF. Profile of Mood States Manual. Educational and Industrial Testing Service; San Diego, CA: 1971. [Google Scholar]
- Mescher M, Merkle H, Kirsch J, Garwood M, Gruetter R. Simultaneous in vivo spectral editing and water suppression. NMR Biomed. 1998;11(6):266–72. doi: 10.1002/(sici)1099-1492(199810)11:6<266::aid-nbm530>3.0.co;2-j. [DOI] [PubMed] [Google Scholar]
- Meyerhoff DJ, Durazzo TC. Proton magnetic resonance spectroscopy in alcohol use disorders: a potential new endophenotype? Alcohol Clin Exp Res. 2008;32(7):1146–58. doi: 10.1111/j.1530-0277.2008.00695.x. [DOI] [PMC free article] [PubMed] [Google Scholar]
- Meyerhoff DJ, Durazzo TC, Ende G. Chronic alcohol consumption, abstinence and relapse: brain proton magnetic resonance spectroscopy studies in animals and humans. Curr Top Behav Neurosci. 2013;13:511–40. doi: 10.1007/7854_2011_131. [DOI] [PubMed] [Google Scholar]
- Moffett JR, Ross B, Arun P, Madhavarao CN, Namboodiri AM. N-Acetylaspartate in the CNS: from neurodiagnostics to neurobiology. Prog Neurobiol. 2007;81(2):89–131. doi: 10.1016/j.pneurobio.2006.12.003. [DOI] [PMC free article] [PubMed] [Google Scholar]
- Mokdad AH, Marks JS, Stroup DF, Gerberding JL. Actual causes of death in the United States, 2000. JAMA. 2004;291(10):1238–45. doi: 10.1001/jama.291.10.1238. [DOI] [PubMed] [Google Scholar]
- Mon A, Durazzo TC, Meyerhoff DJ. Glutamate, GABA, and other cortical metabolite concentrations during early abstinence from alcohol and their associations with neurocognitive changes. Drug Alcohol Depend. 2012;125(1–2):27–36. doi: 10.1016/j.drugalcdep.2012.03.012. [DOI] [PMC free article] [PubMed] [Google Scholar]
- Moselhy HF, Georgiou G, Kahn A. Frontal lobe changes in alcoholism: a review of the literature. Alcohol Alcohol. 2001;36(5):357–68. doi: 10.1093/alcalc/36.5.357. [DOI] [PubMed] [Google Scholar]
- NIAAA. NIAAA Newsletter. Vol. 3. NIAAA; Bethesda, MD: 2004. National Institute of Alcohol Abuse and Alcoholism council approves definition of binge drinking; p. 3. [Google Scholar]
- Oscar-Berman M, Marinkovic K. Alcohol: effects on neurobehavioral functions and the brain. Neuropsychol Rev. 2007;17(3):239–57. doi: 10.1007/s11065-007-9038-6. [DOI] [PMC free article] [PubMed] [Google Scholar]
- Patton JM, Stanford MS, Barratt ES. Factor structure of the Barratt Impulsiveness Scale. J Clin Psychol. 1995;51:768–774. doi: 10.1002/1097-4679(199511)51:6<768::aid-jclp2270510607>3.0.co;2-1. [DOI] [PubMed] [Google Scholar]
- Read JP, Merrill JE, Kahler CW, Strong DR. Predicting functional outcomes among college drinkers: reliability and predictive validity of the Young Adult Alcohol Consequences Questionnaire. Addict Behav. 2007;32(11):2597–610. doi: 10.1016/j.addbeh.2007.06.021. [DOI] [PubMed] [Google Scholar]
- Read JP, Wardell JD, Bachrach RL. Drinking consequence types in the first college semester differentially predict drinking the following year. Addict Behav. 2013;38(1):1464–71. doi: 10.1016/j.addbeh.2012.07.005. [DOI] [PubMed] [Google Scholar]
- Rosso IM, Weiner MW, Crowley DJ, Silveri MM, Rauch SL, Jensen JE. Insula and anterior cingulate GABA levels in post-traumatic stress disorder: Preliminary findings using magnetic resonance spectroscopy. Depress Anxiety. doi: 10.1002/da.22155. (in press) [DOI] [PMC free article] [PubMed] [Google Scholar]
- SAMHSA. Summary of National Findings. Rockville, MD: 2010. Results from the 2009 National Survey on Drug Use and Health: Volume I. (Office of Applied Studies NSDUH Series H-38A, HHS Publication No. SMA 10-4856Findings). [Google Scholar]
- Saunders JB, Aasland OG, Babor TF, de la Fuente JR, Grant M. Development of the Alcohol Use Disorders Identification Test (AUDIT): WHO Collaborative Project on Early Detection of Persons with Harmful Alcohol Consumption–II. Addiction. 1993;88(6):791–804. doi: 10.1111/j.1360-0443.1993.tb02093.x. [DOI] [PubMed] [Google Scholar]
- Sharrett-Field L, Butler TR, Reynolds AR, Berry JN, Prendergast MA. Sex differences in neuroadaptation to alcohol and withdrawal neurotoxicity. Pflugers Arch. 2013;465(5):643–54. doi: 10.1007/s00424-013-1266-4. [DOI] [PMC free article] [PubMed] [Google Scholar]
- Silveri MM, Sneider JT, Crowley DJ, Covell MJ, Acharya D, Rosso IM, Jensen JE. Frontal lobe gamma-aminobutyric acid levels during adolescence: Associations with impulsivity and response inhibition. Biol Psychiatry. 2013 doi: 10.1016/j.biopsych.2013.01.033. [Epub ahead of print] [DOI] [PMC free article] [PubMed] [Google Scholar]
- Sneider JT, Cohen-Gilbert JE, Crowley DJ, Paul MD, Silveri MM. Differential effects of binge drinking on learning and memory in emerging adults. Journal of Addiction Research and Therapy. doi: 10.4172/2155-6105.S7-006. (in press) [DOI] [PMC free article] [PubMed] [Google Scholar]
- Sobell LC, Sobell MB. Alcohol Timeline Followback User’s Manual. Addiction Research Foundation; Toronto: 1995. [Google Scholar]
- Spielberger CD, Gorsuch RL, Lushene R, Vagg PR, Jacobs GA. Manual for the State-Trait Anxiety Inventory. Consulting Psychologists Press; Palo Alto, CA: 1983. [Google Scholar]
- Stagg CJ, Bachtiar V, Johansen-Berg H. What are we measuring with GABA magnetic resonance spectroscopy? Commun Integr Biol. 2011;4(5):573–5. doi: 10.4161/cib.4.5.16213. [DOI] [PMC free article] [PubMed] [Google Scholar]
- Strauss E, Sherman EMS, Spreen O. A compendium of neuropsychological tests. Third. Oxford University Press; New York: 2006. [Google Scholar]
- Sullivan EV, Pfefferbaum A. Neurocircuitry in alcoholism: a substrate of disruption and repair. Psychopharmacology (Berl) 2005;180(4):583–94. doi: 10.1007/s00213-005-2267-6. [DOI] [PubMed] [Google Scholar]
- Tombaugh TN. Trail Making Test A and B: normative data stratified by age and education. Arch Clin Neuropsychol. 2004;19(2):203–14. doi: 10.1016/S0887-6177(03)00039-8. [DOI] [PubMed] [Google Scholar]
- Wechsler D. Wechsler Abbreviated Scale of Intelligence Manual. The Psychological Corporation Hartcourt Brace and Company; San Antonio: 1999. [Google Scholar]
- Wetherill RR, Castro N, Squeglia LM, Tapert SF. Atypical neural activity during inhibitory processing in substance-naive youth who later experience alcohol-induced blackouts. Drug Alcohol Depend. 2013;128(3):243–9. doi: 10.1016/j.drugalcdep.2012.09.003. [DOI] [PMC free article] [PubMed] [Google Scholar]
- Wetherill RR, Fromme K. Acute alcohol effects on narrative recall and contextual memory: an examination of fragmentary blackouts. Addict Behav. 2011;36(8):886–9. doi: 10.1016/j.addbeh.2011.03.012. [DOI] [PMC free article] [PubMed] [Google Scholar]
- White AM. What happened? Alcohol, memory blackouts, and the brain. Alcohol Res Health. 2003;27(2):186–96. [PMC free article] [PubMed] [Google Scholar]
- Zucker RA, Ellis DA, Fitzgerald HE. Developmental evidence for at least two alcoholisms. I. Biopsychosocial variation among pathways into symptomatic difficulty. Ann N Y Acad Sci. 1994;708:134–46. doi: 10.1111/j.1749-6632.1994.tb24706.x. [DOI] [PubMed] [Google Scholar]