

Abstract
Background
The topological architecture of the whole-brain functional networks in those with and without late-life depression (LLD) and amnestic mild cognitive impairment (aMCI) are unknown.
Aims
To investigate the differences in the small-world measures and the modular community structure of the functional networks between patients with LLD and aMCI when occurring alone or in combination and cognitively healthy nondepressed controls.
Methods
Seventy-nine elderly participants [LLD (n = 23), aMCI (n = 18), comorbid LLD and aMCI (n = 13), and controls (n = 25)] completed neuropsychiatric assessments. Graph theoretical methods were employed on resting-state functional connectivity magnetic resonance imaging data.
Results
LLD and aMCI comorbidity was associated with the greatest disruptions in functional integration measures (decreased global efficiency and increased path length); both LLD groups showed abnormal functional segregation (reduced local efficiency). The modular network organization was most variable in the comorbid group, followed by LLD-only patients. Decreased mean global, local and nodal efficiency metrics were associated with greater depressive symptom severity but not memory performance.
Conclusions
Consider the whole brain as a complex network may provide unique insights on the neurobiological underpinnings of LLD with and without cognitive impairment.
Keywords: late-life depression, mild cognitive impairment, brain networks, resting-state functional connectivity, graph theory
Introduction
The public health consequences of late-life depression (LLD) are enormous since it's associated with delayed or partial treatment response, poorer outcomes of comorbid medical disorders, increased risk for cognitive decline and Alzheimer's disease (AD) risk, higher disability and premature mortality levels.1 The coexistence of LLD with amnestic mild cognitive impairment (aMCI) is associated with accelerated cognitive decline and increased incidence of AD than those with LLD- and aMCI-only, by pathophysiologic mechanisms that are elusive.2 Functional neuroimaging studies have unraveled fronto-striatal dysfunction in LLD,3 whereas altered regional activations in the episodic memory neural circuitry are detected in aMCI.4 However, growing evidence supports the view that LLD and aMCI does not alter brain function in individual regions, rather are large-scale disconnection syndromes that disrupts brain networks subserving multidomain cognitive and behavioral functions.4, 5
Resting-state functional connectivity MRI (R-fcMRI) is used to understand the dynamic functional networks in normal aging and neuropsychiatric disorders, such as LLD and mild cognitive impairment. R-fcMRI is based on the discovery that interregional correlations of spontaneous low frequency blood oxygenation level-dependent (BOLD) fluctuations between spatially distinct but functionally related brain regions exist in the absence of a task.6, 7 Several investigations have revealed individual resting-state brain network (RSN) functional connectivity (Fc) abnormalities in LLD and aMCI patients.8-13 However, whether the whole brain network organization is disrupted in those with LLD alone or when comorbid with aMCI has not been established.
Recent methodological advances based on graph theoretical approaches have been utilized to quantitatively map the topological organization of large-scale complex neural systems across the entire brain.14, 15 Graph theory provides a mathematical framework to describe the brain's organizational pattern by creating graphs composed of nodes as interacting units interconnected by edges to represent the network. Graph analysis revealed that the normal human brain exhibits efficient small-worldness,16 which is a balance between high degrees of segregation (measured by local efficiency and clustering coefficient metrics) and integration (characterized by decreased path length and increased global efficiency metrics)17. The brain networks are organized in community structure or modular sub-networks 18. Each module consists of functionally related nodes that may subserve similar roles, and exhibit dense intra-modular and sparse inter-modular nodal connectivities. Small-world networks, which are comprised of highly connected network nodes (hubs) and modules, support specialized and integrated information processing, thereby maximizing efficient information propagation throughout the whole brain.19 As a function of normal aging, the efficient network organization is lost and community structure becomes less modular.20 Altered topologic properties of functional networks are associated with depression,21, 22 and preclinical, prodromal and clinical AD.20, 23-25 Recent graph theoretical applications to assess the gray matter structural covariance networks in LLD demonstrated vulnerabilities in the cortical-subcortical topological properties.26, 27 Using diffusion tensor imaging, distinct changes in the network efficiency measures were associated with depression severity and remission in those with LLD.28, 29 However, to date, no investigations have elucidated the differential effects of LLD and aMCI, when these disorders appear independently or co-exist on the functional network topological organization.
This study's objectives were to investigate the differences in the small-world measures and modular community structure between patients with LLD and aMCI when occurring alone or in combination and normal controls. Further, we assessed whether the changes in small-world measures were associated with depressive symptom severity and memory performance.
Methods
Participants
A total of seventy-nine participants aged 60 or older participated in this cross-sectional study. The participant groups include cognitive normal (CN: n = 25), late-life depression (LLD: n = 23), amnestic mild cognitive impairment (aMCI: n = 18), and LLD with comorbid aMCI (aMCI-LLD: n = 13). All patients diagnosed as having clinically significant depression and/or aMCI were recruited from the Medical College of Wisconsin (MCW) Geriatric Psychiatry and Memory Disorders Clinics. Control subjects were recruited from the community through local advertisements. All participants provided written informed consent according to protocols approved by the MCW Institutional Review Board.
Study participants received detailed clinical and neuropsychiatric assessments, as described previously.11, 30 The core neuropsychological battery administered to all participants included the Mini-Mental State Examination (MMSE), Mattis Dementia Rating Scale-2 (MDRS-2) (age- and education-corrected MOANS-scaled score of ≥ 5), education-adjusted Logical Memory II Delayed paragraph recall (LMII-DR) subscale from the Wechsler Memory Scale-Revised, Physical Self Maintenance Scale/Instrumental Activities of Daily Living (PSMS/IADL), 30-item Yesavage Geriatric Depression Scale (GDS), Diagnostic assessment for Axis 1 disorders, including the depression module from the Structured Clinical Interview for DSM IV (SCID), and Hamilton Anxiety Scale (HAM-A). All participants scored ≤ 4 on the modified Hachinski ischemic scale (HIS). The neuropsychological and functional scales were chosen based on their ability to characterize cognitive functioning in previous LLD and aMCI studies.31, 32 GDS was chosen because of its reliability in assessing depressive symptoms in LLD and aMCI subjects.33, 34 Clinical assessment findings were reviewed during the weekly consensus conferences attended by neurologists, neuropsychologists and a geriatric psychiatrist (see supplement for detailed inclusion criteria of individual groups).
Exclusion criteria included past or current history of concurrent Axis 1 psychiatric disorders, such as psychotic or bipolar disorders; alcohol or substance abuse/dependence during the past five years; active suicidality; MMSE scores < 24; history of neurological diseases, including Parkinson's disease, dementia, multiple sclerosis, seizures, or stroke; head injury with loss of consciousness; MRI contraindications and unstable medical conditions.
MRI Data Acquisition
MR imaging was performed using a whole-body 3T Signa GE scanner (GE, Waukesha, Wis.) with a standard transmit-receive head coil. Whole-brain sagittal R-fcMRI data sets were obtained in eight minutes with a single-shot gradient echo-echo planar imaging pulse sequence. Participants were instructed to close their eyes and relax, and no specific cognitive tasks were performed. The R-fcMRI imaging parameters were: TE = 25 ms, TR = 2000 ms, flip angle of 90°, number of slices = 36, slice thickness = 4 mm, matrix size = 64 × 64, and field of view = 240 × 240 mm. High-resolution 3D spoiled gradient-recalled echo (SPGR) axial images were acquired for anatomical reference. The parameters were: TE/TR/TI of 4/10/450 ms, flip angle of 12°, number of slices = 144, slice thickness = 1 mm, matrix size = 256 ×192 and FOV = 240 × 240 mm.
MRI Data Processing
R-fcMRI analyses were conducted using AFNI software (http://afni.nimh.nih.gov/afni), FSL software (http://fsl.fmrib.ox.ac.uk/) and MATLAB programs (The MathWorks Inc., Natick, MA), as described previously.11 The raw data spikes were removed (3dDespike), motion correction was performed by volume registration on the R-fcMRI data (3dvolreg) and detrending was carried out to remove Legendre polynomials (3dDetrend). Participant head motion was monitored at realtime during the scans. Images with translational motion > 2 mm and rotational motion > 2° were subjected to rescan. Possible contamination from the signals in white matter, cerebrospinal fluid, six rigid body motion vectors, physical noise (cardiac and respiratory signals) and global signal were regressed out from each voxel time series (3dretroicor and 3dDeconvolve). A band-pass filter was applied to isolate spontaneous low-frequency fluctuations within the range of 0.015 and 0.1 Hz. Anatomical MRI was used to align functional MRI to MNI space. Specifically, FLIRT command from FSL software was used to spatially transform the SPGR structural MRI to the MNI space. The parameters obtained from the transformation were then utilized to align EPI functional MRI to MNI space. No smoothing procedure was performed during data preprocessing.
Functional Network Construction
A whole-brain parcellation method was recently created using a set of 264 functional regions of interest (ROIs).35 These ROIs were generated based on meta-analyses of task-derived fMRI studies combined with whole-brain Fc-mapping techniques. Briefly, 151 non-overlapping ROIs using the meta-analytic ROI definition, and 193 non-overlapping ROIs using the fc-mapping ROI approach were initially generated. The meta-analytic ROIs and Fc-mapping ROIs were then merged by giving the former ROIs preference, resulting in 264 independent ROIs. Using this set of 264 functional ROIs, graphs of whole brain functional network organization was investigated in healthy adults using R-fMRI technique. The subgraphs (e.g. the default mode, sensory and motor functional subnetworks) derived using these ROIs shows substantial agreement with task-dependent functional neural systems defined previously, relative to voxelwise and atlas-based parcellation techniques.35 5-mm radius spherically shaped ROIs was created based on MNI coordinates from each of the predefined 264 brain regions.35 For each participant, the average time courses from the 264 ROIs were extracted to calculate the Pearson correlation coefficients (CC) between each ROI pair. The Fc networks were modeled based on an undirected and unweighted approach.
Graph Theory Analyses
Global graph theoretical measures, such as cost, path length, clustering coefficient, small-worldness, global and local efficiencies were calculated to characterize the brain functional network structure, information integration and segregation in each participant, using the Brain Connectivity Toolbox (www.brain-connectivity-toolbox.net).15 All graph theory properties were calculated over a threshold range (0.03 < cost < 0.5). This threshold range was chosen to ensure that all individual networks sustained a complete graph. The graph started becoming fragmented as the cost went down. We further calculated the regional graph theoretical measurements, such as the nodal efficiency and betweenness centrality of each node in all participants.
To demonstrate that the functional networks are the sum of the functionally distinct subnetworks, we calculated the modular distribution of the unthresholded 264 × 264 connectivity matrix for each subject using Newman algorithm,15, 18 after removing all negative connectivity values. We then computed the normalized mutual information (NMI) scores, which represent the similarities between the functional network modular organization for each and every pair of study participants.19, 36 See supplementary methods section for additional details.
Statistical Analysis
Group comparisons for demographic information (age and education) except gender (χ2 test) were compared using analysis of variance (SPSS 18.0; SPSS Inc., Chicago, Ill.). The sources of the differences between the means of the four groups were examined by post-hoc Fisher's Least Significant Difference test for demographics. The differences in the graph theoretical measurements among the four participant groups were calculated using analysis of covariance (ANCOVA), while controlling for age, gender, education and gray matter volume (GMV). Post-hoc t-tests further revealed the source of the between group differences at the significance level of p < 0.05. False discovery rate (FDR)37 correction (q < 0.05) was applied to all comparisons of the regional graph theoretical calculations to account for multiple comparisons. Since the distributions of the NMI scores were not normally distributed, we used non-parametric Kruskal–Wallis one-way ANCOVA to determine the differences among the participant groups, after regressing out age, gender, education and GMV. Non-parametric post-hoc Mann-Whitney test was used to reveal the source of the differences between the specific group pairs. Multiple linear regression analyses were performed to investigate the relationships between mean efficiency measures (global, local, and nodal efficiencies) and behavioral measures (GDS and LMII-DR scores), respectively in each participant group separately while controlling for age, gender, education, and GMV.
Results
Demographic and Neuropsychological Characteristics
The demographics and neuropsychological characteristics are summarized in Table 1. The aMCI group was significantly older than the other three groups (p < 0.01), while no significant differences were found in gender and education among the four groups (p > 0.05).
Table 1. Demographics and neuropsychiatric characteristics.
| CN (n = 25) | LLD (n = 23) | aMCI (n = 18) | aMCI-LLD (n = 13) | p-value | |
|---|---|---|---|---|---|
|
|
|
|
|
||
| Mean ± SD | Mean ± SD | Mean ± SD | Mean ± SD | ||
| Age | 70.96 ± 6.99 | 67.78 ± 5.91 | 76.94 ± 6.84 | 71.62 ± 6.49 | <0.01 bdf |
| Gender (F/M) | 14/11 | 16/4 | 8/10 | 6/7 | 0.098 |
| Education | 15.84 ± 2.51 | 14.96 ± 2.69 | 14.11 ± 2.45 | 14.08 ± 2.93 | 0.114 |
| Neuropsychiatric measurements | |||||
| GDS | 2.00 ± 2.08 | 16.23 ± 3.58 | 3.50 ± 2.50 | 16.00 ± 6.47 | <0.001 acdf |
| MMSE | 28.72 ± 1.40 | 28.26 ± 1.18 | 27.44 ± 1.82 | 26.85 ± 1.86 | 0.002 bce |
| HAM-A | 1.09 ± 1.12 | 9.96 ± 4.86 | 1.80 ± 1.70† | 8.92 ± 4.11 | <0.001 acdf |
| Recall Scores | |||||
| Immediate | 15.16 ± 3.27 | 14.04 ± 3.77 | 8.67 ± 3.76 | 7.08 ± 3.62 | <0.001 bcde |
| Delayed | 13.20 ± 2.99 | 12.39 ± 3.89 | 2.28 ± 3.06 | 3.23 ± 3.00 | <0.001 bcde |
| DRS-2 raw scores | |||||
| Attention | 36.44 ± 0.51 | 36.43 ± 0.59 | 35.67 ± 0.77 | 36.08 ± 1.19 | 0.004 bd |
| Init/Pers | 36.40 ± 1.19 | 36.39 ± 1.88 | 34.50 ± 4.15 | 32.46 ± 5.32 | 0.001 ce |
| Construct | 5.96 ± 0.20 | 5.96 ± 0.21 | 5.94 ± 0.24 | 5.85 ± 0.55 | 0.685 |
| Conceptual | 37.64 ± 1.38 | 36.65 ± 3.45 | 36.39 ± 2.06 | 35.54 ± 3.02 | 0.105 |
| Memory | 23.84 ± 1.11 | 24.00 ± 1.13 | 18.39 ± 2.75 | 19.69 ± 3.52 | <0.001 bcde |
| Total | 140.28 ± 2.46 | 139.91 ± 3.04 | 130.44 ± 5.17 | 130.00 ± 6.53 | <0.001 bcde |
| Current antidepressants (%) | |||||
| No antidepressant | N/A | 2 (8.7) | 17 (94.4) | 2 (15.4) | |
| SSRI monotherapy | N/A | 3 (13.0) | 1 (5.6) | 3 (23.1) | |
| SNRI monotherapy | N/A | 5 (21.7) | N/A | 2 (15.4) | |
| Other | N/A | 3 (13.0) | N/A | 1 (7.7) | |
| Combination treatment | N/A | 10 (43.5) | N/A | 5 (38.5) | |
| Current cognitive enhancers (%) | |||||
| No cognitive enhancer | N/A | N/A | 8 (44.4) | 9 (69.2) | |
| ChEI monotherapy | N/A | N/A | 8 (44.4) | 2 (15.4) | |
| Memantine monotherapy | N/A | N/A | 1 (5.6) | 2 (15.4) | |
| Combination treatment | N/A | N/A | 1 (5.6) | N/A | |
Notes - ANOVA showed significant differences in age, neuropsychiatric measurements in GDS, MMSE, HAM-A, Recall scores (immediate and delayed), and DRS-2 raw scores (except for construct and conceptual). a-f: Post-hoc analyses revealed the source of ANOVA (a: CN vs LLD, b: CN vs aMCI, c: CN vs aMCI-LLD, d: LLD vs aMCI, e: LLD vs aMCI-LLD, f: aMCI vs aMCI-LLD).
Three aMCI subjects did not have HAM-A scores, the Mean and SD are based on the remaining 15 subjects.
Abbreviations: CN, cognitively normal; LLD, late-life depression; aMCI, amnestic mild cognitive impairment; aMCI-LLD, late-life depression comorbid with amnestic mild cognitive impairment; SD, standard deviation; F/M, female/male; GDS, geriatric depression scale; MMSE, mini-mental state examination; HAM-A, hamilton anxiety; DRS-2, dementia rating scale-2; Init/Pers, Initiation/Perseveration
Global Graph Theoretical Analyses
The aMCI-LLD group showed decreased global efficiency and increased path length when compared to the CN, LLD, and aMCI groups. The local efficiency of the depressed groups (LLD and aMCI-LLD) was decreased, relative to CN. aMCI-LLD subjects also showed reduced local efficiency when compared with the aMCI group. At a lower cost, the small-worldness (Sigma) of all three patient groups was significantly lower than that of the CN group (Figure 1, Table S1).
Figure 1. Global graph theoretical measurements for CN (black), LLD (red), aMCI (blue), and aMCI-LLD (green).
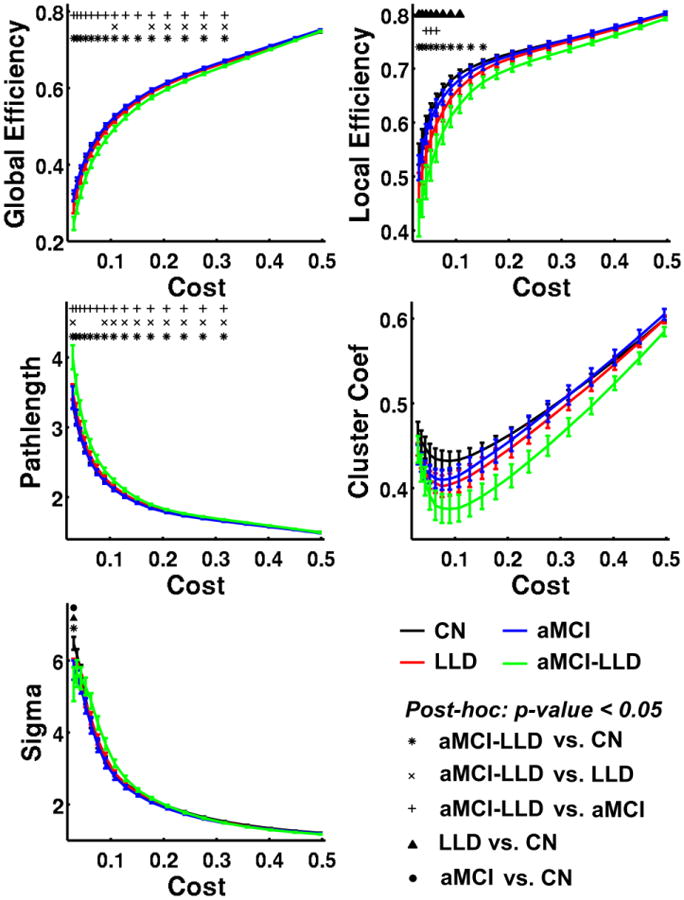
Error bars in the figures represent the standard error. Asterisk (*), cross-sign (×), and plus-sign (+) indicate that aMCI-LLD group is significantly different from CN, LLD and aMCI groups, respectively. Filled triangle (▲) and circle (●) indicate that LLD and aMCI groups differ significantly from the CN group. Abbreviations: CN, cognitively normal; LLD, late-life depression; aMCI, amnestic mild cognitive impairment; aMCI-LLD, late-life depression comorbid with amnestic mild cognitive impairment.
Regional Graph Theoretical Analyses
The left insula and precentral gyrus (PreCG) showed significantly decreased mean nodal efficiency in aMCI-LLD subjects, relative to the other three groups (Table 2, FDR corrected q < 0.05 and p < 0.0005). At an uncorrected threshold (p < 0.01), the dorsal anterior cingulate gyrus (dACC) showed decreased mean nodal efficiency in all three patient groups compared to the CN group. Ventromedial prefrontal cortex (VMPFC), middle temporal gyrus (MTG), temporal pole (TP) and paracentral gyrus (ParaCG) showed lower mean nodal efficiency in the aMCI-LLD group compared to CN, LLD, and aMCI groups. Middle cingulate cortex (MCC), right PreCG and precuneus showed reduced nodal efficiency in aMCI-LLD group compared to the CN and aMCI groups. Superior frontal gyrus showed decreased nodal efficiency in aMCI compared to the CN group (Figure S1).
Table 2. Mean nodal efficiency.
| Regions | Side | Coordinates (x, y, z) |
Mean Nodal Efficiency (SD) | p-value | CN vs LLD |
CN vs aMCI |
CN vs aMCI- LLD |
LLD vs aMCI |
LLD vs aMCI- LLD |
aMCI vs aMCI- LLD |
|||||||
|---|---|---|---|---|---|---|---|---|---|---|---|---|---|---|---|---|---|
|
| |||||||||||||||||
| CN | LLD | aMCI | aMCI-LLD | ||||||||||||||
| dACC | R | (5, -18, 34) | 0.584 | (0.032) | 0.564 | (0.034) | 0.562 | (0.030) | 0.551 | (0.035) | 0.0040 | * | * | * | |||
| VMPFC | R | (3, -44, -9) | 0.561 | (0.030) | 0.572 | (0.040) | 0.576 | (0.046) | 0.527 | (0.040) | 0.0048 | * | * | * | |||
| MTG | R | (52, 63, 5) | 0.569 | (0.037) | 0.570 | (0.034) | 0.584 | (0.041) | 0.527 | (0.051) | 0.0040 | * | * | * | |||
| TP | L | (-46, -16, -30) | 0.575 | (0.034) | 0.564 | (0.040) | 0.587 | (0.045) | 0.532 | (0.034) | 0.0029 | * | * | * | |||
| Insula | L | (-34, -16, -8) | 0.585 | (0.034) | 0.584 | (0.036) | 0.583 | (0.041) | 0.529 | (0.047) | 0.0003 | * | * | * | |||
| MCC | R | (14, 18, 40) | 0.555 | (0.049) | 0.526 | (0.060) | 0.554 | (0.037) | 0.492 | (0.069) | 0.0036 | * | * | ||||
| PreCG | R | (7, 33, 72) | 0.578 | (0.032) | 0.557 | (0.046) | 0.573 | (0.039) | 0.529 | (0.043) | 0.0064 | * | * | ||||
| PreCG | L | (-13, 33, 75) | 0.584 | (0.030) | 0.574 | (0.040) | 0.578 | (0.048) | 0.519 | (0.056) | 0.0003 | * | * | * | |||
| ParaCG | L | (-10, 17, 74) | 0.575 | (0.033) | 0.567 | (0.044) | 0.591 | (0.042) | 0.537 | (0.032) | 0.0046 | * | * | * | |||
| SFG | R | (16, 5, 71) | 0.562 | (0.028) | 0.564 | (0.040) | 0.594 | (0.033) | 0.540 | (0.047) | 0.0058 | * | * | ||||
| SPC/Precu | L | (-25, 58, 60) | 0.573 | (0.041) | 0.560 | (0.047) | 0.569 | (0.043) | 0.512 | (0.075) | 0.0025 | * | * | ||||
Boldface: Comparisons survived after FDR correction (q < 0.05 and p < 0.0005),
: significant between-group differences based in the nonparametric post-hoc tests.
Abbreviations: CN, cognitively normal; LLD, late-life depression; aMCI, amnestic mild cognitive impairment; aMCI-LLD, late-life depression comorbid with amnestic mild cognitive impairment; dACC: dorsal anterior cingulate cortex, VMPFC: ventromedial prefrontal cortex, MTG: middle temporal gyrus, TP: temporal pole, MCC: middle cingulate cortex, PreCG: precentral gyrus, ParaCG: paracentral gyrus; SFG: superior frontal gyrus, SPC: superior parietal cortex, Precu: precuneus.
Figure S2 illustrates the functional network hubs calculated as the normalized betweenness centrality larger than two standard deviations above the mean. A total of 20 brain regions were determined as network hubs in either one of the participant groups (Table S2 and Figure S3).
Modularity and Normalized Mutual Information
The functional network modular organization for the CN, LLD, aMCI and aMCI-LLD groups are shown in Figure 2. The normal aged brain was comprised of four distinct modules: the default mode network (DMN), salience network (SN), executive control-visual attention network (ECN/VAN) and sensorimotor network (SMN) modules. In the LLD and aMCI groups, the DMN module was split into two smaller modules (DMN and DMN2): one that was largely made up of the midline frontal structures and the other consisting of the dorsomedial prefrontal, posterior default mode and temporal lobe regions. The SN module had fewer functional connections in the LLD group, absent connections on the right side in the aMCI-only patients, and was completely absent in the comorbid group where the regions were merged with the sensorimotor and DMN modules. The combined ECN/VAN was separated into two distinct modules, ECN and VAN, in all three diseased groups. Finally, the within-group NMI was significantly lower (p < 0.005) in the depressed groups (LLD and aMCI-LLD), relative to CN and aMCI groups (Figure 3).
Figure 2. Brain functional network modular distribution in the CN, LLD, aMCI, and aMCI-LLD groups.
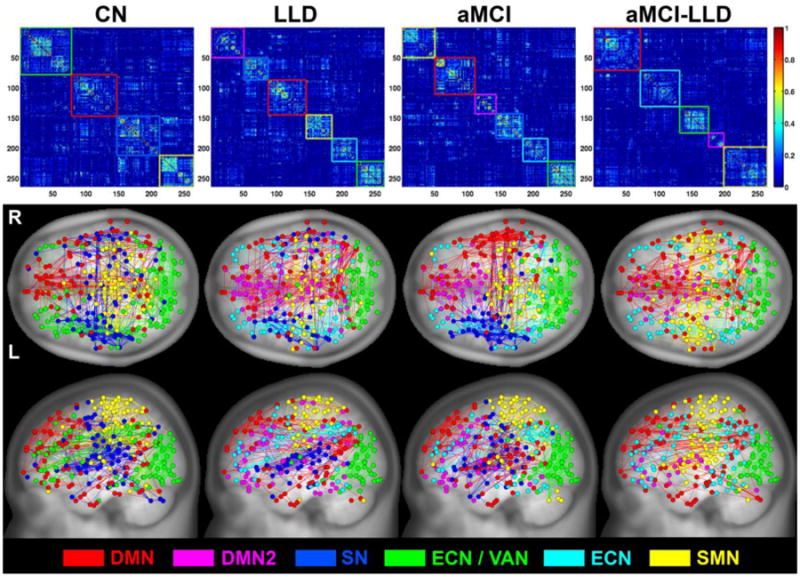
(Top) Group-level average functional connectivity matrices organized based on their modular distributions (DMN = red, DMN2 = magenta, SN = blue, ECN/VAN = green, ECN = cyan, and SMN = yellow). (Bottom) Brain functional connectivity pattern color-coded anatomical representation for the four participant groups.
Abbreviations: CN, cognitively normal; LLD, late-life depression; aMCI, amnestic mild cognitive impairment; aMCI-LLD, late-life depression comorbid with amnestic mild cognitive impairment; DMN: default mode network, SN: salience network, ECN: executive control network, VAN: visual attention network, SMN: sensory motor network.
Figure 3.
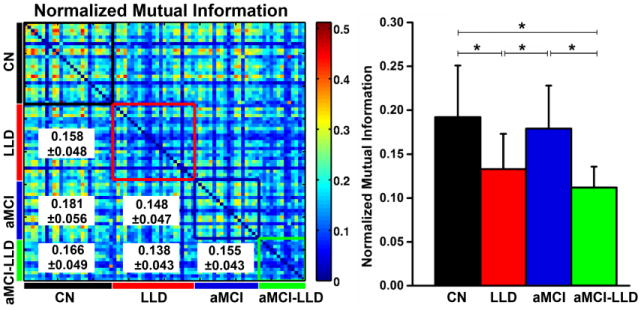
(Left) Similarity between the modular structures of the functional networks for each participant pair, measured by normalized mutual information (NMI). The color-coded boxes placed along the NMI matrix diagonal represent the within-group modular similarity (CN = black, LLD = red, aMCI = blue, and aMCI-LLD = green). The between-group NMI values (mean ± SD) are listed in the lower triangular matrix. (Right) Histograms showing the mean and SD of the within-group NMI values for each group. Asterisks denote significant differences (p < 0.005) obtained by non-parametric post-hoc tests among the four participant groups. SD: standard deviation. Abbreviations: CN, cognitively normal; LLD, late-life depression; aMCI, amnestic mild cognitive impairment; aMCI-LLD, late-life depression comorbid with amnestic mild cognitive impairment.
Relationships of small-world measures with behaviors
Mean global efficiency was negatively correlated with GDS scores in the aMCI-LLD (r = 0.42, p = 0.0003) and LLD-only (r = 0.26, p = 0.03) groups (Figure 4A). Mean local efficiency was also negatively correlated with GDS scores in the aMCI-LLD (r = 0.41, p = 0.0004) and LLD-only (r = 0.25, p = 0.004) groups (Figure 4B). Mean nodal efficiency in the insula (r = 0.04, p = 0.0006) and precentral gyrus (r = 0.53, p < 0.0001) was negatively correlated with GDS scores in the aMCI-LLD group, but not in the LLD-only groups (Figure 4C). None of the small-world measures significantly correlated with the memory (LMII-DR) scores in any of the subject groups.
Figure 4.
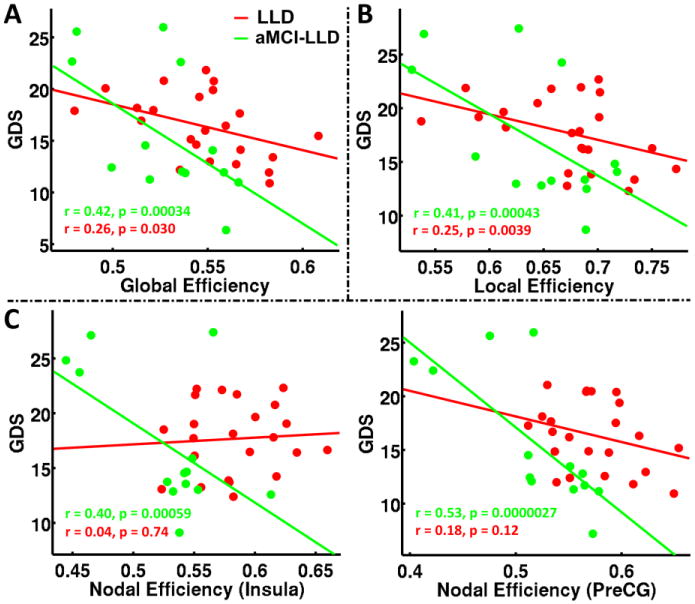
Relationships between mean (A) Global efficiency; (B) Local efficiency; and (C) Nodal efficiencies of insula and precentral gyrus metrics and depressive symptom severity in patients with LLD and aMCI-LLD. Abbreviations: LLD: late-life depression; aMCI-LLD: late-life depression comorbid with amnestic mild cognitive impairment; GDS: Geriatric depression scale; PreCG: precentral gyrus.
Discussion
Patients with aMCI-LLD comorbidity demonstrated the greatest disruptions in the functional networks' abilities to integrate information (diminished global efficiency), relative to the other groups. LLD patients, regardless of cognitive status, also showed disrupted functional network segregation (diminished local efficiency), relative to controls. Those with comorbidity had decreased local efficiency compared to nondepressed aMCI patients. Further, greatest disruptions in the mean nodal efficiency were seen in those with comorbidity, followed by LLD and nondepressed aMCI groups. The modular community structure was most variable in those patients with depression: the disrupted modular reorganization was greatest within the comorbid group, followed by LLD-only participants. Finally, reduced mean efficiency values were associated with increased depressive symptom severity but not memory performance, in the depressed groups.
Global topological organization of the functional networks in LLD and aMCI
The functional networks are considered economical and small-world-like when global and local efficiency of information flow occur at low connectivity cost. Although small-worldedness in LLD and aMCI groups was lower than controls at low cost, this network parameter did not distinguish different patient groups from controls at higher cost. In contrast, we detected decreased global efficiency and increased path length in patients with comorbid LLD and aMCI, relative to other groups. These results suggest that the effectiveness of information propogation and the ease with which remote brain regions communicate between each other is significantly diminished when LLD coexists with aMCI. Older depressed individuals, regardless of their cognitive impairment statuses, showed reduced local efficiency, which is reflective of deficient segregation of functional neural processing and lower levels of local connectedness. Our results of similar functional integration measures between nondepressed aMCI, cognitively normal LLD and control subjects are consistent with recent investigations.21, 23 However, Wang et al. revealed a longer characteristic path length in aMCI patients24; their sample was younger and more cognitively impaired than ours. Moreover, we used functionally defined 264 ROIs as described recently,35 whereas Wang et al. utilized automated anatomical labeling (AAL) parcellation approach. This could explain the discrepant results. Our results provide novel evidence that LLD is a disorder with disrupted global functional network organization and those with higher levels of cognitive impairment demonstrate the greatest alterations. The global functional network metrics may serve as biomarkers of different clinical phenotypic presentations of LLD.
Regional nodal characteristics of the functional networks in LLD and aMCI
Core hubs
The regions with high betweenness centrality that are identified in our control group (posterior cingulate, insula, inferior frontal gyrus, ventromedial prefrontal cortex and cuneus) are in accordance with the highly connected hubs reported in previous functional network studies (Table S1).21, 23 These hubs, which are essential for effective communication and robust network performance, are also critical nodes of the default mode and salience networks, as extensively described in the literature.38 Rostral PCC, the only high-degree hub that was retained in all four groups, is a crucial DMN component, and has shown disrupted functional connectivity in those with LLD and aMCI. However, other brain regions that were core hubs in normal older adults became nonhubs in the presence of LLD and/or aMCI. In the cognitively normal patients with LLD, the hubs were predominantly located in the default mode and salience networks, whereas in the aMCI groups, they were more scattered and included critical components of the default mode, executive control, attention and sensorimotor networks. These findings are supportive of the view that the core hubs are particularly vulnerable to random failures and targeted attacks by pathophysiological processes associated with these disease states. This warrants further evaluation.
Mean nodal efficiency
Individuals with comorbid LLD-aMCI showed diminished performance in the left insula and precentral gyrus nodes, relative to the other groups. The insula, which is particularly sensitive to salient environmental events, is implicated in various cognitive, affective and homeostatic functions, including interoceptive awareness and emotional experiences.39 Previously, decreased insula connectivity has been revealed in younger and middle-aged patients with major depression and in older nondepressed individuals with aMCI.13, 40 Decreases within the salience network Fc in those with major depression have been associated with symptom severity.41 We are particularly intrigued by the observation of decreased nodal performance of primary motor cortex in the comorbid group. Psychomotor retardation that is commonly described in major depression may be reflective of disrupted motor pathways.42 Primary motor cortex dysfunction is also reported in those with aMCI, and may be associated with poorer gait performance.43
The deleterious effects of comorbid LLD and aMCI on network performance were also observed in important frontal, parietal and temporal nodes that are components of major intrinsic RSNs. Independent studies have demonstrated distinct abnormalities in these RSNs in patients with LLD and aMCI when occurring alone or in combination.9-12 In contrast, we only found subtle performance disruptions in one frontal node in nondepressed aMCI patients and in the dorsal ACC region in aMCI and LLD groups. Our results indicate that the greater dysfunction in the regional networks by affecting crucial nodes of different RSNs primarily occur when LLD and aMCI co-exists.
These findings were present despite the fact that the comorbid group demonstrated comparable levels of depression severity as the LLD-only group and a similar degree of cognitive deficits as the nondepressed aMCI subjects. The coexistence of depression with aMCI is associated with greater atrophy and functional and structural connectivity disruptions in the episodic memory networks, and conversion to AD, relative to nondepressed aMCI.11, 30, 44, 45 It is unclear however if better network performance and improvement of depressive symptoms will delay the progression to AD in those with comorbidity, which should be investigated in the future.
Modular reorganization of functional brain networks in LLD groups
The community structure at the nodal level was most variable in the LLD groups, with modular reorganization of functional networks being the greatest for those with comorbidity. DMN is made of different subsystems; the anterior subsystem is essential for emotional and social cognitive processing, whereas the posterior subsystem is important for episodic memory and self-referential processing. Anterior-posterior DMN connectivity stability is important for higher level cognitive functions in humans,46 and its disruptions suggest inefficient cognitive processing in those with LLD and aMCI. The SN regions, on the other hand, are thought to mediate the dynamic functional interactions between the DMN and ECN. 39 The instability of this network may explain the multidomain cognitive dysfunction present in those with LLD and aMCI. A left-right asymmetry in the hippocampal volume and the episodic memory functional connections has been previously reported in those with aMCI-only and when comorbid with depression.47, 48 Here, we extend these findings to also include the SN where functional connections were absent on the right side in both aMCI groups, with these modules being completely disrupted bilaterally in the comorbid group. The module comprised of the frontal, anterior cingulate, parietal and visual areas in the normal aging brain were separated into two modules (i.e., fronto-parietal and visual attention modules) in the diseased brain networks. We utilized NMI to determine the community structure similarities within each subject group and between groups. The mean NMI within the control group was the highest followed by the nondepressed aMCI subjects. The mean NMI between brain networks of the comorbid LLD and aMCI patients was the lowest, followed by the cognitively normal patients with LLD. The variability in the modular organization in LLD groups may explain the heterogeneity in the pathophysiologic mechanisms that contribute to the clinical presentations and outcomes associated with this disorder.
Our results demonstrate that significantly disrupted mean global, local and nodal efficiency metrics were associated with greater depressive symptom severity in the LLD groups regardless of their cognitive status. We hypothesize that modulation of small world configuration towards normal levels with treatment (i.e. improved integrated and segregated information processing, and efficient hub performance) is essential for improvement of depressive symptoms in those with LLD. The potential of graph theory measures as markers of treatment response in the depressed elderly should be the focus of future investigations.
Limitations
First, the sample size is modest, especially in the comorbid group; thus, the robustness of our work should be determined by replicating our results using larger samples. Second, the majority of our LLD subjects took antidepressants. Therefore, we are unable to discriminate medication effects from those associated with the disease itself. Several serotonin receptor (5-HT) subtypes (e.g. 5-HT1A, 5-HT2), which antidepressants bind to are abundant in the hubs of major intrinsic networks, including the DMN and SN. 5-HT receptor binding regulates functioning of these brain network hubs, possibly via glutamate and GABA modulation.49, 50 An ideal study design therefore would have been to include antidepressant free participants to eliminate the potential confound of medication exposure. The ethical and practical challenges restricted us from performing such a study. Our goal in this preliminary cross-sectional investigation was to include participants with varying levels of depression severity including those with moderate and more severe depression. Similarly, most of our aMCI subjects took cognitive enhancers. Although acetylcholinesterase inhibitors (ChEI) and memantine are not approved for treatment of aMCI, physicians commonly prescribe these medications off label to those with aMCI.51 Therefore, as long as aMCI patients were on stable doses and the dosages were not expected to change during the study participation, cognitive enhancer use was allowed. Third, spurious correlations in R-fMRI data may continue to persist even after performing motion regression.52 We therefore compared the six rigid-body head displacement parameters among the 4 participant groups, but did not detect any significant differences. Finally, as opposed to the unweighted (binary) approach used in this study, a few studies have utilized weighted approaches to calculate the topological organization of the functional networks. However, a recent study showed that the binary (unweighted) functional connectivity was a more reliable approach to calculate the small-world measures when considering actual R-fMRI data, compared to the weighted approaches.53
In summary, our results reveal that LLD, regardless of aMCI status, significantly disrupts functional brain network topology; these disruptions are related to depression severity. The coexistence of LLD and aMCI was associated with the greatest disruptions in the small world measures and modular network architecture, followed by LLD alone. Future investigations using multimodal neuroimaging methods should be conducted to clarify the cognitive and behavioral correlates of abnormal network topological properties, and to provide potential targets for treatment interventions that can modulate network disruptions in individuals with LLD.
Supplementary Material
Figure S1. Anatomical node representation showing altered nodal efficiency. Gray circles represent uncorrected significant for p < 0.01 and black circles represent FDR corrected significant level for q < 0.05 and p < 0.001.
Abbreviations: CN, cognitively normal; LLD, late-life depression; aMCI, amnestic mild cognitive impairment; aMCI-LLD, late-life depression comorbid with amnestic mild cognitive impairment; dACC: dorsal anterior cingulate cortex, VMPFC: ventromedial prefrontal cortex, MTG: middle temporal gyrus, TP: temporal pole, MCC: middle cingulate cortex, PreCG: precentral gyrus, SFG: superior frontal gyrus, SPC: superior parietal cortex, Precu: precuneus.
Figure S2. Network hub anatomical organization of all four participant groups calculated as the normalized betweenness centrality larger than two standard deviations above the mean.
Abbreviations: CN, cognitively normal; LLD, late-life depression; aMCI, amnestic mild cognitive impairment; aMCI-LLD, late-life depression comorbid with amnestic mild cognitive impairment; PCC: posterior cingulate gyrus, VMPFC: ventral medial prefrontal cortex, dPCC: dorsal PCC, IFG: inferior frontal gyrus, dACC: dorsal anterior cingulate cortex, MCC: middle cingulate cortex, STG: superior temporal gyrus, TPJ: temporoparietal junction, IPC: inferior parietal cortex, PreCG: precentral gyrus.
Figure S3. Normalized betweenness centrality for the participant groups. Abbreviations: CN, cognitively normal; LLD, late-life depression; aMCI, amnestic mild cognitive impairment; aMCI-LLD, late-life depression comorbid with amnestic mild cognitive impairment.
Table S1. Significant p-values of the ANCOVA comparisons of the small-world measurements among the CN, LLD, aMCI, and aMCI-LLD groups
Table S2. Normalized nodal betweenness centrality
Acknowledgments
The authors thank Ms. Carrie M. O'Connor, M.A., for editorial assistance, Ms. Stacy Claesges for subject recruitment and Mr. Yu Liu, M.S., for MRI technical support.
Funding: This work was supported by Alzheimer's Association New Investigator Research Grant NIRG-11-204070 (JSG), Advancing Healthier Wisconsin Endowment an endowment of the Medical College of Wisconsin (JSG), the Brain and Behavior Research Foundation (formerly NARSAD) Young Investigator program (JSG); Extendicare Foundation (JSG), R01 AD20279 (SJL) from the National Institute on Aging, and 8UL1TR000055 from the Clinical and Translational Science Award program of the National Center for Advancing Translational Sciences.
Competing interests PA served on the speaker bureaus of Novartis and Pfizer, received research support from Myriad, Glaxo Smith Kline, Pfizer, ICON, Premier Rach, Octa Pharma, Eisai, Bristol Myers Squibb, Janssen, Baxter and Elan. SL reports research grant funding from Pfizer; served as a consultant for Bristol-Meyers Squibb and BrainSymphonics, LLC. JG reports grant support from the Alzheimer's Association International grant program, Brain and Behavior Research Foundation (formerly NARSAD) Young Investigator program, Extendicare Foundation, and Advancing Healthier Wisconsin Endowment for Research to MCW.
Footnotes
Contributors: WL was involved in acquisition of data, study concept, data analysis and interpretation, statistical analysis and drafting the manuscript. BW, XL, and GC were involved in data analysis and interpretaion, statistical analysis, and drafting of the manuscript. JJ and PA were involved in data acquisition and interpretation. PA and SL carried out study concept and supervision. JG participated study concept and supervision, data acquisition and interpretation, drafting of the manuscript, and critical revision of the manuscript for important intellectual content.
Ethics approval: This study was approved by the ethical committee of the Institutional Review Board of the Medical College of Wisconsin.
References
- 1.Alexopoulos GS. Depression in the elderly. Lancet. 2005;365:1961–70. doi: 10.1016/S0140-6736(05)66665-2. [DOI] [PubMed] [Google Scholar]
- 2.Steffens DC, Otey E, Alexopoulos GS, et al. Perspectives on depression, mild cognitive impairment, and cognitive decline. Archives of general psychiatry. 2006;63:130–8. doi: 10.1001/archpsyc.63.2.130. [DOI] [PubMed] [Google Scholar]
- 3.Aizenstein HJ, Butters MA, Figurski JL, et al. Prefrontal and striatal activation during sequence learning in geriatric depression. Biological psychiatry. 2005;58:290–6. doi: 10.1016/j.biopsych.2005.04.023. [DOI] [PubMed] [Google Scholar]
- 4.Dickerson BC, Sperling RA. Large-scale functional brain network abnormalities in Alzheimer's disease: insights from functional neuroimaging. Behav Neurol. 2009;21:63–75. doi: 10.3233/BEN-2009-0227. [DOI] [PMC free article] [PubMed] [Google Scholar]
- 5.Tadayonnejad R, Ajilore O. Brain network dysfunction in late-life depression: a literature review. Journal of geriatric psychiatry and neurology. 2014;27:5–12. doi: 10.1177/0891988713516539. [DOI] [PubMed] [Google Scholar]
- 6.Biswal B, Yetkin FZ, Haughton VM, et al. Functional connectivity in the motor cortex of resting human brain using echo-planar MRI. Magnetic resonance in medicine: official journal of the Society of Magnetic Resonance in Medicine/Society of Magnetic Resonance in Medicine. 1995;34:537–41. doi: 10.1002/mrm.1910340409. [DOI] [PubMed] [Google Scholar]
- 7.Biswal BB, Mennes M, Zuo XN, et al. Toward discovery science of human brain function. Proceedings of the National Academy of Sciences of the United States of America. 2010;107:4734–9. doi: 10.1073/pnas.0911855107. [DOI] [PMC free article] [PubMed] [Google Scholar]
- 8.Kenny ER, O'Brien JT, Cousins DA, et al. Functional connectivity in late-life depression using resting-state functional magnetic resonance imaging. The American journal of geriatric psychiatry: official journal of the American Association for Geriatric Psychiatry. 2010;18:643–51. doi: 10.1097/JGP.0b013e3181cabd0e. [DOI] [PubMed] [Google Scholar]
- 9.Andreescu C, Wu M, Butters MA, et al. The default mode network in late-life anxious depression. The American journal of geriatric psychiatry: official journal of the American Association for Geriatric Psychiatry. 2011;19:980–3. doi: 10.1097/JGP.0b013e318227f4f9. [DOI] [PMC free article] [PubMed] [Google Scholar]
- 10.Alexopoulos GS, Hoptman MJ, Kanellopoulos D, et al. Functional connectivity in the cognitive control network and the default mode network in late-life depression. J Affect Disord. 2012;139:56–65. doi: 10.1016/j.jad.2011.12.002. [DOI] [PMC free article] [PubMed] [Google Scholar]
- 11.Xie C, Li W, Chen G, et al. Late-life depression, mild cognitive impairment and hippocampal functional network architecture. NeuroImage Clinical. 2013;3:311–20. doi: 10.1016/j.nicl.2013.09.002. [DOI] [PMC free article] [PubMed] [Google Scholar]
- 12.Sheline YI, Raichle ME. Resting State Functional Connectivity in Preclinical Alzheimer's Disease. Biological psychiatry. 2013 doi: 10.1016/j.biopsych.2012.11.028. [DOI] [PMC free article] [PubMed] [Google Scholar]
- 13.Xie C, Bai F, Yu H, et al. Abnormal insula functional network is associated with episodic memory decline in amnestic mild cognitive impairment. NeuroImage. 2012;63:320–7. doi: 10.1016/j.neuroimage.2012.06.062. [DOI] [PMC free article] [PubMed] [Google Scholar]
- 14.Bullmore E, Sporns O. Complex brain networks: graph theoretical analysis of structural and functional systems. Nature reviews Neuroscience. 2009;10:186–98. doi: 10.1038/nrn2575. [DOI] [PubMed] [Google Scholar]
- 15.Rubinov M, Sporns O. Complex network measures of brain connectivity: uses and interpretations. NeuroImage. 2010;52:1059–69. doi: 10.1016/j.neuroimage.2009.10.003. [DOI] [PubMed] [Google Scholar]
- 16.Watts DJ, Strogatz SH. Collective dynamics of ‘small-world’ networks. Nature. 1998;393:440–2. doi: 10.1038/30918. [DOI] [PubMed] [Google Scholar]
- 17.Achard S, Bullmore E. Efficiency and cost of economical brain functional networks. PLoS Comput Biol. 2007;3:e17. doi: 10.1371/journal.pcbi.0030017. [DOI] [PMC free article] [PubMed] [Google Scholar]
- 18.Newman ME. Modularity and community structure in networks. Proceedings of the National Academy of Sciences of the United States of America. 2006;103:8577–82. doi: 10.1073/pnas.0601602103. [DOI] [PMC free article] [PubMed] [Google Scholar]
- 19.Achard S, Delon-Martin C, Vertes PE, et al. Hubs of brain functional networks are radically reorganized in comatose patients. Proceedings of the National Academy of Sciences of the United States of America. 2012;109:20608–13. doi: 10.1073/pnas.1208933109. [DOI] [PMC free article] [PubMed] [Google Scholar]
- 20.Meunier D, Achard S, Morcom A, et al. Age-related changes in modular organization of human brain functional networks. NeuroImage. 2009;44:715–23. doi: 10.1016/j.neuroimage.2008.09.062. [DOI] [PubMed] [Google Scholar]
- 21.Bohr IJ, Kenny E, Blamire A, et al. Resting-state functional connectivity in late-life depression: higher global connectivity and more long distance connections. Front Psychiatry. 2012;3:116. doi: 10.3389/fpsyt.2012.00116. [DOI] [PMC free article] [PubMed] [Google Scholar]
- 22.Lord A, Horn D, Breakspear M, et al. Changes in community structure of resting state functional connectivity in unipolar depression. PloS one. 2012;7:e41282. doi: 10.1371/journal.pone.0041282. [DOI] [PMC free article] [PubMed] [Google Scholar]
- 23.Liu Z, Zhang Y, Yan H, et al. Altered topological patterns of brain networks in mild cognitive impairment and Alzheimer's disease: a resting-state fMRI study. Psychiatry research. 2012;202:118–25. doi: 10.1016/j.pscychresns.2012.03.002. [DOI] [PubMed] [Google Scholar]
- 24.Wang J, Zuo X, Dai Z, et al. Disrupted functional brain connectome in individuals at risk for Alzheimer's disease. Biological psychiatry. 2013;73:472–81. doi: 10.1016/j.biopsych.2012.03.026. [DOI] [PubMed] [Google Scholar]
- 25.Brier MR, Thomas JB, Fagan AM, et al. Functional connectivity and graph theory in preclinical Alzheimer's disease. Neurobiology of aging. 2014;35:757–68. doi: 10.1016/j.neurobiolaging.2013.10.081. [DOI] [PMC free article] [PubMed] [Google Scholar]
- 26.Lim HK, Jung WS, Aizenstein HJ. Aberrant topographical organization in gray matter structural network in late life depression: a graph theoretical analysis. International psychogeriatrics/IPA. 2013;25:1929–40. doi: 10.1017/S104161021300149X. [DOI] [PubMed] [Google Scholar]
- 27.Ajilore O, Lamar M, Leow A, et al. Graph theory analysis of cortical-subcortical networks in late-life depression. The American journal of geriatric psychiatry: official journal of the American Association for Geriatric Psychiatry. 2014;22:195–206. doi: 10.1016/j.jagp.2013.03.005. [DOI] [PMC free article] [PubMed] [Google Scholar]
- 28.Bai F, Shu N, Yuan Y, et al. Topologically Convergent and Divergent Structural Connectivity Patterns between Patients with Remitted Geriatric Depression and Amnestic Mild Cognitive Impairment. The Journal of neuroscience: the official journal of the Society for Neuroscience. 2012;32:4307–18. doi: 10.1523/JNEUROSCI.5061-11.2012. [DOI] [PMC free article] [PubMed] [Google Scholar]
- 29.Ajilore O, Lamar M, Kumar A. Association of brain network efficiency with aging, depression, and cognition. The American journal of geriatric psychiatry: official journal of the American Association for Geriatric Psychiatry. 2014;22:102–10. doi: 10.1016/j.jagp.2013.10.004. [DOI] [PMC free article] [PubMed] [Google Scholar]
- 30.Li W, Muftuler LT, Chen G, et al. Effects of the coexistence of late-life depression and mild cognitive impairment on white matter microstructure. J Neurol Sci. 2014;338:46–56. doi: 10.1016/j.jns.2013.12.016. [DOI] [PMC free article] [PubMed] [Google Scholar]
- 31.Butters MA, Whyte EM, Nebes RD, et al. The nature and determinants of neuropsychological functioning in late-life depression. Archives of general psychiatry. 2004;61:587–95. doi: 10.1001/archpsyc.61.6.587. [DOI] [PubMed] [Google Scholar]
- 32.Woodard JL, Seidenberg M, Nielson KA, et al. Semantic memory activation in amnestic mild cognitive impairment. Brain: a journal of neurology. 2009;132:2068–78. doi: 10.1093/brain/awp157. [DOI] [PMC free article] [PubMed] [Google Scholar]
- 33.Debruyne H, Van Buggenhout M, Le Bastard N, et al. Is the geriatric depression scale a reliable screening tool for depressive symptoms in elderly patients with cognitive impairment? International journal of geriatric psychiatry. 2009;24:556–62. doi: 10.1002/gps.2154. [DOI] [PubMed] [Google Scholar]
- 34.Van der Mussele S, Fransen E, Struyfs H, et al. Depression in Mild Cognitive Impairment is associated with Progression to Alzheimer's Disease: A Longitudinal Study. J Alzheimers Dis. 2014;7:7. doi: 10.3233/JAD-140405. [DOI] [PubMed] [Google Scholar]
- 35.Power JD, Cohen AL, Nelson SM, et al. Functional network organization of the human brain. Neuron. 2011;72:665–78. doi: 10.1016/j.neuron.2011.09.006. [DOI] [PMC free article] [PubMed] [Google Scholar]
- 36.Strehl A, Ghosh J. Cluster ensembles---a knowledge reuse framework for combining multiple partitions. The Journal of Machine Learning Research. 2003;3:583–617. [Google Scholar]
- 37.Benjamini Y, Hochberg Y. Controlling the False Discovery Rate: A Practical and Powerful Approach to Multiple Testing. Journal of the Royal Statistical Society. 1995;57:289–300. [Google Scholar]
- 38.Zhang D, Raichle ME. Disease and the brain's dark energy. Nat Rev Neurol. 2010;6:15–28. doi: 10.1038/nrneurol.2009.198. [DOI] [PubMed] [Google Scholar]
- 39.Menon V, Uddin LQ. Saliency, switching, attention and control: a network model of insula function. Brain structure & function. 2010;214:655–67. doi: 10.1007/s00429-010-0262-0. [DOI] [PMC free article] [PubMed] [Google Scholar]
- 40.Veer IM, Beckmann CF, van Tol MJ, et al. Whole brain resting-state analysis reveals decreased functional connectivity in major depression. Frontiers in systems neuroscience. 2010;4:1–10. doi: 10.3389/fnsys.2010.00041. [DOI] [PMC free article] [PubMed] [Google Scholar]
- 41.Manoliu A, Meng C, Brandl F, et al. Insular dysfunction within the salience network is associated with severity of symptoms and aberrant inter-network connectivity in major depressive disorder. Frontiers in human neuroscience. 2013;7:930. doi: 10.3389/fnhum.2013.00930. [DOI] [PMC free article] [PubMed] [Google Scholar]
- 42.Bracht T, Federspiel A, Schnell S, et al. Cortico-cortical white matter motor pathway microstructure is related to psychomotor retardation in major depressive disorder. PloS one. 2012;7:e52238. doi: 10.1371/journal.pone.0052238. [DOI] [PMC free article] [PubMed] [Google Scholar]
- 43.Annweiler C, Beauchet O, Bartha R, et al. Motor cortex and gait in mild cognitive impairment: a magnetic resonance spectroscopy and volumetric imaging study. Brain: a journal of neurology. 2013;136:859–71. doi: 10.1093/brain/aws373. [DOI] [PubMed] [Google Scholar]
- 44.Lee GJ, Lu PH, Hua X, et al. Depressive symptoms in mild cognitive impairment predict greater atrophy in Alzheimer's disease-related regions. Biological psychiatry. 2012;71:814–21. doi: 10.1016/j.biopsych.2011.12.024. [DOI] [PMC free article] [PubMed] [Google Scholar]
- 45.Modrego PJ, Ferrandez J. Depression in patients with mild cognitive impairment increases the risk of developing dementia of Alzheimer type: a prospective cohort study. Arch Neurol. 2004;61:1290–3. doi: 10.1001/archneur.61.8.1290. [DOI] [PubMed] [Google Scholar]
- 46.Andrews-Hanna JR, Snyder AZ, Vincent JL, et al. Disruption of large-scale brain systems in advanced aging. Neuron. 2007;56:924–35. doi: 10.1016/j.neuron.2007.10.038. [DOI] [PMC free article] [PubMed] [Google Scholar]
- 47.Shi F, Liu B, Zhou Y, et al. Hippocampal volume and asymmetry in mild cognitive impairment and Alzheimer's disease: Meta-analyses of MRI studies. Hippocampus. 2009;19:1055–64. doi: 10.1002/hipo.20573. [DOI] [PubMed] [Google Scholar]
- 48.Wang L, Zang Y, He Y, et al. Changes in hippocampal connectivity in the early stages of Alzheimer's disease: evidence from resting state fMRI. NeuroImage. 2006;31:496–504. doi: 10.1016/j.neuroimage.2005.12.033. [DOI] [PubMed] [Google Scholar]
- 49.Hahn A, Wadsak W, Windischberger C, et al. Differential modulation of the default mode network via serotonin-1A receptors. Proceedings of the National Academy of Sciences of the United States of America. 2012;109:2619–24. doi: 10.1073/pnas.1117104109. [DOI] [PMC free article] [PubMed] [Google Scholar]
- 50.Aznar S, Klein AB. Regulating prefrontal cortex activation: an emerging role for the 5-HT(2)A serotonin receptor in the modulation of emotion-based actions? Molecular neurobiology. 2013;48:841–53. doi: 10.1007/s12035-013-8472-0. [DOI] [PubMed] [Google Scholar]
- 51.Roberts JS, Karlawish JH, Uhlmann WR, et al. Mild cognitive impairment in clinical care: a survey of American Academy of Neurology members. Neurology. 2010;75:425–31. doi: 10.1212/WNL.0b013e3181eb5872. [DOI] [PMC free article] [PubMed] [Google Scholar]
- 52.Power JD, Barnes KA, Snyder AZ, et al. Spurious but systematic correlations in functional connectivity MRI networks arise from subject motion. NeuroImage. 2012;59:2142–54. doi: 10.1016/j.neuroimage.2011.10.018. [DOI] [PMC free article] [PubMed] [Google Scholar]
- 53.Wang JH, Zuo XN, Gohel S, et al. Graph theoretical analysis of functional brain networks: test-retest evaluation on short- and long-term resting-state functional MRI data. PloS one. 2011;6:e21976. doi: 10.1371/journal.pone.0021976. [DOI] [PMC free article] [PubMed] [Google Scholar]
Associated Data
This section collects any data citations, data availability statements, or supplementary materials included in this article.
Supplementary Materials
Figure S1. Anatomical node representation showing altered nodal efficiency. Gray circles represent uncorrected significant for p < 0.01 and black circles represent FDR corrected significant level for q < 0.05 and p < 0.001.
Abbreviations: CN, cognitively normal; LLD, late-life depression; aMCI, amnestic mild cognitive impairment; aMCI-LLD, late-life depression comorbid with amnestic mild cognitive impairment; dACC: dorsal anterior cingulate cortex, VMPFC: ventromedial prefrontal cortex, MTG: middle temporal gyrus, TP: temporal pole, MCC: middle cingulate cortex, PreCG: precentral gyrus, SFG: superior frontal gyrus, SPC: superior parietal cortex, Precu: precuneus.
Figure S2. Network hub anatomical organization of all four participant groups calculated as the normalized betweenness centrality larger than two standard deviations above the mean.
Abbreviations: CN, cognitively normal; LLD, late-life depression; aMCI, amnestic mild cognitive impairment; aMCI-LLD, late-life depression comorbid with amnestic mild cognitive impairment; PCC: posterior cingulate gyrus, VMPFC: ventral medial prefrontal cortex, dPCC: dorsal PCC, IFG: inferior frontal gyrus, dACC: dorsal anterior cingulate cortex, MCC: middle cingulate cortex, STG: superior temporal gyrus, TPJ: temporoparietal junction, IPC: inferior parietal cortex, PreCG: precentral gyrus.
Figure S3. Normalized betweenness centrality for the participant groups. Abbreviations: CN, cognitively normal; LLD, late-life depression; aMCI, amnestic mild cognitive impairment; aMCI-LLD, late-life depression comorbid with amnestic mild cognitive impairment.
Table S1. Significant p-values of the ANCOVA comparisons of the small-world measurements among the CN, LLD, aMCI, and aMCI-LLD groups
Table S2. Normalized nodal betweenness centrality