

Abstract
T-cell-dependent antigenic stimulation drives the differentiation of B cells into antibody-secreting plasma cells and memory B cells, but how B cells regulate this process is unclear. We show that LKB1 expression in B cells maintains B-cell quiescence and prevents the premature formation of germinal centers (GCs). Lkb1-deficient B cells (BKO) undergo spontaneous B-cell activation and secretion of multiple inflammatory cytokines, which leads to splenomegaly caused by an unexpected expansion of T cells. Within this cytokine response, increased IL-6 production results from heightened activation of NF-κB, which is suppressed by active LKB1. Secreted IL-6 drives T-cell activation and IL-21 production, promoting T follicular helper (TFH) cell differentiation and expansion to support a ∽100-fold increase in steady-state GC B cells. Blockade of IL-6 secretion by BKO B cells inhibits IL-21 expression, a known inducer of TFH-cell differentiation and expansion. Together, these data reveal cell intrinsic and surprising cell extrinsic roles for LKB1 in B cells that control TFH-cell differentiation and GC formation, and place LKB1 as a central regulator of T-cell-dependent humoral immunity.
Keywords: B cell, TFH differentiation, germinal center, NF-κB
Introduction
In adult mice, B lymphocytes develop in the bone marrow (BM) and emigrate to secondary lymphoid tissues, where they differentiate into memory B cells or plasma cells (PCs). Following priming of CD4+ T cells by dendritic cells in the red pulp, B cells present processed protein antigen to cognate CD4+ T-helper cells at the T–B border. This encounter promotes the expansion and differentiation of B cells into low affinity, short-lived antibody-secreting plasma cells (PCs) or germinal center (GC) founder B cells together with the generation of T follicular helper (TFH) cells 1, 2. TFH cells are a specialized subpopulation of CD4+ T-helper (Th) cells that localize to GCs where they secrete IL-21, a critical cytokine for GC development and the formation of memory B and plasma cells 2, 3.
Germinal centers are transient anatomic structures that develop in response to T-cell-dependent antigens. The production and maintenance of both GC B cells and TFH cells require the expression of an essential transcriptional repressor, Bcl6 4, 5. In GC B cells, BCL6 transiently suppresses DNA damage checkpoint genes, such as p53 and Atr 6, 7, to allow rapid cell proliferation without triggering cell cycle arrest or apoptosis during somatic hypermutation (SHM) and class switch recombination (CSR) of immunoglobulin (Ig) genes. BCL6 also represses Bcl2 expression 8, 9, and GC B cells upregulate Fas expression 10. These changes generate a FASL-dependent apoptotic mechanism to eliminate GC B cells that do not receive an optimal antigen-dependent B-cell receptor (BCR) rescue signal 11, thereby enforcing antigen specificity 12. Antigen selected GC B cells then differentiate into memory B cells or long-lived PCs 13 which remain quiescent until rechallenged or secrete high affinity antigen-specific antibodies, respectively 14.
Recent studies uncovered a human GC B-cell gene expression program that must be repressed for differentiation of GC B cells into PCs 15. Silencing of this program requires inactivation of the CREB transcriptional co-activator protein CRTC2 16, 17. Among 136 direct CRTC2 target genes in this silenced program are AICDA, MYC, MTA3, CDK6, BACH2, TCF3, SMAD6, SMARCA2, SMARCA4, and TCL1, all genes encoding proteins implicated in the development and maintenance of GC B cells. Physiologic CRTC2 inactivation begins with activation-induced cytidine deaminase (AID) generated DNA double-strand breaks during CSR and proceeds through a phospho-ser/thr signaling cascade from ATM to LKB1 to an AMPK family member protein to CRTC2. Within this CRTC2 inactivation pathway, LKB1 (liver kinase B1, also known as STK11), a tumor suppressor ser/thr kinase responsible for Peutz–Jeghers syndrome 18, stands out as an understudied kinase with broad regulatory potential in B cells.
LKB1 is phosphorylated by kinases that can be activated in B cells, including ATM 15, 19, protein kinase A 20, and ERK 21, 22, signaling kinases. LKB1 regulates AMPK activity, which in turn controls cellular metabolism and mTOR-mediated protein synthesis 23, 24. In mouse hematopoietic stem cells (HSCs), LKB1 also regulates cell autonomous, partially AMPK-independent quiescence, proliferation, differentiation, energetics, and survival 25, 26, 27. An initial proliferative burst by Lkb1-deficient HSCs is followed by their rapid depletion and BM failure. Similar cell intrinsic and partial AMPK-independent LKB1 control was also shown for mouse T-cell development, physiology, and survival. T-cell-specific Lkb1 knockout mice showed an incomplete block in thymocyte differentiation and decreased in vitro proliferation 28, 29 and survival 28, 29, 30, but increased activation of mature T cells that escaped to the periphery 28. Despite these key findings in hematopoietic lineage cells, LKB1 has not been assessed in B cells. The current study provides evidence that LKB1 expressed in naïve B cells prevents premature, potentially spontaneous TFH-cell differentiation and GC formation in vivo.
Results
B-cell-specific Lkb1 knockout (BKO) mice
A B-cell-specific knockout of Lkb1 (BKO mice) was generated by crossing Lkb1fl/fl mice 31 with CD19-Cre+/− knock-in mice 32 (1Fig EV1A). Although mb1-Cre-expressing mouse B cells more efficiently delete floxed alleles, CD19-Cre expression is more specific for B cells since mb1-Cre can also have activity in T cells and germ cells, while CD19-Cre does not 33, 34. Therefore, to prevent complicating multi-lineage LKB1 loss 35, CD19-Cre was used to delete Lkb1 from B lineage cells.
Figure 1.

- Flow cytometry for YFP expression in CD19+ splenocytes from WT-YFP (n = 7) and BKO-YFP (n = 8) mice. ****P = 4.9E-06 by two-tailed, unpaired Student's t-test.
- qRT–PCR (n = 3) and a representative Western blot for LKB1 in YFP-sorted splenocytes from BKO-YFP mice. LKB1 expression, relative to 36b4 expression, shown normalized to LKB1+YPF− CD19+ BKO B cells. ****P = 3.8E-05 by two-tailed, unpaired Student's t-test.
- Flow cytometry analysis for splenic transitional (TR: CD19+B220+AA41+), follicular (FO: CD19+B220+AA41−IgM+CD21+), and marginal zone (MZ: CD19+B220+AA41−IgM++CD21++) B cells in WT (n = 8) and BKO (n = 11) mice and the percentage of YFP+ cells for each subpopulation in WT-YFP (n = 7) and BKO-YFP (n = 8) mice. *P = 0.03 by Mann–Whitney U-test and ****P = 3.5E-006 and 1.5E-010 by two-tailed, unpaired Student's t-test, respectively.
- Representative images of spleens from WT and BKO mice. Weight of WT (n = 34) and BKO (n = 34) spleens and cell numbers recovered from WT (n = 13) and BKO (n = 18) spleens. *P = 0.011 and ****P = 9.7E-13 by two-tailed, unpaired Student's t-test.
- Flow cytometry and number of B220+CD19+ splenic B cells from WT (n = 13) and BKO (n = 18) mice.
- Flow cytometry and number of CD4+ and CD8+ T cells from WT (n = 11) and BKO (n = 11) mice. ****P = 1.1E-06 and 4.6E-06, respectively, by Mann–Whitney U-test.
- Non-lymphocyte white blood cells in spleens calculated by flow cytometry from WT (n = 5) and BKO (n = 5) mice. **P = 0.008, *P = 0.03 and 0.032, respectively, by two-tailed, unpaired Student's t-test.
- Histologic sections of WT and BKO spleens stained with hematoxylin and eosin (H&E), anti-B220, or anti-CD3 antibodies. Scale bar represents 500 microns.
Southern blot analyses of CD43-depleted splenocytes showed robust allele excision in Lkb1fl/wtCD19-Cre+/− (HET) mice, in contrast to only partial excision of the floxed Lkb1 alleles in Lkb1fl/flCD19-Cre+/− (BKO) mice (1Fig EV1B). qRT–PCR analyses showed a similar ∽2-fold reduction in Lkb1 expression in both BKO and HET mice compared to Lkb1wt/wtCD19-Cre+/− wild-type (WT) mice (1Fig EV1C). This prompted crosses with Rosa26-YFP mice 36 to generate BKO-YFP, HET-YFP, and WT-YFP mice in order to track the subset of B cells that had successfully deleted Lkb1 (LKB1−YFP+ B cells) (1Fig EV1A). In WT-YFP mice, > 85% of CD19+ splenocytes were LKB1+YFP+ in contrast to < 40% LKB1−YFP+ splenocytes in BKO-YFP mice (Fig1A). qRT–PCR and Western blot confirmed loss of Lkb1 mRNA and protein expression in YFP+ but not in YFP− splenic B cells in BKO-YFP mice (Fig1B). Detailed analyses of WT-YFP and HET-YFP mice revealed phenotypic and functional equivalence so only data for WT-YFP control mice are shown. Overall, the YFP tracking data (Fig1A) showed that CD19-Cre-mediated excision is incomplete and that LKB1+YFP− B cells may have a competitive advantage over LKB1−YFP+ B cells in BKO-YFP mice.
Pre-GC B-cell development in BKO mice
In the BM, the numbers of pro-B, pre-B, and immature B cells were similar in WT and BKO mice (1Fig EV1D). However, there was a ∽3-fold decrease in recirculating B cells in the BM of BKO compared to WT mice. In spleen, transitional (TR) B cells were increased ∽2-fold in BKO mice, whereas follicular (FO) and marginal zone (MZ) B cells were similar in number to WT mice (Fig1C). In addition, there were no significant differences between WT and BKO mice for the number of B-1a B cells in the spleen (Fig EV1E), total cells and B cells in lymph nodes (2Fig EV2A and B), or total cells and B cells in the peritoneal cavity (2Fig EV2C and D). Therefore, a deficiency in LKB1 resulted in a reduction in recirculating BM B cells and an increase in splenic transitional B cells. There was also a marked decrease in the frequency of LKB1−YFP+ recirculating B cells in the BM (1Fig EV1D) and in the mature B cells in the spleen (Figs1C and EV1E), lymph nodes (2Fig EV2B), and peritoneum (Fig 2 EV2D) of BKO-YFP compared to WT-YFP mice.
Figure 2.

- IHC sections of naïve WT and BKO spleens stained for PNA and BCL6 expression.
- Flow cytometry and number of B220+GL7+FAS+ GC B cells from WT (n = 8) and BKO (n = 11) spleens, along with percentage of YFP+ GC B cells, by flow cytometry, from WT-YFP (n = 8) and BKO-YFP (n = 8) spleens. ****P = 2.75E-05 and 1.3E-07 by Mann–Whitney U-test and two-tailed unpaired Student's t-test, respectively.
- Flow cytometry for CD4, PD-1, CXCR5, and ICOS expression in splenocytes from WT-YFP (n = 5) and BKO-YFP (n = 5) mice. **P = 0.008 by Mann–Whitney U-test. qRT–PCR for Il21 expression, relative to 36b4 expression, in CD4+ splenic T cells from WT-YFP (n = 4) and BKO-YFP (n = 4) mice. **P = 0.0078 by two-tailed, unpaired Student's t-test.
- Flow cytometry and number of B220+IgG1+ B cells from WT (n = 6) and BKO (n = 9) spleens. ***P = 0.0048 by Mann–Whitney U-test. qRT–PCR for Aicda expression, relative to 36b4 expression, from splenic B cells of WT (n = 4) and BKO (n = 4) mice. ***P = 0.0027 by two-tailed, unpaired Student's t-test.
- Number of cleaved caspase 3+ TR, FO, MZ, and GC B-cell subsets from WT (n = 4) and BKO (n = 4) mice. *P = 0.029 by Mann–Whitney U-test.
- Representative flow cytometry for B220, GL7, and NP expression in splenocytes from naïve BKO-YFP mice and LMCs immunized with NP-CGG 10 days post-immunization. Frequency of cleaved caspase 3+B220+GL7+ splenic cells (n = 4). ****P = 0.0005 by two-tailed, unpaired Student's t-test.
Splenomegaly results from T-cell expansion in BKO mice
Despite modest differences in the total number of B cells (Fig1C and EV1D), spleens from BKO mice weighed ∽3-fold more and contained almost 2-fold more cells compared to spleens from WT mice (Fig1D). The frequency of B cells among total spleen cells in BKO mice was reduced, but their numbers were equivalent to those in WT mice (Fig1E). This resulted from an unanticipated increase in the number of mature T cells (Fig1F) and, to a lesser extent, an increase in cells from multiple non-lymphoid hematopoietic cell lineages in BKO versus WT spleens (Fig1G). Histologic analyses of thin sections of BKO spleens stained with H&E showed alterations of the usual splenic architecture characterized by an expanded white pulp. IHC analyses for B220 and CD3 expression revealed enlarged splenic follicles with greatly expanded T-cell zones (Fig1H). Total thymocytes and thymocyte development (Fig EV2E and F) along with T cells in lymph nodes (2Fig EV2G) were similar between WT (WT-YFP) and BKO (BKO-YFP) mice, whereas peritoneal T cells were expanded ∽4- to 5-fold in BKO mice (2Fig EV2H). The results showed that LKB1− splenic B cells induced robust expansions of mature T cells in the spleens (and peritoneums) of BKO mice.
LKB1 in B cells prevents spontaneous germinal center formation
To further evaluate the marked white pulp expansion in BKO spleens (Fig1H), IHC for GCs was performed. Spleens from WT mice showed occasional small clusters of peanut agglutinin (PNA) and BCL6-positive GC cells within small primary follicles in contrast to spleens from BKO mice, which exhibited large clusters of PNA+ and BCL6+ GCs within expanded follicles (Fig2A). Analyses by flow cytometry revealed a robust increase in the number of GC B cells in BKO versus WT spleens and lymph nodes (Figs2B and EV3A). 75% of GC B cells in spleens and > 90% of GC B cells in lymph nodes from BKO-YFP mice were LKB1+YFP− (Figs2B and EV3A). These analyses also detected a ∽33-fold increase in the number of CD4+PD-1+CXCR5+ICOS+ TFH cells in the spleens of BKO-YFP as compared with WT-YFP mice, which contained few TFH cells (Fig2C). Additionally, expression of Il21, a canonical TFH cytokine, was increased ∽ 20-fold in CD4+ splenic T cells from BKO-YFP mice as compared to WT-YFP mice (Fig2C). Thus, a subset of LKB1-deficient B cells in BKO-YFP mice induced the formation of large GCs, with most of the GC B cells unexpectedly expressing LKB1.
BKO GC B cells exhibit increased apoptosis but generate antigen-specific antibodies
Un-stimulated GCs in BKO mice prompted a functional assessment of CSR and antibody secretion. In the spleen and lymph nodes of BKO mice, there was an increased percentage and number of IgG1+ B cells compared to WT mice (Figs2D and EV3B). Consistent with this increase, Aicda was expressed ∽17-fold higher in BKO compared to WT B cells (Fig2D). There was ∽2-fold higher serum IgM in BKO compared to WT mice, but no difference in the amount of isotype-switched serum antibodies (Fig EV3C). Plasmablast (PB) in the spleen and PC numbers in the BM were statistically similar between BKO and WT mice (3Fig EV3D). In BKO-YFP mice, < 10% of PBs and PCs were YFP+, in contrast to ∽70% YFP+ PBs and PCs in WT-YFP mice (3Fig EV3E), consistent with an advantage for mature LKB1+YFP− compared to LKB1−YFP+ B cells.
Figure 3.

- A Flow cytometry for MHC II (n = 8 and 11), CD86 (n = 6 and 9), and CD69 (n = 5 and 7) activation biomarkers and mean fluorescence intensity (MFI) for CD19+ splenocytes from WT and BKO mice. **P = 0.005, ****P = 9.1E-06, and **P = 0.002 by two-tailed, unpaired Student's t-test.
- B MFI of MHC II (n = 9 each) and CD86 (n = 6 each) of LKB1+YFP− and LKB1−YFP+ CD19+ B cells from BKO mice. *P = 0.02 by two-tailed, unpaired Student's t-test.
- C MFI of MHC II for transitional and mature B-cell subsets from WT (n = 8) and BKO (n = 11) spleens. ***P = 0.0007, **P = 0.006 by two-tailed, unpaired Student's t-test.
- D Flow cytometry plot of BrdU incorporation into harvested splenic B cells during a 30-min pulse and BrdU incorporation in LKB1+YFP− and LKB1−YFP+ B cells from BKO-YFP mice. Three independent experiments; *P = 0.015 by two-tailed, unpaired Student's t-test.
- E, F CD4- and CD62L-enriched, naïve T cells were co-incubated with anti-CD3 Ab and either anti-CD28 Ab, WT B cells pre-activated for 24 h, fresh CD43-depleted WT B cells, or fresh CD43-depleted BKO B cells for 48 h. Cultures were then harvested for analysis by flow cytometry. (E) Percentage of CD4+CD62L+CD44+-activated T cells in listed culture conditions (n = 3). Three independent experiments; ****P = 5.9E-05 by two-tailed, unpaired Student's t-test. (F) MFI of CD25 activation biomarker on CD4+ T cells in listed culture conditions (n = 3). Three independent experiments; *P = 0.0135 by two-tailed, unpaired Student's t-test.
- G Flow cytometry for the expression of CD4, CD62L, and CD44 in splenocytes from WT (n = 5) and BKO (n = 7) mice. ***P = 0.0025 by Mann–Whitney U-test.
- H MFI for CD69 and CD25 activation biomarkers in CD4+ splenic T cells from WT (n = 5) and BKO (n = 7) mice. ****P = 0.0001 and 3.4E-06, respectively, by two-tailed, unpaired Student's t-test.
One hypothesis for the discrepant antibody-secreting cell numbers and isotype-switched IGs in BKO mice is that GC B cells were undergoing apoptosis instead of terminal differentiation. In agreement, a ∽2-fold increase in percentage of CD19+ B cells from BKO mice stained positive for activated, cleaved caspase 3 by flow cytometry (3Fig EV3F); however, apoptosis was not intrinsic for B cells that lost LKB1 expression as the percentages of YFP+ and YFP− CD19+ B cells positive for cleaved caspase 3 was equivalent in BKO-YFP mice (3Fig EV3G). When freshly isolated B cells were partitioned into B-cell subsets by flow cytometry, only GC B cells showed increased numbers of cleaved caspase 3+ cells (∽10-fold) in BKO-YFP compared to control spleens (Fig2E). Additionally, cleaved caspase 8, the caspase-activated downstream of FAS-ligand-induced apoptosis 37, 38, was detected in whole-cell lysate from CD43-depleted splenic B cells from BKO but not WT mice (Fig EV3H). When compared with NP-CGG-induced GC B cells in littermate controls (LMC) 10 days post-immunization, the frequency of cleaved caspase 3+B220+GL7+ cells was ∽3-fold higher in naïve BKO-YFP spleens (Fig2F), suggesting that the rate of apoptosis in naïve BKO GC B cells is higher than that in immunized WT GC B cells. Increased GC B-cell apoptosis coincides with a predominantly GC B-cell expansion in BKO-YFP mice, which could prevent an increase in ASC production and isotype-switched serum IGs in naïve BKO compared to WT mice. Despite the elimination of GC B cells through apoptosis, anti-nuclear antibodies (ANA) were detected in 21% (4/19) of BKO mice aged over 6 months, whereas no anti-ANAs were detected from littermate controls (0/12) (Fig EV3I). The data suggest that loss of LKB1 in a subset of B cells drives GC formation, which over time may result in autoimmunity.
The presence of cleaved caspase 8 in B cells from BKO mice indicates the lack of a rescue signal provided by antigenic or co-stimulatory signaling upon antigen encounter 39, 40. To determine whether BKO mice respond to antigenic stimuli, BKO and control WT mice were challenged with both T-cell-dependent and T-cell-independent antigens. BKO mice challenged with TNP-AECM-FICOLL, a T-cell-independent antigen, generate TNP-IgM and TNP-IgG3 at 7 days at levels similar to WT mice (4Fig EV4A). Furthermore, BKO mice immunized with NP-CGG, a T-cell-dependent antigen, produced NP+ GC B cells at 10 and 28 days post-immunization (4Fig EV4B). Ten days post-immunization, BKO-YFP spleens contained less NP+ GC B cells than WT-YFP spleens; however, serum NP-IgG1 at 14 and 28 days was similar between BKO-YFP and WT-YFP mice (4Fig EV4C), suggesting that a subset of BKO B cells are able to respond to T-cell-dependent stimuli and generate an antigen-specific antibody response.
Figure 4.
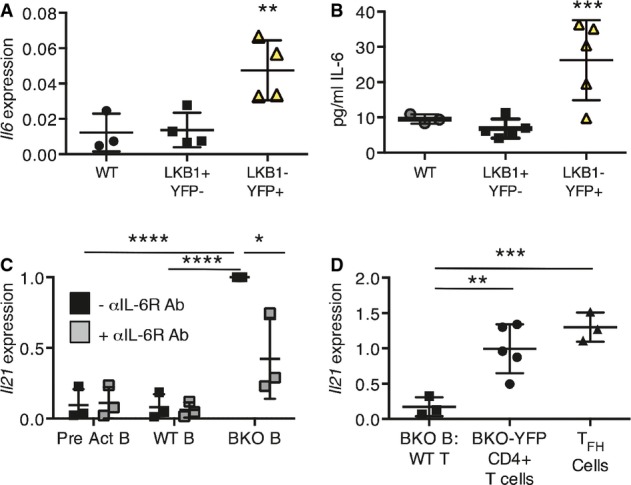
- qRT–PCR for Il6 expression, relative to 36b4 expression, in CD43-depleted splenic B cells from WT-YFP (n = 3), and LKB1+YFP−- (n = 4) and LKB1−YFP+- (n = 4) sorted CD19+ splenic B cells from BKO-YFP mice. **P = 0.0098 by one-way ANOVA.
- IL-6 secreted by WT-YFP (n = 3), and LKB1+YFP− (n = 5) and LKB1−YFP+ (n = 5) CD19+ splenic B cells from BKO-YFP mice during 24 h in culture. ***P = 0.0047 by one-way ANOVA.
- CD4+CD62L+ naïve T cells were co-incubated with anti-CD3 Ab and WT B cells pre-activated for 24 h, WT B cells, or B cells from BKO mice, with or without anti-IL-6R Ab for 48 h. qRT–PCR for induced Il21 expression, relative to 36b4 expression, and normalized to the induction of Il21 expression in BKO B-cell co-culture, is shown. Three independent experiments; ****P = 0.0002 and 6.5E-05, *P = 0.024, respectively, by two-tailed, unpaired Student's t-test.
- qRT–PCR analysis of Il21 expression, relative to 36b4 expression, by CD4+CD62L+ T cells co-incubated with anti-CD3 antibody and B cells from BKO-YFP mice for 48 h, CD4+ T cells from BKO-YFP mice, or sorted TFH cells from LCMV-infected WT mice. Three independent experiments (co-culture) or 3 biological replicates; **P = 0.009 and ***P = 0.0014 by two-tailed, unpaired Student's t-test.
B cells in BKO mice are hyperactive and proliferative
Since GC B cells were markedly increased (Fig2B), B-cell activation in BKO mice was examined. CD19+ B cells from spleen and lymph node showed increased expression of MHC II, CD86, and (for spleen) CD69 in BKO compared to WT mice (Fig3A and Appendix Fig S1A). Interestingly, only increased expression of MHC II was intrinsic to B cells that deleted LKB1, as LKB1−YFP+ B cells express higher levels of MHC II compared to LKB1+YFP− CD19+ B cells in BKO-YFP mice (Fig3B). Expression of CD86 and CD69 was similar between LKB1+YFP− and LKB1−YFP+ B cells in BKO-YFP mice (Fig3B and Appendix Fig S1B), suggesting paracrine B-cell activation. Pre-GC T2 and T3 transitional B-cell subsets also display 2- to 3-fold higher MHC II surface expression in BKO compared to WT spleens (Fig3C). Spontaneous in vivo activation was strongly suggested because freshly isolated B cells from BKO-YFP spleens incorporated ∽8-fold more BrdU ex vivo in a 30-min pulse than WT-YFP splenic B cells (Fig3D), which is consistent with the presence of GC B cells in BKO mice (Fig2). Interestingly, the percent of LKB1−YFP+ and LKB1+YFP− splenic B cells that synthesized DNA was similar in BKO-YFP mice (Fig3D), again suggesting a cell extrinsic influence of LKB1−YFP+ B cells on LKB1+YFP− B cells.
To examine the effect of LKB1 on B-cell proliferation, Celltracer dye dilution assays were performed on CD43-depleted B cells from WT-YFP and BKO-YFP spleens stimulated with anti-CD40 mAb and IL-4. After 3 days, overall cell division was similar for WT-YFP and BKO-YFP B cells (Appendix Fig S1C). However, a greater percentage of LKB1−YFP+ B cells divided by day 3 than did LKB1+YFP− B cells from BKO-YFP spleens and underwent multiple rounds of division (Appendix Fig S1D). Additionally, BrdU incorporation studies showed similar levels of DNA synthesis between stimulated B cells from WT-YFP and BKO-YFP spleens (Appendix Fig S1E), whereas stimulated LKB1−YFP+ B cells synthesize ∽2-fold more DNA than LKB1+YFP− B cells from BKO-YFP mice (Appendix Fig S1E). The data suggest that LKB1 inhibits spontaneous B-cell activation in BKO mice and negatively regulates B-cell proliferation.
LKB1 suppresses T-cell activation
We next examined how LKB1− B cells could stimulate a marked LKB1+ GC B-cell and massive T-cell expansion. As MHC II and the T-cell co-stimulatory protein CD86 were upregulated on BKO B cells, we investigated whether isolated BKO B cells could activate CD4+ T cells. In vitro co-incubation of CD4+CD62L+ naïve T cells from WT spleens with anti-CD3 and naïve BKO B cells induced T-cell activation to a similar extent as anti-CD3 plus pre-activated WT B cells, as measured by the induction of the CD44 activation biomarker (Fig3E). Naïve BKO B cells also induced T-cell expression of activation biomarker CD25 (Fig3F) as well as anti-CD3 and anti-CD28 co-stimulation.
In vivo, CD4+ T cells in BKO spleens showed a ∽3-fold increase in the number of activated CD44+ T cells (Fig3G) and a ∽2- to 3-fold increase in the expression of CD69 or CD25 compared with CD4+ T cells from WT spleens (Fig3H). Similarly, a ∽2- to 3-fold increase in activated CD4+CD44+ T cells was detected in lymph nodes of BKO mice without an overall T-cell expansion (Appendix Fig S1F). Combined, the data suggest that loss of LKB1 in a subset of B cells is able to induce activation of CD4+ T cells in vivo.
LKB1 blocks IL-21 production in CD4+ T cells through IL-6 inhibition
To determine how BKO B cells could influence the effector differentiation of activated CD4+ T cells, a cytokine and chemokine array was surveyed with conditioned media from un-stimulated cultures of CD43-depleted cells from WT-YFP and BKO-YFP mice. Strikingly, an inflammatory profile of 15 factors was elevated in BKO-YFP compared to WT-YFP-enriched B cells, including IL-6, which was recently shown to induce the earliest stages of TFH differentiation (Appendix Fig S2A) 3, 41, 42, 43, 44. A subset of inflammatory cytokines secreted by BKO-YFP B cells was compared to lipopolysaccharide (LPS)-stimulated WT B cells and bone marrow-derived macrophages (BMDMs). LPS-stimulated B cells secreted similar amounts of RANTES and IP-10 but increased amounts of Mip-1α, Mip-1β, and IL-16 compared to BKO B cells, while LPS-stimulated BMDMs secreted more of all cytokines compared to BKO-YFP B cells (Appendix Fig S2B). Il6 transcripts from LKB1−YFP+ B cells were elevated ∽3-fold over LKB1+YFP− B cells from BKO-YFP spleens and ∽4 fold over WT B cells (Fig4A). Additionally, un-stimulated LKB1−YFP+ B cells secreted ∽ 3- to 4-fold more IL-6 protein over 24 h, in vitro, than LKB1+YFP− B or WT B cells (Fig4B). These data strongly suggest that the loss of LKB1 is responsible for increased IL-6 production. We focused on IL-6 because of its elevated expression in LKB1−YFP+ B cells and its potential role in GC physiology as an early inducer of TFH-cell differentiation.
IL-6 has been shown to induce not only TFH cell, but also Th17-and TREG-cell differentiation from naïve CD4+ T cells 45, 46, 47. Therefore, CD4+ T cells from BKO-YFP spleens were assessed for canonical T-cell cytokine transcripts. A ∽20-fold increase in Il4 transcripts was detected in CD4+ T cells from BKO-YFP compared to WT-YFP spleens (5Fig EV5B). When paired with the ∽20-fold increased expression of Il21 (Fig2C), the expression data are consistent with flow cytometry data, indicating a robust TFH expansion (Fig2C). Increased expression of Il10, but not other Th subset canonical cytokine transcripts (Fig EV5A), was detected in CD4+ T cells from BKO-YFP compared to WT-YFP spleens. This transcript profile suggests that along with an increase in TFH cells, there was also an increase in TREG cells in BKO mice. Consistent with this expression profile, increased expression of Foxp3 was identified in CD4+ T cells from BKO mice (5Fig EV5B). Further analyses by flow cytometry detected a marked increase in CD4+FoxP3+ TREG cells but not CD4+PD-1+CXCR5+FoxP3+ T follicular regulatory (TFR) 48 cells (5Fig EV5C). Importantly, as previously shown 43, Il21 induction required IL-6 secretion from LKB1−YFP+ BKO B cells, as naïve WT T-cell co-incubation with WT, or even pre-activated, B cells failed to induce Il21 transcripts, whereas co-incubation with BKO B cells caused a significant induction of Il21 expression (Fig4C). Blockade of secreted IL-6 with an anti-IL-6R antibody inhibited Il21 induction almost to WT or pre-activated B-cell levels (Fig4C). Induction of Il21 in CD4+CD62L+ WT T cells by co-incubation with BKO-YFP B cells for 48 h, however, was not as robust as the Il21 produced by CD4+ T cells from BKO-YFP mice or by TFH sorted from LCMV-infected mice (Fig4D).
Figure 5.
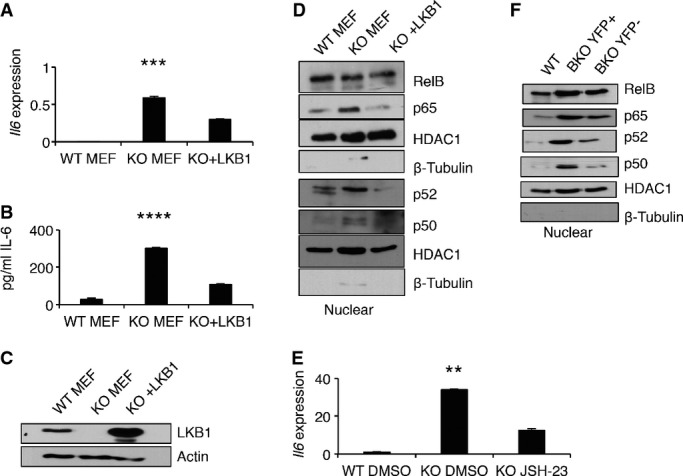
- qRT–PCR for Il6 expression, relative to 36b4 expression in WT, LKB1− (KO), and LKB1− reconstituted MEFs (KO + LKB1), in triplicate. Mean ± SEM; ***P = 0.0017 by one-way ANOVA.
- IL-6 secreted from WT, KO, and KO + LKB1 MEFs into culture media for 24 h, in triplicate. Mean ± SEM; ****P = 0.0001 by one-way ANOVA.
- Representative Western blot of WT, LKB1− (KO), and LKB1− reconstituted MEFs (KO + LKB1) for LKB1 and actin protein expression.
- Representative Western blot analysis of NF-κB family member proteins in nuclear lysates from WT, KO, and KO + LKB1 MEFs.
- qRT–PCR for Il6 expression, relative to 36b4 expression, in WT MEFS incubated with DMSO, and LKB1− MEFs incubated with either DMSO or 5 μM JSH-23. Mean ± s.d. for three independent experiments; **P = 0.006 by one-way ANOVA.
- Representative Western blot analysis of NF-κB family member proteins in nuclear lysates from CD43− B cells from WT, sorted YFP+, and sorted YFP− B cells from BKO mice (n = 3).
LKB1 expression inhibits NF-κB to block IL-6 production
To determine the impact of LKB1 expression on IL-6 production without the influence of other cell types or cell extrinsic factors, WT and LKB1− mouse embryonic fibroblasts (MEFs) were chosen as a study system. WT MEFs produced few Il6 transcripts, whereas LKB1− MEFs displayed a ∽350-fold increase in Il6 transcripts (Fig5A). LKB1− MEFs also secreted ∽10-fold more IL-6 over 24 h than WT MEFs (Fig5B). This increase in IL-6 production was specific to LKB1 loss because reconstitution of LKB1− MEFs with a mouse Lkb1 expression vector (Fig5C) resulted in both a repression of Il6 transcripts (Fig5A) and IL-6 secretion (Fig5B).
Multiple signaling pathways acting on a variety of transcription factors regulate the expression of Il6 49, 50, 51, 52. LKB1− MEFs exhibited an increase in nuclear p65, p52, and p50 NF-κB family member proteins compared to WT and LKB1-reconstituted MEFs (Fig5D), whereas other signaling pathways displayed similar or reduced activity compared to WT MEFs (Appendix Fig S3A–E). To determine whether increased p65 NF-κB activity contributed to Il6 production, LKB1− MEFs were incubated with an inhibitor of p65 nuclear import, JSH-23 53. Titration of JSH-23 below the established IC50 of 7.1 μM resulted in a dose-dependent response in Il6 transcription in LKB1− MEFs (Appendix Fig S3F). Additionally, JSH-23 exposure decreased Il6 transcription by ∽50% in LKB1− MEFs compared to DMSO-treated controls (Fig5E). Similar to LKB1− MEFS, LKB1−YFP+ B cells from BKO spleens contained increased nuclear p65, p52, and p50 proteins compared to both CD43-depleted WT B cells and LKB1+YFP− B cells from the same BKO spleen (Fig5F). These data indicate that LKB1 inhibits spontaneous IL-6 production by repression of NF-κB activation, although this result does not exclude additional LKB1-independent mechanisms of NF-κB and IL-6 regulation.
LKB1 is phosphorylated downstream of B-cell receptor signaling
NF-κB signaling is an important mediator for B-cell responses such as proliferation and CSR 54 and is activated downstream of B-cell receptor (BCR) signaling 55. Interestingly, LKB1 can be phosphorylated downstream of multiple signaling pathways 56, including MAPK/ERK pathway signaling 20, which is an important mediator of BCR signaling 57. To determine whether LKB1 is phosphorylated downstream of BCR engagement, CD43-depleted WT B cells were stimulated with anti-IgM F(ab2) fragment. As expected, ERK was phosphorylated within 5 min upon stimulation (Fig6). Additionally, LKB1 was phosphorylated at Ser431 upon BCR signaling induction, similarly to ERK phosphorylation (Fig6). Additionally, pre-treatment of B cells with the MEK inhibitor, U0126, resulted in the decreased phosphorylation of LKB1 upon BCR signaling (Fig6). The regulation of LKB1 by post-translational modification is complex, multi-faceted, and incompletely understood 56, although phosphorylation of S428 (S431 in mice) has been shown to be inhibitory in multiple cellular contexts 58, 59, 60 and could potentially link LKB1 inactivation to the induction of NF-κB through BCR signaling.
Figure 6.
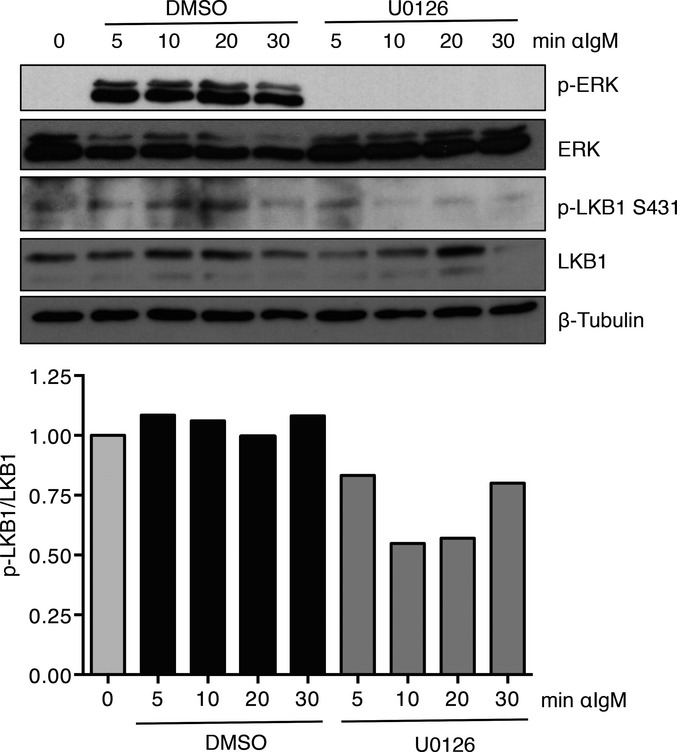
BCR signaling results in inhibitory LKB1 S431 phosphorylation
Representative Western blot of phosphorylation of LKB1 on serine 431 in CD43-depleted WT B cells stimulated with F(ab2) fragments of anti-IgM and either DMSO or U0126 for the indicated times. Ratio of phospho-LKB1 to total LKB1 expression, normalized to T = 0, is shown as mean for three independent experiments.
Our BKO mice suggest that in B cells, LKB1 expression likely prevents unprovoked cellular activation and IL-6 production by inhibiting NF-κB activation. LKB1−YFP+ B cells show spontaneous activation and secrete inflammatory cytokines, including IL-6, which activate surrounding CD4+ T cells and induce Il21 expression. IL-6 and IL-21 promote CD4+ T-cell differentiation into TFH cells potentially driving un-stimulated GC formation and expansion. These results suggest a model in which antigen-triggered LKB1 inactivation in mature B cells is a physiologic mechanism for stimulating the start of a GC reaction through B-cell intrinsic and extrinsic immune system activation (Fig7).
Figure 7.

IL-6 from BKO B cells influences the differentiation of TFH cells
Details for this model are given in the text.
Discussion
Previously, we identified a CSR-initiated signaling pathway in GC B cells that ends with inactivation of CRTC2 to silence GC B-cell genes and enable the differentiation of PCs 15. An essential intermediate in this signaling pathway is LKB1, whose siRNA repression blocked human tonsil B cells from becoming IG-secreting PBs in an in vitro GC-like B-cell differentiation system and whose loss of expression was detected in human lymphoma samples 15. However, these studies did not examine LKB1 in B cells in vivo where the microenvironment and non-B-cell types influence GC formation, maintenance 61, 62, 63, 64, 65, 66, size regulation 67, and PC production. Therefore, Lkb1 was deleted in developing and mature B cells in mice to assess its contextualized function. This resulted in reductions in mature LKB1−YFP+ B cells, which resembled cell reductions in lineage-specific Lkb1 knockout T-cell and HSC mice. Most interestingly, LKB1− B cells also exerted unanticipated control over T-cell activation, expansion, and differentiation that recruited naïve LKB1+ and LKB1− B cells into hyperplastic GC reactions (Fig7).
Lkb1 knockout in mouse thymocytes or HSCs altered cell autonomous functions, including quiescence, survival, differentiation, activation, and metabolism 25, 26, 27, 28, 29, 30, 68. Consistent with these studies, B cells with Lkb1 deletion at the pro-/pre-B-cell stage showed reductions in all mature B-cell populations in the spleen, lymph nodes, and in the peritoneum of BKO mice. However, total B-cell numbers in the spleen, lymph node, and peritoneum were equivalent between WT and BKO mice, indicating that LKB1+ B cells in BKO mice compensated for these reductions, resulting in B-cell homeostasis. An up to ∽100-fold expansion of LKB1+ and LKB1− GC B cells in BKO-YFP mouse spleens and lymph nodes contrasts with reduced steady-state HSCs, thymocytes, T cells, and pre-GC B cells. This non-target LKB1+ GC B-cell expansion stimulated our focus on the cell extrinsic functions of LKB1 loss in B cells as a potential explanation.
We showed that BKO B cells activate and expand T cells by increased expression of MHC class II proteins for antigen presentation, CD86 (B7-2) for co-stimulation, and augmented cytokine secretion. Secreted cytokines produced a mainly TFH cell-polarizing inflammatory response. Interestingly, Lkb1 deletion in mature T cells resulted in autonomous cell activation and the production of interferon-γ and IL-17, potentially via mTORC1 hyperactivity 28. A similar mTORC1 mechanism for cytokine secretion could operate in LKB1− B cells, although mTORC1 is a general regulator of protein synthesis and an explanation for TFH-polarizing cytokine production is not revealed.
The loss of LKB1 in both B cells and MEFs induced the expression of Il6, which may occur by increased NF-κB activation 49. Our data show an increase in nuclear NF-κB family member proteins in LKB1− MEFs that, when inhibited, led to a decrease in Il6 levels. Together, these results suggest that LKB1 inhibits NF-κB. There is a low level of tonic NF-κB activity in mature B cells 69 and induced NF-κB activation is required for B-cell proliferation, class switch recombination, and cytokine production 54. However, excessive NF-κB signaling has been shown to be detrimental to B cells. Mice with constitutively active NF-κB display B-cell hyperplasia 70, 71, 72, 73, autoimmunity 71, 74, 75, and lymphomagenesis 72. B cells from these mice respond by hyperactivation and hyperproliferation to stimulation 71, 72, 75, secrete IL-6 71, 75, and form robust GCs 71, 73, 74, 75. Regulation of NF-κB activity by LKB1 could be a mechanism by which B cells survive with tonic BCR signaling, followed by heightened NF-κB activation from stimulation, such as by antigen, that provokes B-cell activation and subsequent GC formation.
Recently, IL-6 induction in B cells during an anti-viral immune response was reported to be dependent on Oct2 and OBF-1 transcription factors 44. Karnowski et al showed that in response to influenza, in vivo, and in response to TLR signaling, in vitro, IL-6 induction in B cells is dependent on the induction of Oct2 and particularly OBF-1 44. Similar to our model (Fig7), IL-6 produced by B cells induces IL-21 production in T cells and these cytokines play overlapping roles in the anti-viral responses of TFH-cell differentiation and GC formation. In response to BCR signaling, however, Oct2−/− mice were able to induce Il6 expression, and while Obf1−/− mice were not, it is known that Obf1−/− B cells have defects in BCR signaling and that Obf1−/− mice cannot form GCs 76. Given the emerging role of IL-6 as an early inducer of TFH-cell differentiation 3, 41, 42, 43, multiple mechanisms could exist for initiation of IL-6 production in B cells depending on the triggering stimulus inducing an immune response. While inflammatory stimuli could provoke robust IL-6 secretion through Oct2 and OBF-1 induction 44, non-inflammatory activation of B cells through antigen–BCR signaling could induce IL-6 production through NF-κB activation to provide a mechanism for TFH-cell differentiation.
The identification of upstream regulators and downstream effectors of LKB1 signaling in B cells is required to understand and potentially manipulate LKB1 control of the GC reaction. To enable PC differentiation of GC B cells in human tonsil, LKB1 relays signals from ATM during CSR to an unidentified AMPK family member protein to inactivate CRTC2. It is not known which of 13 potential AMPK family member proteins LKB1 targets to repress genes that support GC B cells. These LKB1-repressed CRTC2 target genes control key GC processes. This repressed gene program alone seems sufficient to terminate the GC reaction, but additional AMPK family targets of LKB1 signaling are well positioned to regulate key GC and PC processes, including energy metabolism (AMPK) 24, cell polarity (MARK proteins, others) 77, and anoikis (SIK1) 78. Definitive evidence that LKB1 inactivation of CRTC2 is a main control point for PC production requires generation of an in vivo model that replicates the results of the in vitro GC-like B-cell differentiation system 15, 79, 80.
Surprisingly, LKB1− B cells induced the activation and proliferation of both LKB1+ and LKB1− B cells. LKB1− B cells produced inflammatory cytokines including IL-6 that induced T-cell expansion and TFH-cell differentiation to support the generation of GCs that recruited both LKB1+ and LKB1− B cells. A key remaining question is whether LKB1 controls the start of endogenous GC reactions. The earliest stage of GC formation at the outer T–B border zones requires signaling through BCR–cognate antigen recognition and CD40/CD40L B- to T-cell interactions. LKB1 is a constitutively active ser/thr kinase 18 with potential for altered activity by post-translational modification, subcellular localization, or substrate availability 18, 28. MAPK/ERK pathway signaling phosphorylates Ser325 and/or Ser428 in the C-terminal regulatory domain of LKB1 18, 19. B-RAF V600E mutant melanoma cells also phosphorylate these sites through ERK signaling to negatively regulate LKB1 and drive cancer cell proliferation 22. Interestingly, BCR signaling and CD40 signaling in B cells also activate MAPK/ERK pathway signaling. Further work is required to determine whether this signaling, changes in localization, or target protein availability attenuates LKB1 kinase activity to generate TFH-polarizing cytokines that help initiate a GC reaction.
LKB1 prevents naive B cells from expressing IL-6, a key in vivo cytokine that stimulates CD4+ T cells differentiate into TFH cells 41, 42. IL-16 secretion from activated B cells 81 results in the recruitment of T cells and dendritic cells at the B-T border. In turn, TFH cells express CXCL13, to attract B cells into growing GCs 82, 83 and IL-21, to enhance the differentiation and expansion of TFH cells to support larger GCs 42, 43. Interestingly, the rigid requirement for antigen presentation by dendritic cells and B cells for TFH differentiation and maintenance may be abrogated by Lkb1 deletion from B cells 84, 85. Future studies will focus on precisely how physiologic BCR, CD40, or other signaling relieves LKB1-enforced B-cell quiescence, how LKB1 inhibition in B cells induces a TFH-cell-polarizing inflammatory cytokine response, and whether manipulation of LKB1 activity can enhance humoral immunity or block a deleterious autoantibody response.
Materials and Methods
Mice
Lkb1fl/fl mice were obtained from the National Cancer Institute repository. Lkb1fl/fl, CD19-Cre+/−, and Rosa26-YFP mice (Jackson Laboratory) were housed in a pathogen-free animal facility at UCLA. All mouse studies were done between 6 and 12 weeks of age with approval (#1998-113-51) from the UCLA Animal Research Committee.
Reagents and antibodies
Anti-mouse antibodies included CD45R (RA3-6B2), CD5 (53-6.7), CD21/35 (7G6), CD43 (S7), CD44 (IM7), CD62L (MEL-4), CD86 (GL1), CD95, CD138 (281-2), IgM (R6-60.2), and T- to B-cell activation antigen (GL-7) (all from BD); CD45R (RA3-6B2), CD4 (RM4-5), CD8α (5306.7), CD23 (B3B4), CD44 (IM7), CD69 (H1.2F3), CD93 (AA4.1), IgM (11/41), and MHC II (114.15.2) (all from eBioscience); and CD19 (6D5) (Biolegend), CD45R (RM) (Invitrogen), active caspase 3, BrdU-Red (BioVision) phospho-LKB1 (C-1) (Santa Cruz), and β-tubulin (Sigma). Anti-rabbit antibodies included cleaved (D5B2) and total (D35G2) caspase 8, phospho-p42/44 (D13.14.4E), p42/44 (137F5), phosphor-p38 (D3F9), p38 (D13E1), phospho-JNK (81E11), JNK (56G8), p65 (D14E12), NF-κB p100/52 and LKB1 (D60C5) (Cell Signaling), actin (Sigma), NF-κB p50, HDAC1 (H-51), JunB, CREB, and phospho-CREB S133 (Millipore), and NP-PE (Biosearch Technologies).
Southern blot analysis
Cre-mediated excision of Lkb1 exons 3–6 was determined by multiplex PCR or Southern blot analysis from tail genomic DNA as previously described 31 with an exon 5–8 digoxigenin-11-dUTP labeled probe (Roche). Blot hybridizations were visualized with an anti-digoxigenin-alkaline phosphatase conjugate (Roche) and chemiluminescent detection.
Cell culture
Wild-type and LKB1− MEFs were obtained from Nabeel Bardeesy and were grown in DMEM (Mediatech, Inc.) supplemented with 10% FBS (Omega Scientific) with or without JSH-23 (Santa Cruz Biotechnology) as indicated. Isolated mouse splenic B cells (1 × 10⁶ cells/ml) were grown in RPMI 1640 (Mediatech, Inc.) supplemented with 10% FBS (Omega Scientific) and β-mercaptoethanol and stimulated with 1 μg/ml anti-CD40 mAb (BD Pharmingen) and 25 ng/ml IL-4 (R&D Systems) for up to 3 days or 10 μg/ml F(ab2) fragment of anti-IgM (Jackson Labs) for up to 1 h or with 10 μg/ml lipopolysaccharide (clone 0111:B4) (Sigma-Aldrich) for 24 h. Mouse T cells were co-incubated with 1 μg/ml of plate bound anti-CD3 mAb (BioLegend) and either 1 μg/ml anti-CD28 mAb (BioLegend), WT B cells pre-activated for 24 h, fresh WT B cells, or BKO B cells for 48 h with or without of 10 μg/ml anti-IL-6R Ab (BioLegend).
Murine BMDMs were generated by flushing BM cells from femurs of LMC mice. BM cells were cultured for 7 days in DMEM (Mediatech, Inc.) containing 10% FBS (Omega Scientific), 1% penicillin/streptomycin, and 10% conditioned media from L929 cells. BMDMs were stimulated with 1 μg/ml lipopolysaccharide (clone 0111:B4) (Sigma-Aldrich) for 4 h in DMEM containing 10% FBS and 1% penicillin/streptomycin. TFH cells were isolated on day 9 after acute LCMV-Armstrong infection and isolated by FACS based on SLAM, CXCR5 expression as previously described 86. Sorted TFH (SLAM-, CXCR5+) were greater than 99% pure based on post-sort analysis.
Immunizations
Mice were immunized with 25 μg TNP-AECM-FICOLL (Biosearch Technologies) in 1xPBS, pH 7.4, via intra-peritoneal injection, and blood was collected and assayed 7 days post-injection by enzyme-linked immunosorbent assay (ELISA). 100 μg of NP(20-29)-CGG (Biosearch Technologies) in alum was administered via intra-peritoneal injection, and blood was collected and assayed 14 and 28 days post-injection by ELISA.
ELISA
Serum IG concentrations were determine by ELISA using goat anti-mouse IG as a capture antibody and developed with an isotype-specific goat anti-mouse antibody conjugated to horseradish peroxidase (HRP) (Southern Biotech). Blood was collected via retro-orbital eye bleed. ELISA was performed with NP-BSA or TNP-BSA as a capture antibody (Biosearch Technologies) and developed with an isotype-specific goat anti-mouse antibody conjugated to HRP (Southern Biotech).
qRT–PCR
RNA was isolated using Trizol (Life Technologies) and converted to cDNA with iScript (Bio-Rad). qRT–PCR was performed on a LightCycler480 (Roche) using SYBR green (Roche). Transcript levels were normalized to the housekeeping gene 36b4 (Rplp0) 87.
Immunoblotting
Cells were lysed with Triton-X lysis buffer or fractionated using the NE-PER Nuclear and cytoplasmic extraction kit (Thermo Scientific). Extracts were separated by SDS–PAGE and transferred to either nitrocellulose or PVDF membranes. Membranes were incubated overnight with the indicated antibodies in TBS–Tween and 5% milk or 5% BSA.
Flow cytometry and cell sorting
Single-cell suspensions were stained with conjugated antibodies; data were obtained on a BD LSRII (BD Biosciences) and analyzed with FlowJo software (Treestar). Cell sorting was performed on a BD FACSAria (BD Biosciences).
Histology and immunohistochemistry
Spleens were dehydrated and paraffin embedded. Thin 6-μm sections were stained with hematoxylin and eosin or hematoxylin and antibodies using the avidin–biotin peroxidase complex method. Histologic images were viewed with an Olympus Ax70 microscope (40/0.75 oil objective lens) and photographed with an Olympus DP71 camera; DP controller software (version 3.3.1.292) was used for image acquisition.
B- and T-cell enrichment
RBC-depleted splenocytes were enriched for B cells by CD43 depletion or naïve T cells by depletion of non-CD4+ T cells and positive selection of CD62L+ T cells (Miltenyi Biotec). All enrichments were ≥ 85% pure by flow cytometry.
BrdU labeling
BrdU was added to stimulation media for 30 min prior to harvest. Cells were prepared and stained using the BrdU for flow cytometry kit (BD Biosciences).
Il-6 ELISA
IL-6 in conditioned media from overnight cultures was quantified by IL-6 ELISA (R&D Systems) per the manufacturer's instructions.
Proliferation assay
CD43-depleted B cells were incubated at 1 × 10⁶ cell/ml with Celltracer Violet (Invitrogen), followed by culture with 1 μg/ml anti-CD40 Ab (BD Bioscience) and 25 ng/ml IL-4 (R&D Technologies) for 3 days. Fluorescent intensity was measured daily by flow cytometry. Proliferation was analyzed using FlowJo software (TreeStar).
Cytokine proteome array
Single-cell suspensions of CD43-depleted splenic B cells from WT (n = 2) and BKO (n = 2) mice were incubated in RPMI 1640 for 6 h, and culture media were harvested and analyzed using the Proteome Profiler Mouse Cytokine Array (R&D Systems). Briefly, cells were incubated with a detection antibody cocktail for 1 h, added to the membranes, and incubated overnight. Membranes were developed with streptavidin–HRP and exposed to film. Pixel density was determined using ImageJ software.
Cytokine ELISA
Conditioned media from equivalent cultures of CD43-depleted naïve WT-YFP, naïve BKO-YFP, WT B cells stimulated with LPS (all cultured overnight), and BMDM stimulated with LPS (4 h) were assayed for relative cytokine secretion by Multi-Analyte ELISArray (Qiagen), according to the manufacturer's instructions.
FoxP3 staining
Red blood cell-depleted single-cell suspensions from spleens were stained with anti-bodies against CD4, CXCR5, PD-1, and SLAM and then fixed and permeabilized using the Mouse FoxP3 Buffer Set (BD Biosciences), according to the manufacturer's instructions. Fixed and permeabilized cells were stained with an antibody against FoxP3 (BD Horizon). Samples were run on an LSRII (BD Biosciences) and analyzed with FlowJo software (TreeStar).
Retrovirus generation and infection
Mouse Lkb1 was cloned into the MSCV-IRES-tNGFR retroviral expression vector 88 by standard methods. Viral supernatant was harvested from HEK293T cells 48 and 72 h after transfection with FuGene (Roche). 2.0 × 10⁶ cells were incubated with virus supplemented with 4 μg polybrene for 6 h. Prior to experimental assays, NGFR-expressing cells were enriched by incubation with NGFR-PE antibody (Miltenyi Biotec) and anti-PE microbeads then passed through a magnetic column (Miltenyi Biotec).
ANA ELISA
Anti-nuclear antibodies in serum were detected by anti-ANA ELISA (Alpha Diagnostics), according to the manufacturer's instructions. The positivity index was calculated as follows: mean OD of WT samples + 2SD. All samples were then compared to the positivity index, with values greater than 1.0 considered positive.
Statistical analysis and experimental design
The two-tailed, unpaired Student's t-test and the Mann–Whitney U-test were employed to analyze parametric and nonparametric data, respectively. In the instances of more than 2 samples, the one-way ANOVA test was employed, in all cases, P < 0.05 was also considered significant. Study sample size was determined using a Cohen's d between 1.5 and 2 with at least 80% power for all studies. Additionally, there was no blinding or randomization for animal studies.
Acknowledgments
We thank Tammy Phung, Steven Bensinger, and Laura Fahey (UCLA) for assistance and feedback, and Jason Hong and Christopher Pang-Gonzalez (UCLA) for animal colony assistance. FACS was performed at the Broad Stem Cell Research Center FACS Facility and flow cytometry at the UCLA IMED Flow Cytometry Core. This study was supported by NIH grants T32CA009120 (N.C.W.), GM007185 (L.R.W.), CA90571, CA156674, GM073981, GM114188, and CA185189 (M.A.T.), ACS grant LIB-122716 (J.A.F.), and the NIH Intramural Research program, NIAID (H.C.M.).
Author contributions
NCW, LRW, JAF, ML, CRC, DGB, JER, and HCM III performed experiments. NCW and MAT analyzed data and generated figures. NCW, LRW, JAF, and MAT designed the research. NCW and MAT wrote the paper.
Conflict of interest
The authors declare that they have no conflict of interest.
Supporting Information
Appendix
Expanded View Figures PDF
Review Process File
References
- MacLennan IC. Germinal centers. Annu Rev Immunol. 1994;12:117–139. doi: 10.1146/annurev.iy.12.040194.001001. [DOI] [PubMed] [Google Scholar]
- Ramiscal R, Vinuesa C. T-cell subsets in the germinal center. Immunol Rev. 2013;252:146–155. doi: 10.1111/imr.12031. [DOI] [PubMed] [Google Scholar]
- Crotty S. Follicular helper CD4 T cells (T(FH)) Annu Rev Immunol. 2011;29:621–663. doi: 10.1146/annurev-immunol-031210-101400. [DOI] [PubMed] [Google Scholar]
- Cattoretti G, Chang CC, Cechova K, Zhang J, Ye BH, Falini B, Louie DC, Offit K, Chaganti RS, Dalla-Favera R. BCL-6 protein is expressed in germinal-center B cells. Blood. 1995;86:45–53. [PubMed] [Google Scholar]
- Onizuka T, Moriyama M, Yamochi T, Kuroda T, Kazama A, Kanazawa N, Sato K, Kato T, Ota H, Mori S. BCL-6 gene product, a 92- to 98-kD nuclear phosphoprotein, is highly expressed in germinal center B cells and their neoplastic counterparts. Blood. 1995;86:28–37. [PubMed] [Google Scholar]
- Phan RT, Dalla-Favera R. The BCL6 proto-oncogene suppresses p53 expression in germinal-centre B cells. Nature. 2004;432:635–639. doi: 10.1038/nature03147. [DOI] [PubMed] [Google Scholar]
- Ranuncolo SM, Polo JM, Dierov J, Singer M, Kuo T, Greally J, Green R, Carroll M, Melnick A. Bcl-6 mediates the germinal center B cell phenotype and lymphomagenesis through transcriptional repression of the DNA-damage sensor ATR. Nat Immunol. 2007;8:705–714. doi: 10.1038/ni1478. [DOI] [PubMed] [Google Scholar]
- Ci W, Polo JM, Cerchietti L, Shaknovich R, Wang L, Yang SN, Ye K, Farinha P, Horsman DE, Gascoyne RD. The BCL6 transcriptional program features repression of multiple oncogenes in primary B cells and is deregulated in DLBCL. Blood. 2009;113:5536–5548. doi: 10.1182/blood-2008-12-193037. [DOI] [PMC free article] [PubMed] [Google Scholar]
- Saito M, Novak U, Piovan E, Basso K, Sumazin P, Schneider C, Crespo M, Shen Q, Bhagat G, Califano A, et al. BCL6 suppression of BCL2 via Miz1 and its disruption in diffuse large B cell lymphoma. Proc Natl Acad Sci USA. 2009;106:11294–11299. doi: 10.1073/pnas.0903854106. [DOI] [PMC free article] [PubMed] [Google Scholar]
- Smith KG, Nossal GJ, Tarlinton DM. FAS is highly expressed in the germinal center but is not required for regulation of the B-cell response to antigen. Proc Natl Acad Sci USA. 1995;92:11628–11632. doi: 10.1073/pnas.92.25.11628. [DOI] [PMC free article] [PubMed] [Google Scholar]
- Liu YJ, Joshua DE, Williams GT, Smith CA, Gordon J, MacLennan IC. Mechanism of antigen-driven selection in germinal centres. Nature. 1989;342:929–931. doi: 10.1038/342929a0. [DOI] [PubMed] [Google Scholar]
- Strasser A, Jost PJ, Nagata S. The many roles of FAS receptor signaling in the immune system. Immunity. 2009;30:180–192. doi: 10.1016/j.immuni.2009.01.001. [DOI] [PMC free article] [PubMed] [Google Scholar]
- Shapiro-Shelef M, Calame K. Regulation of plasma-cell development. Nat Rev Immunol. 2005;5:230–242. doi: 10.1038/nri1572. [DOI] [PubMed] [Google Scholar]
- Manz RA, Thiel A, Radbruch A. Lifetime of plasma cells in the bone marrow. Nature. 1997;388:133–134. doi: 10.1038/40540. [DOI] [PubMed] [Google Scholar]
- Sherman MH, Kuraishy AI, Deshpande C, Hong JS, Cacalano NA, Gatti RA, Manis JP, Damore MA, Pellegrini M, Teitell MA. AID-induced genotoxic stress promotes B cell differentiation in the germinal center via ATM and LKB1 signaling. Mol Cell. 2010;39:873–885. doi: 10.1016/j.molcel.2010.08.019. [DOI] [PMC free article] [PubMed] [Google Scholar]
- Jansson D, Ng AC, Fu A, Depatie C, Al Azzabi M, Screaton RA. Glucose controls CREB activity in islet cells via regulated phosphorylation of TORC2. Proc Natl Acad Sci USA. 2008;105:10161–10166. doi: 10.1073/pnas.0800796105. [DOI] [PMC free article] [PubMed] [Google Scholar]
- Screaton RA, Conkright MD, Katoh Y, Best JL, Canettieri G, Jeffries S, Guzman E, Niessen S, Yates JR, 3rd, Takemori H, Okamoto M, Montminy M. The CREB coactivator TORC2 functions as a calcium- and cAMP-sensitive coincidence detector. Cell. 2004;119:61–74. doi: 10.1016/j.cell.2004.09.015. [DOI] [PubMed] [Google Scholar]
- Alessi DR, Sakamoto K, Bayascas JR. LKB1-dependent signaling pathways. Annu Rev Biochem. 2006;75:137–163. doi: 10.1146/annurev.biochem.75.103004.142702. [DOI] [PubMed] [Google Scholar]
- Sapkota GP, Deak M, Kieloch A, Morrice N, Goodarzi AA, Smythe C, Shiloh Y, Lees-Miller SP, Alessi DR. Ionizing radiation induces ataxia telangiectasia mutated kinase (ATM)-mediated phosphorylation of LKB1/STK11 at Thr-366. Biochem J. 2002;368:507–516. doi: 10.1042/BJ20021284. [DOI] [PMC free article] [PubMed] [Google Scholar]
- Sapkota GP, Kieloch A, Lizcano JM, Lain S, Arthur JS, Williams MR, Morrice N, Deak M, Alessi DR. Phosphorylation of the protein kinase mutated in Peutz-Jeghers cancer syndrome, LKB1/STK11, at Ser431 by p90(RSK) and cAMP-dependent protein kinase, but not its farnesylation at Cys(433), is essential for LKB1 to suppress cell growth. J Biol Chem. 2001;276:19469–19482. doi: 10.1074/jbc.M009953200. [DOI] [PubMed] [Google Scholar]
- Sapkota GP, Boudeau J, Deak M, Kieloch A, Morrice N, Alessi DR. Identification and characterization of four novel phosphorylation sites (Ser31, Ser325, Thr336 and Thr366) on LKB1/STK11, the protein kinase mutated in Peutz-Jeghers cancer syndrome. Biochem J. 2002;362:481–490. doi: 10.1042/0264-6021:3620481. [DOI] [PMC free article] [PubMed] [Google Scholar]
- Zheng B, Jeong JH, Asara JM, Yuan YY, Granter SR, Chin L, Cantley LC. Oncogenic B-RAF negatively regulates the tumor suppressor LKB1 to promote melanoma cell proliferation. Mol Cell. 2009;33:237–247. doi: 10.1016/j.molcel.2008.12.026. [DOI] [PMC free article] [PubMed] [Google Scholar]
- Hawley SA, Boudeau J, Reid JL, Mustard KJ, Udd L, Makela TP, Alessi DR, Hardie DG. Complexes between the LKB1 tumor suppressor, STRAD alpha/beta and MO25 alpha/beta are upstream kinases in the AMP-activated protein kinase cascade. J Biol. 2003;2:28. doi: 10.1186/1475-4924-2-28. [DOI] [PMC free article] [PubMed] [Google Scholar]
- Shaw RJ, Kosmatka M, Bardeesy N, Hurley RL, Witters LA, DePinho RA, Cantley LC. The tumor suppressor LKB1 kinase directly activates AMP-activated kinase and regulates apoptosis in response to energy stress. Proc Natl Acad Sci USA. 2004;101:3329–3335. doi: 10.1073/pnas.0308061100. [DOI] [PMC free article] [PubMed] [Google Scholar]
- Gan B, Hu J, Jiang S, Liu Y, Sahin E, Zhuang L, Fletcher-Sananikone E, Colla S, Wang YA, Chin L, et al. Lkb1 regulates quiescence and metabolic homeostasis of haematopoietic stem cells. Nature. 2010;468:701–704. doi: 10.1038/nature09595. [DOI] [PMC free article] [PubMed] [Google Scholar]
- Gurumurthy S, Xie SZ, Alagesan B, Kim J, Yusuf RZ, Saez B, Tzatsos A, Ozsolak F, Milos P, Ferrari F, et al. The Lkb1 metabolic sensor maintains haematopoietic stem cell survival. Nature. 2010;468:659–663. doi: 10.1038/nature09572. [DOI] [PMC free article] [PubMed] [Google Scholar]
- Nakada D, Saunders TL, Morrison SJ. Lkb1 regulates cell cycle and energy metabolism in haematopoietic stem cells. Nature. 2010;468:653–658. doi: 10.1038/nature09571. [DOI] [PMC free article] [PubMed] [Google Scholar]
- MacIver NJ, Blagih J, Saucillo DC, Tonelli L, Griss T, Rathmell JC, Jones RG. The liver kinase B1 is a central regulator of T cell development, activation, and metabolism. J Immunol. 2011;187:4187–4198. doi: 10.4049/jimmunol.1100367. [DOI] [PMC free article] [PubMed] [Google Scholar]
- Tamas P, Macintyre A, Finlay D, Clarke R, Feijoo-Carnero C, Ashworth A, Cantrell D. LKB1 is essential for the proliferation of T-cell progenitors and mature peripheral T cells. Eur J Immunol. 2010;40:242–253. doi: 10.1002/eji.200939677. [DOI] [PMC free article] [PubMed] [Google Scholar]
- Cao Y, Li H, Liu H, Zheng C, Ji H, Liu X. The serine/threonine kinase LKB1 controls thymocyte survival through regulation of AMPK activation and Bcl-XL expression. Cell Res. 2010;20:99–108. doi: 10.1038/cr.2009.141. [DOI] [PubMed] [Google Scholar]
- Bardeesy N, Sinha M, Hezel AF, Signoretti S, Hathaway NA, Sharpless NE, Loda M, Carrasco DR, DePinho RA. Loss of the Lkb1 tumour suppressor provokes intestinal polyposis but resistance to transformation. Nature. 2002;419:162–167. doi: 10.1038/nature01045. [DOI] [PubMed] [Google Scholar]
- Rickert RC, Roes J, Rajewsky K. B lymphocyte-specific, Cre-mediated mutagenesis in mice. Nucleic Acids Res. 1997;25:1317–1318. doi: 10.1093/nar/25.6.1317. [DOI] [PMC free article] [PubMed] [Google Scholar]
- Hobeika E, Thiemann S, Storch B, Jumaa H, Nielsen PJ, Pelanda R, Reth M. Testing gene function early in the B cell lineage in mb1-cre mice. Proc Natl Acad Sci USA. 2006;103:13789–13794. doi: 10.1073/pnas.0605944103. [DOI] [PMC free article] [PubMed] [Google Scholar]
- Schmidt-Supprian M, Rajewsky K. Vagaries of conditional gene targeting. Nat Immunol. 2007;8:665–668. doi: 10.1038/ni0707-665. [DOI] [PubMed] [Google Scholar]
- Ylikorkala A, Rossi DJ, Korsisaari N, Luukko K, Alitalo K, Henkemeyer M, Makela TP. Vascular abnormalities and deregulation of VEGF in Lkb1-deficient mice. Science. 2001;293:1323–1326. doi: 10.1126/science.1062074. [DOI] [PubMed] [Google Scholar]
- Srinivas S, Watanabe T, Lin CS, William CM, Tanabe Y, Jessell TM, Costantini F. Cre reporter strains produced by targeted insertion of EYFP and ECFP into the ROSA26 locus. BMC Dev Biol. 2001;1:4. doi: 10.1186/1471-213X-1-4. [DOI] [PMC free article] [PubMed] [Google Scholar]
- Hennino A, Berard M, Krammer PH, Defrance T. FLICE-inhibitory protein is a key regulator of germinal center B cell apoptosis. J Ex Med. 2001;193:447–458. doi: 10.1084/jem.193.4.447. [DOI] [PMC free article] [PubMed] [Google Scholar]
- Budihardjo I, Oliver H, Lutter M, Luo X, Wang X. Biochemical pathways of caspase activation during apoptosis. Annu Rev Cell Develop Biol. 1999;19:269–290. doi: 10.1146/annurev.cellbio.15.1.269. [DOI] [PubMed] [Google Scholar]
- Hennino A, Berard M, Krammer PH, Defrance T. FLICE-inhibitory protein is a key regulator of germinal center B cell apoptosis. J Exp Med. 2001;193:447–458. doi: 10.1084/jem.193.4.447. [DOI] [PMC free article] [PubMed] [Google Scholar]
- van Eijk M, Defrance T, Hennino A, de Groot C. Death-receptor contribution to the germinal-center reaction. Trends Immunol. 2001;22:677–682. doi: 10.1016/s1471-4906(01)02086-5. [DOI] [PubMed] [Google Scholar]
- Choi YS, Eto D, Yang JA, Lao C, Crotty S. Cutting edge: STAT1 is required for IL-6-mediated Bcl6 induction for early follicular helper cell differentiation. J Immunol. 2013;190:3049–3053. doi: 10.4049/jimmunol.1203032. [DOI] [PMC free article] [PubMed] [Google Scholar]
- Choi YS, Yang JA, Crotty S. Dynamic regulation of Bcl6 in follicular helper CD4 T (Tfh) cells. Curr Opin Immunol. 2013;25:366–372. doi: 10.1016/j.coi.2013.04.003. [DOI] [PMC free article] [PubMed] [Google Scholar]
- Eto D, Lao C, DiToro D, Barnett B, Escobar TC, Kageyama R, Yusuf I, Crotty S. IL-21 and IL-6 are critical for different aspects of B cell immunity and redundantly induce optimal follicular helper CD4 T cell (Tfh) differentiation. PLoS ONE. 2011;6:e17739. doi: 10.1371/journal.pone.0017739. [DOI] [PMC free article] [PubMed] [Google Scholar]
- Karnowski A, Chevrier S, Belz GT, Mount A, Emslie D, D'Costa K, Tarlinton DM, Kallies A, Corcoran LM. B and T cells collaborate in antiviral responses via IL-6, IL-21, and transcriptional activator and coactivator, Oct2 and OBF-1. J Exp Med. 2012;209:2049–2064. doi: 10.1084/jem.20111504. [DOI] [PMC free article] [PubMed] [Google Scholar]
- Bettelli E, Carrier Y, Gao W, Korn T, Strom TB, Oukka M, Weiner HL, Kuchroo VK. Reciprocal developmental pathways for the generation of pathogenic effector TH17 and regulatory T cells. Nature. 2006;441:235–238. doi: 10.1038/nature04753. [DOI] [PubMed] [Google Scholar]
- Mangan PR, Harrington LE, O'Quinn DB, Helms WS, Bullard DC, Elson CO, Hatton RD, Wahl SM, Schoeb TR, Weaver CT. Transforming growth factor-beta induces development of the T(H)17 lineage. Nature. 2006;441:231–234. doi: 10.1038/nature04754. [DOI] [PubMed] [Google Scholar]
- Fujimoto M, Nakano M, Terabe F, Kawahata H, Ohkawara T, Han Y, Ripley B, Serada S, Nishikawa T, Kimura A, et al. The influence of excessive IL-6 production in vivo on the development and function of Foxp3+ regulatory T cells. J Immunol. 2011;186:32–40. doi: 10.4049/jimmunol.0903314. [DOI] [PubMed] [Google Scholar]
- Linterman MA, Pierson W, Lee SK, Kallies A, Kawamoto S, Rayner TF, Srivastava M, Divekar DP, Beaton L, Hogan JJ, et al. Foxp3+ follicular regulatory T cells control the germinal center response. Nat Med. 2011;17:975–982. doi: 10.1038/nm.2425. [DOI] [PMC free article] [PubMed] [Google Scholar]
- Libermann TA, Baltimore D. Activation of interleukin-6 gene expression through the NF-kappa B transcription factor. Mol Cell Biol. 1990;10:2327–2334. doi: 10.1128/mcb.10.5.2327. [DOI] [PMC free article] [PubMed] [Google Scholar]
- Akira S, Isshiki H, Sugita T, Tanabe O, Kinoshita S, Nishio Y, Nakajima T, Hirano T, Kishimoto T. A nuclear factor for IL-6 expression (NF-IL6) is a member of a C/EBP family. EMBO J. 1990;9:1897–1906. doi: 10.1002/j.1460-2075.1990.tb08316.x. [DOI] [PMC free article] [PubMed] [Google Scholar]
- Dendorfer U, Oettgen P, Libermann TA. Multiple regulatory elements in the interleukin-6 gene mediate induction by prostaglandins, cyclic AMP, and lipopolysaccharide. Mol Cell Biol. 1994;14:4443–4454. doi: 10.1128/mcb.14.7.4443. [DOI] [PMC free article] [PubMed] [Google Scholar]
- Kimura A, Naka T, Muta T, Takeuchi O, Akira S, Kawase I, Kishimoto T. Suppressor of cytokine signaling-1 selectively inhibits LPS-induced IL-6 production by regulating JAK-STAT. Proc Natl Acad Sci USA. 2005;102:17089–17094. doi: 10.1073/pnas.0508517102. [DOI] [PMC free article] [PubMed] [Google Scholar]
- Shin HM, Kim MH, Kim BH, Jung SH, Kim YS, Park HJ, Hong JT, Min KR, Kim Y. Inhibitory action of novel aromatic diamine compound on lipopolysaccharide-induced nuclear translocation of NF-kappaB without affecting IkappaB degradation. FEBS Lett. 2004;571:50–54. doi: 10.1016/j.febslet.2004.06.056. [DOI] [PubMed] [Google Scholar]
- Goetz CA, Baldwin AS. NF-kappaB pathways in the immune system: control of the germinal center reaction. Immunol Res. 2008;41:233–247. doi: 10.1007/s12026-008-8033-1. [DOI] [PubMed] [Google Scholar]
- Petro JB, Rahman SJ, Ballard DW, Khan WN. Bruton's tyrosine kinase is required for activation of Ikappab kinase and nuclear factor kappaB in response to B cell receptor engagement. J Exp Med. 2000;191:1745–1753. doi: 10.1084/jem.191.10.1745. [DOI] [PMC free article] [PubMed] [Google Scholar]
- Alessi DR, Sakamoto K, Bayascas JR. LKB1-dependent signaling pathways. Annu Rev Biochem. 2006;75:137–163. doi: 10.1146/annurev.biochem.75.103004.142702. [DOI] [PubMed] [Google Scholar]
- Dal Porto JM, Gauld SB, Merrell KT, Mills D, Pugh-Bernard AE, Cambier J. B cell antigen receptor signaling 101. Mol Immunol. 2004;41:599–613. doi: 10.1016/j.molimm.2004.04.008. [DOI] [PubMed] [Google Scholar]
- Esteve-Puig R, Canals F, Colomé N, Merlino G, Recio JA. Uncoupling of the LKB1-AMPKalpha energy sensor pathway by growth factors and oncogenic BRAF. PLoS ONE. 2009;4:e4771. doi: 10.1371/journal.pone.0004771. [DOI] [PMC free article] [PubMed] [Google Scholar]
- Zheng B, Jeong JH, Asara JM, Yuan Y-Y, Granter SR, Chin L, Cantley LC. Oncogenic B-RAF negatively regulates the tumor suppressor LKB1 to promote melanoma cell proliferation. Mol Cell. 2009;33:237–247. doi: 10.1016/j.molcel.2008.12.026. [DOI] [PMC free article] [PubMed] [Google Scholar]
- Lo AK-F, Lo K-W, Ko C-W, Young LS, Dawson CW. Inhibition of the LKB1-AMPK pathway by the Epstein-Barr virus-encoded LMP1 promotes proliferation and transformation of human nasopharyngeal epithelial cells. J Pathol. 2013;230:336–346. doi: 10.1002/path.4201. [DOI] [PubMed] [Google Scholar]
- Crotty S. Follicular helper CD4 T cells (TFH) Annu Rev Immunol. 2011;29:621–663. doi: 10.1146/annurev-immunol-031210-101400. [DOI] [PubMed] [Google Scholar]
- Johnston RJ, Poholek AC, DiToro D, Yusuf I, Eto D, Barnett B, Dent AL, Craft J, Crotty S. Bcl6 and Blimp-1 are reciprocal and antagonistic regulators of T follicular helper cell differentiation. Science. 2009;325:1006–1010. doi: 10.1126/science.1175870. [DOI] [PMC free article] [PubMed] [Google Scholar]
- King C, Tangye SG, Mackay CR. T follicular helper (TFH) cells in normal and dysregulated immune responses. Annu Rev Immunol. 2008;26:741–766. doi: 10.1146/annurev.immunol.26.021607.090344. [DOI] [PubMed] [Google Scholar]
- Nurieva RI, Chung Y, Hwang D, Yang XO, Kang HS, Ma L, Wang YH, Watowich SS, Jetten AM, Tian Q, et al. Generation of T follicular helper cells is mediated by interleukin-21 but independent of T helper 1, 2, or 17 cell lineages. Immunity. 2008;29:138–149. doi: 10.1016/j.immuni.2008.05.009. [DOI] [PMC free article] [PubMed] [Google Scholar]
- Nurieva RI, Chung Y, Martinez GJ, Yang XO, Tanaka S, Matskevitch TD, Wang YH, Dong C. Bcl6 mediates the development of T follicular helper cells. Science. 2009;325:1001–1005. doi: 10.1126/science.1176676. [DOI] [PMC free article] [PubMed] [Google Scholar]
- Yu D, Rao S, Tsai LM, Lee SK, He Y, Sutcliffe EL, Srivastava M, Linterman M, Zheng L, Simpson N, et al. The transcriptional repressor Bcl-6 directs T follicular helper cell lineage commitment. Immunity. 2009;31:457–468. doi: 10.1016/j.immuni.2009.07.002. [DOI] [PubMed] [Google Scholar]
- Rolf J, Bell SE, Kovesdi D, Janas ML, Soond DR, Webb LM, Santinelli S, Saunders T, Hebeis B, Killeen N, et al. Phosphoinositide 3-kinase activity in T cells regulates the magnitude of the germinal center reaction. J Immunol. 2010;185:4042–4052. doi: 10.4049/jimmunol.1001730. [DOI] [PubMed] [Google Scholar]
- Cao Y, Li H, Liu H, Zhang M, Hua Z, Ji H, Liu X. LKB1 regulates TCR-mediated PLCgamma1 activation and thymocyte positive selection. EMBO J. 2011;30:2083–2093. doi: 10.1038/emboj.2011.116. [DOI] [PMC free article] [PubMed] [Google Scholar]
- Sen R, Baltimore D. Multiple nuclear factors interact with the immunoglobulin enhancer sequences. Cell. 1986;46:705–716. [PubMed] [Google Scholar]
- Sasaki Y, Derudder E, Hobeika E, Pelanda R, Reth M, Rajewsky K, Schmidt-Supprian M. Canonical NF-kappaB activity, dispensable for B cell development, replaces BAFF-receptor signals and promotes B cell proliferation upon activation. Immunity. 2006;24:729–739. doi: 10.1016/j.immuni.2006.04.005. [DOI] [PubMed] [Google Scholar]
- Chu Y, Vahl JC, Kumar D, Heger K, Bertossi A, Wójtowicz E, Soberon V, Schenten D, Mack B, Reutelshöfer M, et al. B cells lacking the tumor suppressor TNFAIP3/A20 display impaired differentiation and hyperactivation and cause inflammation and autoimmunity in aged mice. Blood. 2011;117:2227–2236. doi: 10.1182/blood-2010-09-306019. [DOI] [PubMed] [Google Scholar]
- Hömig-Hölzel C, Hojer C, Rastelli J, Casola S, Strobl LJ, Müller W, Quintanilla-Martinez L, Gewies A, Ruland J, Rajewsky K, et al. Constitutive CD40 signaling in B cells selectively activates the noncanonical NF-kappaB pathway and promotes lymphomagenesis. J Exp Med. 2008;205:1317–1329. doi: 10.1084/jem.20080238. [DOI] [PMC free article] [PubMed] [Google Scholar]
- Xie P, Stunz LL, Larison KD, Yang B, Bishop GA. Tumor necrosis factor receptor-associated factor 3 is a critical regulator of B cell homeostasis in secondary lymphoid organs. Immunity. 2007;27:253–267. doi: 10.1016/j.immuni.2007.07.012. [DOI] [PMC free article] [PubMed] [Google Scholar]
- Qian Y, Qin J, Cui G, Naramura M, Snow EC, Ware CF, Fairchild RL, Omori SA, Rickert RC, Scott M, et al. Act1, a negative regulator in CD40- and BAFF-mediated B cell survival. Immunity. 2004;21:575–587. doi: 10.1016/j.immuni.2004.09.001. [DOI] [PubMed] [Google Scholar]
- Tavares RM, Turer EE, Liu CL, Advincula R, Scapini P, Rhee L, Barrera J, Lowell CA, Utz PJ, Malynn BA, et al. The ubiquitin modifying enzyme A20 restricts B cell survival and prevents autoimmunity. Immunity. 2010;33:181–191. doi: 10.1016/j.immuni.2010.07.017. [DOI] [PMC free article] [PubMed] [Google Scholar]
- Teitell MA. OCA-B regulation of B-cell development and function. Trends Immunol. 2003;24:546–553. doi: 10.1016/j.it.2003.08.002. [DOI] [PubMed] [Google Scholar]
- Hurov J, Piwnica-Worms H. The Par-1/MARK family of protein kinases: from polarity to metabolism. Cell Cycle. 2007;6:1966–1969. doi: 10.4161/cc.6.16.4576. [DOI] [PubMed] [Google Scholar]
- Cheng H, Liu P, Wang ZC, Zou L, Santiago S, Garbitt V, Gjoerup OV, Iglehart JD, Miron A, Richardson AL, et al. SIK1 couples LKB1 to p53-dependent anoikis and suppresses metastasis. Sci Signal. 2009;2:ra35. doi: 10.1126/scisignal.2000369. [DOI] [PMC free article] [PubMed] [Google Scholar]
- Sherman MH, Bassing CH, Teitell MA. Regulation of cell differentiation by the DNA damage response. Trends Cell Biol. 2011;21:312–319. doi: 10.1016/j.tcb.2011.01.004. [DOI] [PMC free article] [PubMed] [Google Scholar]
- Walsh NC, Teitell M. B-cell differentiation stimulated by physiologic DNA double strand breaks. Cell Cycle. 2011;10:176–177. doi: 10.4161/cc.10.2.14474. [DOI] [PubMed] [Google Scholar]
- Kaser A, Dunzendorfer S, Offner FA, Ludwiczek O, Enrich B, Koch RO, Cruikshank WW, Wiedermann CJ, Tilg H. B lymphocyte-derived IL-16 attracts dendritic cells and Th cells. J Immunol. 2000;165:2474–2480. doi: 10.4049/jimmunol.165.5.2474. [DOI] [PubMed] [Google Scholar]
- Gunn MD, Ngo VN, Ansel KM, Ekland EH, Cyster JG, Williams LT. A B-cell-homing chemokine made in lymphoid follicles activates Burkitt's lymphoma receptor-1. Nature. 1998;391:799–803. doi: 10.1038/35876. [DOI] [PubMed] [Google Scholar]
- Legler DF, Loetscher M, Roos RS, Clark-Lewis I, Baggiolini M, Moser B. B cell-attracting chemokine 1, a human CXC chemokine expressed in lymphoid tissues, selectively attracts B lymphocytes via BLR1/CXCR5. J Exp Med. 1998;187:655–660. doi: 10.1084/jem.187.4.655. [DOI] [PMC free article] [PubMed] [Google Scholar]
- Deenick EK, Chan A, Ma CS, Gatto D, Schwartzberg PL, Brink R, Tangye SG. Follicular helper T cell differentiation requires continuous antigen presentation that is independent of unique B cell signaling. Immunity. 2010;33:241–253. doi: 10.1016/j.immuni.2010.07.015. [DOI] [PMC free article] [PubMed] [Google Scholar]
- Goenka R, Barnett LG, Silver JS, O'Neill PJ, Hunter CA, Cancro MP, Laufer TM. Cutting edge: dendritic cell-restricted antigen presentation initiates the follicular helper T cell program but cannot complete ultimate effector differentiation. J Immunol. 2011;187:1091–1095. doi: 10.4049/jimmunol.1100853. [DOI] [PMC free article] [PubMed] [Google Scholar]
- Fahey LM, Wilson EB, Elsaesser H, Fistonich CD, McGavern DB, Brooks DG. Viral persistence redirects CD4 T cell differentiation toward T follicular helper cells. J Exp Med. 2011;208:987–999. doi: 10.1084/jem.20101773. [DOI] [PMC free article] [PubMed] [Google Scholar]
- Akamine R, Yamamoto T, Watanabe M, Yamazaki N, Kataoka M, Ishikawa M, Ooie T, Baba Y, Shinohara Y. Usefulness of the 5′ region of the cDNA encoding acidic ribosomal phosphoprotein P0 conserved among rats, mice, and humans as a standard probe for gene expression analysis in different tissues and animal species. J Biochem Biophys Methods. 2007;70:481–486. doi: 10.1016/j.jbbm.2006.11.008. [DOI] [PubMed] [Google Scholar]
- Izon DJ, Punt JA, Xu L, Karnell FG, Allman D, Myung PS, Boerth NJ, Pui JC, Koretzky GA, Pear WS. Notch1 regulates maturation of CD4+ and CD8+ thymocytes by modulating TCR signal strength. Immunity. 2001;14:253–264. doi: 10.1016/s1074-7613(01)00107-8. [DOI] [PubMed] [Google Scholar]
Associated Data
This section collects any data citations, data availability statements, or supplementary materials included in this article.
Supplementary Materials
Appendix
Expanded View Figures PDF
Review Process File