Abstract
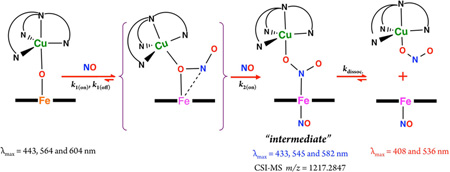
While nitric oxide (NO, nitrogen monoxide) is a critically important signaling agent, its cellular concentrations must be tightly controlled, generally through its oxidative conversion to nitrite (NO2−) where it is held in reserve to be reconverted as needed. In part, this reaction is mediated by the binuclear heme a3/CuB active site of cytochrome c oxidase. In this report, the oxidation of NO(g) to nitrite is shown to occur efficiently in new synthetic µ-oxo heme-FeIII−O−CuII(L) constructs (L being a tridentate or tetradentate pyridyl/alkylamino ligand), and spectroscopic and kinetic investigations provide detailed mechanistic insights. Two new X-ray structures of µ-oxo complexes have been determined and compared to literature analogs. All µ-oxo complexes react with 2 mol equiv NO(g) to give 1:1 mixtures of discrete [(L)CuII(NO2−)]+ plus ferrous heme-nitrosyl compounds; when the first NO(g) equiv reduces the heme center and itself is oxidized to nitrite, the second equiv of NO(g) traps the ferrous heme thus formed. For one µ-oxo heme-FeIII−O−CuII(L) compound, the reaction with NO(g) reveals an intermediate species (“intermediate”), formally a bis-NO adduct, [(NO)(porphyrinate)FeII-(NO2−)−CuII(L)]+ (λmax = 433 nm), confirmed by cryo-spray ionization mass spectrometry and EPR spectroscopy, along with the observation that cooling a 1:1 mixture of [(L)CuII(NO2−)]+ and heme-FeII(NO) to −125 °C leads to association and generation of the key 433 nm UV–vis feature. Kinetic-thermodynamic parameters obtained from low-temperature stopped-flow measurements are in excellent agreement with DFT calculations carried out which describe the sequential addition of NO(g) to the µ-oxo complex.
INTRODUCTION
Nitric oxide (NO) is a multitasking signaling molecule of great importance in living systems, which is now widely regarded as a muscle relaxant, vasodilator, neurotransmitter, etc.1,2 This versatile second messenger has a short half-life and can be produced by either oxidative or reductive pathways.3 Under conditions of having a normal level of oxygen (normoxia), when the oxidative pathway dominates, NO(g) is produced through an oxygen-dependent l-arginine-NO synthase (NOS) pathway,4 while in hypoxic conditions, as oxygen tensions fall, enzymatic one-electron reduction of nitrite (NO2−) is gradually activated, serving as a back-up system to ensure that there is sufficient NO(g) production.3,5 It is believed that cytochrome c oxidase (CcO) is the major mitochondrial site of NO(g) production in hypoxic cells.6
Cytochrome c oxidase is the terminal enzyme of the respiratory chain that is traditionally known to catalyze the four-electron reduction of molecular oxygen (O2) to water (H2O) in all eukaryotes. The active site of CcO contains a binuclear center comprising an iron porphyrin heme a3 and a tris-histidine-coordinated copper (CuB) ion, to which O2 binds, acting as the terminal electron acceptor in the respiratory chain.7 When the O2 concentration is low, the NO(g) thus generated by CcO nitrite reduction reversibly inhibits the oxygen consumption at the same center, resulting in cellular O2 accumulation (Figure 1).8 At this stage, the mitochondrially produced NO(g) is also known to participate in hypoxic signaling and induction of nuclear hypoxic genes.9
Figure 1.
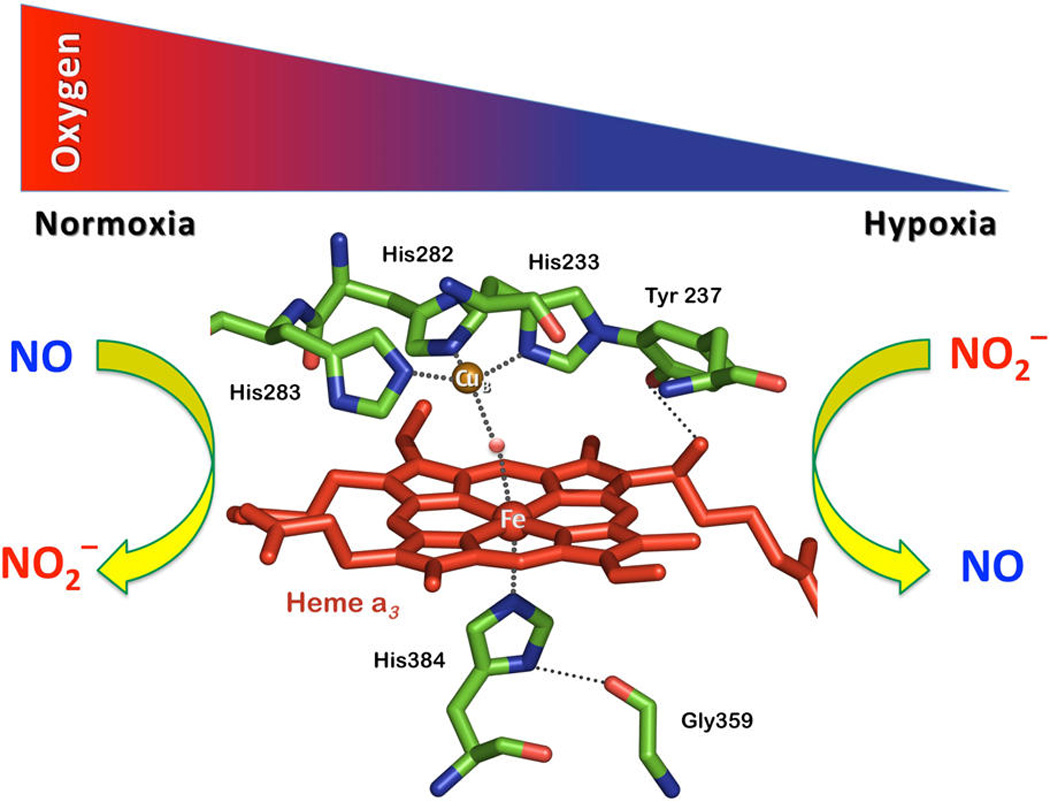
Endogenous nitrite (NO2−) and nitric oxide (NO) modulate cell respiration in an oxygen-dependent manner through interaction with the heme a3/CuB active site of cytochrome c oxidase (CcO). The structural features of the binuclear center of CcO are based on PDB code 1XME.
In turn, at mitochondrial sites recovering from hypoxia, an increase in the local O2 availability stimulates one-electron oxidation of NO(g) back to NO2−. This redox reaction also occurs at the CcO binuclear center as an adaptive way to remove NO(g) from the system, which is critical for retrieving normal cell function. Thus, CcO is involved in both endogenous generation and metabolism of nitric oxide, i.e., the heme a3/CuB active site is both a source of and target for this redox-active signaling molecule (Figure 1).10
The roles that metal centers may play in this redox interplay between nitrite and nitric oxide have inspired us to generate a synthetic heme/Cu assembly that in its partially reduced form could reduce nitrite to NO(g), while its fully oxidized form, a different µ-oxo heme-FeIII−O−CuII(L) complex (L = N-donor chelating ligand), oxidizes NO(g) back to nitrite.11 Our findings showed that in the nitrite reductase chemistry, the cupric center serves as a Lewis acid, while the heme is the redox active center and provides the electron. We also further studied some synthetic variation of both heme and copper centers, and based on our observations, we found that the reaction rate was independent of the heme reducing ability.12 Also, differing modes of nitrite coordination to the cupric center, monodentate vs O,O′-bidentate, lead to different kinetic behavior in nitrite reduction.12 This suggests that the binding mode of nitrite to the cupric ion may dictate in what fashion nitrite approaches and coordinates to the ferrous heme and binding of nitrite to the iron center either via a N- or O-atom influences the overall kinetics. Here, the cupric center also acts as a strong oxoacceptor facilitating nitrite (N−O) bond cleavage.
In this report, we focus on nitric oxide oxidase chemistry and describe different µ-oxo heme-FeIII−O−CuII(L) complexes mediating the one-electron oxidation of NO(g) to nitrite. New insights are provided by detailed studies where modifications of the heme or copper chelating ligand are utilized. Thus, the copper coordination environment contains either a tripodal tetradentate pyridyl-alkylamine ligand or a related tridentate alkylamine ligand. Two different tetraarylporphyrinates are employed in the present work, one with electron-withdrawing peripheral substituents versus one with strong electron-donating groups.
Scheme 1 shows the structures of µ-oxo heme-FeIII−O−CuII(L) complexes used in this study. As indicated, the reactivity observed by using [(F8)FeIII−O−CuII(tmpa)]-[B(C6F5)4], [(F8)FeIII−O−CuII(AN)][B(C6F5)4], [(F8)FeIII−O−CuII(MePY2)][B(C6F5)4], or [(TMPP)FeIII−O−CuII(tmpa)][B(C6F5)4] (see Experimental Section) with NO(g) results in highly efficient production of nitrite forming the corresponding cupricnitrite complex; the reduced heme is trapped by a second equiv of NO(g) giving a stable ferrous hemenitrosyl. Through a combination of kinetic investigations, spectroscopic interrogation, application of cryo-spray ionization (CSI) mass spectrometry, and DFT calculations, we reveal intimated details of the course and mechanism of reaction, including the discovery of a novel metastable intermediate which reveals a new kind of NO(g) reactivity and following oxotransfer chemistry.
Scheme 1.
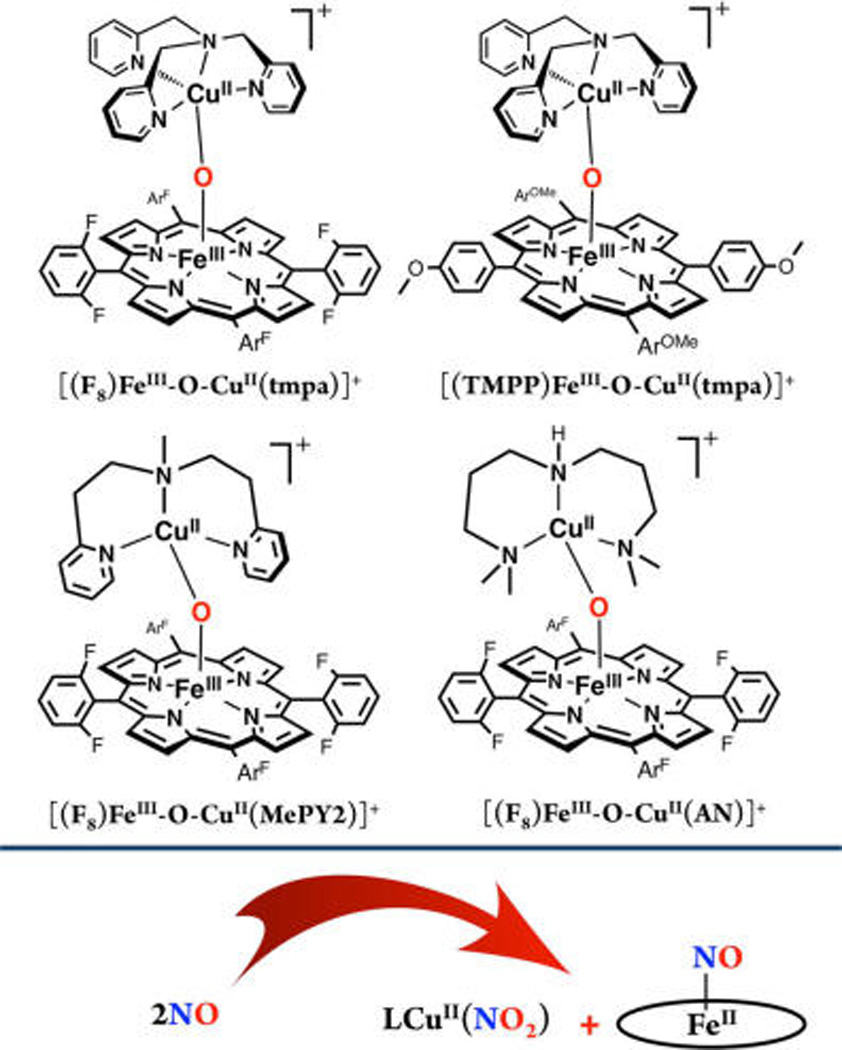
Structures of µ-oxo Heme-FeIII−O−CuII(L) Complexes Used in This Studya
aF8: tetrakis(2,6-difluorophenyl)porphyrinate(2-); TMPP: tetrakis(4-methoxyphenyl)porphyrinate(2-); tmpa: tris(2-pyridylmethylamine); AN: 3,3′-imino-bis(N,N-dimethylpropylamine); MePY2: bis(2-pyrid-yl-ethyl)methylamine.
RESULTS AND DISCUSSION
The µ-oxo Heme-FeIII−O−CuII(L) Compounds
Two of the complexes used here to carry out the nitric oxide oxidation to nitrite have been previously structurally characterized, [(F8)FeIII−O−CuII(tmpa)]+ and [(F8)FeIII−O−CuII(AN)]+. Such species are themselves rather novel, as (i) they can be synthesized via metal-dioxygen chemistry; (ii) they possess interesting magnetic-electronic properties (i.e., having S = 2 ground states, which leads to EPR silence), and the high-spin iron(III) ion, well above (~0.5 Å, see Table 1) the porphyrinate plane, is antiferromagnetically coupled to the S = 1/2 d9 cupric ion; (iii) the bridging oxo atom is very basic, and in some cases the protonated acid-base partner, the µ-hydroxo complexes heme-FeIII−(OH)−CuII(L), have been characterized and pKa values measured;13 (iv) with L being a tetradentate chelate, the Fe−O−Cu moiety is near linear (170–180°), but for L = a tridentate ligand, ∠Fe−O−Cu = 140–150° (Table 1); and (v) the Soret bands of these µ-oxo complexes are considerably red-shifted (λmax = 430–450 nm) relative to those of classical high-spin ferric hemes, and this distinctive feature of the µ-oxo heme-FeIII−O−CuII(L) compounds may be due to the higher degree of π charge donation onto the available FeIII ion by the bridging oxo group.
Table 1.
Structural Comparison of µ-oxo Heme-FeIII−O−CuII(L) Complexes
| compound | ∠Fe−O−Cu (deg) | Cu−O (Å) | Fe−O (Å) | Fe⋯Cu (Å) | Fe out of N4 plane (Å) | ref |
|---|---|---|---|---|---|---|
| [(F8)FeIII−O−CuII(tmpa)]+ | 178.1(4) | 1.856(6) | 1.740(6) | 3.596 | 0.554 | 14, 15 |
| [(F8)FeIII−O−CuII(MePY2)]+ | 142.48(8) | 1.8452(13) | 1.7563(14) | 3.410 | 0.553 | this work |
| [(F8)FeIII−O−CuII(AN)]+ | 149.5(1) | 1.816(2) | 1.746(2) | 3.437 | 0.507 | 16 |
| [(TMPP)FeIII−O−CuII(tmpa)]+ | 173.6(15) | 1.824(7) | 1.720(7) | 3.539 | 0.548 | this work |
| [(F8)FeIII−O−CuII(LMe2N)]+ | 143.4(1) | 1.852(2) | 1.747(2) | 3.417 | 0.550 | 17 |
| [(OEP)FeIII−O−CuII(Me6tren)]+ | 175.3(3) | 1.828(6) | 1.746(6) | 3.575 | 0.581 | 18 |
| [(6L)FeIII−O−CuII]+ | 171.1(3) | 1.848(4) | 1.749(4) | 3.586 | 0.579 | 19 |
| [(TMP)FeIII−O−CuII(5MeTPA)]+ | 172.8(2) | 1.854(3) | 1.760(3) | 3.607 | 0.601 | 20 |
LMe2N: N,N-bis{2-[2-(N′,N′-4-dimethylamino)pyridyl]ethyl}methylamine; OEP: octaethylporphyrinate(2−); Me6tren: tris[(N,N-dimethylamino)-ethyl]amine; 6L: 5-(o-O-[(N,N-bis(2-pyridylmethyl)-2-(6-methoxyl)pyridinemethanamine)phenyl] 10,15,20-tris(2,6-difluorophenyl)porphyrinate-(2−); TMP-5MeTPA: 10,15,20-tris(2,4,6-trimethylphenyl)-5-(2′-bis((5″-methyl-2″-pyridylmethyl)aminomethyl)pyridine-5′-carboxy-amidophenyl) porphyrinate(2−).
For the present studies, two new crystal structures have been determined via single crystal X-ray crystallography, [(F8)FeIII −O−CuII (MePY2)]+ and [(TMPP)FeIII−O−CuIII (tmpa)]+ (Figures 2 and 3). Relevant bond distances and angles are given in the figure captions, while we also provide additional core structure parameters for all known (and published) µ-oxo heme-FeIII−O−CuIII (L) compounds of this type (Table 1). Our new complexes conform to the previously observed findings in that the Fe−O−Cu core in the structure with MePY2 is bent (Figure 2), while in the complex bearing the tmpa ligand, the core is near linear (Figure 3). [(TMPP)FeIII−O−CuII(tmpa)]+ is the first µ-oxo complex of the Fe−O−Cu class which contains the strongly donating TMPP porphyrinate. We infer that the donating ability of TMPP as compared to F8 will make the oxo atom more electron rich, which could be responsible for the small shortening of both the Cu-O and Fe-O bond distances in [(TMPP)FeIII−O−CuII(tmpa)]+ as compared to [(F8)FeIII−O−CuII(tmpa)]+ (Table 1).
Figure 2.
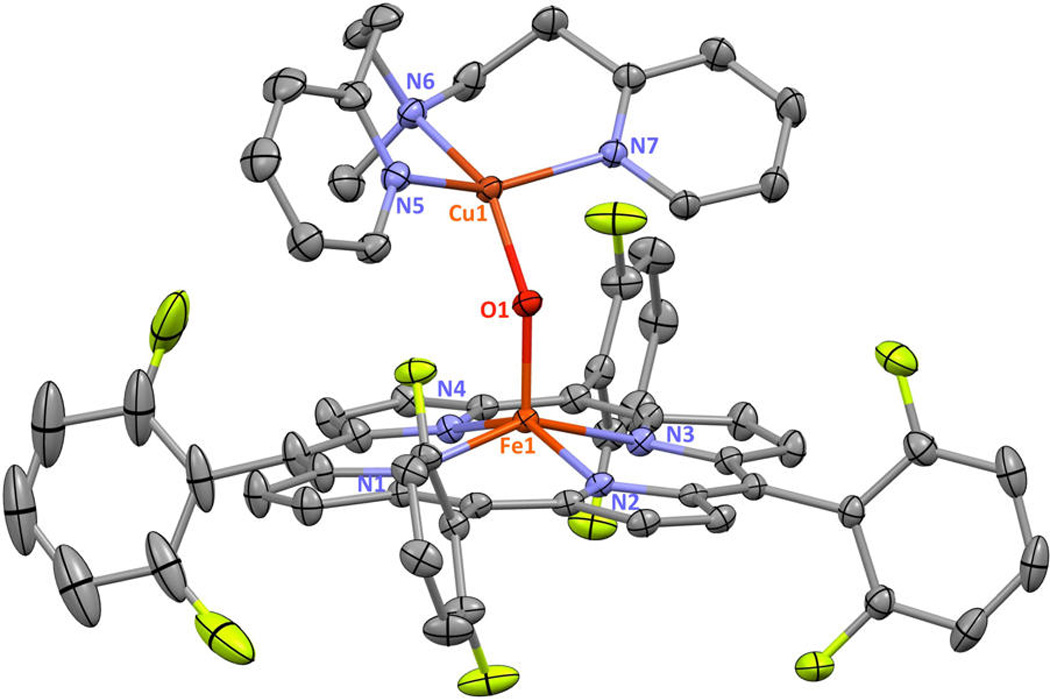
Displacement ellipsoid plot (50% probability level) of the cationic portion of [(F8)FeIII−O−CuII(MePY2)][B(C6F5)4] at 100(2) K. Counteranion and hydrogen atoms have been omitted for clarity. Selected bond lengths (Å) and angles (deg): Cu1−N5, 1.9997(17); Cu1−N6, 2.0557(17); Cu1−N7, 2.0150(17); Cu1−O1, 1.8452(13); Fe1−Np(average), 2.0940(8); Fe1−O1, 1.7563(14); Cu1−O1−Fe1, 142.48(8); N5−Cu1−N6, 91.97(7); N5−Cu1−N7, 148.46(7); N5−Cu1−O1, 93.44(7); N6−Cu1−N7, 96.94(7); N6−Cu1−O1, 148.15(7); N7−Cu1−O1, 94.67(7); Np−Fe1−O1(average), 105.32(7). See Table 1 and Supporting Information for further structural details.
Figure 3.
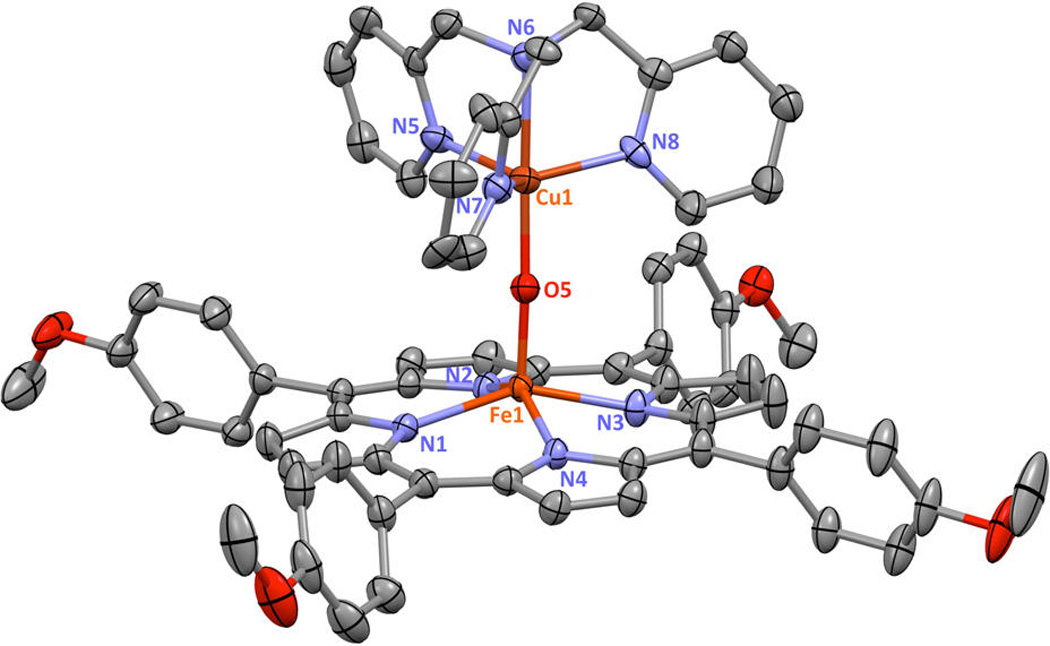
Displacement ellipsoid plot (50% probability level) showing the cationic portion of [(TMPP)FeIII−O−CuII(tmpa)][B(C6F5)4] at 100(2) K. Counteranion, solvent molecules, and hydrogen atoms have been omitted for clarity. Selected bond lengths (Å) and angles (deg): Cu1−N5, 2.086(8); Cu1−N6, 2.086(6); Cu1−N7, 2.046(5); Cu1−N8, 2.045(6); Cu1−O5, 1.824(7); Fe1−Np(average), 2.1022(6); Fe1−O5, 1.720(7); Cu1−O5−Fe1, 173.6(15); N5−Cu1−N6, 81.0(3); N5−Cu1−N7, 118.0(2); N5−Cu1−N8, 110.9(3); N5−Cu1−O5, 101.6(7); N6−Cu1−N7, 81.0(2); N6−Cu1−N8, 81.1(2); N6−Cu1−O5, 177.3(8); N7−Cu1−N8, 123.9(3); N7−Cu1−O5, 97.0(7); N8−Cu1−O5, 98.6(6); Np−Fe1−O5(average), 105.1(6). See Table 1 and Supporting Information for further structural details.
The cupric centers of both [(F8)FeIII−O−CuII(tmpa)]+ and [(TMPP)FeIII−O−CuII(tmpa)]+ complexes are pentacoordinated and bearing the same TMPA ligand, with three pyridyl nitrogens and one amino nitrogen and a bridging oxo ligand that occupies the fifth site. Interestingly, coordination geometry analysis of these two compounds reveals that the Cu(II) adopts very different geometries (Figure S1). We propose that the steric constraints imposed by the peripheral substituents on the attached porphyrin ring dictate the structural properties of the cupric center. In the former structure, steric hindrance of the fluorine groups of the F8 ligand cause the copper center to adjust to a distorted square pyramidal coordination geometry (τ = 0.3). All three pyridyl groups on the copper ligand are placed above and between the difluorophenyl meso-substituents of the heme.14 In contrast, in the latter µ-oxo complex, absence of steric hindrance allows the cupric center to adopt a nearly perfect trigonal bipyramidal (TBP) structure (τ = 0.9); the amine nitrogen N(6) and bridging oxo ion occupying the axial positions and the pyridyl nitrogens N(5), N(7), and N(8) in the trigonal plane. TBP structures are favored and very well-known for the TMPA framework, as found for many examples of structurally characterized [(tmpa)CuII(X)]n+ (X = H2O, MeCN, Cl−, NO2−) compounds.
Copper Fragment Coordination Environment Variants in NO Oxidase Chemistry
As mentioned, one set of alterations we carried out was to vary the chelating ligand on the copper ion for the µ-oxo heme-FeIII−O−CuII(L) compounds employed for NO oxidation (Schemes 1 and 2). Such changes in coordination environment, tridentate vs tetradentate ligands, pyridyl vs alkylamino donors or 5- vs 6-membered chelate rings, are well-known to dramatically influence both compound physical properties and reactivity patterns. In this section, we discuss how changes in L affect NO oxidase chemistry using a series of [(F8)FeIII−O−CuII(L)]+ complexes, Scheme 1.
Scheme 2.

Reactions of [(F8)FeIII−O−CuII(L)]+ Complexes with NO(g)
As previously reported for the case using the tetradentate TMPA ligand (Scheme 1), exposure of [(F8)FeIII−O−CuII(tmpa)]+ to NO(g) at RT resulted in a relatively slow conversion to the final cupric-nitrite and heme-nitrosyl products [(tmpa)CuII(NO2)]+ and (F8)FeII(NO).11 From UV–vis monitoring of the reaction, no intermediate was observed. Further, even when we repeated the chemistry at −40 °C, where the reaction was of course slower, still no intermediate could be detected (Figure 4a).21
Figure 4.
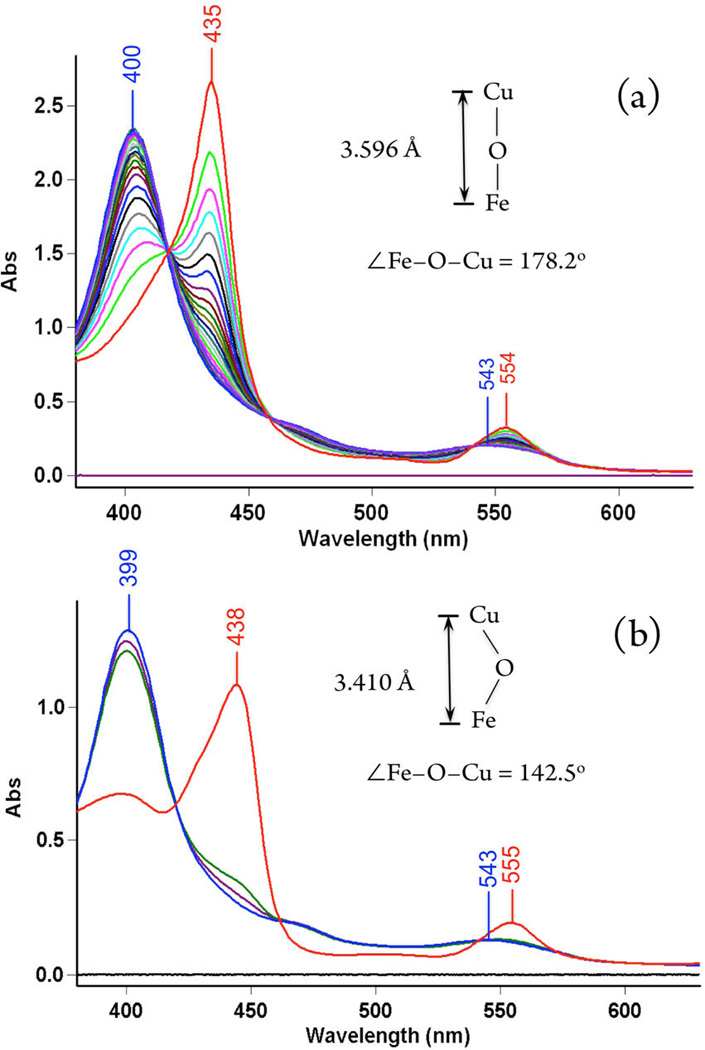
UV–vis spectra of (a) [(F8)FeIII−O−CuII(tmpa)]-[B(C6F5)4] (red), (F8)FeII(NO) (blue) generated from addition of 1 mL of NO(g) to the solution 75 µM in acetone in a 2 mm cuvette at −40 °C, after 30 min and (b) [(F8)FeIII−O−CuII(MePY2)]-[B(C6F5)4] (red) and (F8)FeII(NO) (blue) promptly generated after addition of 1 mL NO(g) into the µ-oxo complex solution 50 µM in acetone in a 2 mm cuvette at −40 °C.
In the present study, we have also employed the tridentate chelates, L = AN and MePY2, for the NO oxidase reaction; under the same conditions as for L = TMPA for NO oxidation, these transformations are considerably faster. For NO oxidation by [(F8)FeIII−O−CuII(AN)]+, the benchtop reaction at RT is over within the mixing time (Figure S2 (right)). The generation of a one-to-one mixture of (F8)FeII(NO) and [(AN)CuII(NO2)]+ in high yields was further confirmed by semiquantitative nitrite ion analysis and EPR spectroscopy (Figure S3). Similar results were obtained for the [(F8)FeIII−O−CuII(MePY2)]+ + NO(g) reaction and even at −40 °C monitoring reveals an essentially instantaneous conversion to the Cu(II)-nitrite plus ferrous hemenitrosyl products (Scheme 2, Figures 4b and S4).
These observations point to the importance of cupric ligation and influence of electronic and steric effects around the copper center on NO oxidase chemistry. Based on our previous studies on µ-oxo heme-FeIII−O−CuII(L) complexes where L is the tridentate ligand AN or MePY2, the basicity of the bridging oxo ion is elevated compared to the complex containing TMPA. This then may be responsible for a faster reaction with NO(g). Another possible factor explaining the acceleration of the reaction with NO(g) can be linked to a lack of steric hindrance. This may facilitate the approach of NO molecule to the more exposed bridging oxo atom where (i) the FeIII−O−CuII is relatively bent and (ii) the tetracoordination environment around the copper ion is indeed less crowded than for pentacoordination (with TMPA).
NO Oxidase Reactivity with [(TMPP)FeIII−O−CuII(tmpa)]+; Mechanistic Insights via Observation of Intermediates
As described in the Introduction, hoping to obtain some detailed mechanistic insights regarding this NO oxidase chemistry, we also altered the nature of the porphyrin ligand in the µ-oxo heme-FeIII−O−CuII(L) compound. Here, we kept the copper chelate TMPA constant and employed a different porphyrin ring with electron-donating para methoxy peripheral substituents, TMPP (Scheme 1). This new µ-oxo complex [(TMPP)FeIII−O−CuII(tmpa)]+ was synthesized, characterized, and studied for its NO oxidation chemistry. Upon addition of NO(g), UV–vis monitoring (Figure S5) of the reaction progress at RT showed an instant change from starting µ-oxo complex to a mixture of species followed by formation of the expected final products (Scheme 1). IR spectroscopy (νNO = 1677 cm−1) directly indicated the production of the ferrous heme nitrosyl (TMPP)FeII(NO). The quantitative analyses of UV–vis and EPR spectra of the reaction products (Figure S6) along with semiquantitative nitrite ion analysis confirmed the generation of a one-to-one mixture of (TMPP)FeII(NO) (λmax = 410 nm) and the cupric-nitrite complex, [(tmpa)CuII(NO2)]+, in high yields.
We repeated the reaction at −20 °C, where we were able to detect a new species, now to be referred to as the “intermediate”(Scheme 3) forming right after NO(g) addition to the solution of µ-oxo complex, as monitored by UV–vis spectroscopy (Figure 5). This “intermediate” (λmax = 433 nm)22 then isosbestically converts to the final products [(tmpa)-CuII(NO2)]+ and (TMPP)FeII(NO) in a first-order process with rate constant kdissoc. = 6.7 × 10⁻³ s−1 at −20 °C (Figure 5), while ΔH‡ and ΔS‡ are 41.1 ± 0.1 kJ mol−1 and −123 ± 2 J mol−1 K−1, respectively (Figure S8). The possible origin of the large and negative ΔS‡ is discussed below.
Scheme 3.

Proposed Reaction Steps for Nitric Oxide Oxidase Chemistry Mediated by µ-oxo Heme-FeIII−O−CuII(L) Complexes Leading to Observed Products
Figure 5.
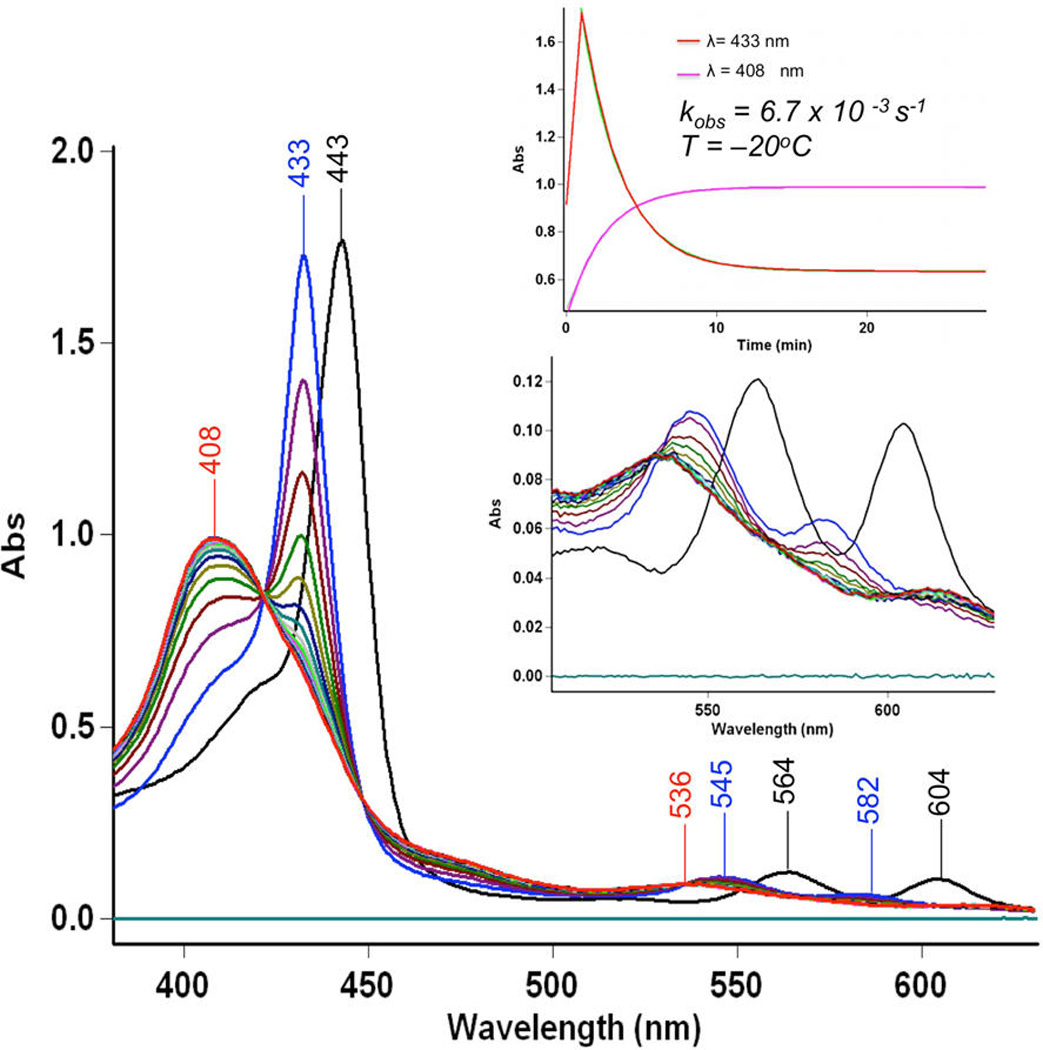
UV–vis spectra of [(TMPP)FeIII−O−CuII(tmpa)]-[B(C6F5)4] (black) 35 µM in acetone in a 2 mm cuvette at −20 °C, the “intermediate” (blue) generated upon addition of 1 mL of NO(g) into the solution. Slow conversion of the “intermediate” to the final product (TMPP)FeII(NO) (red) was monitored.
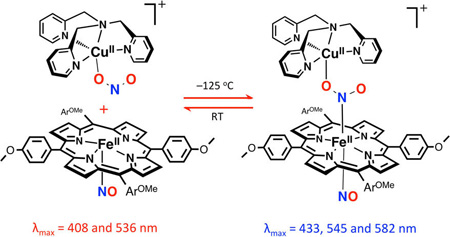
Our further analyses using DFT calculations (see further below) indicates that the λmax = 433 nm “intermediate” is a ferrous species. An experiment to support this supposition was to see if nitrite anion, as bound to a cupric center, could bind to a ferrous-nitrosyl complex. Cooling of a mixture of [(tmpa)-CuII(NO2)]+ and (TMPP)FeII(NO) to −125 °C (in MeTHF) resulted in a new UV–vis spectrum identical to that of the “intermediate” (Figure S9). In fact, this adduct formation is reversible (see diagram), as warming the “intermediate” releases the two mononuclear units, as already indicated by the kinetic study described above. Thus, together, these experimental observations (along with stopped-flow spectroscopy and CSI-MS results; see below) support the hypothesis that the “intermediate” comprises a six-coordinate ferrous heme-nitrosyl species joined to a cupricnitrite entity (Scheme 3).
The nature of this intermediate was further examined using EPR spectroscopy. [(TMPP)FeIII−O−CuII(tmpa)]+ is EPR silent as known for other µ-oxo heme-FeIII−O−CuII(L) compounds. An EPR spectrum of the “intermediate” (Figure S10) is dominated by a signal typical for [(tmpa)CuII(NO2−)]+ in a trigonal bipyramidal geometry, on top of an additional signal interpreted to be a six-coordinated ferrous-nitrosyl absorption, modified some from the signal most typical of {FeNO}7 complexes. EPR spectra of both the “intermediate” and products were simulated as a mixture of two one-electron systems, cupric and ferrous heme nitrosyl components (Figure S11). Successful modeling of the “intermediate” required consideration of the hyperfine coupling to both the nitrogen nucleus of the NO ligand (A2,NO = 18.9 G) and the trans axial nitrogenous donor, the bridging nitrite (a2,Nitrite = 7.74 G). These hyperfine coupling constants are consistent with reported values for six-coordinated ferrous heme nitrosyl complexes bearing trans nitrogen bases.23 Conversion of the “intermediate” to the product species (TMPP)FeII(NO) results in a slightly enhanced coupling to the nitrosyl ligand; the A2,NO value is now increased to 22.8 G. This suggests that the unpaired electron has considerable interaction with the axial bridging nitrite (a2,Nitrite = 7.74 G) in the “intermediate”, thus, the coupling to the NO ligand is somewhat decreased, relative to that in the final product, (TMPP)FeII(NO).24
We posit that the overall reaction of NO(g) with [(TMPP)-FeIII−O−CuII(tmpa)]+ involves an initial an electrophilic attack of NO(g) on the bridging oxo group, possible transient formation of a hydronitrite radical anion (i.e., NO22−),25 followed by rapid electron transfer and formation of the nitrite bridged ferrous heme moiety; this is then attacked by a second NO molecule on the open face of the heme (Scheme 3). These proposals are further supported via detailed kinetic studies and DFT calculations, as described and discussed below.
Stopped-Flow Kinetics of Sequential NO(g) Binding to [(TMPP)FeIII−O−CuII(tmpa)]+
Thus, as described above, −20 °C benchtop UV–vis spectroscopic monitoring revealed the presence of a rather stable intermediate. As it decays to isolable nitrito-Cu plus ferrous heme-nitrosyl complexes and can independently be generated from these moieties (i.e., from [(tmpa)CuII(NO2)]+ and (TMPP)FeII(NO)) in a reverse manner, it can be assigned as a [(NO)(TMPP)FeII−NO2−CuII(tmpa)]+ complex. As outlined in Scheme 3, the initial step is very fast NO(g) electrophilic attack on the bridging nucleophilic oxo ion, and this is followed by reaction of a second NO molecule, on the open face of the heme. This resulting bis-NO adduct, is in fact the 433 nm intermediate observed even at −20 °C by UV–vis spectroscopy (vide supra) and could be detected by CSI-MS at −60 °C (vide infra). By employing low-temperature stopped-flow kinetic methods, we have also been able to characterize the kinetics-thermodynamics for formation of the intermediate formed from addition of the first NO molecule, along with analogous data for the second NO(g) addition reaction.
The kinetic measurements were carried out using 10 µM complex solutions (see Experimental Section) for a range of low-temperatures, down to −83 °C while NO(g) concentrations ranged between 0.28 and 2.3 mM. At all temperatures, the reaction proceeded in two consecutive steps that were both dependent on NO(g) concentration; this finding is in agreement with our supposition concerning the binding of two NO’s and generation of the bis-NO adduct as the intermediate stable at low temperatures. The analysis of the overall spectral changes (Figure 6a) gave rise to the predicted (i.e., calculated) spectra of the species formed over the course of the reaction (Figure 6b), namely that the first NO molecule very rapidly adds to [(TMPP)FeIII−O−CuII(tmpa)]+ (λmax = 443 nm), and this is followed by slightly slower (also see below) addition of the second NO(g). From the two exponential fits of the two-phase kinetic traces (Figure 7), the corresponding observed rate constants for the first (k1) and the second (k2) reaction steps were obtained (Table S1).
Figure 6.
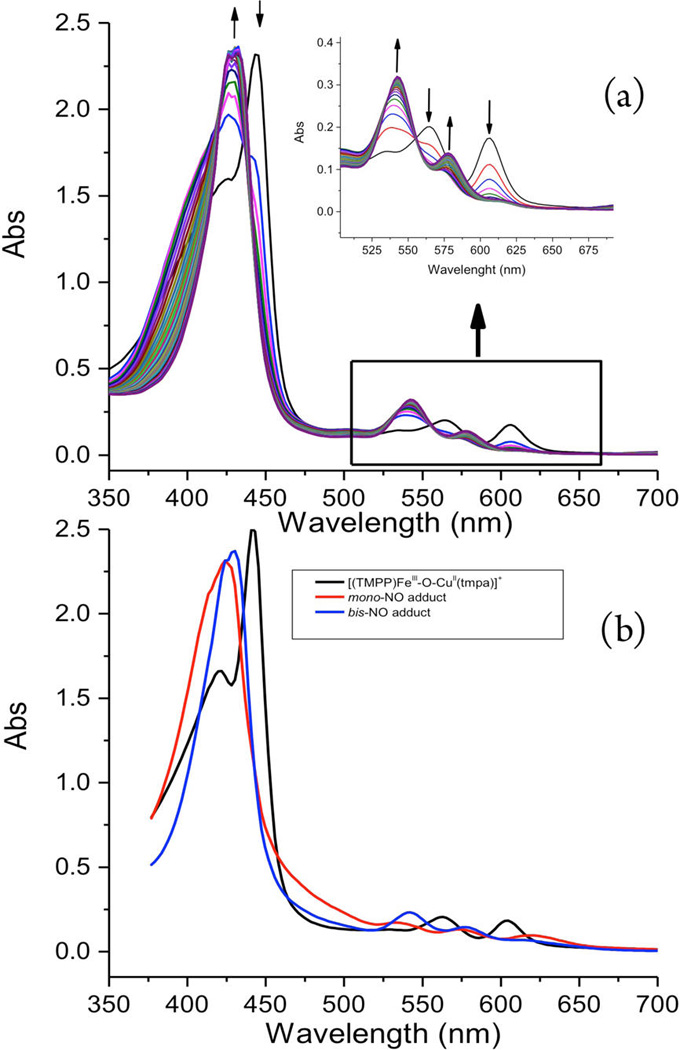
(a) Time resolved spectra for the reaction between [(TMPP)FeIII−O−CuII(tmpa)][B(C6F5)4] (λmax = 443, 564 an 604 nm, 10 µM) and NO(g) (2.3 mM) in a 10 mm cuvette in acetone at −60 °C (monitoring time 1.2 s; spectrum shown every 40 ms). (b) Spectra of the species involved in the two-step reaction ([(TMPP)-FeIII−O−CuII(tmpa)][B(C6F5)4] (black), mono-NO adduct (red, λmax= 424, 533, 574, and 619 nm) and bis-NO adduct (blue, λmax = 433, 545 and 582)).
Figure 7.
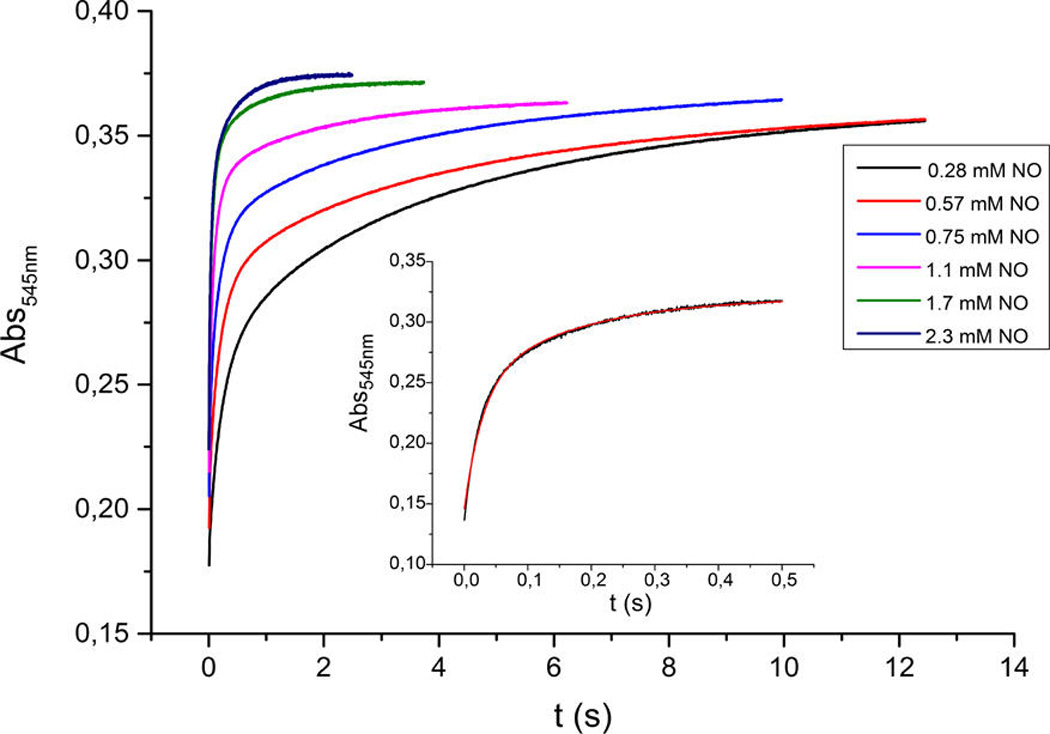
Traces at 545 nm for different NO(g) concentrations were obtained for the reaction between [(TMPP)FeIII−O−CuII(tmpa)]-[B(C6F5)4] and NO(g) in acetone at −60 °C. Inset: Kinetic trace with a two-exponential fit (red curve) for 0.28 mM NO(g); for examples of such traces at other wavelengths, see Figure S12.
At all temperatures, linear dependencies (k(obs) = k(on) [NO] + k(off)) of the observed rate constants (k1(obs) and k2(obs)) on concentration were obtained (Figure 8) with a slope corresponding to the second-order rate constants k1(on) and k2(on) for the forward reaction (Table 2). An intercept corresponding to the rate constant for the back reaction (k1(off)) was observed only for the first reaction step (Table 2), whereas the intercept in the case of the second reaction step was close to zero (within the error limits), suggesting an irreversible nature for the binding of the second NO(g).
Figure 8.
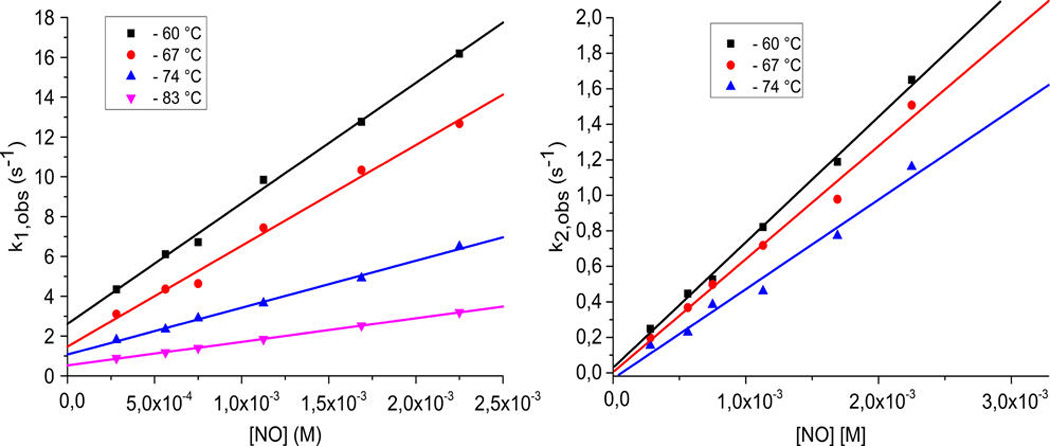
(Left) Linear dependence of k1(obs) on concentration at different temperatures for the reaction between [(TMPP)FeIII−O−CuII(tmpa)][B(C6F5)4] and NO(g) in acetone. (Right) Linear dependence of k2(obs) on concentration at different temperatures for the reaction between the µ-oxo complex and NO(g) in acetone.
Table 2.
Temperature Dependence of k1(on), k1(off), and k2(on)
| T (°C) | k1(on) (M−1 s−1) | k1(off) (s−1) | k2(on) (M−1 s−1) |
|---|---|---|---|
| −60 | 6053 ± 186 | 2.61 ± 0.24 | 706 ± 20 |
| −67 | 5061 ± 244 | 1.47 ± 0.32 | 637 ± 40 |
| −74 | 2356 ± 69 | 1.07 ± 0.09 | 504 ± 40 |
| −83a | 1184 ± 12 | 0.50 ± 0.01 |
The second step at −83 °C was very slow, and k2(obs) and k2(on) could not be accurately determined.
From the corresponding Eyring plots (Figures S13 and S14), activation parameters for the forward (ΔH‡(on) and ΔS‡(on)) for the first (k1) and second (k2) step and for the reverse reaction (ΔH‡(off) and ΔS‡(off)) for the first step (k1) were determined (Table 3).
Table 3.
Activation and Reaction Parameters for Binding of the First and Second NO(g)
| reaction | ΔH‡(on) (kJ mol−1) | ΔS‡(on) (J mol−1 K−1) | ΔH‡(off) (kJ mol−1) | ΔS‡(off) (J mol−1 K−1) | ΔH° (kJ mol−1) | ΔS° (J mol−1 K−1) |
|---|---|---|---|---|---|---|
| first NO(g) | 24 ± 3 | −64 ± 10 | 22 ± 2 | −131 ± 9 | 2.0 ± 0.4 | 67 ± 15 |
| second NO(g) | 7 ± 2 | −155 ± 8 |
We note that the first NO molecule binds to [(TMPP)FeIII−O−CuII(tmpa)]+ at rates which are about 1 order of magnitude greater than for the second NO molecule (Scheme 3; Table 2), which allowed us to obtain kinetic parameters for both steps. The low values of the ΔH‡(on) and strong negative values for ΔS‡(on) are consistent with the associative character of both reaction steps, confirming that they are related to the binding of NO(g). The negligible activation enthalpy (7 ± 2 kJ mol−1, i.e., 1.7 ± 0.5 kcal mol−1) for the binding of the second NO(g) suggests an almost activation-less character for this reaction step. This, together with the very negative ΔS‡(on) value, reveals that in the rate-determining step bond breaking does not play a role and that bond making predominates. These data are in agreement with the DFT studies (vide infra).
Having activation parameters for both the forward and reverse reaction, it is possible to calculate the reaction thermodynamic parameters for the binding of the first NO molecule, i.e., reaction enthalpy ΔH° and reaction entropy ΔS° (Table 3). It is notable that the overall reaction entropy is positive (Table 3), pointing to the important role of solvation/ electrostriction effects in the overall entropy changes for addition of the first NO(g).26
For the binding of the first NO molecule, the reaction free energy ΔG° and equilibrium constant K at a certain temperature can also be calculated. At −60 °C (213.15 K) the reaction free energy for the binding of the first NO(g) is ΔG° = −12 ± 3 kJ mol−1, while the kinetically determined equilibrium constant has a value of K1 = k1(on)/k1(off) = 2319 ± 284 M−1.27
To corroborate this value of the equilibrium constant obtained based on the kinetic data that corresponds to the first NO(g) binding, we have also analyzed the spectral changes at 545 nm (Figure 9) related to this step as a function of NO(g) concentration according to eq 1,
| (1) |
where Ax is the absorption of the mono-NO adduct at a certain NO(g) concentration, A0 is the initial absorption, A∞ is the final absorption, and K is the binding constant.
Figure 9.
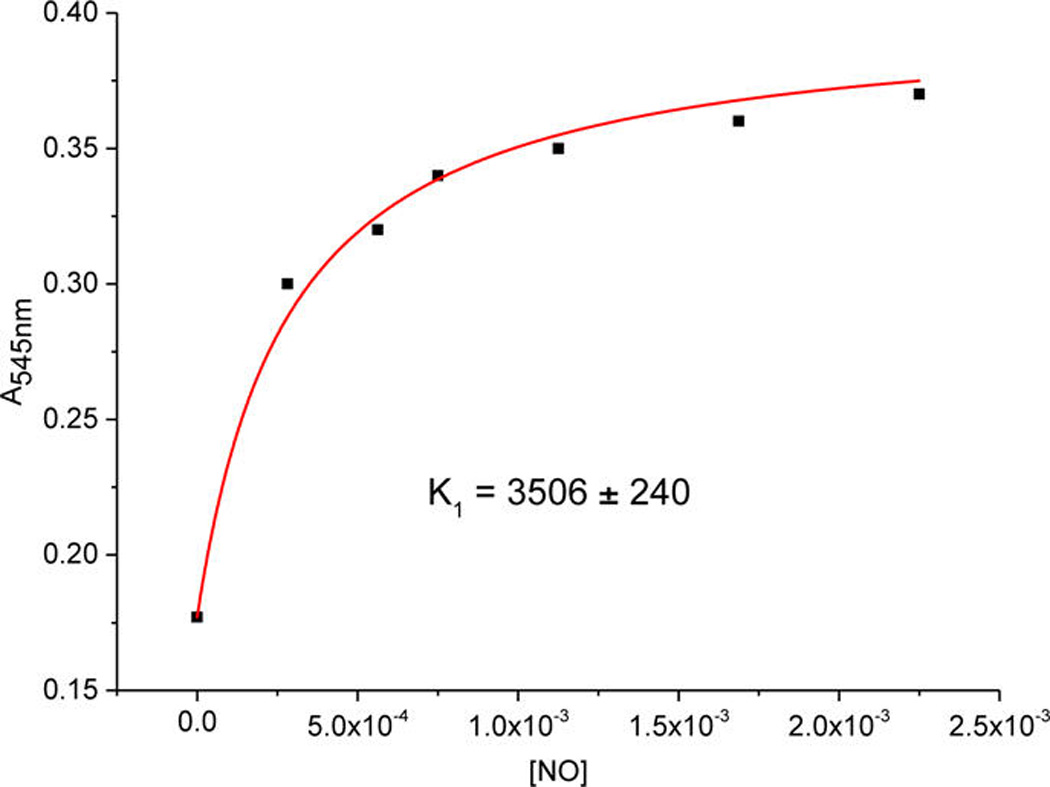
Absorbance at 545 nm (at the end of the first reaction step at −60 °C) as a function of NO(g) concentration (data fitted in eq 1).
The K1 values at −60 °C obtained from kinetics (2319 ± 284 M−1) and then thermodynamics (3506 ± 240 M−1, Figure 9) are in reasonable agreement,28 confirming the reversible nature of the process that results in the mono-NO adduct. By way of comparison, the value for K1 at −74 °C obtained by the analysis of the spectral changes as a function of NO(g) concentration is 3044 ± 144 M−1 (Figure S15), with corresponding K1 = k1(on)/k1(off) = 2202 ± 250 M−1.27 A rather small effect of temperature on this equilibrium is in an accord with the negligible reaction enthalpy, which is also confirmed by experimentally obtained kinetic parameters (Table 3) as well as by DFT calculations (vide infra).
Cryo-Spray Ionization Mass Spectrometry (CSI-MS)
CSI-MS proved to be very useful for the study and characterization of the “intermediate” described herein. A manifold of intense peaks (with maximum at m/z = 1217.2847) corresponds to this bis-NO adduct which is moderately stable at −60 °C; the isotope pattern is in agreement with theory (Figure 10). Mass spectra obtained before addition of NO(g) showed the intact starting µ-oxo complex, [(TMPP)FeIII−O−CuII(tmpa)]+, as the main species observed (Figure S16), whereas the mass spectrum of the product solution confirmed the cleavage of the “intermediate” into [(tmpa)CuII(NO2)]+ and (TMPP)FeII(NO) (Figure S17).
Figure 10.
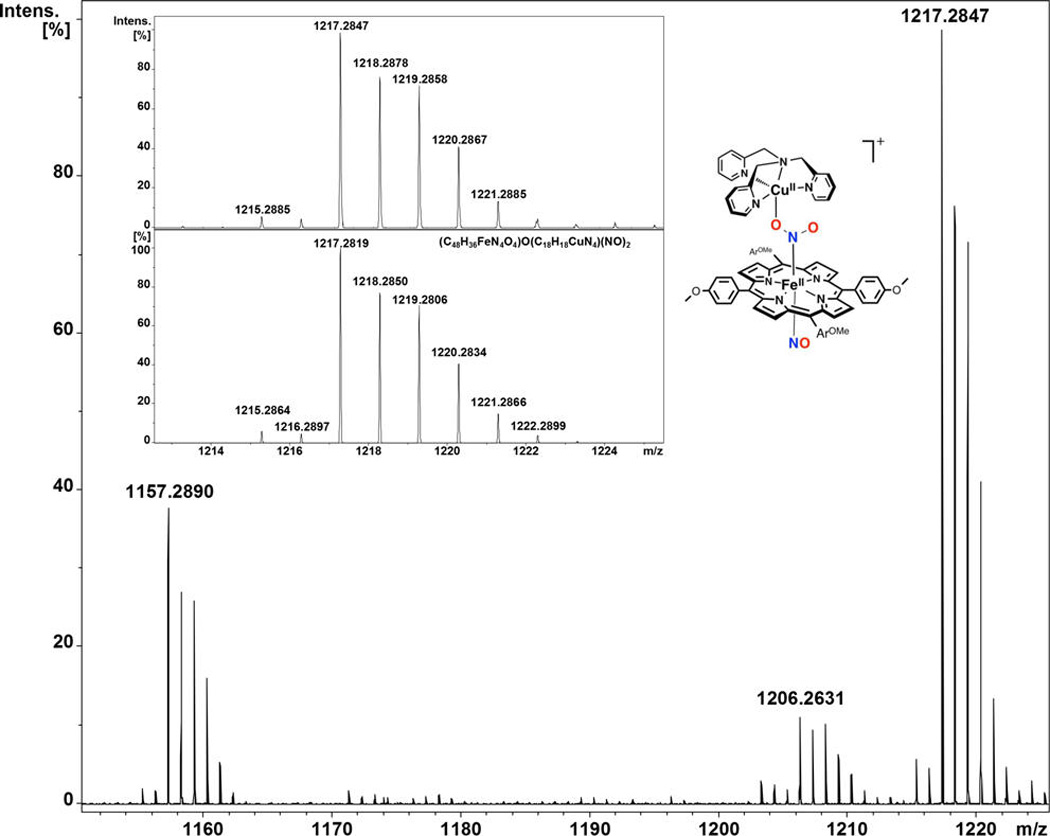
Mass spectrum of [(TMPP)FeIII−O−CuII(tmpa)]+ in acetone immediately after bubbling with NO(g) (spray gas temperature −60 °C, dry gas temperature −55 °C; main species m/z = 1217.2847).
To try to provide further insight, titration of [(TMPP)FeIII−O−CuII(tmpa)]+ with small amounts of a NO(g) solution did not lead to the mass spectrometric detection of a mono-NO adduct. Mass spectra always resulted in the presence of the bis-NO adduct, the “intermediate” (Scheme 3) independent of the volume of NO(g) solution added. This is in agreement with our kinetic studies (vide supra), where we observed that the mono-NO adduct is prone to irreversibly bind the second NO molecule.
Theory
DFT calculations confirm the proposed nature of the observed intermediates and are in agreement with the kinetic and thermodynamic parameters experimentally obtained for the first and second reaction steps (Scheme 3). The corresponding DFT derived reaction mechanism that takes place on multiple-spin potential energy surfaces is visualized in Scheme 4. We should note that BP86/6-31G(d) incorrectly predicts intermediate spin state (IS) for [(TMPP)FeIII−O−CuII(tmpa)]+ as the ground state, whereas OLYP/6-311+G-(d,p) results in the correct high-spin state (HS) for the starting complex (Scheme 4). Nevertheless, both methods give a similar trend for the entire reaction pathway.
Scheme 4.
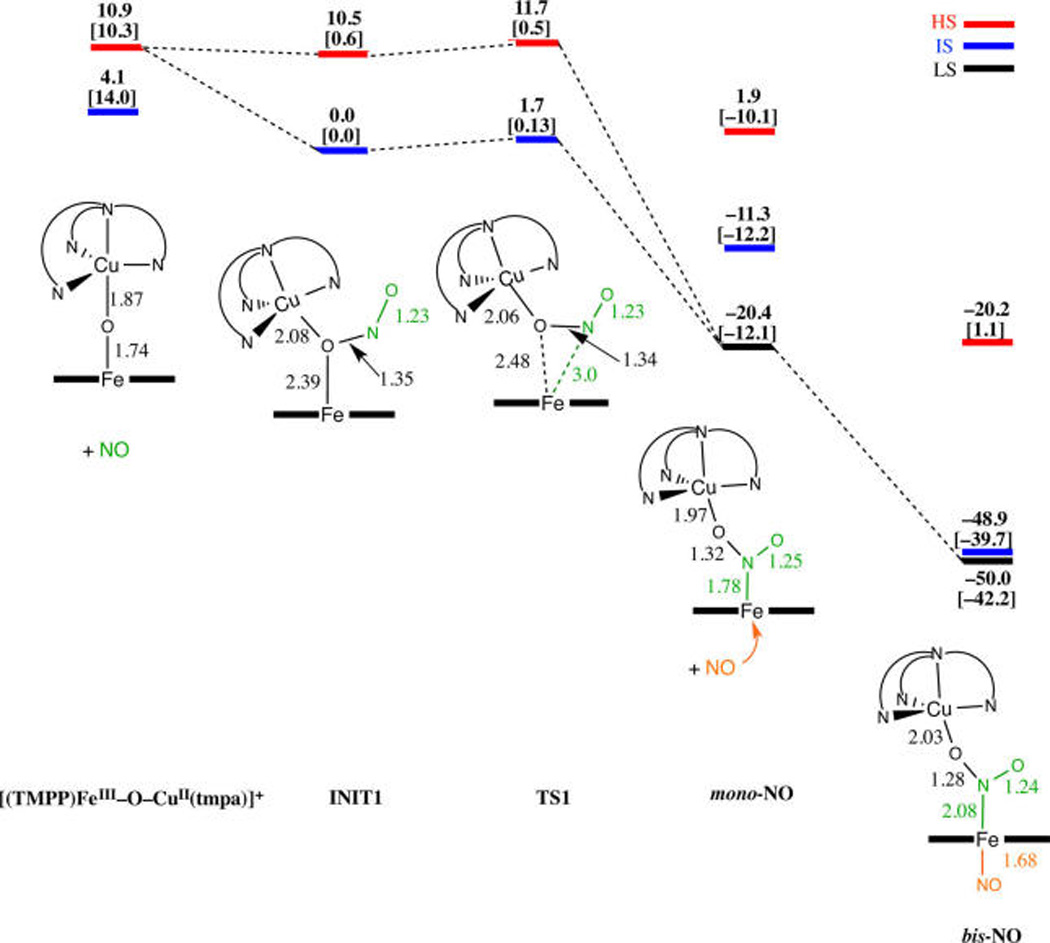
Schematic Calculated Energy Profile for [(TMPP)FeIII−O−CuII(tmpa)]+ Reaction with NO(g)a
a{ΔE + ZPE in kcal mol−1 including solvent correction at both the BP86/6-31G(d) level and OLYP/6-311+G(d,p) level (given in brackets)}. Selected bond lengths are in Å; red is high spin (HS), blue is intermediate spin (IS), and black is low spin (LS) state potential energy surfaces.
The results suggest that generation of the mono-NO adduct requires the formation of a three-membered O−Fe−N chelate ring in a corresponding transition state (TS1 in Scheme 4). This predominantly requires bond formation between Fe and the nitrogen atom from NO(g), accompanied to a smaller extent by weakening of the Fe-O bond in the oxo bridge (bond elongation from 2.39 to 2.48 Å). This explains the low activation enthalpy (24 ± 3 kJ/mol) and negative activation entropy experimentally obtained for the first reaction step (Table 3). After the formation of TS1, the Fe−O−Cu bridge breaks completely giving the mono-NO adduct. Based on the fact that the SOMO of this species is predominantly localized on the Fe-porphyrin moiety (Figure S18), we can suggest that binding of the first NO(g) is accompanied by electron transfer from NO(g) to the heme-iron center. Thus, the mono-NO adduct probably already has a character of the Fe(II)-nitrite species bridged to Cu(II). As expected, based on the principle of the microscopic reversibility, the back reaction characterized by a negative activation entropy (Table 3), because on going from the mono-NO adduct to TS1 (Scheme 4) bond formation between Fe and the bridging O atom is required. Importantly, this mono-NO adduct resembles the structure of an N-bound nitrite ferrous species characterized by resonance Raman spectroscopy in the binuclear heme a3/CuB active site of ba3-CcO.35
After formation of the mono-NO adduct, the reaction proceeds virtually without any barrier, since there is no significant bond breaking required for the formation of bis-NO adduct. Namely, directly from the mono-NO adduct, the bis-NO adduct, “intermediate”, is generated as a thermodynamic sink (Scheme 4). This is again perfectly in agreement with the experimental data that demonstrate the irreversible character of this reaction step (Scheme 3 and Figure 8 (right)) and negligible activation barrier (Table 3). A strong NO(g) binding affinity by the mono-NO adduct (here, actually the ferrous N-bound nitrite species) for the incoming second NO molecule can be explained by its five-coordinate ferrous character. Both in mono- and bis-NO adducts, the N-O bond lengths within the NO2-moiety are typical for a bridging nitrite coordination,29 further supporting the view that electron transfer, i.e., NO oxidation, proceeded during the course of the first reaction step. The calculated Fe−Nnitrite bond length in this “intermediate”, the bis-NO adduct (Scheme 4 and Figure S19), is longer than reported for [(TMPP)FeIII(NO2)(NO)],30 and the Fe−NNO bond length is similar to that in (TPP)-FeII(NO),31 which is indicative of the ferrous character of the Fe center in the “intermediate”. The computed spin densities on the iron center (δ = 1.2) and NO (δ = −0.19) are in agreement with those generally predicted by previous calculations32 for low-spin six-coordinate ferrous-nitrosyl species. Also, both DFT methods applied here indicate that bis-NO adduct has low-spin ground state.
The elongated Fe−Nnitrite bond facilitates the final reaction step, which results in the dissociation of the binuclear adduct to give mononuclear complexes, [(tmpa)CuII(NO2)]+ and (TMPP)FeII(NO) (Figures S20 and S21). However, a corresponding transition state to describe this process could not be located, and therefore this step was not analyzed. To do so likely would require explicit inclusion of solvent molecules, which suggests a solvent-assisted mechanism is involved in this Fe−Nnitrite bond cleavage step.
CONCLUDING REMARKS AND SUMMARY
The one-electron oxidation of nitric oxide is a vital component of biological control of cellular NO(g) concentrations, this molecule being a critical signaling agent. The product, nitrite ion, resides as a cellular storage pool for regeneration of NO(g) as needed, via NO2− binding to heme centers and subsequent reduction. The active site of CcO is where NO(g) and nitrite redox interconversion occurs. This study addresses such critical reactivity at the molecular level by detailed structural and mechanistic studies on synthetic models mediating NO(g) oxidase reaction. The following are the major findings, conclusions, or comments related to this work:
Heme/Cu compounds, which are µ-oxo heme-FeIII−O−CuII(L) constructs, with metal ions in their typical higher oxidation states serve as excellent starting points for the study of NO oxidation. Here, two new X-ray structures are added to library of such compounds, and they are compared to previous members. [(F8)FeIII−O−CuII(MePY2)]+ with its tridentate chelate for copper(II) has a very bent µ-oxo moiety (∠Fe−O−Cu = 142.48°), while for [(TMPP)FeIII−O−CuII(tmpa)]+, this fragment is near-linear (∠Fe−O−Cu = 173.6°).
A notable structural feature, for such compounds where only the porphyrinate identity varies, is that [(F8)FeIII−O−CuII(tmpa)]+ exhibits a square pyramidal CuII-coordination, while for [(TMPP)FeIII−O−CuII(tmpa)]+, the tmpa-Cu N4O-ligation occurs within a trigonal bipyramidal geometry. Porphryinate o-fluorine substituents of meso-phenyl groups for F8 are seen to be responsible for this deviation from the normal TBP geometry generally seen for [(tmpa)CuII(X)]n+ complexes.
In the overall reaction where a µ-oxo heme-FeIII−O−CuII(L) complex reacts with two NO molecules (but only one is accountable for the redox chemistry), forming cupric nitrite plus ferrous-heme nitrosyl complexes, the first NO molecule (reversibly) attacks the bridging oxo atom, in a very fast reaction (k1(on) = 6053 ± 186 M−1 s−1 (−60 °C). This study was carried out for the chemistry with [(TMPP)FeIII−O−CuII(tmpa)]+, which was amenable to our interrogation by various spectroscopies, low-temperature stopped-flow kinetics, and DFT calculations and analysis.
This NO(g) attack is accompanied by electron transfer (formally from NO(g) to the heme), and based on our DFT calculations, a “triangular” structure at iron develops wherein both the original µ-oxo atom and the NO(g)-derived N-atom bind iron in one of the transition states (cf. Scheme 4, TS1).
In a downhill process, the NO2− ligates to Fe(II) as a nitro ligand, i.e., N-bound, with one of its O atoms (that derived from the µ-oxo atom) coordinated and thus bridged to the cupric center; this is the mono-NO adduct, Scheme 4. As mentioned in the discussion, strong credence is given to our conclusion about the structure of the mono-NO adduct; such a N-bound nitrite to iron(II) structure was just recently detected for the ba3-CcO33. This is the first description of a nitrite ion binding to this enzyme center, where the importance of this finding relates to the CcO nitrite reductase function. We note that in our previously published CcO nitrite reductase model system,12 we also proposed that nitrite N-binding to the reduced heme was key to reaction progress. So, for both chemical and biochemical heme/Cu-mediated nitrite reductase and NO oxidase chemistry (the latter as in this report; Scheme 4), N-atom binding to a ferrous heme along with O atom coordination to the cupric ion are key.
Then, the second NO molecule irreversibly attacks (k2(on) = 706 ± 20 at −60 °C) the open face of the heme in the mono-NO adduct to give the bis-NO adduct, which was observed by UV–vis spectroscopy (even at −20 °C; λmax = 433 nm) and confirmed by using CSI-MS at −60 °C.
This bis-NO adduct “intermediate” then undergoes dissociation in a first-order process (kdissoc. = 6.7 × 10⁻³ s−1; −20 °C) to release the finally observed mononuclear adducts, the cupric-nitrite and ferrous heme nitrosyl complexes.
Strong evidence for our conclusion that the last step is a dissociation and that our formulation and DFT structural characterization of the “intermediate” is correct comes from the fact that cooling the products, consisting of a 1:1 mixture of (TMPP)FeII(NO) plus [(tmpa)-CuII(NO2)]+, results in reformation of the “intermediate”, where the nitrite bound to copper ion coordinates and thus forms a bridge to the ferrous hemenitrosyl complex (vide supra). Another piece of evidence supporting the formulation of the “intermediate” is its EPR spectrum, the analysis of which indicates the presence of a six-coordinated ferrous-heme nitrosyl linked to an EPR active cupric species in a TBP coordination environment.
Aside from our proposed mechanism (Schemes 3 and 4), we also considered other possible/alternative pathways for reaction of the first NO molecule with [(TMPP)-FeIII−O−CuII(tmpa)]+, involving initial binding of the NO(g) to either the cupric center or the open face of the ferric heme (i.e., trans to the bridging oxo moiety). Both of these possibilities fail to satisfactorily describe and match our spectroscopic data and DFT calculations. The former event is a nonproductive pathway as it requires breakage of the newly formed Cu(II)−NO bond in order to generate an O-bound nitrite to the cupric center in the mono-NO adduct. In the latter alternative, binding of the first NO(g) to the five-coordinate high-spin heme would result in a dramatic spin change, which therefore would be a quite slow reaction when forming a six-coordinate low-spin heme; this goes against the observed kinetics which reveal a fast process. In addition, based on our experimental data and DFT calculations, the second step (involving the addition of second NO(g)) is an activationless process; if the first NO(g) goes to the heme open face, the second NO(g) would now involve its attack on the oxo group followed by an Fe−O (nitrite) bond breaking, which is unlikely to be activation-less.
Another point of discussion is the relevance of the present study to the process of reductive nitrosylation of heme-FeIII complexes, a widely known and utilized method to generate either synthetic or biological ferrous heme-nitrosyl compounds (i.e., {FeNO}7), wherein NO oxidation to nitrite is involved.34 The most common pathway known for reductive nitrosylation is thought to function via initial coordination of NO(g) to a ferric site forming a heme-FeIII(NO) species, perhaps better formulated as a heme FeII(NO+) complex. This is followed by nucleophilic attack of OH− or H2O at the coordinated nitrosyl and then dissociation of the nitrosylated nucleophile, NO2−, from the metal center resulting in formation of reduced metal center which further reacts with a second molecule of NO to form a stable ferrous heme-FeII(NO) product.35 However, as Ford describes,34b an alternative pathway could involve attack of NO(g) at “a nucleophile coordinated to the oxidizing metal center”, here the µ-oxo moiety of the heme-FeIII−O−CuII(L) framework. The µ-oxo group acts as an inner-sphere nucleophile assisting formation of the first reaction intermediate, which bears the heme-Fe−(NO2)−Cu component. Coordination to the neighboring cupric center would provide further stability for the bridged nitrite species toward addition of the second NO(g) (at low temperatures, below −20 °C) generating the bis-NO adduct, aka the “intermediate”. A temperature increase results in the final cleavage of the nitrite bridge. Thus, this study provides evidence for formation of a six-coordinate ferrous heme nitrosyl compound during a reductive nitrosylation process.
It may be viewed that the family of µ-oxo heme-FeIII−O−CuII(L) complexes studied here for their NO oxidase chemistry are not species which are present in CcO turnover intermediates or resting-state structures. However, these µ-oxo compounds should be thought of as representatives of heme-FeIII-OH⋯CuII enzyme species, i.e., just different by one proton from our synthetic complexes. New computational studies36 in fact suggest that a heme-FeIII−OH⋯CuII or heme-FeIII−(µ-OH)−CuII complex can or does form during CcO enzymatic function. We suggest that such an entity can be responsible for NO oxidase chemistry when in its protein environment. NO(g) attacks the hydroxo-group, giving a six-coordinate nitro ferrous heme (i.e., with N-ligated nitrite and proximal His ligand), which may be stabilized by nitrite interaction with the neighboring cupric ion, as in our synthetic compound.
In conclusion, the present report provides many molecular level details pertaining to metal/nitrogen-oxide chemistries, in particular showing how nitric oxide and/or nitrite can undergo atom-transfer redox chemistry, when binding to hemes (and copper) during NO oxidation and/or nitrite reductive processes.
EXPERIMENTAL SECTION
General Methods
All reagents and solvents were of commercially available grade, unless otherwise noted. Acetone was distilled over Drierite under argon atmosphere and kept over 3 Å molecular sieves prior to use. Tetrahydrofuran (THF), 2-methyltetrahydrofuran (MeTHF) (inhibitor free, 673277), and hexanes were purchased from Sigma-Aldrich and dried by distillation under argon from sodium/benzophenone. Pentane and acetonitrile (MeCN) were distilled over calcium hydride under argon. Toluene was used after passing through a 60 cm-long column of activated alumina (Innovative Technologies) under argon. Air- and moisture-sensitive compounds were prepared and handled under an argon atmosphere using standard Schlenk techniques or in a Vacuum Atmospheres OMNI-Lab inert atmosphere (<1 ppm of O2 and H2O) glovebox filled with nitrogen. O2 gas was dried by passing through a short column of supported P4O10 (Aquasorb, Mallinckrodt). NO gas was obtained from Matheson Gases and purified following methods previously described in the literature.37 This purified NO(g) was transferred and stored in a 50 mL Schlenk flask capped with a rubber septum. Addition of NO gas to metal complex solutions was effected by transfer via a three-way long syringe needle. Deoxygenation of solvents was effected by either repeated freeze/pump/thaw cycles or bubbling with argon for 45–60 min.
Infrared (IR) spectra were obtained using a Thermo Scientific Nicolet Nexus 670 Fourier transform IR (FT-IR) spectrophotometer. Bench-top low-temperature UV–vis spectra were recorded with a Cary-50 Bio spectrophotometer equipped with a Unisoku USP-203A cryostat using a 2 mm modified Schlenk cuvette. Electron paramagnetic resonance (EPR) measurements were performed on an X-band Bruker EMX CW EPR spectrometer (~9.4 GHz) controlled with a Bruker ER 041 XG microwave bridge, using 5 mm quartz EPR tubes. EPR spectral simulations were carried out using EasySpin v. 4.5.5 on a Mac (running OS X). Elemental analysis was accomplished at Columbia Analytical Services (Tucson, AZ). Single-crystal X-ray data were collected using either an Xcalibur3 or a SuperNova (Agilent Technologies) diffractometer at the X-ray diffraction facility of the Johns Hopkins University. Cryo-spray ionization mass spectrometry (CSI-MS) spectra were collected by a Bruker maXis 4G coupled with a Bruker cryospray unit. Low-temperature stopped-flow experiments were performed with a Biologic cryo SFM-4000 4-syringe stopped-flow, combined with a 150 W xenon lamp and a J&M TIDAS diode array detector (200–724 nm, integration time 0.5 ms). All reactions were performed in acetone unless specified otherwise.
The compounds (F8)FeII,13b,38, (TMPP)FeII,12, [(tmpa)-CuI(MeCN)][B(C6F5)4],11,39 [(MePY2)CuI(MeCN)] [B(C6F5)4],13b [(AN)CuI][B(C6F5)4],40 [(AN)CuII (NO2)](SO3CF3), and (F8)-FeIII(NO)37b,41 were synthesized and characterized following literature methods. (TMPP)FeIII(Cl) was purchased from TriPorTech (Germany). The µ-oxo complexes, [(F8)FeIII−O−CuII (tmpa)]-[B(C6F5)4],11 [(F8)FeIII −O−CuII(AN)][B(C6F5)4],16 [(F8)FeIII−O−CuII (MePY2)][B(C6F5)4],13b and [(TMPP)FeIII−O−CuII(tmpa)]-[B(C6F5)4]12 were synthesized by bubbling dry dioxygen through a one-to-one mixture of the corresponding reduced heme and copper mononuclear complexes as we previously reported. All these µ-oxo compounds are very moisture sensitive, but otherwise stable, and are soluble in a variety of solvents.
Synthesis of [(TMPP)FeIII(THF)2]SbF6·THF
The current synthesis method is a slightly modified version of our method reported earlier for the synthesis of [(F8)FeIII(THF)2]SbF6.41 In the glovebox, to a solution of (TMPP)FeIII (Cl) (292 mg, 0.354 mmol) in THF (50 mL) was added AgSbF6 (128 mg, 0.373 mmol). The reaction mixture was allowed to stir for 2 h under reduced light at RT. The solution was then filtered to remove AgCl, and addition of deoxygenated pentane (100 mL) resulted in precipitation. The supernatant was decanted, and the compound obtained was recrystallized twice from THF/pentane affording very dark-red crystals suitable for X-ray structure determination (Figure S22). After vacuum drying, the crystals weighted 340 mg (78% yield). Anal. calcd for C60H60F6FeN4O7Sb: C, 58.08; H, 4.87; N, 4.52. Found: C, 57.98; H, 4.85; N, 4.56. UV–vis [λmax, nm (εmax, M−1 cm−1)]: 401 (162,100), 533 (17,300) and 679 (3300) in acetone and 404 (161,200), 532 (16,100) and 698 (4600) in MeCN (Figure S23). FT-IR (solid): ν(SbF6) = 655 cm−1. EPR: g⊥ = 5.56, g‖ = 1.99 in THF/MeTHF (1:4) at 12 K (Figure S24).
Reactions of µ-oxo Complexes with NO(g)
Reaction of [(F8)FeIII−O−CuII(AN)][B(C6F5)4] with NO(g)
In a 10 mL Schlenk flask, (F8)FeII·H2O (16.6 mg, 0.020 mmol) and [(AN)CuI][B(C6F5)4] (18.6 mg, 0.020 mmol) were dissolved in MeTHF (4 mL). Dry dioxygen was then bubbled through the solution for 2 min with the color turning from dark red to dark orange. The solvent was removed under vacuum. The resulting solid product was then dissolved in 10 mL deoxygenated acetone. UV–vis: [λmax, nm (εmax, M−1 cm−1)]: 439 (141,200) and 555 (19,700) in acetone. Samples for UV–vis monitoring were prepared by diluting 25 µL of the stock solution with acetone to 5 mL that was then transferred to a 10 mm modified Schlenk cuvette. The spectra were recorded upon bubbling of 1 mL of NO(g) directly into the solution at RT (Figure S2). Formation of (F8)FeII (NO) was confirmed by examination of the IR spectrum of the solid product (νNO = 1688 cm−1). An EPR spectrum of the reaction mixture was recorded in MeCN/toluene (1:1) at 20 K revealing a mixture of a cupric and ferrous heme nitrosyl compounds. An EPR spectrum of an authentic sample of a 1:1 mixture of (F8)FeII (NO) and [(AN)CuII (NO2)](CF3SO3) was also recorded for comparison (Figure S3). The production of significant amount of nitrite ion (50–100%) was detected by semiquantitative QUANTOFIX nitrite test strips as previously described.11
Reaction of [(F8)FeIII−O−CuII(tmpa)][B(C6F5)4] with NO(g)
In the glovebox, (F8)FeII·H2O (16.6 mg, 0.020 mmol) and [(tmpa)-CuI(MeCN)][B(C6F5)4] (21.5 mg, 0.020 mmol) were dissolved in MeTHF (4 mL) in a 10 mL Schlenk flask. Dry dioxygen was bubbled through this solution affording a color change from dark red to dark orange. After removal of the solvent under vacuum, the product was dissolved in 10 mL deoxygenated acetone. UV–vis samples for low-temperature studies were prepared by diluting 38 µL of the stock solution with acetone to 1 mL that was then transferred to a 2 mm modified Schlenk cuvette. The spectra were recorded upon bubbling of 1 mL of NO(g) directly into the solution at −40 °C(Figure 4a).
Reaction of [(F8)FeIII−O−CuII(MePY2)][B(C6F5)4] with NO(g)
In the glovebox, solution of (F8)FeII·H2O (16.6 mg, 0.020 mmol) and [(MePY2)CuI(MeCN)][B(C6F5)4] (20.5 mg, 0.020 mmol) in MeTHF (4 mL) was prepared in a 10 mL Schlenk flask. Bubbling of dry dioxygen through the solution for 2 min resulted in the color turning from dark red to dark orange. The solvent was removed under vacuum, and the solid product was then dissolved in 10 mL deoxygenated acetone. UV–vis: [λmax, nm (εmax, M−1cm−1)]: 438 (114,300) and 555 (18,600) in acetone. Samples for UV–vis monitoring were prepared by diluting 25 µL of the stock solution with acetone to 1 mL that was then transferred to a 2 mm modified Schlenk cuvette. The spectra were recorded upon bubbling of 1 mL of NO(g) directly into the solution at −40 °C (Figure 4b). The IR spectrum of the solid product (νNO = 1688 cm−1) directly indicated formation of (F8)FeII(NO). An EPR spectrum of the reaction mixture prepared at RT and redissolved in acetone was recorded at 12 K indicating a mixture of a cupric and ferrous heme nitrosyl compounds (Figure S4). The presence of significant amount of nitrite ion (50–100%) was confirmed by semiquantitative QUANTOFIX nitrite test strips as previously described.11
Reaction of [(TMPP)FeIII−O−CuII(tmpa)][B(C6F5)4] with NO(g)
To a 4 mL MeTHF solution of (TMPP)FeII·1.5H2O (16.3 mg, 0.020 mmol) in a 10 mL Schlenk flask, [(tmpa)CuI(MeCN)][B(C6F5)4] (21.5 mg, 0.020 mmol) was added. The solution was then bubbled with dry dioxygen for 2 min resulting an immediate color change from dark red to dark green. The solvent was removed under vacuum. The resulting solid product was then dissolved in 10 mL deoxygenated acetone. UV–vis: [λmax, nm (εmax, M−1 cm−1)]: 443 (252,000), 564 (17,300) and 605 (14,700) in acetone. Samples for UV–vis monitoring were prepared by diluting 25 µL of the stock solution with acetone to 1 mL that was then transferred to a 2 mm modified Schlenk cuvette. Spectra were recorded upon bubbling of 1 mL of NO(g) directly into the solution at RT (Figure S5). The reaction was also followed at −20 °C, and upon addition of 1 mL of NO(g) to the cold solution, immediate formation of a new intermediate was detected. UV–vis: [λmax, nm (εmax, M−1cm−1)]: 433 (246,000), 545 (15,400) and 582 (9,100) in acetone at −20 °C (Figure 5). Clean isosbestic conversion of this intermediate to the final products (TMPP)FeII (NO) and [(tmpa)CuII (NO2)]+ (not detectable due to the small extinction coefficient relative to the heme) was obtained within 12 min as monitored by UV–vis spectroscopy. The reaction was repeated at different temperatures, 0, −10, −15, −20, −25, −30, and −40 °C. First-order rate constants for conversion of the intermediate to the final products were obtained by observing the disappearance of the Soret band at 433 nm and/or appearance of the 408 nm bands, and a linear Eyring plot was then derived from the data (Figure S8). The IR spectrum of the solid product (νNO = 1677 cm−1) directly indicates formation of (TMPP)FeII(NO). EPR samples were prepared by dissolving of the solid products of the reaction at RT in acetone or MeTHF. The spectra were recorded at 12 K revealing a mixture of a cupric and ferrous heme nitrosyl compounds (Figure S6). An EPR sample of [(TMPP)FeIII−O−CuII(tmpa)][B(C6F5)4] in MeTHF was also prepared and cooled to −80 °C (dry ice-acetone bath). Then 1 mL of NO(g) was directly bubbled into this cold solution, and the sample was frozen in liquid nitrogen. The EPR spectrum was recorded at 12 K again suggesting the presence of a cupric compound and a ferrous heme nitrosyl species (Figures S10 and S11b) but with a different hyperfine coupling than the one observed in the spectrum of the products mixture (Figures S6 and S11a). The generation of significant amount of nitrite ion (50–100%) as a final product was also confirmed by utilization of semiquantitative QUANTOFIX nitrite test strips, as previously described.11 (Note: When extracting nitrite ion from reaction products to the aqueous layer, (TMPP)FeII (NO) also generates 1 equiv of additional nitrite ion. This was also taken into account in the semiquantitative nitrite analysis).
In situ Generation of [(TMPP)FeIII(NO)(NO2)]
A 1 mL acetone solution of [(TMPP)FeIII (THF)2]SbF6 (50 µM) was placed in a 2 mm Schlenk cuvette under nitrogen. The sample was cooled to −20 °C, and an initial spectrum was recorded. One mL of NO(g) was directly bubbled into the cold solution resulting in a large UV–vis change assigned to the formation of [(TMPP)FeII(NO)]SbF6. Then 10 equiv of tetrabutylammonium nitrite, (nBu)4N(NO2), were added forming a new species formulated as [(TMPP)FeIII(NO2)(NO)].30 UV–vis: [λmax, nm (εmax, M−1 cm−1)]: 433 (281,000), 545 (19,200), and 581 (9500) in acetone at −20 °C (Figure S7). For comparison, we also prepared [(TMPP)FeIII(NO2)1 or 2] in situ by reaction of 10 equiv (nBu)4N(NO2) with [(TMPP)FeIII(THF)2]SbF6 at −20 °C; the result led to a species with a UV–vis spectrum (λmax = 423 nm) which is very different from [(TMPP)FeIII(NO)(NO2)] (λmax = 433 nm), so the excess nitrite does not replace the bound nitrosyl.
In situ Generation of [(NO)(TMPP)FeII−(NO2)−CuII(tmpa)]-[B(C6F5)4]
In the glovebox, a 1 mL MeTHF solution of [(TMPP)-FeIII−O−CuII(tmpa)][B(C6F5)4] (50 µM) was placed in a 2 mm Schlenk cuvette, and an initial spectrum was recorded at RT. Then, 1 mL of NO(g) was directly bubbled into the solution resulting in the formation of final products, the ferrous heme nitrosyl, (TMPP)-FeII(NO), and cupric nitrite, [(tmpa)CuII(NO2)][B(C6F5)4]. The excess NO(g) was removed from the reaction solution by application of vacuum/argon purge cycles. This sample was then cooled to −125 °C, and UV–vis spectrum of this cold solution reveals generation of a new species formulated as [(NO)(TMPP)FeII−(NO2)−CuII(tmpa)]-[B(C6F5)4] (λmax = 434, 545, and 582 in MeTHF at −125 °C, Figure S9). Warming up to RT resulted the reformation of initial spectrum of the final products. Note: If excess NO(g) is not removed from the reaction solution, then upon cooling, the heme ferrous nitrosyl (TMPP)FeII(NO) reversibly reacts with an additional NO(g) to form a dinitrosyl species (λmax = 423, 544, and 582 in MeTHF at −125 °C), as previously described for related complexes.41,42 Generation of the dinitrosyl complex was also confirmed through bubbling excess NO(g) into the ferrous heme (TMPP)FeII solution in MeTHF at RT followed by cooling the sample to −125 °C.
Crystallographic Studies
Crystallization of µ-oxo Complexes
[(F8)FeIII−O−CuII(MePY2)][B(C6F5)4] was prepared as described earlier by bubbling dry dioxygen through a 1:1 mixture of (F8)FeII and [(MePY2)CuI(MeCN)][B(C6F5)4]. Diffraction quality crystals of the complex were grown by slow liquid diffusion in 5 mm glass tubes using MeTHF and pentane at RT in the glovebox.
[(TMPP)FeIII−O−CuII(tmpa)][B(C6F5)4] was prepared as we previously reported.12 In the glovebox, suitable X-ray-quality crystals were obtained by layering hexanes onto a solution of the µ-oxo complex in toluene in 5 mm glass tubes at RT.
X-ray Structure Determinations
For crystals of [(TMPP)-FeIII(THF)2]SbF6 and [(TMPP)FeIII−O−CuII(tmpa)][B(C6F5)4], all reflection intensities were measured at 100(2) K using a SuperNova diffractometer (equipped with Atlas detector) with Cu Kα radiation (mirror optics, λ = 1.54178 Å), while all reflection data for [(F8)FeIII−O−CuII (MePY2)][B(C6F5)4] were collected at 110(2) K using a KM4/Xcalibur (detector: Sapphire3) with enhance graphite-mono-chromated Mo Kα radiation (λ = 0.71073 Å) under the program CrysAlisPro (Version 1.171.36.24, Agilent Technologies, 2012). The structures were solved with the program SHELXS-97, SHELXS-2013, or SHELXS-201443 and were refined on F2 with SHELXL-97, SHELXL-2013, or SHELXL-2014.43 Analytical numeric absorption correction based on a multifaceted crystal model was applied using CrysAlisPro. The temperature of the data collection was controlled using the system Cryojet (manufactured by Oxford Instruments). The H atoms were placed at calculated positions using the instructions AFIX 23, AFIX 43, or AFIX 137 with isotropic displacement parameters having values 1.2 or 1.5 times Ueq of the attached C atoms.
The structure of [(TMPP)FeIII(THF)2]SbF6 is mostly ordered. The SbF6− counterion is disordered over two orientations, and the occupancy factor of the major component refines to 0.9303(18). The crystal that was mounted on the diffractometer was racemically twinned, and the BASF refines to 0.246(3). The structure of [(F8)FeIII−O−CuII(MePY2)][B(C6F5)4] is also mostly ordered. One of the four difluorophenyl groups is found to be disordered over two orientations. The occupancy factor of the major component of the disorder refines to 0.576(3). The crystal lattice also includes some very disordered and/or not fully occupied solvent molecule (most likely MeTHF). Their contribution has been taken out in the final refinement (SQUEEZE details are provided in the CIF file).
The structure of [(TMPP)FeIII−O−CuII(tmpa)][B(C6F5)4] is partly disordered. The CuII(tmpa) is disordered over two orientations, and the occupancy factor of the major component refines to 0.505(2). The crystal lattice also contains a significant amount of lattice disordered toluene molecules. The disorder has been resolved for two solvent molecules (found in the asymmetric unit). One solvent molecule is found at sites of inversion symmetry and thus must be disordered over two orientations, and each component of the disorder must have the occupancy of 0.5. The disorder of the other solvent molecule is not constrained by any symmetry operations, and this molecule is disordered over two orientations. The occupancy factor of the major component refines to 0.789(11). The crystal lattice also contains some other very disordered toluene molecules, for which their contributions had been taken out using the program SQUEEZE for the final refinement. All details of the SQUEEZE refinement are provided in the final CIF file.
[(TMPP)FeIII(THF)2]SbF6
Moiety formula: C56H52FeN4O6, SbF6, C4H8O, formula weight 1240.72, dark-red irregular block, 0.28 × 0.23 × 0.17 mm3, triclinic, P1 (no. 1), a = 11.0724(3), b = 11.5867(3), c = 12.3676(4) Å, α = 110.731(3), β = 105.499(3), γ = 99.599(2)°, V = 1,368.53(7) Å3, Z = 1, Dx = 1.505 g cm−3, µ = 6.704 mm−1, Tmin−Tmax: 0.298–0.487. 16,389 reflections up to a resolution of (sin θ/λ)max = 0.62 Å−1. 8,891 reflections were unique (Rint = 0.0175), of which 8854 were observed [I > 2σ(I)]. 740 parameters were refined using 24 restraints. R1/wR2 [I > 2σ(I)]: 0.0212/0.0556. R1/wR2 [all refl.]: 0.0213/0.0556. S = 1.029. Residual electron density was found between −0.43 and 0.61 e− Å−3.
[(F8)FeIII−O−CuII (MePY2)][B(C6F5)4]
Moiety formula: C59H39CuF8FeN7O, C24BF20, formula weight 1812.41, dark-purple block, 0.43 × 0.27 × 0.17 mm3, triclinic, P-1 (no. 2), a = 9.7091(2), b = 19.3628(3), c = 21.9984(4) Å, α = 71.8792(17), β = 82.6473(17), γ = 83.5370(17)°, V = 3,886.53(13) Å3, Z = 2, Dx = 1.549 g cm−3, µ = 0.580 mm−1, Tmin − Tmax: 0.831−0.918. 54,873 reflections up to a resolution of (sin θ/λ)max = 0.65 Å−1, 17,874 reflections were unique (Rint = 0.0605), of which 14,985 were observed [I > 2σ(I)]. 1167 parameters were refined using 334 restraints. R1/wR2 [I > 2σ(I)]: 0.0443/0.1200. R1/wR2 [all refl.]: 0.0536/0.1260. S = 1.049. Residual electron density was found between −0.64 and 0.73 e− Å−3.
[(TMPP)FeIII−O−CuII(tmpa)][B(C6F5)4]
Moiety formula: 2-(C66H54CuFeN8O5), 2(C24BF20), 3(C7H8), formula weight 3951.63, dark-purple block, 0.39 × 0.32 × 0.26 mm3, triclinic, P-1 (no. 2), a = 13.4443(2), b = 16.3732(2), c = 25.7041(4) Å, α = 91.5300(12), β = 97.5727(14), γ = 112.0953(15)°, V = 5,178.93(13) Å3, Z = 1, Dx = 1.267 g cm−3, µ = 2.142 mm−1, Tmin − Tmax: 0.552–0.680. 61,250 reflections up to a resolution of (sin θ/λ)max = 0.62 Å−1. Of these, 20,331 reflections were unique (Rint = 0.0162), of which 19,196 were observed [I > 2σ(I)]. 1544 parameters were refined using 1057 restraints. R1/wR2 [I > 2σ(I)]: 0.0361/0.1047. R1/wR2 [all refl.]: 0.0377/0.1064. S = 1.046. Residual electron density was found between −0.35 and 0.40 e− Å−3.
Cryo-Spray Ionization Mass Spectrometry Measurements (CSI-MS)
CSI-MS measurements were performed on a UHR-TOF Bruker Daltonik (Bremen, Germany) maXis 4G, an ESI-TOF MS capable of resolution of at least 40,000 fwhm, which was coupled to a Bruker Daltonik Cryo-spray unit. Detection was in positive-ion mode, and the source voltage was 4.5 kV. The flow rates were 250 µL/hour. The drying gas (N2), to aid solvent removal, was held at −55 °C, and the spray gas was held at −60 °C.
CSI-MS samples were prepared in a glovebox by dissolving [(TMPP)FeIII−O−CuII(tmpa)][B(C6F5)4] in dry acetone. The complex solution was taken out in a Schlenk tube equipped with a rubber septum. Samples for measurement were taken out directly from this Schlenk tube. The intermediate observed at 433 nm, at −20 °C or below, with two NO molecules added to the µ-oxo complex (thus, a bis-NO adduct) was prepared by bubbling NO(g) directly through the cooled (−60 °C) complex solution. NO gas was purified as described for the stopped-flow measurements (vide infra).
The machine was calibrated prior to every experiment via direct infusion of the Agilent ESI-TOF low concentration tuning mixture, which provided an m/z range of singly charged peaks up to 2700 Da in both ion modes.
Low-Temperature Stopped-Flow Measurements
All measurements were performed in dry acetone as solvent. NO(g) solutions were prepared by bubbling pure NO gas through acetone (from drybox, Schlenk tube equipped with septum). Usually 15 mL of acetone was bubbled for 30 min. NO gas was purified along to literature known procedures (saturated potassium hydroxide, column of Ascarite, column of P2O5).44 Complex solutions were prepared in the drybox and brought outside by using Hamilton gastight syringes equipped with 3-way valves. The concentration of the saturated NO(g) solution in acetone was determined by a NO-sensitive electrode (4.5 mM).
Prior to use, the stopped-flow system was flushed two times with nitrogen and one time with dry solvent. For the measurements only two syringes were used. The complex and NO(g) solutions were mixed in a 1:1 ratio with a total flow rate of 6.00 mL/s, resulting in a total volume of 202 µL. For cooling a Huber C-905 cryostat filled with silicon oil was used.
Kinetic measurements were performed at four different temperatures and with at least four different NO(g) concentrations. For the different NO(g) concentrations, dilutions were performed by using a Hamilton gastight syringe equipped with a 3-way valve. NO(g) solution and dry acetone were kept in Schlenk flasks equipped with septa, and the required amounts of NO(g) and acetone were taken out from the flasks with the Hamilton gastight syringe. Spectra collected were analyzed by SpecFit.
Computational Methods
Geometries of all compounds were fully optimized at the BP86 level of theory with a 6-31G(d) basis set using the Gaussian 09 program package. Stationary points were confirmed to be minima or transition states by calculating the normal vibrations within the harmonic approximation. All relative energies are corrected for zero-point vibrational energies (ZPVE). The effect of the solvent (acetone) was included via a PCM model. In order to evaluate values of spin density and relative energies, additional single point calculations were performed at the PCM-OLYP/6-311+G(d,p) level. (For further details and references see Supporting Information).
Supplementary Material
ACKNOWLEDGMENTS
I.K., M.D., and I.I.-B. gratefully acknowledge the support by the intramural grant from University of Erlangen-Nuremberg (Emerging Initiative: Medicinal Redox Inorganic Chemistry). T.E.S. thanks the Leibniz Supercomputing Centre (project h0764/SuperMUC) for allocation of generous amount of computational time. S.H. is grateful to the Johns Hopkins University chemistry department for support through a William Hooper Grafflin Fellowship. Support to K.D.K. from the U.S.A. National Institutes of Health is also acknowledged.
Footnotes
ASSOCIATED CONTENT
Details concerning spectroscopy including UV–vis and EPR, CSI-MS spectral data, Eyring plots, crystallographic details (as CIF files), EPR simulation data, and computational studies (with Cartesian coordinates of the stationary points). The information is available free of charge via the Internet at The Supporting Information is available free of charge on the ACS Publications website at DOI: 10.1021/jacs.5b02174.
The authors declare no competing financial interest.
REFERENCES
- 1.(a) Ignarro LJ. Nitric Oxide as a Communication Signal in Vascular and Neuronal Cells. In: Lancaster J, editor. Nitric Oxide: Principles and Actions. New York: Academic Press, Inc; 1996. p. 111. [Google Scholar]; (b) Pfeiffer S, Mayer B, Hemmens B. Angew. Chem., Int Ed. 1999;38:1715–1731. doi: 10.1002/(SICI)1521-3773(19990614)38:12<1714::AID-ANIE1714>3.0.CO;2-3. [DOI] [PubMed] [Google Scholar]; (c) Ignarro LJ, editor. Nitric Oxide, Biology and Pathobiology. San Diego: Academic Press; 2000. [Google Scholar]; (d) Miranda KM, Espey MG, Jourd’heuil D, Grisham MB, Fukuto JM, Feelisch M, Wink DA. Nitric Oxide. 2000:41–55. [Google Scholar]; (e) Feelisch M, Olson KR. Nitric Oxide. 2013;35:2–4. doi: 10.1016/j.niox.2013.06.004. [DOI] [PubMed] [Google Scholar]
- 2.Lehnert N, Berto TC, Galinato MGI, Goodrich LE. The Role of Heme-Nitrosyls in the Biosynthesis, Transport, Sensing, and Detoxification of Nitric Oxide (NO) in Biological Systems: Enzymes and Model Complexes. In: Kadish KM, Smith K, Guilard R, editors. The Handbook of Porphyrin Science. Vol. 14. Singapore: World Scientific; 2011. pp. 1–247. [Google Scholar]
- 3.Maia LB, Moura JJG. Chem. Rev. 2014;114:5273–5357. doi: 10.1021/cr400518y. [DOI] [PubMed] [Google Scholar]
- 4.(a) Marletta MA. J. Biol. Chem. 1993;268:12231–12234. [PubMed] [Google Scholar]; (b) Stuehr D. J. Biochim. Biophys. Acta. 1999;1411:217–230. doi: 10.1016/s0005-2728(99)00016-x. [DOI] [PubMed] [Google Scholar]; (c) Alderton WK, Cooper CE, Knowles RG. Biochem. J. 2001;357:593–615. doi: 10.1042/0264-6021:3570593. [DOI] [PMC free article] [PubMed] [Google Scholar]; (d) Zhu Y, Silverman RB. Biochemistry. 2008;47:2231–2243. doi: 10.1021/bi7023817. [DOI] [PubMed] [Google Scholar]; (e) Crane BR. Biochem. Soc. Trans. 2008;036:1149–1154. doi: 10.1042/BST0361149. [DOI] [PubMed] [Google Scholar]
- 5.(a) Dezfulian C, Raat N, Shiva S, Gladwin MT. Cardiovasc. Res. 2007;75:327–338. doi: 10.1016/j.cardiores.2007.05.001. [DOI] [PMC free article] [PubMed] [Google Scholar]; (b) Samouilov A, Kuppusamy P, Zweier JL. Arch. Biochem. Biophys. 1998;357:1–7. doi: 10.1006/abbi.1998.0785. [DOI] [PubMed] [Google Scholar]; (c) Gladwin MT, Grubina R, Doyle MP. Acc. Chem. Res. 2009;42:157–167. doi: 10.1021/ar800089j. [DOI] [PubMed] [Google Scholar]; (d) van Faassen EE, Bahrami S, Feelisch M, Hogg N, Kelm M, Kim-Shapiro DB, Kozlov AV, Li H, Lundberg JO, Mason R, Nohl H, Rassaf T, Samouilov A, Slama-Schwok A, Shiva S, Vanin AF, Weitzberg E, Zweier J, Gladwin MT. Med. Res. Rev. 2009;29:683–741. doi: 10.1002/med.20151. [DOI] [PMC free article] [PubMed] [Google Scholar]; (e) Kim-Shapiro DB, Gladwin MT. Nitric Oxide. 2014;38:58–68. doi: 10.1016/j.niox.2013.11.002. [DOI] [PMC free article] [PubMed] [Google Scholar]
- 6.(a) Castello PR, David PS, McClure T, Crook Z, Poyton RQ. Cell Metab. 2006;3:277–287. doi: 10.1016/j.cmet.2006.02.011. [DOI] [PubMed] [Google Scholar]; (b) Feelisch M, Fernandez BO, Bryan NS, Garcia-Saura MF, Bauer S, Whitlock DR, Ford PC, Janero DR, Rodriguez J, Ashrafian HJ. Biol. Chem. 2008;283:33927–33934. doi: 10.1074/jbc.M806654200. [DOI] [PMC free article] [PubMed] [Google Scholar]; (c) Poyton RO, Castello PR, Ball KA, Woo DK, Pan N. Ann. N.Y. Acad. Sci. 2009;1177:48–56. doi: 10.1111/j.1749-6632.2009.05046.x. [DOI] [PubMed] [Google Scholar]; (d) Gupta KJ, Igamberdiev AU. Mitochondrion. 2011;11:537–543. doi: 10.1016/j.mito.2011.03.005. [DOI] [PubMed] [Google Scholar]
- 7.(a) Kim E, Chufán EE, Kamaraj K, Karlin KD. Chem. Rev. 2004;104:1077–1133. doi: 10.1021/cr0206162. [DOI] [PubMed] [Google Scholar]; (b) Yoshikawa S, Shinzawa-Itoh K, Nakashima R, Yaono R, Yamashita E, Inoue N, Yao M, Jei-Fei M, Libeu CP, Mizushima T, Yamaguchi H, Tomizaki T, Tsukihara T. Science. 1998;280:1723–1729. doi: 10.1126/science.280.5370.1723. [DOI] [PubMed] [Google Scholar]
- 8.(a) Torres J, Cooper CE, Wilson MTJ. Biol. Chem. 1998;273:8756–8766. doi: 10.1074/jbc.273.15.8756. [DOI] [PubMed] [Google Scholar]; (b) Sarti P, Giuffre A, Barone MC, Forte E, Mastronicola D, Brunori M. Free Radic. Biol. Med. 2003;34:509–520. doi: 10.1016/s0891-5849(02)01326-6. [DOI] [PubMed] [Google Scholar]; (c) Mason MG, Nicholls P, Wilson MT, Cooper CE. Proc. Natl. Acad. Sci. U. S. A. 2006;103:708–713. doi: 10.1073/pnas.0506562103. [DOI] [PMC free article] [PubMed] [Google Scholar]; (d) Sarti P, Forte E, Mastronicola D, Giuffrè A, Arese M. Biochim. Biophys. Acta. 2012;1817:610–619. doi: 10.1016/j.bbabio.2011.09.002. [DOI] [PubMed] [Google Scholar]
- 9.(a) Castello PR, Woo DK, Ball K, Wojcik J, Liu L, Poyton RO. Proc. Natl. Acad. Sci. U. S. A. 2008;105:8203–8208. doi: 10.1073/pnas.0709461105. [DOI] [PMC free article] [PubMed] [Google Scholar]; (b) Benamar A, Rolletschek H, Borisjuk L, Avelange-Macherel M-H, Curien G, Mostefai HA, Andriantsitohaina R, Macherel D. Biochim. Biophys. Acta. 2008;1777:1268–1275. doi: 10.1016/j.bbabio.2008.06.002. [DOI] [PubMed] [Google Scholar]; (c) Gladwin MT, Shiva S. Circ. Res. 2009;104:1136–1138. doi: 10.1161/CIRCRESAHA.109.198911. [DOI] [PubMed] [Google Scholar]
- 10.(a) Nicholls P, Sharpe M, Torres J, Wilson MT, Cooper CE. Biochem. Soc. Trans. 1998;26:S323. doi: 10.1042/bst026s323. [DOI] [PubMed] [Google Scholar]; (b) Torres J, Sharpe MA, Rosquist A, Cooper CE, Wilson MT. FEBS Lett. 2000;475:263–266. doi: 10.1016/s0014-5793(00)01682-3. [DOI] [PubMed] [Google Scholar]; (c) Igamberdiev AU, Ratcliffe RG, Gupta KJ. Mitochondrion. 2014;19:329–333. doi: 10.1016/j.mito.2014.02.003. [DOI] [PubMed] [Google Scholar]
- 11.Hematian S, Siegler MA, Karlin KDJ. Am. Chem. Soc. 2012;134:18912–18915. doi: 10.1021/ja3083818. [DOI] [PMC free article] [PubMed] [Google Scholar]
- 12.Hematian S, Siegler MA, Karlin KD. J. Biol. Inorg. Chem. 2014;19:515–528. doi: 10.1007/s00775-013-1081-6. [DOI] [PMC free article] [PubMed] [Google Scholar]
- 13.(a) Fox S, Nanthakumar A, Wikström M, Karlin KD, Blackburn NJ. J. Am. Chem. Soc. 1996;118:24–34. [Google Scholar]; (b) Kopf M-A, Neuhold Y-M, Zuberbühler AD, Karlin KD. Inorg. Chem. 1999;38:3093–3102. [Google Scholar]
- 14.Karlin KD, Nanthakumar A, Fox S, Murthy NN, Ravi N, Huynh BH, Orosz RD, Day EP. J. Am. Chem. Soc. 1994;116:4753–4763. [Google Scholar]
- 15.Nanthakumar A, Fox S, Murthy NN, Karlin KD, Ravi N, Huynh BH, Orosz RD, Day EP, Hagen KS, Blackburn N. J. J Am. Chem. Soc. 1993;115:8513–8514. [Google Scholar]
- 16.Halime Z, Kieber-Emmons MT, Qayyum MF, Mondal B, Gandhi T, Puiu SC, Chufán EE, Sarjeant AAN, Hodgson KO, Hedman B, Solomon EI, Karlin KD. Inorg. Chem. 2010;49:3629–3645. doi: 10.1021/ic9020993. [DOI] [PMC free article] [PubMed] [Google Scholar]
- 17.Kim E, Helton ME, Wasser IM, Karlin KD, Lu S, Huang H-w, Moenne-Loccoz P, Incarvito CD, Rheingold AL, Honecker M, Kaderli S, Zuberbühler AD. Proc. Natl. Acad. Sci. U.S.A. 2003;100:3623–3628. doi: 10.1073/pnas.0737180100. [DOI] [PMC free article] [PubMed] [Google Scholar]
- 18.Lee SC, Holm RH. J. Am. Chem. Soc. 1993;115:5833–5834. [Google Scholar]
- 19.Ju TD, Ghiladi RA, Lee D-H, van Strijdonck GPF, Woods AS, Cotter RJ, Young VGJ, Karlin KD. Inorg. Chem. 1999;38:2244–2245. [Google Scholar]
- 20.Chishiro T, Shimazaki Y, Tani F, Naruta Y. Chem. Comm. 2005:1079–1081. doi: 10.1039/b413275k. [DOI] [PubMed] [Google Scholar]
- 21.We note, however, that kinetic and CSI-MS measurements below −60 °C, from data that are not presented here, revealed the existence of a bis-NO intermediate for [(F8)FeIII−O−CuIII(tmpa)]+, similar to that for the case of [(TMPP)FeIII−O−CuIII(tmpa)]+, which is described later in the text in detail.
- 22.Interestingly, the spectral features of this intermediate resemble those of the previously known and structurally characterized complex ferric heme–nitrosyl nitrite complex [(TMPP)FeIII(NO)(NO2)] (Figure S7). However, a detailed examination of the spectra revealed differences in relative extinction coefficients of the Soret and Q-bands.
- 23.Yoshimura T. Bull. Chem. Soc. Jpn. 1991;64:2819–2828. [Google Scholar]
- 24.(a) Morse RH, Chan SI. J. Biol. Chem. 1980;255:7876–7882. [PubMed] [Google Scholar]; (b) Cheng L, Richter-Addo GB. Binding and Activation of Nitric Oxide by Metalloporphyrins and Heme. In: Kadish KM, Simith KM, Guilard R, editors. Porphyrin Handbook. Vol. 4. San Diego, CA: Academic Press; 2000. pp. 219–291. Chapter 33. [Google Scholar]
- 25.(a) Lymar SV, Schwarz HA, Czapski G. J. Phys. Chem. A. 2002;106:7245–7250. [Google Scholar]; (b) Yamamoto Y, Moribe S, Ikoma T, Akiyama K, Zhang Q, Saito F, Tero-Kubota S. Mol. Phys. 2006;104:1733–1737. [Google Scholar]; (c) Kudrik EV, Makarov SV, Zahl A, van Eldik R. Inorg. Chem. 2003;42:618–624. doi: 10.1021/ic020290f. [DOI] [PubMed] [Google Scholar]
- 26.This can be explained by higher local charges (+3 on Fe and −2 on the bridging O-atom) in the starting µ-oxo [(TMPP)FeIII−O−CuII(tmpa)]+ complex that thus require a larger number of solvent molecules in the solvation sphere and the fact that as the reaction progresses forming the mono-NO adduct, a decrease in charge localization (or perhaps better described as increase in charge delocalization, +2 on Fe and −1 on the bridging NO2 moiety that is larger than the O-atom) results in the interaction with fewer solvent molecules. This causes the release of a number of solvent molecules from the solvation sphere escaping to the bulk, which leads to the positive entropy change, the value of which is dependent on solvent polarity.
- 27.The equilibrium constant can also be calculated using K = eΔ−G/RT = e−(ΔH−TΔS)/RT employing the parameters given in Table 3, resulting in K1 = 1023 ± 300 M−1 at −60 °C and K1 = 920 ± 300 M−1 at −74 °C.
- 28. Wanat A, Schneppensieper T, Stochel G, van Eldik R, Bill E, Wieghardt K. Inorg. Chem. 2002;41:4–10. doi: 10.1021/ic010628q. Schneppensieper T, Wanat A, Stochel G, van Eldik R. Inorg. Chem. 2002;41:2565–2573. doi: 10.1021/ic011220w. (c) Deviation from the thermodynamically determined binding constant is most probably related to errors involved in the determination of koff via extrapolation of the kinetic data obtained in the stopped-flow experiments.
- 29.(a) Greenwood NN, Earnshaw A. Chemistry of the Elements. Oxford: Pergamon Press; 1993. [Google Scholar]; (b) Heinecke J, Ford PC. Coord. Chem. Rev. 2010;254:235–247. [Google Scholar]
- 30.Ellison MK, Schulz CE, Scheidt WR. Inorg. Chem. 1999;38:100–108. [Google Scholar]
- 31.Scheidt WR, Frisse ME. J. Am. Chem. Soc. 1975;97:17–21. doi: 10.1021/ja00834a005. [DOI] [PubMed] [Google Scholar]
- 32.Shubina TE. Adv. Inorg. Chem. 2010;62:261–299. [Google Scholar]
- 33.Loullis A, Noor MR, Soulimane T, Pinakoulaki E. Chem. Comm. 2015;51:286–289. doi: 10.1039/c4cc08019j. [DOI] [PubMed] [Google Scholar]
- 34.(a) Hoshino M, Maeda M, Konishi R, Seki H, Ford PC. J. Am. Chem. Soc. 1996;118:5702–5707. [Google Scholar]; (b) Ford PC, Fernandez BO, Lim MD. Chem. Rev. 2005;105:2439–2455. doi: 10.1021/cr0307289. [DOI] [PubMed] [Google Scholar]; (c) Fernandez BO, Lorkovic IM, Ford PC. Inorg. Chem. 2003;42:2–4. doi: 10.1021/ic020519r. [DOI] [PubMed] [Google Scholar]
- 35.Ford PC. Inorg. Chem. 2010;49:6226–6239. doi: 10.1021/ic902073z. [DOI] [PubMed] [Google Scholar]
- 36.Sharma V, Karlin KD, Wikström M. Proc. Natl. Acad. Sci. U.S.A. 2013;110:16844–16849. doi: 10.1073/pnas.1220379110. [DOI] [PMC free article] [PubMed] [Google Scholar]
- 37.(a) Ford PC, Lorkovic IM. Chem. Rev. 2002;102:993–1017. doi: 10.1021/cr0000271. [DOI] [PubMed] [Google Scholar]; (b) Wang J, Schopfer MP, Sarjeant AAN, Karlin KD. J. Am. Chem. Soc. 2009;131:450–451. doi: 10.1021/ja8084324. [DOI] [PMC free article] [PubMed] [Google Scholar]; (c) Schopfer MP, Mondal B, Lee D-H, Sarjeant AAN, Karlin KDJ. Am. Chem. Soc. 2009;131:11304–11305. doi: 10.1021/ja904832j. [DOI] [PMC free article] [PubMed] [Google Scholar]
- 38.Ghiladi RA, Kretzer RM, Guzei I, Rheingold AL, Neuhold Y-M, Hatwell KR, Zuberbühler AD, Karlin KD. Inorg. Chem. 2001;40:5754–5767. doi: 10.1021/ic0105866. [DOI] [PubMed] [Google Scholar]
- 39.Lucas HR, Meyer GJ, Karlin KDJ. Am. Chem. Soc. 2010;132:12927–12940. doi: 10.1021/ja104107q. [DOI] [PMC free article] [PubMed] [Google Scholar]
- 40.Liang H-C, Zhang CX, Henson MJ, Sommer RD, Hatwell KR, Kaderli S, Zuberbuehler AD, Rheingold AL, Solomon EI, Karlin KD. J. Am. Chem. Soc. 2002;124:4170–4171. doi: 10.1021/ja0125265. [DOI] [PubMed] [Google Scholar]
- 41.Wang J, Schopfer MP, Puiu SC, Sarjeant AAN, Karlin KD. Inorg. Chem. 2010;49:1404–1419. doi: 10.1021/ic901431r. [DOI] [PMC free article] [PubMed] [Google Scholar]
- 42.Lorkovic I, Ford PC. J. Am. Chem. Soc. 2000;122:6516–6517. [Google Scholar]
- 43.Sheldrick GM. Acta. Crystallogr., Sect. A. 2008;64:112–122. doi: 10.1107/S0108767307043930. [DOI] [PubMed] [Google Scholar]
- 44.Jee JE, Eigler S, Hampel F, Jux N, Wolak M, Zahl A, Stochel G, van Eldik R. Inorg. Chem. 2005;44:7717–7731. doi: 10.1021/ic050924t. [DOI] [PubMed] [Google Scholar]
Associated Data
This section collects any data citations, data availability statements, or supplementary materials included in this article.


