Summary
Primary and metastatic melanoma tumors share the same cell origin, making it challenging to identify genomic biomarkers that can differentiate them. Primary tumors themselves can be heterogeneous, reflecting ongoing genomic changes as they progress toward metastasizing. We developed a computational method to explore this heterogeneity and to predict metastatic progression of the primary tumors. We applied our method separately to gene expression and to microRNA (miRNA) expression data from ~450 primary and metastatic skin cutaneous melanoma (SKCM) samples from the Cancer Genome Atlas (TCGA). Metastatic progression scores from RNA-seq data were significantly associated with clinical staging of patients’ lymph nodes whereas scores from miRNA-seq data were significantly associated with Clark’s level. The loss of expression of many characteristic epithelial lineage genes in primary SKCM tumor samples was highly correlated with predicted progression scores. We suggest that those genes/miRNAs might serve as putative biomarkers for SKCM metastatic progression.
Keywords: Metastasis, metastatic progression, biomarker, melanoma, classification, GA/KNN
Introduction
Melanoma is highly aggressive and its incidence has been increasing world-wide. Both genetics and environmental exposure contribute to its etiology (Bennett, 2008, Gray-Schopfer et al., 2007, Miller and Mihm, 2006). Melanoma has often metastasized to a distal site before being diagnosed (Braeuer et al., 2014); these metastases cause the majority of deaths from melanoma.
Tumor metastasis is a complex process that is thought to involve several steps including epithelial-mesenchymal transition (EMT), invasion, and angiogenesis (Geiger and Peeper, 2009, Friedl and Alexander, 2011, Quail and Joyce, 2013). Many key signaling pathways have been implicated in EMT including those associated with receptor tyrosine kinase (Lemmon and Schlessinger, 2010), the transforming growth factor β (TGFB) superfamily (Massague, 2012), WNT (Komiya and Habas, 2008), NOTCH (Andersson et al., 2011), and hedgehog (Briscoe and Therond, 2013). Complex tumor environments that govern the cytoskeletal dynamics, cell-matrix interactions and cell-cell junction stability play a role in tumor progression and metastasis (Friedl and Alexander, 2011, Quail and Joyce, 2013). Inflammation and hypoxia also contribute (Finger and Giaccia, 2010, Wu and Zhou, 2009).
The Cancer Genome Atlas (TCGA) project has generated a large amount of data using several platforms including RNA-seq and miRNA-seq applied to the same tissue specimens. Those data provided unprecedented information about the molecular map of tumors. Those and many other studies have identified driver mutations (Guan et al., 2015, Hodis et al., 2012) and molecular pathways and provided insights into the molecular mechanisms and etiology of cancers (reviewed in (Vogelstein et al., 2013, Garraway and Lander, 2013)).
Earlier, we developed a stochastic search algorithm, GA/KNN (Li et al., 2001a, Li et al., 2001b), to identify near-optimal feature sets that can separate different classes of samples based on either gene expression or proteomic data (Li et al., 2004). The GA/KNN method employs a genetic algorithm (GA) as the search engine and the k-nearest neighbors (KNN) algorithm as the classification tool. We showed that the GA/KNN is capable of identifying gene features that not only can separate different classes of samples but also may uncover subtypes within a class (Li et al., 2001b).
In this analysis, we aimed to identify expression signatures that can separate primary and metastatic skin cutaneous melanoma (SKCM) based on RNA-seq and miRNA-seq expression data from TCGA. Data from the two platforms were analyzed separately. Our initial analysis using the GA/KNN algorithm showed unacceptably high misclassification rates, especially for the primary tumor samples. In that analysis, we randomly divided the data into a training (75%) and test set (25%). The training data were used to identify gene signatures that could distinguish primary from metastatic tumors. When the gene signatures were applied to the test samples, ~42% of the primary tumors were classified as metastatic tumors (data not shown). Both primary and metastatic tumors share the same cell of origin – melanocytes; the resulting similarity may contribute to the high misclassification. Another possible contributor, however, is heterogeneity among the tumors: some of the primary SKCM tumors might have undergone progression toward metastasizing, i.e., metastatic progression, which might be evident at the genomic level even before frank metastases can be detected.
To account for the potential discordance between the underlying gene/miRNA expression patterns and clinical/pathological phenotype assignment, we modified our GA/KNN method to allow a few samples in one phenotype to be reassigned to the other, e.g., primary to metastatic or vice versa. Such explicit allowance for “allegiance switching” is carried out carefully, in that each sample of one phenotype had the same small probability of being switched to the other. Classification accuracy with respect to the newly assigned phenotypes determined the quality of the final classification.
In accord with our previous GA/KNN, we obtained many near-optimal classifications so that we could obtain the proportion of runs in which a sample was assigned to the metastatic group. This procedure was based on the realization that for genomic data with more features than samples (commonly referred to as small n large p) multiple equally discriminative feature sets may exist. We reasoned that, if all the primary SKCM tumors resembled the metastatic tumors to a similar degree, those tumor samples would have the same chance of being assigned to the metastatic group. In contrast, we found that proportion of runs in which a clinically classified primary SKCM tumor was reassigned to the metastatic group varied widely among tumors. In comparison, nearly all the clinically classified metastatic tumors consistently remained in the metastatic group.
We regarded the proportion of runs where a particular SKCM tumor was assigned to the metastatic group as quantifying metastatic progression for that tumor. Thus, our modified GA/KNN algorithm provided a putative metastatic progression score for each primary or metastatic SKCM tumor specimen using either RNA-seq or miRNA-seq data. For primary tumors, these two metastatic progression scores were correlated with each other and with some clinical/pathologic indicators of prognosis. Analysis of the RNA-seq and miRNA-seq expression data identified several families of genes (such as KRT, S100 and SERPIN) and miRNAs (such as mir-205) whose expression levels were highly correlated with the predicted metastatic progression scores of primary SKCM tumors, suggesting that those genes/miRNA may serve as putative biomarkers for metastatic progression of primary SKCM tumors.
Results
For data from each platform (RNA-seq or miRNA-seq), we carried out 10,000 independent runs of our modified GA/KNN algorithm to obtain 10,000 near-optimal feature sets of 20 genes and the respective 10,000 reassignments of each tumor to one of the phenotypes. Using results of the 10,000 runs, we computed the frequency with which each gene/miRNA appeared within a near-optimal feature set and the frequency with which each sample was assigned to the metastatic group. As demonstrated before (Li et al., 2001b), the frequencies with which genes were selected into near-optimal feature sets across the runs were highly non-uniform with some genes occurring in more than 25% of the near-optimal signatures (Fig. 1a & 1b). Conversely, the proportion of runs where a tumor specimen was classified as metastatic among the 10,000 runs was also highly non-uniform, particularly across primary tumors (Fig. 2a & 2b).
Figure 1.
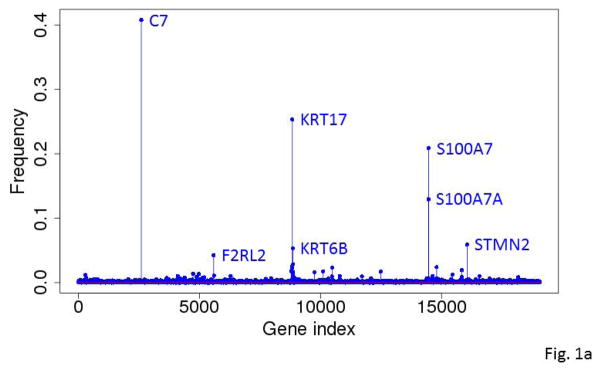
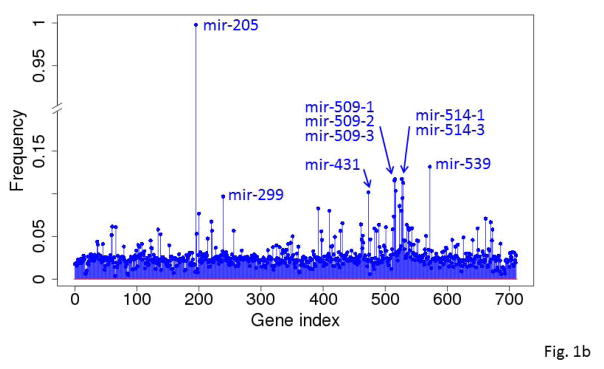
Frequencies with which the genes (A) and miRNA (B) were selected into near-optimal feature sets among the 10,000 runs based on RNA-seq gene expression data. Each run selected 20 unique near-optimal genes. The frequency was computed based on how often a gene occurred in the 10,000 sets of 20 genes.
Figure 2.
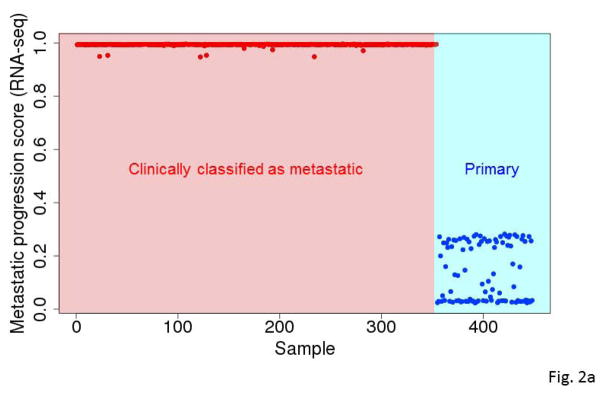
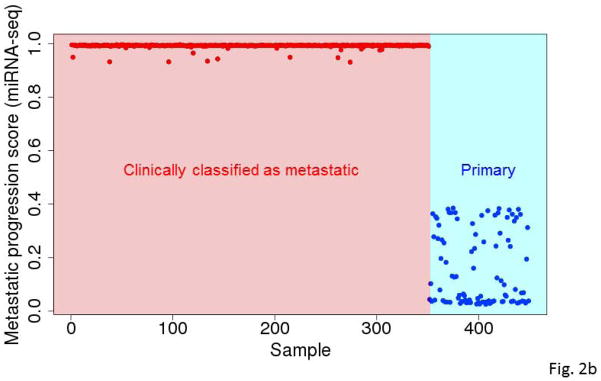
Predicted metastatic progression scores for all samples based on RNA-seq (A) and miRNA (B) expression data based on 10,000 runs. At the end of each run, we monitored which samples were assigned to the primary tumor group and which samples were assigned to the metastatic tumor group. The predicted metastatic progression scores were the frequencies with which each tumor assigned to the metastatic group.
For the three separate runs with different minimal group sizes (70%, 80%, or 85% of the total number of primary tumors), both the frequencies of gene selection and proportions in which the primary tumors were reassigned to the metastatic group were highly correlated (ρ ≈ 0.98, Spearman correlation) between any two minimal sizes (Supplementary Fig. S1). This is also true for the three separate runs with different switching chances (see Methods) (ρ=0.96–0.98, Spearman correlation) (Supplementary Fig. S2). The proportions increased as the switching chance increased; but, the rank of the proportions remained remarkably consistent regardless of the choice for the minimum or switching chances.
Comparison of metastatic progression scores among RNA-seq and miRNA-seq results
Nearly all the clinically classified metastatic tumors consistently reassigned to the metastatic group. In contrast, the clinically classified primary SKCM tumors were often reassigned to the metastatic group (Fig. 2a & 2b). Those results suggest that many primary SKCM tumors resembled metastatic tumors to some degree in gene/miRNA expression and that the degree of resemblance varied across individual primary SKCM tumors. The heterogeneity in primary tumors may reflect that fact that some of those tumors may sustain a long period of growth before metastasis.
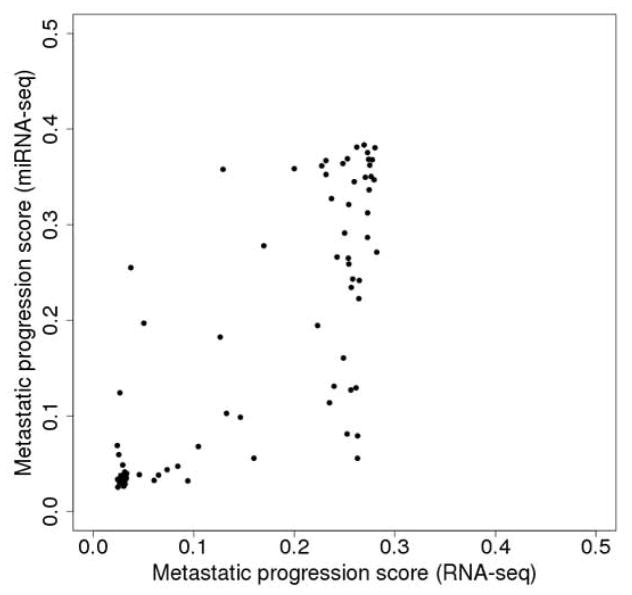
We regard the proportion of runs in which an SKCM tumor was assigned to the metastatic group as an index of that tumor’s metastatic progression. The metastatic progression scores from RNA-seq data were highly correlated with those from miRNA-seq data for primary tumors (ρ=0.79, Spearman correlation) (Fig. 3). This result indicates that both platforms tend to classify the same primary tumors as showing progression toward metastasizing.
Figure 3.
Correlation between metastatic progression scores obtained from RNA-seq data and miRNA-seq data for 88 primary tumors. For each platform, 10,000 runs were carried out and the metastatic progression scores were obtained based on the 10,000 runs as shown in Figure 2.
Comparison of RNA-seq and miRNA-seq results with clinical features of tumors
We examined whether our expression-derived metastatic progression scores among primary tumors were associated with clinical factors plausibly indicative of tumor progression. To test for associations, we used the Jonckheere-Terpstra test (Hollander and Wolfe, 1973) for multi-category clinical factors (tumor stage, N classification, and Clark’s level), the Mann-Whitney-Wilcoxon test for binary clinical factors (presence of ulceration) and Spearman’s rank correlation for continuous clinical variables (Breslow’s depth). Because many patient’s clinical records were incomplete, these tests are based on only a subset of the tumors; in fact, so few records included mitotic rate (a measure of cell proliferation in the tumor) that we omitted it from testing.
The predicted metastatic progression scores in primary tumors based on RNA-seq and miRNA-seq showed positive associations with two of five clinical prognostic factors (Table 1, Supplementary Fig. S3–S4). We found no association of either metastatic progression score with presence of ulceration, with Breslow’s depth, or with tumor stage (p>0.20 in all 6 tests). In the primary tumors, the regional lymph node classification (N classification) had 3 levels ranging from N1 (1 regional node affected) to N3 (4 or more regional nodes affected). Its positive association was statistically significant with the RNA-seq-based metastatic progression score (p=0.03) but not with the miRNA-based score (p=0.18). Clark’s level, a measure of tumor invasiveness, spanned 3 levels (Level III to V) in the primary tumors. The association of Clark’s level with metastatic progression scores reached statistical significance for the miRNA-seq-based score (p=0.04) but not for the RNA-seq-based score (p=0.15). Though not conclusive, these results taken together suggest that the metastatic progression scores calculated with our modified GA/KNN algorithm reflect, however imperfectly, some clinically observable features of primary melanomas.
Table 1.
Association of clinical prognostic factors with metastatic progression scores
| Clinical | RNA-seq data | miRNA-seq data | ||
|---|---|---|---|---|
| No. samples with clinical data | p-value | No. samples with clinical data | p-value | |
| Tumor stage | 68 | 0.65 | 73 | 0.22 |
| N classification | 58 | 0.03 | 64 | 0.18 |
| Clark’s level | 50 | 0.15 | 51 | 0.04 |
| Ulceration | 68 | 0.87 | 71 | 0.35 |
| Breslow’s depth | 65 | 0.66 | 67 | 0.69 |
The number of samples on each clinical factor is less than the total number of tumors analyzed using the platform.
Top-ranked genes
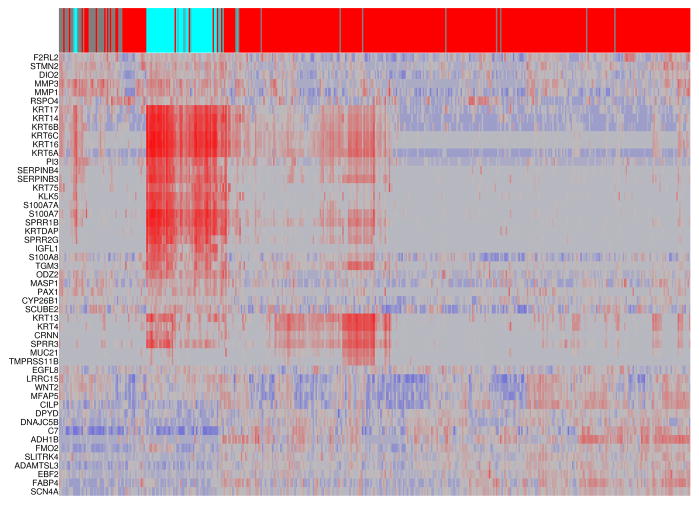
The 200 most frequently selected genes (more than 30 times out of 10,000) into near-optimal discriminative signatures from RNA-seq data were largely those involved in ectoderm and epidermis development, epithelial and epidermal cell differentiation, keratinization, and regulation of inflammatory and defense response (Table 2). Those genes include C7, members of the KRT family, S100A family, MMP family, SERPINB family, IGFL family, F2RL2, LCE3D, MASP1, PAX1, and WNT2. A complete list of the top 200 genes appears in the Supplementary Table S1. Many of those genes have been implicated in tumor development and progression. For example, keratins are extensively used as diagnostic tumor markers (Karantza, 2011). The S100 family of proteins is involved in a variety of biological processes such as cell proliferation, migration and invasion (Donato et al., 2013, Bresnick et al., 2015). In many human cancers, the expressions of many members of the S100 family of genes are altered (Bresnick et al., 2015). The MMP family of matrix metalloproteases plays a role in melanoma invasion by altering the tumor microenvironment through its proteolytic activities (Moro et al., 2014, Kondratiev et al., 2008). The heat map of the top 50 genes across the 448 samples revealed that the expression patterns of both primary and metastatic SKCM tumors are heterogeneous (Fig. 4).
Table 2.
Significant GO terms (GOTERM_BP_ALL) for the top 200 genes from RNA-seq data
| GO term | Number of genes | Multiple testing adjusted p-value |
|---|---|---|
| ectoderm development | 20 | 9.6E-10 |
| epidermis development | 18 | 1.4E-8 |
| developmental process | 64 | 1.5E-4 |
| epithelial cell differentiation | 12 | 1.2E-4 |
| keratinocyte differentiation | 9 | 1.7E-4 |
| epidermal cell differentiation | 9 | 2.8E-4 |
| tissue development | 23 | 8.2E-4 |
| multicellular organismal development | 57 | 8.3E-4 |
| multicellular organismal process | 75 | 9.3E-4 |
| anatomical structure development | 52 | 8.9E-4 |
| cell differentiation | 38 | 2.0E-3 |
| response to external stimulus | 26 | 2.8E-3 |
| immune response | 22 | 2.6E-3 |
| organ development | 39 | 2.5E-3 |
| immune system process | 27 | 3.4E-3 |
Figure 4.
Heat map display of the expression patterns of the top 50 genes across (A) the 94 primary and (B) 448 metastatic SKCM tumors. Each row (gene) was centered by the mean expression value across all samples. A hierarchical clustering analysis was carried out for both samples and genes. At the top of the heat map, the metastatic samples were colored in red whereas the primary tumor samples were colored in blue with the darkness corresponding to their metastatic progression scores.
The five most frequently selected genes were C7, KRT17, S100A7, S100A7A and STMN2. All except C7 were down-regulated in metastatic SKCM tumors compared to primary SKCM tumors. Among the 94 primary tumors, the expression levels of KRT17, S100A7 and S100A7A were highly inversely correlated with the tumor’s RNA-seq-based metastatic progression score (ρ=−0.84 to −0.86, Spearman correlation) (Fig. 5a–5e and Table 3).
Figure 5.
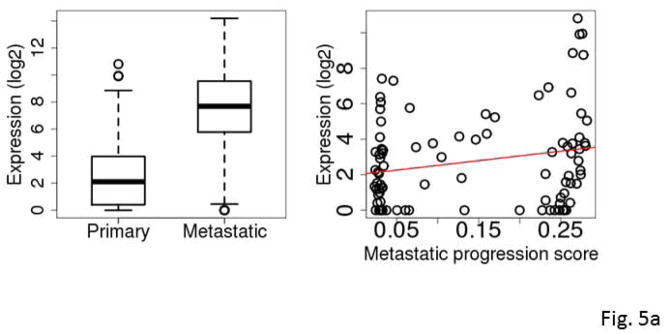
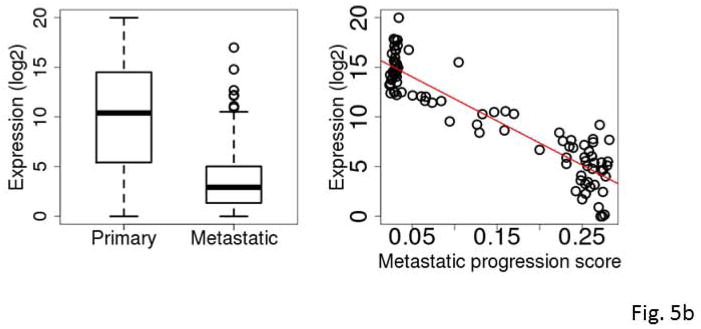
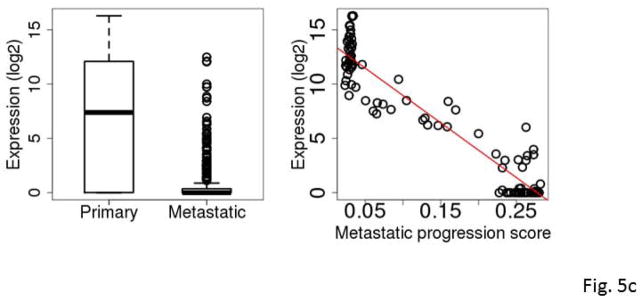
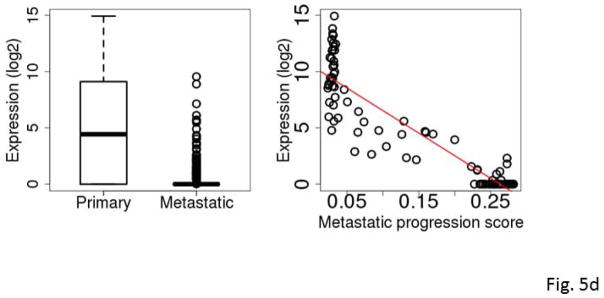
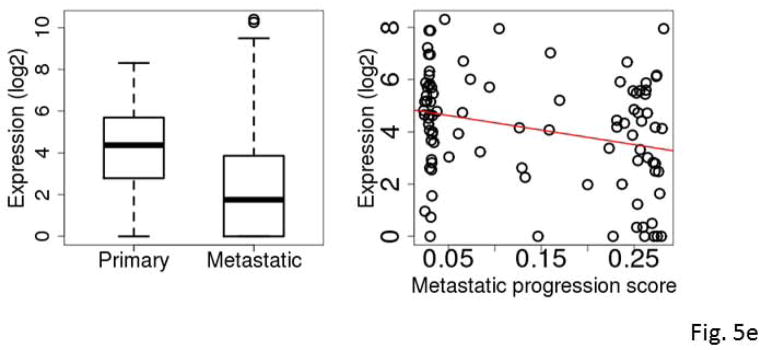
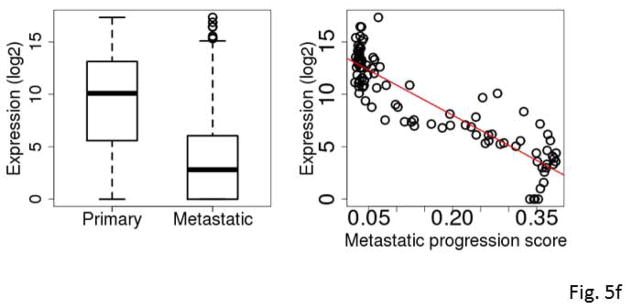
Box plots comparing expression levels in primary and metastatic tumors (left) and correlation between expression and metastatic progression score for clinically classified primary SKCM tumors (right). The gene expression levels were log2 transformed. C7 (A), KRT17 (B), S100A7 (C), S100A7A (D), STMN2 (E), and mir-205 (F).
Table 3.
Correlation coefficients between computed metastatic progression score and gene expression level for the top 5 genes
| Top Gene | 94 primary tumors | 448 metastatic tumors |
|---|---|---|
| C7 | 0.22 | 0.16 |
| KRT17 | −0.92 | −0.51 |
| S100A7 | −0.95 | −0.70 |
| S100A7A | −0.91 | −0.75 |
| STMN2 | −0.28 | −0.10 |
| Mir-205 | −0.89 | −0.71 |
KRT17 belongs to a family of genes that encode keratins, a group of tough, fibrous proteins that form the structural framework of certain cells. KRT17 promotes epithelial proliferation and tumor growth (Depianto et al., 2010). S100A7 and S100A7A are members of the S100 family of proteins containing 2 EF-hand calcium-binding motifs. S100 proteins are involved in the regulation of cellular processes such as cell cycle progression and differentiation (Gross et al., 2014). S100A7 promotes breast tumor growth and metastasis (Nasser et al., 2012). C7 was differentially expressed between the primary and metastatic SKCM tumors with an overall higher expression in the metastatic tumors. C7 is a component of the complement system and participates in the formation of membrane attack complex. Evidence of complement system involvement in tumorigenesis and metastasis has begun to emerge. Oka et al. (Oka et al., 2001) showed that complements C6 and C7 expression levels were reduced in oesophageal carcinoma. Complement proteins may also play a role in biological processes such as apoptosis, invasion and migration (Rutkowski et al., 2010). Markiewski et al. (Markiewski et al., 2008) demonstrated that tumorigenesis requires complement activation and complement C5a signaling; and they suggested complement inhibition as a potential treatment for cancer. STMN2 encodes a member of the stathmin family of phosphoproteins involved in microtubule dynamics and signal transduction. Recently, Guo et al. demonstrated that high expression of phosphorylated STMN2 mediated by the p21-activated kinase 4 (PAK4) is highly correlated with an aggressive phenotype of clinical gastric cancer (Guo et al., 2014).
Loss of expression correlated with metastatic progression score
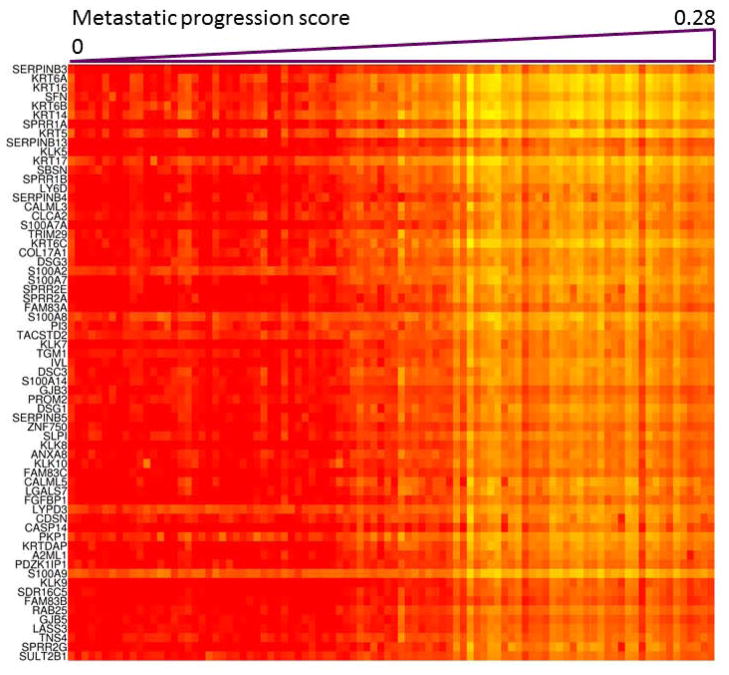
Next, we systematically searched for genes whose expression patterns in the 94 primary SKCM RNASeqV2 samples were correlated with the metastatic progression scores of those tumor samples. We identified 186 such genes whose expression levels were highly inversely correlated with the score (ρ≤− 0.7, Spearman correlation) (Supplementary Table S2). No genes with high positive correlation were identified. The expression pattern of the top 65 genes (ρ≤−0.8) as a function of metastatic progression score across the 94 primary SKCM tumors is shown in Figure 6 where loss of expression is inversely correlated with progression score. Gene ontology analysis showed that the top 186 genes are highly enriched in biological processes of ectoderm and epidermis development, keratinocyte and epithelial cell differentiation, and cell adhesion and defense response to a lesser degree (Supplementary Table S3). The level of enrichment is higher than those selected based on the distinction between primary and metastatic SKCM tumors (see above). Those results underpin our finding that those primary SKCM tumors with high metastatic progression scores had undergone a large scale loss of characteristic epithelial cell gene expression.
Figure 6.
Heat map display of the expression patterns of the top 65 genes (ρ<−0.7) with the highest negative correlation with metastatic progression score across the 94 primary SKCM tumors. No genes with high positive correlation (ρ>0.7) were found. The genes were arranged by the absolute correlation coefficient with the highest being at the top. For each gene, the Spearman correlation was computed by matching the expression levels of the gene in the 94 primary tumor samples and the predicted metastatic progression scores for the 94 primary tumors. The gene expression level was colored in red and yellow with red being the highest expression and yellow the lowest expression. The triangular bar at the top of the figure was drawn proportionally to the progression score. The primary tumor samples were arranged with the lowest score on the left and highest on the right. It can be seen that, for each gene, the tumor’s metastatic progression score is negatively correlated with the gene’s expression level.
Top-ranked miRNAs
Mir-205 was the most frequently selected miRNAs occurring in nearly all of the 10,000 feature sets (Fig. 1b). It was nearly 8 times more frequently selected than the next top miRNA. The other top-ranked miRNAs included mir-539, mir-509, and mir-514. The 50 top-ranked miRNAs are listed in Supplementary Table S4.
Mir-205 was down-regulated in metastatic SKCM tumors compared to primary SKCM tumors (Fig. 5f) consistent with reports in the literature (Xu et al., 2012, Gregory et al., 2008, Dar et al., 2011). Among primary tumors, the miRNA-seq-based metastatic progression score and the mir-205 expression were strongly inversely correlated (ρ=−0.89, Spearman correlation) (Fig. 5f). Conversely, among the metastatic tumors, the same correlation was also relatively high (ρ=−0.71). These results suggest that the mir-205 expression level might be indicative of the metastatic progression of SKCM tumors.
Mir-205, a tumor suppressor, is significantly down-regulated in melanoma tumors and cell lines (Xu et al., 2012, Gregory et al., 2008, Dar et al., 2011). Gregory et al. (Gregory et al., 2008) showed that mir-205 and the mir-200 family of miRNAs are significantly down-regulated in cells that had undergone EMT, an essential early step in tumor metastasis and suggested that those miRNAs are involved in establishing epithelial cell lineages during development. Dar et al. (Dar et al., 2011) demonstrated that mir-205 suppresses melanoma cell proliferation and induces senescence via regulation of E2F1 protein. Mir-205 has been shown to play a role in cell adhesion (Li et al., 2013). Mir-205 has also been implicated in breast cancer (Piovan et al., 2012), prostate cancer (Cai et al., 2013, Srivastava et al., 2013, Pennati et al., 2014), esophageal squamous cell carcinoma (Matsushima et al., 2011), non-small cell lung cancer (Larzabal et al., 2014) and many other malignancies (Wang et al., 2013). Another microRNA, mir-126, has also been implicated in the metastatic progression (Halberg et al., 2012).
Discussion
Metastatic melanoma is the most aggressive form of skin cancer with a median survival of around one year. Both genetics (Hodis et al., 2012) and environmental exposures are the major contributing factors in developing malignant melanoma (reviewed in (Miller and Mihm, 2006, Bandarchi et al., 2010, Damsky et al., 2011)). Gene and environment interaction appears to augment disease progression (Viros et al., 2014). Studies have identified several genes and gene pathways that play a role in melanoma etiology. Understanding the molecular mechanism by which melanoma progresses is critical for therapeutic intervention. Reliable biomarkers that are indicative of metastatic progression of melanoma could be clinically beneficial.
Advances in sequencing technologies have led to the generation of many large-scale genomic data sets for multiple tumor types from TCGA. Integrated analyses of these high-dimensional data (Omberg et al., 2013, Cancer Genome Atlas Research et al., 2013) have facilitated the generation of novel hypotheses and led to new discoveries. Here we have developed an iterative stochastic search algorithm that systematically mines the gene expression and miRNA expression data for 456 melanoma specimens from TCGA to uncover potential biomarkers indicative of metastatic progression in melanoma. Unlike conventional methods that take the clinical classification as fixed when seeking gene signatures that distinguish primary from metastatic SKCM tumors, our method is rooted in the clinical classification but allows for switching between groups when a specimen is clearly discordant with other group members based on its expression profile. This idea is built upon the observation that the primary and metastatic tumors were difficult to separate using expression data and the belief that clinical pathology and the underlying gene expression of primary SKCM tumors in particular may not always be concordant.
The switch between groups was carried out carefully in that the group assignment was largely based on the clinical classification and that each sample in the same clinical group was given the same chance of switching groups. The quality of the grouping was determined by the number of specimens correctly classified. When this procedure was repeated independently multiple times, the frequency with which each sample was assigned to the metastatic group could be analyzed. We showed that both gene selection and specimen assignment were highly non-uniform. Primary tumors varied widely in their tendency to be reassigned to the metastatic group whereas the metastatic tumors largely remained in the metastatic group. These results demonstrate that our method is capable of uncovering intrinsic differences among primary tumors and assessing their similarity to the metastatic tumors at the gene and miRNA expression levels.
The top-ranked genes are those that best discriminate primary from metastatic SKCM tumors with allegiance switching. Gene ontology analysis showed that the 200 most frequently selected genes are largely enriched in biological processes such as ectoderm and epidermis development, epithelial cell and keratinocyte differentiation, organismal development, and immune response. Genes implicated in cell adhesion (AJAP1, AOC3, CD36, CLCA2, COL8A1, COL29A1, COMP, CRNN, CTNNA2, DSG1, DSG3, KAL1, LYVE1, MUC4, and SIGLEC11), cell matrix degradation (MMP1, MMP3, MMP9, and MMP10), and the WNT receptor signaling pathway (WNT2, RSPO4, SFRP2, and SFRP4) were also among the top 200. These results suggest that the expression of genes involved in diverse biological processes may be altered between the primary and metastatic SKCM tumors. Although we cannot totally rule out the possibility that the signatures we identified might reflect some level of stromal tissue contamination, we believe that such contamination is unlikely to explain the observed degree of heterogeneity in gene expression among the 94 primary tumors because contamination, if present, should be similar among the 94 primary samples.
Our comparisons of metastatic progression scores based on gene expression data of the primary SKCM tumors with clinical prognostic factors indicate that the progression scores are significantly associated with the patient’s clinical staging of the lymph nodes (N classification). The top-ranked genes in the KRT family (e.g., KRT17, KRT6B, and KRT6C), S100 family (S100A7, S100A7A, and S100A8), SERPINB family (SERPINB4 and SERPINB3), and SPRR family (SPRR1B, SPRR2G, and SPRR3) (not all data shown) were not only differentially expressed between primary and metastatic SKCM tumors but also exhibited expression levels in primary tumors that were correlated with the predicted metastatic progression scores of the tumors. Loss of expression of many of those characteristic epithelial lineage genes in primary SKCM tumor samples was highly correlated with metastatic progression scores of these tumors. Those results suggest that those genes might serve as putative biomarkers for metastatic progression of primary SKCM tumors.
Analysis of the miRNA expression data identified mir-205 as the top-ranked miRNA for distinguishing primary from metastatic SKCM tumors. Mir-205 expression level was also highly inversely correlated with the metastatic progression scores based on miRNA expression data. In primary SKCM tumors, these metastatic progression scores were significantly associated with the Clark’s level, a measure of histologic invasion of melanoma in the skin and subcutis.
The paucity of statistically significant associations between our metastatic progression score and the clinical characteristics forces us to be more circumspect in our conclusions than we would have been had all the associations been strong. In only a few instances did the observed associations reach statistical significance. We would point out, however, that the failure to reach statistical significance is not necessarily evidence that an association is absent. Fewer than 100 primary tumor samples were available (94 and 98 for RNA-seq and miRNA-seq, respectively) but even fewer had clinical data available (between 50 and 71, depending on clinical feature and genomic platform). For ulceration, the median metastatic progression score was indeed larger for tumors that exhibited ulceration than for those that did not, but variability in metastatic progression score was large for both sets of tumors (Supplementary Figures S3 and S4). The same kind of observation can be made for other categorical clinical characteristics. Surprisingly, Breslow’s depth showed perhaps the least evidence for association with our metastatic progression score of all the clinical characteristics that we examined (Supplementary Figures S3 and S4). A potential contributor is the fact that most primary tumors in the data set had relatively high values of Breslow’s depth – 75% were larger than 5 mm. We suspect that collection of primary SKCM tumors in the TCGA database are skewed toward larger more advanced tumors (for example, all but one primary tumor with clinical data were tumor stage II or higher; all primary tumors with clinical data had Clark’s level III or higher; similarly, more than 80% of primary tumors with clinical data showed ulceration). The dearth of early/low stage tumors with clinical characteristics in the TCGA data contributes to difficulties in detecting associations and raises issues regarding how conclusions might change if the samples spanned the entire clinical spectrum. Consequently, interpretation of our detailed results must remain tentative. Nevertheless, the fact that the genomic features that we identified as important for metastasis have also been identified by others supports the conclusion that our proposed algorithm shows promise as a way to assess metastatic potential based on genomics alone and to uncover genes related to metastasis.
Methods
RNA-seq/miRNA-seq data
We downloaded 448 UNC RNASeqV2 and 449 BCGSC miRNASeq SKCM level 3 expression data from the TCGA data portal (https://tcga-data.nci.nih.gov/tcga). The numbers of primary and metastatic specimens are listed in Table 4. We log2-transformed the normalized reads count (per million reads mapped) for both RNA-seq and miRNA-seq data (all values less than 1 were assigned to 1 before transformation) but carried out no further normalization.
Table 4.
Number of available specimens for each tumor class and combination of genomic measurement platforms
| Number of specimens | Analysis platform | |||
|---|---|---|---|---|
|
| ||||
| Primary | Metastatic | Total | RNA-seq | miRNA-seq |
| 88 | 338 | 426 | ✓ | ✓ |
| 6 | 16 | 22 | ✓ | |
| 10 | 13 | 23 | ✓ | |
|
| ||||
| Platform-specific primary | 94 | 98 | ||
| Platform-specific metastatic | 354 | 351 | ||
| Platform-specific overall | 448 | 449 | ||
Clinical data
We supported our contention that our genomic-derived metastatic progression scores had potential clinical relevance using TCGA clinical data, which provide information on characteristics of patients (e.g., demographics, vital status at time of report, treatment regimens, and clinical follow-up) and of their tumors (e.g., disease-specific diagnostic/prognostic factors). TCGA extracts melanoma clinical data from two forms that were completed by the participant or participant’s physician: Melanoma Enrollment Form and Melanoma Follow-up Form. We were particularly interested in prognostic factors associated with the primary tumors: tumor stage, regional lymph node stage (N classification), level of invasion (Clark’s level), cell proliferation (mitotic rate), presence of ulceration, and tumor thickness (Breslow’s depth). We downloaded the clinical data from https://tcga-data.nci.nih.gov/tcgafiles/ftp_auth/distro_ftpusers/anonymous/tumor/skcm/bcr/biotab/clin/. The Biospecimen Core Resource of TCGA uploads new files as new clinical data become available. At the time of our analysis, of the primary tumor samples available (94 for RNA-seq and 98 for miRNA-seq), clinical information was available for only between 50 and 71 of them, depending on the clinical feature and the genomic platform.
Modified GA/KNN algorithm
To address the possibility that the clinical classification might only imperfectly be reflected in the underlying genomic differences, we devised a modified GA/KNN algorithm that allowed a small probability for tumors to randomly “switch allegiance”. Our modified GA/KNN algorithm, based on the original GA/KNN algorithm (Li et al., 2001a, Li et al., 2001b), has as its goal to search simultaneously for near-optimal discriminative features (genes/miRNA in this case) and for a near-optimal sample partitioning (which samples belong to metastatic tumor group and which to primary tumor group). The original GA/KNN algorithm searches for near-optimal feature sets that can separate different classes of samples based on fixed sample class labels; whereas the modified GA/KNN performs the same task while allowing a few samples to switch classes.
This “allegiance switching” was carried out carefully, in that each sample of one phenotype had the same small probability of being switched to the other. At the beginning of each GA/KNN run, the clinically classified metastatic tumors were assigned to the metastatic group whereas the clinically classified primary tumor samples were assigned to the primary group. At each “generation” of the GA/KNN run, we gave each of the primary tumors a small but equal chance (0.001) to be reassigned to the metastatic group. Similarly, we gave each of the metastatic tumors an equal but smaller chance (0.0001) to be reassigned to the primary group. In practice, for each sample in a group, we generated a random number between 0 and 1. If the random number was smaller than the chance of switching for the group, the sample was reassigned to the other group. We gave the primary tumor a bigger chance of switching to mimic the actual transition – primary tumors may eventually metastasize but metastatic tumors do not revert to primary. We could restrict all metastatic tumors to the metastatic group, but reasoned that our alternative would provide the flexibility to account for potential misclassifications among those tumors. Furthermore, we examined how changing the chances of switching might affect results using two additional pairs of probabilities (0.005 for primary and 0.0005 for metastatic and 0.01 for primary and 0.001 for metastatic) while fixing the minimum group size (see below) to 80%.
We also required the number of samples in each group (after switching) to exceed a minimum at each “generation.” The minimal group size was imposed to maintain a minimal number of samples in a group (primary or metastatic) after switching. Since there were 94 primary SKCM tumors, we experimented with minimums being 75%, 80% and 85%, respectively, of the primary tumor total while keeping all other parameters fixed. These percentages correspond to 70, 75, or 80 tumors for RNA-seq and 75, 78, or 83 tumors for miRNA-seq.
In a typical GA, the “chromosomes” contain candidate solutions, e.g., genes in our previous GA/KNN algorithm. In the modified GA/KNN algorithm, chromosomes are paired, one for genes (feature chromosome) and one for sample class labels (sample chromosome). The paired chromosomes evolve together through the genetic algorithm. The near-optimality of switching is determined by the genetic algorithm. If such a switch improved the classification, it would be tend to be maintained by the genetic algorithm; otherwise, it would tend to switch back. The final reassignment with the highest classification accuracy is recorded. This winning (near-optimal) chromosome pair at the final generation contains the gene set in the current “population” that gives best classification of samples based on the sample grouping in the corresponding sample chromosome, which contains labels after allegiance switching. The gene feature set was initially randomly selected from all genes whereas the sample labels were initially based on the clinical classification as mentioned above. The chromosome size for the gene feature set was fixed at 20 as before (Li et al., 2001b) whereas the chromosome size for the sample label was the number of samples (448 for the RNA-seq data). Mutation operations were applied to both gene features as before (Li et al., 2001b) and sample labels as indicated above. Because the modified GA/KNN searches both feature and sample space, both the “population” size and the number of “generations” were set large (300 and 1000, respectively).
This entire algorithm was repeated many times (10,000, in this case) independently. We counted the proportion of times a particular melanoma tumor was assigned to the metastatic group and regarded that proportion as quantifying metastatic progression for that tumor.
Gene ontology analysis was carried out using the online DAVID Bioinformatics Resources 6.7 (Huang da et al., 2009).
Supplementary Material
Significance.
Despite the overall resemblance between primary and metastatic melanomas in gene expression, we were able to assess a putative metastatic progression status for each tumor. We showed that loss of expression of characteristic epithelial cell lineage genes was highly correlated with our predicted metastatic progression scores for the primary tumors and the scores were significantly associated with clinical prognostic factors (staging of lymph nodes for RNA-seq data and Clark’s level for miRNA-seq data). Our unique approach is promising step toward allowing clinicians to assess the likelihood of metastatic progression of primary melanoma based on gene expression measurements.
Acknowledgments
We are grateful to John Demchok (National Cancer Institute) for his assistance on questions related to the clinical data. We thank Mike Resnick, Paul Wade and Shyamal Peddada for comments and suggestions and the reviewers for their constructive comments that improved our manuscript. We thank the Computational Biology Facility at NIEHS and the Biowulf at NIH for computing time. This research was supported by Intramural Research Program of the NIH, National Institute of Environmental Health Sciences (ES101765).
Footnotes
Disclosure of Potential Conflicts of Interest
No potential conflicts of interest were disclosed.
References
- ANDERSSON ER, SANDBERG R, LENDAHL U. Notch signaling: simplicity in design, versatility in function. Development. 2011;138:3593–612. doi: 10.1242/dev.063610. [DOI] [PubMed] [Google Scholar]
- BANDARCHI B, MA L, NAVAB R, SETH A, RASTY G. From melanocyte to metastatic malignant melanoma. Dermatol Res Pract. 2010;2010 doi: 10.1155/2010/583748. [DOI] [PMC free article] [PubMed] [Google Scholar]
- BENNETT DC. How to make a melanoma: what do we know of the primary clonal events? Pigment Cell Melanoma Res. 2008;21:27–38. doi: 10.1111/j.1755-148X.2007.00433.x. [DOI] [PubMed] [Google Scholar]
- BRAEUER RR, WATSON IR, WU CJ, MOBLEY AK, KAMIYA T, SHOSHAN E, BAR-ELI M. Why is melanoma so metastatic? Pigment Cell Melanoma Res. 2014;27:19–36. doi: 10.1111/pcmr.12172. [DOI] [PubMed] [Google Scholar]
- BRESNICK AR, WEBER DJ, ZIMMER DB. S100 proteins in cancer. Nat Rev Cancer. 2015;15:96–109. doi: 10.1038/nrc3893. [DOI] [PMC free article] [PubMed] [Google Scholar]
- BRISCOE J, THEROND PP. The mechanisms of Hedgehog signalling and its roles in development and disease. Nat Rev Mol Cell Biol. 2013;14:416–29. doi: 10.1038/nrm3598. [DOI] [PubMed] [Google Scholar]
- CAI J, FANG L, HUANG Y, LI R, YUAN J, YANG Y, ZHU X, CHEN B, WU J, LI M. miR-205 targets PTEN and PHLPP2 to augment AKT signaling and drive malignant phenotypes in non-small cell lung cancer. Cancer Res. 2013;73:5402–15. doi: 10.1158/0008-5472.CAN-13-0297. [DOI] [PubMed] [Google Scholar]
- CANCER GENOME ATLAS RESEARCH N. WEINSTEIN JN, COLLISSON EA, MILLS GB, SHAW KR, OZENBERGER BA, ELLROTT K, SHMULEVICH I, SANDER C, STUART JM. The Cancer Genome Atlas Pan-Cancer analysis project. Nat Genet. 2013;45:1113–20. doi: 10.1038/ng.2764. [DOI] [PMC free article] [PubMed] [Google Scholar]
- DAMSKY WE, CURLEY DP, SANTHANAKRISHNAN M, ROSENBAUM LE, PLATT JT, GOULD ROTHBERG BE, TAKETO MM, DANKORT D, RIMM DL, MCMAHON M, BOSENBERG M. beta-catenin signaling controls metastasis in Braf-activated Pten-deficient melanomas. Cancer Cell. 2011;20:741–54. doi: 10.1016/j.ccr.2011.10.030. [DOI] [PMC free article] [PubMed] [Google Scholar]
- DAR AA, MAJID S, DE SEMIR D, NOSRATI M, BEZROOKOVE V, KASHANI-SABET M. miRNA-205 suppresses melanoma cell proliferation and induces senescence via regulation of E2F1 protein. J Biol Chem. 2011;286:16606–14. doi: 10.1074/jbc.M111.227611. [DOI] [PMC free article] [PubMed] [Google Scholar]
- DEPIANTO D, KERNS ML, DLUGOSZ AA, COULOMBE PA. Keratin 17 promotes epithelial proliferation and tumor growth by polarizing the immune response in skin. Nat Genet. 2010;42:910–4. doi: 10.1038/ng.665. [DOI] [PMC free article] [PubMed] [Google Scholar]
- DONATO R, CANNON BR, SORCI G, RIUZZI F, HSU K, WEBER DJ, GECZY CL. Functions of S100 proteins. Curr Mol Med. 2013;13:24–57. [PMC free article] [PubMed] [Google Scholar]
- FINGER EC, GIACCIA AJ. Hypoxia, inflammation, and the tumor microenvironment in metastatic disease. Cancer Metastasis Rev. 2010;29:285–93. doi: 10.1007/s10555-010-9224-5. [DOI] [PMC free article] [PubMed] [Google Scholar]
- FRIEDL P, ALEXANDER S. Cancer invasion and the microenvironment: plasticity and reciprocity. Cell. 2011;147:992–1009. doi: 10.1016/j.cell.2011.11.016. [DOI] [PubMed] [Google Scholar]
- GARRAWAY LA, LANDER ES. Lessons from the cancer genome. Cell. 2013;153:17–37. doi: 10.1016/j.cell.2013.03.002. [DOI] [PubMed] [Google Scholar]
- GEIGER TR, PEEPER DS. Metastasis mechanisms. Biochim Biophys Acta. 2009;1796:293–308. doi: 10.1016/j.bbcan.2009.07.006. [DOI] [PubMed] [Google Scholar]
- GRAY-SCHOPFER V, WELLBROCK C, MARAIS R. Melanoma biology and new targeted therapy. Nature. 2007;445:851–7. doi: 10.1038/nature05661. [DOI] [PubMed] [Google Scholar]
- GREGORY PA, BERT AG, PATERSON EL, BARRY SC, TSYKIN A, FARSHID G, VADAS MA, KHEW-GOODALL Y, GOODALL GJ. The miR-200 family and miR-205 regulate epithelial to mesenchymal transition by targeting ZEB1 and SIP1. Nat Cell Biol. 2008;10:593–601. doi: 10.1038/ncb1722. [DOI] [PubMed] [Google Scholar]
- GROSS SR, SIN CG, BARRACLOUGH R, RUDLAND PS. Joining S100 proteins and migration: for better or for worse, in sickness and in health. Cell Mol Life Sci. 2014;71:1551–79. doi: 10.1007/s00018-013-1400-7. [DOI] [PMC free article] [PubMed] [Google Scholar]
- GUAN J, GUPTA R, FILIPP FV. Cancer systems biology of TCGA SKCM: Efficient detection of genomic drivers in melanoma. Sci Rep. 2015;5:7857. doi: 10.1038/srep07857. [DOI] [PMC free article] [PubMed] [Google Scholar]
- GUO Q, SU N, ZHANG J, LI X, MIAO Z, WANG G, CHENG M, XU H, CAO L, LI F. PAK4 kinase-mediated SCG10 phosphorylation involved in gastric cancer metastasis. Oncogene. 2014;33:3277–87. doi: 10.1038/onc.2013.296. [DOI] [PubMed] [Google Scholar]
- HALBERG N, ALARCON C, TAVAZOIE SF. microRNA regulation of cancer-endothelial interactions: vesicular microRNAs on the move. EMBO J. 2012;31:3509–10. doi: 10.1038/emboj.2012.198. [DOI] [PMC free article] [PubMed] [Google Scholar]
- HODIS E, WATSON IR, KRYUKOV GV, AROLD ST, IMIELINSKI M, THEURILLAT JP, NICKERSON E, AUCLAIR D, LI L, PLACE C, DICARA D, RAMOS AH, LAWRENCE MS, CIBULSKIS K, SIVACHENKO A, VOET D, SAKSENA G, STRANSKY N, ONOFRIO RC, WINCKLER W, ARDLIE K, WAGLE N, WARGO J, CHONG K, MORTON DL, STEMKE-HALE K, CHEN G, NOBLE M, MEYERSON M, LADBURY JE, DAVIES MA, GERSHENWALD JE, WAGNER SN, HOON DS, SCHADENDORF D, LANDER ES, GABRIEL SB, GETZ G, GARRAWAY LA, CHIN L. A landscape of driver mutations in melanoma. Cell. 2012;150:251–63. doi: 10.1016/j.cell.2012.06.024. [DOI] [PMC free article] [PubMed] [Google Scholar]
- HOLLANDER M, WOLFE DA. Nonparametric statistical methods. New York: Wiley; 1973. [Google Scholar]
- HUANG DAW, SHERMAN BT, LEMPICKI RA. Systematic and integrative analysis of large gene lists using DAVID bioinformatics resources. Nat Protoc. 2009;4:44–57. doi: 10.1038/nprot.2008.211. [DOI] [PubMed] [Google Scholar]
- KARANTZA V. Keratins in health and cancer: more than mere epithelial cell markers. Oncogene. 2011;30:127–38. doi: 10.1038/onc.2010.456. [DOI] [PMC free article] [PubMed] [Google Scholar]
- KOMIYA Y, HABAS R. Wnt signal transduction pathways. Organogenesis. 2008;4:68–75. doi: 10.4161/org.4.2.5851. [DOI] [PMC free article] [PubMed] [Google Scholar]
- KONDRATIEV S, GNEPP DR, YAKIREVICH E, SABO E, ANNINO DJ, REBEIZ E, LAVER NV. Expression and prognostic role of MMP2, MMP9, MMP13, and MMP14 matrix metalloproteinases in sinonasal and oral malignant melanomas. Hum Pathol. 2008;39:337–43. doi: 10.1016/j.humpath.2007.07.003. [DOI] [PubMed] [Google Scholar]
- LARZABAL L, DE ABERASTURI AL, REDRADO M, RUEDA P, RODRIGUEZ MJ, BODEGAS ME, MONTUENGA LM, CALVO A. TMPRSS4 regulates levels of integrin alpha5 in NSCLC through miR-205 activity to promote metastasis. Br J Cancer. 2014;110:764–74. doi: 10.1038/bjc.2013.761. [DOI] [PMC free article] [PubMed] [Google Scholar]
- LEMMON MA, SCHLESSINGER J. Cell signaling by receptor tyrosine kinases. Cell. 2010;141:1117–34. doi: 10.1016/j.cell.2010.06.011. [DOI] [PMC free article] [PubMed] [Google Scholar]
- LI C, FINKELSTEIN D, SHERR CJ. Arf tumor suppressor and miR-205 regulate cell adhesion and formation of extraembryonic endoderm from pluripotent stem cells. Proc Natl Acad Sci U S A. 2013;110:E1112–21. doi: 10.1073/pnas.1302184110. [DOI] [PMC free article] [PubMed] [Google Scholar]
- LI L, DARDEN TA, WEINBERG CR, LEVINE AJ, PEDERSEN LG. Gene assessment and sample classification for gene expression data using a genetic algorithm/k-nearest neighbor method. Comb Chem High Throughput Screen. 2001a;4:727–39. doi: 10.2174/1386207013330733. [DOI] [PubMed] [Google Scholar]
- LI L, UMBACH DM, TERRY P, TAYLOR JA. Application of the GA/KNN method to SELDI proteomics data. Bioinformatics. 2004;20:1638–40. doi: 10.1093/bioinformatics/bth098. [DOI] [PubMed] [Google Scholar]
- LI L, WEINBERG CR, DARDEN TA, PEDERSEN LG. Gene selection for sample classification based on gene expression data: study of sensitivity to choice of parameters of the GA/KNN method. Bioinformatics. 2001b;17:1131–42. doi: 10.1093/bioinformatics/17.12.1131. [DOI] [PubMed] [Google Scholar]
- MARKIEWSKI MM, DEANGELIS RA, BENENCIA F, RICKLIN-LICHTSTEINER SK, KOUTOULAKI A, GERARD C, COUKOS G, LAMBRIS JD. Modulation of the antitumor immune response by complement. Nat Immunol. 2008;9:1225–35. doi: 10.1038/ni.1655. [DOI] [PMC free article] [PubMed] [Google Scholar]
- MASSAGUE J. TGFbeta signalling in context. Nat Rev Mol Cell Biol. 2012;13:616–30. doi: 10.1038/nrm3434. [DOI] [PMC free article] [PubMed] [Google Scholar]
- MATSUSHIMA K, ISOMOTO H, YAMAGUCHI N, INOUE N, MACHIDA H, NAKAYAMA T, HAYASHI T, KUNIZAKI M, HIDAKA S, NAGAYASU T, NAKASHIMA M, UJIFUKU K, MITSUTAKE N, OHTSURU A, YAMASHITA S, KORPAL M, KANG Y, GREGORY PA, GOODALL GJ, KOHNO S, NAKAO K. MiRNA-205 modulates cellular invasion and migration via regulating zinc finger E-box binding homeobox 2 expression in esophageal squamous cell carcinoma cells. J Transl Med. 2011;9:30. doi: 10.1186/1479-5876-9-30. [DOI] [PMC free article] [PubMed] [Google Scholar]
- MILLER AJ, MIHM MC., JR Melanoma. N Engl J Med. 2006;355:51–65. doi: 10.1056/NEJMra052166. [DOI] [PubMed] [Google Scholar]
- MORO N, MAUCH C, ZIGRINO P. Metalloproteinases in melanoma. Eur J Cell Biol. 2014;93:23–9. doi: 10.1016/j.ejcb.2014.01.002. [DOI] [PubMed] [Google Scholar]
- NASSER MW, QAMRI Z, DEOL YS, RAVI J, POWELL CA, TRIKHA P, SCHWENDENER RA, BAI XF, SHILO K, ZOU X, LEONE G, WOLF R, YUSPA SH, GANJU RK. S100A7 enhances mammary tumorigenesis through upregulation of inflammatory pathways. Cancer Res. 2012;72:604–15. doi: 10.1158/0008-5472.CAN-11-0669. [DOI] [PMC free article] [PubMed] [Google Scholar]
- OKA R, SASAGAWA T, NINOMIYA I, MIWA K, TANII H, SAIJOH K. Reduction in the local expression of complement component 6 (C6) and 7 (C7) mRNAs in oesophageal carcinoma. Eur J Cancer. 2001;37:1158–65. doi: 10.1016/s0959-8049(01)00089-2. [DOI] [PubMed] [Google Scholar]
- OMBERG L, ELLROTT K, YUAN Y, KANDOTH C, WONG C, KELLEN MR, FRIEND SH, STUART J, LIANG H, MARGOLIN AA. Enabling transparent and collaborative computational analysis of 12 tumor types within The Cancer Genome Atlas. Nat Genet. 2013;45:1121–6. doi: 10.1038/ng.2761. [DOI] [PMC free article] [PubMed] [Google Scholar]
- PENNATI M, LOPERGOLO A, PROFUMO V, DE CESARE M, SBARRA S, VALDAGNI R, ZAFFARONI N, GANDELLINI P, FOLINI M. miR-205 impairs the autophagic flux and enhances cisplatin cytotoxicity in castration-resistant prostate cancer cells. Biochem Pharmacol. 2014;87:579–97. doi: 10.1016/j.bcp.2013.12.009. [DOI] [PubMed] [Google Scholar]
- PIOVAN C, PALMIERI D, DI LEVA G, BRACCIOLI L, CASALINI P, NUOVO G, TORTORETO M, SASSO M, PLANTAMURA I, TRIULZI T, TACCIOLI C, TAGLIABUE E, IORIO MV, CROCE CM. Oncosuppressive role of p53-induced miR-205 in triple negative breast cancer. Mol Oncol. 2012;6:458–72. doi: 10.1016/j.molonc.2012.03.003. [DOI] [PMC free article] [PubMed] [Google Scholar]
- QUAIL DF, JOYCE JA. Microenvironmental regulation of tumor progression and metastasis. Nat Med. 2013;19:1423–37. doi: 10.1038/nm.3394. [DOI] [PMC free article] [PubMed] [Google Scholar]
- RUTKOWSKI MJ, SUGHRUE ME, KANE AJ, MILLS SA, PARSA AT. Cancer and the complement cascade. Mol Cancer Res. 2010;8:1453–65. doi: 10.1158/1541-7786.MCR-10-0225. [DOI] [PubMed] [Google Scholar]
- SRIVASTAVA A, GOLDBERGER H, DIMTCHEV A, RAMALINGA M, CHIJIOKE J, MARIAN C, OERMANN EK, UHM S, KIM JS, CHEN LN, LI X, BERRY DL, KALLAKURY BV, CHAUHAN SC, COLLINS SP, SUY S, KUMAR D. MicroRNA profiling in prostate cancer--the diagnostic potential of urinary miR-205 and miR-214. PLoS One. 2013;8:e76994. doi: 10.1371/journal.pone.0076994. [DOI] [PMC free article] [PubMed] [Google Scholar]
- VIROS A, SANCHEZ-LAORDEN B, PEDERSEN M, FURNEY SJ, RAE J, HOGAN K, EJIAMA S, GIROTTI MR, COOK M, DHOMEN N, MARAIS R. Ultraviolet radiation accelerates BRAF-driven melanomagenesis by targeting TP53. Nature. 2014;511:478–82. doi: 10.1038/nature13298. [DOI] [PMC free article] [PubMed] [Google Scholar]
- VOGELSTEIN B, PAPADOPOULOS N, VELCULESCU VE, ZHOU S, DIAZ LA, JR, KINZLER KW. Cancer genome landscapes. Science. 2013;339:1546–58. doi: 10.1126/science.1235122. [DOI] [PMC free article] [PubMed] [Google Scholar]
- WANG Z, LIAO H, DENG Z, YANG P, DU N, ZHANNG Y, REN H. miRNA-205 affects infiltration and metastasis of breast cancer. Biochem Biophys Res Commun. 2013;441:139–43. doi: 10.1016/j.bbrc.2013.10.025. [DOI] [PubMed] [Google Scholar]
- WU Y, ZHOU BP. Inflammation: a driving force speeds cancer metastasis. Cell Cycle. 2009;8:3267–73. doi: 10.4161/cc.8.20.9699. [DOI] [PMC free article] [PubMed] [Google Scholar]
- XU Y, BRENN T, BROWN ER, DOHERTY V, MELTON DW. Differential expression of microRNAs during melanoma progression: miR-200c, miR-205 and miR-211 are downregulated in melanoma and act as tumour suppressors. Br J Cancer. 2012;106:553–61. doi: 10.1038/bjc.2011.568. [DOI] [PMC free article] [PubMed] [Google Scholar]
Associated Data
This section collects any data citations, data availability statements, or supplementary materials included in this article.


