

Abstract
Nucleic acids carry a negative charge, attracting salt ions and water. Interactions with these components of the solvent drive DNA to condense, RNA to fold, and proteins to bind. To understand these biological processes, knowledge of solvent structure around the nucleic acids is critical. Yet, because they are often disordered, ions and water evade detection by x-ray crystallography and other high-resolution methods. Small-angle x-ray scattering (SAXS) is uniquely sensitive to the spatial correlations between solutes and the surrounding solvent. Thus, SAXS provides an experimental constraint to guide or test emerging solvation theories. However, the interpretation of SAXS profiles is nontrivial because of the difficulty in separating the scattering signals of each component: the macromolecule, ions, and hydration water. Here, we demonstrate methods for robustly deconvoluting these signals, facilitating a more straightforward comparison with theory. Using SAXS data collected on an absolute intensity scale for short DNA duplexes in solution with Na+, K+, Rb+, or Cs+ counterions, we mathematically decompose the scattering profiles into components (DNA, water, and ions) and validate the decomposition using anomalous scattering measurements. In addition, we generate a library of physically motivated ion atmosphere models and rank them by agreement with the scattering data. The best-fit models have relatively compact ion atmospheres when compared to predictions from the mean-field Poisson-Boltzmann theory of electrostatics. Thus, the x-ray scattering methods presented here provide a valuable measurement of the global structure of the ion atmosphere that can be used to test electrostatics theories that go beyond the mean-field approximation.
Introduction
Charged biomolecules interact with the surrounding environment. In aqueous solutions, these highly charged molecules attract an atmosphere of ions and water that is responsible for screening electrostatic interactions between molecules. One striking example of the consequences of electrostatic screening is the salt-dependent collective behavior of nucleic acids: DNA molecules strongly repel each other in low-salt solutions (1) but form condensed phases when certain multivalent cations are added (2–4). In biological systems, ion atmospheres are necessarily altered as nucleic acids carry out their varied roles in the cell: processing the genetic code, regulating gene expression, and assembling complexes with protein and small-molecule partners. In these cases, changes in the ion atmosphere may contribute significantly to the total free-energy difference that drives these biologically important structural transitions. Beyond its biological importance, the ion atmosphere is also integral to DNA-based nanotechnologies. Applications such as the electronic detection of specific DNA sequences in solution (5–8) and electronic control of hybridization (9) rely on devices that use an electric field to influence the ion atmospheres around surface-tethered molecules. Knowledge of the precise arrangement of ions and water around DNA will facilitate the efficient design and operation of such biologically inspired devices.
Efforts to model the solvent distribution around charged biomolecules are not new: many theoretical perspectives ranging in scope from mean-field models to all-atom simulations with explicit solvent have been applied. The former approach is commonly used by experimental scientists who wish to gain insight into solvation effects with minimal computational expense, and it includes the Poisson-Boltzmann (PB) theory, which provides a mean-field treatment of the ion atmosphere in a uniform dielectric medium. The application of this theory to macromolecular systems leads to a partial differential equation, the nonlinear PB equation (NPBE), whose solution prescribes the average counterion density surrounding the macromolecule (10). It is important to note that NPBE-based approaches accurately predict the colligative properties of DNA. Currently, all-atom grid-based solvers provide exact solutions to the NPBE and are widely used for macromolecular electrostatics calculations (11–13).
Despite the appeal of this straightforward-to-apply method, PB has several simplifying assumptions that break down in the modeling of highly charged molecules such as DNA (10,14–17): ions are modeled as point charges, ion-ion interactions are neglected, and the solvent is approximated as a uniform dielectric medium. More sophisticated models have emerged to address some or all of these concerns. Notable examples include the tightly bound ion model (18), molecular dynamics (MD) (17), and the three-dimensional reference interaction site model (19). These more sophisticated models differ significantly from PB in their predictions for the spatial arrangement of the ions, as exemplified by comparisons between PB and MD (20). Here, by careful measurement and NPBE-based modeling, we highlight a key difference between PB models and measurement that is consistent with the breakdown of PB near the DNA surface.
Our structural studies rely on small-angle x-ray scattering (SAXS), a technique uniquely sensitive to the spatial distribution of all statistically associated ions (15,21,22). X-ray scattering signals contain contributions from the ions, macromolecule, and hydration water. To separate the scattering contribution from the ions, several studies have taken advantage of anomalous (or resonant) scattering (15,23), where the strength of scattering from only one component (e.g., the ions) is varied by tuning the x-ray energy near an absorption edge. Scattering profiles are typically measured at two energies near the edge, and the difference signal reports the spatial correlation between the ions and the DNA. This method, called anomalous SAXS (ASAXS) has been particularly useful for comparison with theories describing ion distributions around duplexes (15,20,24).
Using absolute-intensity calibrations, we recently extended ASAXS methods to count the total number of statistically associated ions around RNA and DNA (25). Although ion counting has been demonstrated using the Donnan effect in equilibrium dialysis experiments (26,27) or with ion-binding fluorescent dyes (28), ASAXS is the only method that provides both the number and distribution of ions around nucleic acids, which is essential for the most accurate comparison to theory. However, the achievable signal/noise ratio in ASAXS measurements is limited by the small difference signals (typically <10%) and sensitivity of macromolecule solutions to radiation damage (29). Furthermore, both the macromolecule and its hydration layer contribute to the anomalous difference signal; these cross-terms must be taken into account when comparing with theory.
Here, we describe a straightforward extension of the absolute-intensity ASAXS method in which heavy atom isomorphous replacement is used to vary the contrast (scattering strength) of the ion atmosphere. Relative to anomalous scattering, changes in ion contrast by heavy-atom substitution can be large, providing a greater signal/noise ratio and more precise information about the locations of ions around the nucleic acid. Unlike previous heavy-atom replacement studies (15,21,22,30,31), we decompose the scattering data into its three components (DNA alone, ions alone, and the DNA-ion cross-term) to extract greater detail about the ion environment. A comparison of absolutely calibrated SAXS profiles to predictions based on the NPBE suggests that standard PB theory underestimates the number of ions present near the DNA surface. Finally, these absolute-intensity measurements provide the number of waters in close proximity to the DNA. These data should be valuable for testing new computational methods that build on PB theory by including additional solvent degrees of freedom (19,32).
Materials and Methods
Sample preparation
DNA samples were prepared as described in the Supporting Material. Briefly, a mixed-sequence, 25 basepair DNA duplex (charge −48e) was formed from two synthetic oligonucleotides by annealing and buffer-exchanged in four different solutions containing 100 mM of 1:1 salt (NaCl, KCl, RbCl, and CsCl) and 1 mM Na-MOPS, pH 7.0. The DNA concentration was determined by ultraviolet absorbance at 260 nm, and stocks were diluted using the matching buffer to a concentration of 50 μM for SAXS and 150 μM for ASAXS.
SAXS data collection
SAXS data were collected at the Cornell High Energy Synchrotron Source (CHESS) beamline G1, which has a 49-pole wiggler source and multilayer optics. The monochromator was tuned to an x-ray energy of 10.53 keV, and the beam size was defined using slit dimensions 300 μm(H) × 250 μm(V). Parasitic scattering from the beam-defining slits was blocked using a set of guard slits, and the entire x-ray path between the beam-defining slits and the detector was evacuated (∼10 mTorr) to reduce the background. The photocurrent from a PIN diode integrated into the beamstop was used to correct for variations in the x-ray intensity over time. Samples were held in an in-vacuum quartz capillary with a 2 mm diameter and 10 μm wall thickness (Hampton Research, Aliso Viejo, CA). The sample was oscillated through the beam using a computer-controlled syringe pump to mitigate radiation damage (33). Scattering patterns were recorded with a photon-counting area detector (Pilatus 100K, Dectris, Baden, Switzerland) at a distance of 1.689 m from the sample position in four 60 s exposures.
ASAXS data collection
ASAXS experiments were performed at the CHESS C1 beamline using bend-magnet radiation and a double-bounce Si(110) monochromator. The sample was held in a 3-mm-diameter quartz capillary with 10 μm wall thickness and oscillated during x-ray exposure. An evacuated flight tube with a Si3N4 window on the upstream end was positioned between the sample capillary and detector. Images were recorded on the area detector (Pilatus 100K, Dectris) at a distance of 0.957 m from the sample. A semitransparent beamstop consisting of a stack of Mo foils (Goodfellow Corp., Coraopolis, PA) with a 550 μm nominal thickness was mounted inside the flight tube. The attenuated beam was recorded on the detector and its centroid was determined at each x-ray energy, defining q = 0 for azimuthal integration. X-rays scattered elastically by the beamstop were intercepted by a Si drift detector (X-flash, Roentec, Berlin, Germany) and counts were integrated during each exposure for normalization. Scattering data were acquired at two energies below the Rb+ K-edge, 15.093 keV (lo) and 15.191 keV (on). The monochromater cycled between the energies every 2 min, and the total exposure time per sample was 32 min.
X-ray data processing
SAXS and ASAXS data were processed using in-house routines written in MATLAB (The MathWorks, Natick, MA). The detector coordinates were converted to momentum transfer (q = 4πsin(2θ/2)/λ, where 2θ is the scattering angle and λ the wavelength) using powder diffraction from silver behenate for calibration purposes (34). Pixels occluded by the beamstop were masked, and the one-dimensional intensity was computed from each two-dimensional image by binning pixels according to the magnitude of q, with constant bin widths of 0.002 Å−1 (SAXS) and 0.004 Å−1 (ASAXS). The uncertainty of I(qi) was estimated using , where σi is the standard deviation among the Ni pixels in each bin. This uncertainty was propagated through subsequent averaging and buffer subtraction operations. The data were checked for radiation damage effects by comparing consecutive exposures before averaging. Finally, the scattering intensity was placed on an absolute scale using liquid water as a calibrant, as described in the Supporting Material, Pabit et al. (25), and Orthaber et al. (35). The scattering data were regularized and extrapolated to q = 0 using a Bayesian indirect Fourier transform (36) implemented in MATLAB. At the low [DNA] employed, we do not anticipate significant modifications to the q = 0 value resulting from interparticle interference (37,38). The signal would change by <3% under these experimental conditions (Fig. S1). Our results are robust when the scattering profiles are truncated below q = 0.05 Å−1 (Fig. S3), further allaying concerns about the effect of interparticle interactions.
Results
X-ray scattering from DNA with group-I cations
Duplex DNA (25 basepair, formal charge of −48 e) was equilibrated with neutral pH buffers containing 100 mM chloride salts with group-I monovalent cations NaCl, KCl, RbCl, and CsCl. The activity coefficients of these salts differ by <4% at 100 mM (39). SAXS profiles were acquired from solution with a low DNA concentration to minimize interparticle interference effects (37,38). The scattering profiles for each sample were normalized by the DNA concentration and placed on an absolute, calibrated intensity scale of electrons2 per molecule. Repeated concentration measurements gave a normalization precision of ±3% (SD). Further details for sample preparation and data analysis are provided in Materials and Methods and in the Supporting Material.
SAXS profiles for the cation series (Fig. 1) show enhancement at low scattering angles that increases with cation atomic number, suggesting the presence of excess cations associated with the DNA molecules. The simplest model for this ion-species-dependent effect is that of a two-phase system consisting of 1) a cloud of NI excess ions, and 2) the hydrated macromolecule. Then, the forward scattering intensity I(q → 0) is expected to vary with the ion contrast, δI, and macromolecular contrast, δM, according to
| (1) |
If δM and NI are the same in all salt solutions, then a plot of I(q → 0)1/2 versus δI should yield a straight line. Assuming that the hydration of each ion (i.e., its interaction with water) is unaffected by the DNA, δI can be estimated from the available data on dilute salt solutions. Ions exclude and attract water molecules via steric effects and electrostriction. At low angles, the hydrated ion scatters as though it had an effective number of electrons, Zeff, that is different from the actual number, ZI, according to
| (2) |
where is the average electron density of the solvent (for water at room temperature, ) and VI is the change in solution volume due to the addition of a single ion. The latter quantity, VI, is related to the absolute limiting partial molar volume of the ion, which has been measured for common salts (40). Relevant values for Zeff, ZI, and VI are provided in Table 1.
Figure 1.

Small-angle x-ray scattering from 25 basepair DNA in 100 mM chloride salts. The background-subtracted scattering intensity, I(q), versus momentum transfer, q, is shown in semilog scale with absolute units (electrons2 per DNA molecule). The intensity at low angles depends on the cation type, indicated in the legend. (Inset) The extrapolated forward-scattering amplitude, I(q→0)1/2, varies linearly with the effective ion contrast, Zeff (see Eqs. 1 and 2).
Table 1.
X-ray scattering contrasts and sizes of ions in water
A plot of I(q → 0)1/2 versus Zeff (Fig. 1, inset) is well fit by a straight line, conforming to expectations for the two-phase model, I(q → 0)1/2 = δM + NIZeff. From the slope, a number of excess ions, NI = 36.5 ± 2.4, is obtained. Since the DNA charge is − 48e at neutral pH, the measured value of NI indicates that 75 − 80% of the charge is neutralized by monovalent counterions, in accord with previous equilibrium dialysis measurements that found 80 ± 4% neutralization for a DNA duplex of similar length and composition in 100 mM NaCl (14). The remaining DNA charge is neutralized by coion exclusion (14,42). Note that the low x-ray contrast of hydrated Cl− (Table 1) makes the heavy-atom measurement relatively insensitive to the coions: the exclusion of ∼11 Cl ions has the expected effect of decreasing I(0)1/2 by ∼50 electrons, which is within the uncertainty of the measurement.
By linear extrapolation of I(q → 0)1/2 to the point where the net ion contrast is zero, we obtain the DNA contrast according to Eq. 1, δM = 2900 ± 50. This contrast depends on the number of water molecules attracted to the DNA surface (the hydration waters, NH), and the number excluded (NE). Since each water molecule contributes 10 electrons,
| (3) |
where ZDNA is the number of electrons bound to the DNA, known from the chemical formula (our DNA construct has 7950 electrons assuming a charge of −48, or 8018 after applying the anomalous corrections at 10.5 keV). Thus, from the measured value of δM, we obtain NH − NE directly. Furthermore, if either NH or NE can be estimated (for example, by geometrical arguments), the other is constrained by the measurement. We exploit this fact in the next section when modeling DNA hydration.
Mathematical separation of the partial scattering intensities
The full scattering profile corresponding to the two-phase system of Eq. 1 is
| (4) |
where PM(q) and PI(q) are the partial scattering form factors of the macromolecule and associated counterions, and PMI(q) is the cross-term (PM(0) = PI(0) = PMI(0) = 1, as described in the Supporting Material). From the I(q) profiles for the monovalent ion series (Fig. 1) and the known values of δM, δI, and NI, Eq. 4 was solved for PM(q), PI(q), and PMI(q) as described in the Supporting Material. The results are shown in Figs. 2 and 3.
Figure 2.
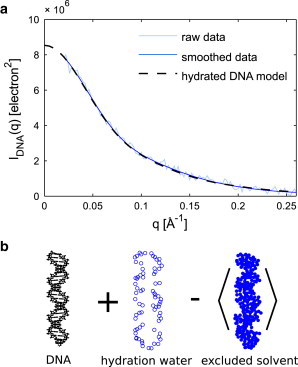
(a) The ion-independent (DNA-only) component of the scattering was found from decomposition of the scattering profiles in Fig. 1 (raw data) and from decomposition of the same profiles with prior smoothing by regularization (smoothed data). (b) The theoretical scattering intensity for hydrated DNA shown in (a) is the absolute square of the amplitude components illustrated here. Details of this calculation are provided in the text. For clarity, only water molecules within a 5 Å slab centered on the DNA are shown. To see this figure in color, go online.
Figure 3.

Ion-dependent components of the scattering from decomposition of the isomorphous replacement data (Fig. 1). The DNA-ion cross term, PMI(q) (a), and the ion-only term, PI(q) (b), were obtained in two ways: by direct decomposition (raw data) and by decomposition with prior smoothing by regularization (36) (smoothed data). Also shown are predictions derived from the NPBE with Stern layer thicknesses, r, indicated in the legend. To see this figure in color, go online.
The first term in Eq. 4 is the partial scattering intensity of the DNA, , conceptually equal to the total scattering if the ion atmosphere were completely invisible (δI = 0). Theoretically, IM(q) depends only on the scattering amplitudes of the macromolecule, its hydration layer, and the solvent excluded by the DNA:
| (5) |
The complex scattering amplitudes ADNA(q), AH(q), and AE(q) are equal to Fourier transforms of the electron density of the DNA, the hydration waters, and the excluded solvent, respectively (illustrated in Fig. 2 b). Brackets denote the average over DNA orientation () and solvent degrees of freedom (). To predict IM(q), we modeled the DNA as an ideal B-form duplex, added a uniform layer of hydration waters on the surface of the DNA, and chose the excluded solvent volume so that the number of excluded waters, NE, reproduced the experimental value of δM according to Eq. 3. Finally, the scattering profiles were calculated from the models using Eq. 5. Details of the modeling and calculations are included in the Supporting Material. We point out that commonly used software such as CRYSOL (43) fits hydration parameters to the shape of the experimental scattering curve on an arbitrary intensity scale, whereas here, the intensity is measured on an absolute scale, so fitting is not required. In Fig. 2 a, the experimentally determined DNA component is compared with the theoretical prediction for hydrated DNA. Visually, the agreement is excellent. For a quantitative comparison, we compute a reduced χ2 for experiment and prediction (Eq. S42) and find that the two agree within the uncertainty (). Thus, the hydrated DNA component obtained by mathematical decomposition of the scattering data agrees with a simple, geometric hydration model.
Validation of partial scattering intensities by ASAXS
The three-term decomposition of the SAXS data to PM(q), PI(q), and PMI(q) assumes that the ion distributions are the same for all salts employed. To validate this assumption, we performed anomalous (or resonant) scattering measurements (ASAXS) of the DNA sample in 100 mM RbCl (15,23). In ASAXS, the strength of scattering from the Rb atoms is varied by tuning the x-ray energy near its absorption edge; this has an effect similar to that of isomorphous replacement but only one sample is required (see Materials and Methods). The number of Rb+ ions was obtained from the ASAXS data as described in Pabit et al. (25). We find NI = 39 ± 3, in good agreement with the value of NI from isomorphous replacement.
For the two-phase system, the anomalous difference signal, Ilo(q) − Ion(q), is a mixture of the cross-term and the ion-only terms (Eq. S28):
| (6) |
where and and are the real parts of the anomalous scattering factor for Rb+ at Elo and Eon (for numerical values of f′, see Fig. 4 a). To provide a cross-check for the basis functions determined by the isomorphous replacement method, we computed this difference using the experimentally determined partial form factors PMI(q) and PI(q) shown in Fig. 3 for comparison with the ASAXS data. The ASAXS and isomorphous replacement methods agree (Fig. 4, ), giving further support for our interpretation of the isomorphous ion replacement data.
Figure 4.
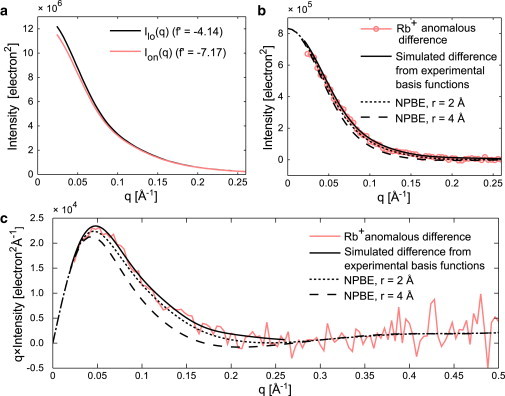
Anomalous x-ray scattering (ASAXS) data for DNA with Rb+ counterions. (a) Scattering profiles were measured on an absolute scale at two energies below the absorption edge of Rb. The real part of the anomalous scattering factor of Rb+ is given in the legend at each energy (labeled Ilo and Ion). (b) The anomalous difference between curves in (a), Ilo(q) − Ion(q), is compared with a curve synthesized from the experimental basis functions in Fig. 3 using Eq. 6, and with predictions from PB theory. (c) The profiles in (b) are plotted on q × I(q) versus q axes to facilitate visual comparison. To see this figure in color, go online.
Prediction of ion scattering terms by PB theory and comparison with experiment
Information about the shape of the ion atmosphere is contained within the partial form factors PMI(q) and PI(q) (Fig. 3, a and b, respectively). We solved the NPBE around the DNA to model the ion atmosphere and calculated PMI(q) and PI(q) as described in the Supporting Material. The only undetermined parameter in this electrostatics model is the Stern layer thickness, r, nominally equal to the radius of the hydrated counterion. Radii for hydrated ions considered here range from 3.8 to 4.5 Å (RM−O plus 1.4 Å for the water molecule radius; see Table 1 and Bai et al. (14)). However, previous DNA studies using the NPBE have assumed r = 2 Å (16). Therefore, we performed calculations using both r = 2 Å and r = 4 Å.
As expected, the shape of the predicted cross-term, PMI(q) (Fig. 3 a), depends on the value of r. Comparing data and calculations, r = 2 Å shows a slight improvement over r = 4 Å ( for r = 2 Å vs. for r = 4 Å). Stern-layer-dependent differences are also observed in the calculated ion-only term, PI(q) (Fig. 3 b), but the experimental PI(q) is too noisy to discriminate between models ( for r = 2 Å and for r = 4 Å). Finally, from the predictions for PI(q) and PMI(q), we calculated the anomalous difference signal using Eq. 6. Comparing the ASAXS data and the NPBE-based prediction (Fig. 4 c), we find that the agreement is poor for r = 4 Å () and improved for r = 2 Å ().
Theoretically, the cross-term PMI(q) is the Fourier transform of a distance histogram between electron density belonging to the macromolecule phase and that belonging to the ion atmosphere phase. Its width in reciprocal space is inversely related to the distances between DNA and counterions. Regardless of which value of the Stern radius is assumed, PMI(q) computed from the NPBE ion distribution decays more rapidly than the experimental curves. Therefore, compared to experimental data, the ions as predicted by NPBE appear to be farther away from the DNA on average. A similar conclusion can be drawn from the ASAXS data, where the predicted anomalous difference signal (a linear combination of PMI(q) and PI(q)) decays more rapidly than the experimental data. These observations point to a single conclusion: ion locations according to the NPBE are too far away from the DNA molecule on average.
SAXS data fit using an explicit ion/PB hybrid model
One hypothesis, consistent with observations above, is that PB theory underestimates the number of counterions present at the DNA surface. To further explore this idea, we tested whether alternate ion atmosphere models could provide improved agreement with the data. For this purpose, we adopt a hybrid explicit ion/PB modeling approach motivated by the tightly bound ion (TBI) model (44). In the TBI model, ions at the DNA surface are modeled explicitly using statistical mechanics, whereas those farther away are modeled using the NPBE. The number of localized ions in TBI depends on an interaction parameter. Since our goal is not to test TBI, but to generate a variety of physically motivated ion distributions, we modified the TBI approach in two important ways. First, we neglect the energetics of the tight-ion-DNA interaction and instead treat the number of localized ions as a fitting parameter. Second, we model a single low-energy distribution for each number of bound ions rather than the full partition function for all binding modes. Starting with a PB model, the procedure for placing counterions was as follows. First, an ion was placed at the site with the greatest magnitude of the electrostatic potential. Then, the NPBE was re-solved with this ion present, and the new potential guided the placement of a second ion, etc. The explicit ion distributions that result from applying this method show a preference for the minor groove (Fig. 5 a). As ions are added to the surface, the DNA charge is gradually neutralized, and the number of ions modeled by the NPBE, , decreases. Here, D stands for diffuse ions and S for surface-localized ions. Fig. 5 b shows the cumulative radial ion distribution corresponding to each model in Fig. 5 a. The total number of excess ions, , depends weakly on the number placed at the surface, . Within 50 Å from the central axis of the DNA helix, ranges from 36.7 () to 39.0 (). This small difference is within the experimental uncertainty of available ion counting methods, including equilibrium dialysis (14) and ASAXS (25). However, because the shape of the ion atmosphere depends on (Fig. 5 b), SAXS may be expected to discriminate between scattering profiles predicted for each model.
Figure 5.

Modeling of surface-localized ions and their effect on the diffuse ion atmosphere. (a) Ions were placed sequentially at sites near the surface of the DNA molecule with the greatest magnitude of the potential, and the NPBE was solved again after each ion addition (see text). DNA models with ions represented as r = 2 Å spheres are shown for 0, 5, 10, 15, and 20 (rendered using Pymol version 1.2r1, DeLano Scientific, Portland, OR). (b) For each model, the total number of ions within a cylindrical volume, Vcyl, with radius R centered on the helical axis of the DNA (inset) was computed. The number of excess ions includes the explicit ions shown in (a) and the excess ion density from the NPBE solution (open circles). To see this figure in color, go online.
We calculated SAXS profiles for each ion atmosphere model including explicit and diffuse (NPBE) ions (Fig. 5), as described in the Supporting Material, and compared them with the experimental SAXS profiles. Relative to the partial form factors, experimental SAXS curves have a greater signal/noise ratio and therefore represent a more challenging test of the model. The predictions from the hydrated DNA model with an NPBE-derived ion atmosphere with r = 2 Å (Fig. 6 a, ) do not agree well with the experimental data. The disagreement between model and data is most obvious for the electron-rich counterions Cs+ and Rb+, where the ion atmosphere represents a more significant part of the total scattering. From visual comparison of hybrid explicit/PB models and experiment for DNA in CsCl and RbCl salts (Fig. 6 a), the agreement improves and then worsens with increasing , showing a best-fit value between 10 and 15. More quantitatively, the total χ2 between model and experiment has a minimum in this range of (Fig. 6 b).
Figure 6.
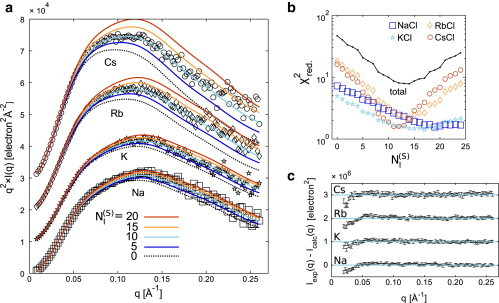
Adding surface-localized ions to DNA models improves the fit with isomorphous replacement SAXS profiles. (a) Theoretical scattering profiles were computed from the hydrated DNA model (Fig. 2a) plus an ion atmosphere modeled using the NPBE (dotted line) with varying numbers of explicit ions, , at the DNA surface (models shown in Fig. 5a). Profiles were computed for each ion type (Na, K, Rb, and Cs), plotted as I(q) × q2 to emphasize the high-angle features, and offset by 1 × 10⁴ for clarity. Experimental intensities (from Fig. 1) were rescaled slightly by a factor α to minimize the for each predicted curve (α deviated from 1 by <3%). In (a), α has the value corresponding to the theoretical profiles. (b) The agreement between experimental data and each theoretical profile was assessed using a reduced χ2, shown on a logarithmic scale for each experimental curve (NaCl, KCl, RbCl, and CsCl) and for the whole data set (total). (c) The residual for is plotted on a standard intensity scale with experimental error bars. Each curve is offset by 1 × 10⁶ for clarity.
The distinction between explicitly placed and diffuse ions in our model should not be overinterpreted. Given the limited resolution of our SAXS measurements, we expect them to be sensitive not to the precise ion configuration, but rather to the low-order moments of the ion distribution. In other words, the model in Fig. 5 a should not be viewed as a unique solution. To underscore this point, we repeated the model calculations with different parameter values and fit these to the data. Since the Stern radius is effectively an ad hoc parameter—within a physically meaningful range, it controls the surface potential and ion accessibility—we repeated the calculations with r = 2 − 4 Å (Figs. S2 and S3).The best-fit range of changed from ∼10 − 15 (r = 2 Å) to ∼20 − 25 (r = 3 Å) and ∼25 − 35 (r = 4 Å). However, the radius of gyration (second moment) of the ion atmosphere about the z axis of the DNA (RGZ) in each of these best-fit ranges is the same (Fig. S3, inset). Thus, RGZ is a more salient aspect of the ion atmosphere than from the perspective of the SAXS data. At best fit, the value of RGZ ≈ 16Å is significantly smaller than the value obtained from PB theory (for r = 2 Å, RGZ = 18 Å), and this conclusion is robust to the details of the calculation. This smaller value underscores our main point that ions must be closer to the surface than PB predicts.
Discussion
We developed methods for collecting and analyzing SAXS data using the contrast variation technique of isomorphous replacement. These methods built on previous experience with ASAXS by adding absolute-intensity calibration to the isomorphous replacement method. We found that the scattering strength of monovalent ions around DNA was well-described by an effective scattering factor calculated from their partial molar volumes, and we obtained excess ion numbers consistent with previous measurements. In addition, the number of water molecules displaced by DNA was measured by extrapolation to zero ion contrast. Isomorphous replacement data were decomposed into contributions from the ions and those from DNA alone. The DNA-only profile agreed with predictions from a B-form duplex model with hydration parameters set according to the experimentally measured number of water molecules displaced. However, when the NPBE was used to model the counterion atmosphere, we found significant disagreement between predicted x-ray scattering profiles and three related measurements: 1) the ion-DNA cross-term determined by heavy-atom substitution; 2) the ASAXS anomalous difference profiles; and 3) SAXS profiles for DNA with electron-dense counterions. All are sensitive to the spatial distribution of ions around DNA and suggest that the counterions are more closely localized to the DNA surface than predicted.
From a theoretical perspective, the failure of PB in this case is not surprising. However, previous x-ray scattering studies of DNA tend to confirm predictions from PB (15,21,24,45). There are several important differences between this study and those preceding it. First, we calculate the ion distribution using an all-atom representation of the DNA molecule, a clear improvement over previous studies that modeled DNA as a charged cylinder (21,24). In addition, we model hydration and excluded volume in real space instead of relying on the effective scattering factor approach (1,15). Earlier studies that used ASAXS to probe the ion atmosphere and all-atom NPBE for modeling reported qualitative (45) and quantitative (15) agreement with the data. The latter study also applied the isomorphous replacement method. However, the ionic strength, I, of the solution was 400 mM, as compared to 100 mM used here. Because the ionic strength affects the length scale of the diffuse ion atmosphere through the Debye screening length, proportional to I−1/2, we speculate that the SAXS measurements of Das et al. (15) were unable to distinguish between surface-localized and diffuse counterions because the diffuse ion atmosphere was too compact (screening length ∼5 Å) relative to the resolution of SAXS. In the low ionic strength measured here (screening length ∼10 Å), the spatial separation between diffuse and surface-localized ions is more pronounced, and therefore our measurement is more sensitive to the ion distribution.
Although x-ray scattering data for DNA have not previously shown disagreement with PB theory, theoretical and experimental studies have revealed limitations. Dialysis experiments show that PB theory does not account for the competition of Mg2+ against a background of 20 mM Na+ (14), even with modifications to account for the unequal ion sizes. In explicit-solvent MD simulations of RNA duplexes with monovalent cations, PB theory does not account for the ion distributions (17). Of the several simplifications inherent in PB theory, which ones, if corrected, would improve ion atmosphere models for DNA? PB theory neglects the possibility of direct interactions between ions and DNA involving full or partial dehydration of the ion (46). We find that the accuracy of the PB-derived SAXS profile increases as the Stern layer thickness decreases, which would seem to support the idea that the ions closest to the DNA are dehydrated. However, dehydration is unlikely to be important for the monovalent ions studied here, as NMR measurements show that Group I cations interact with DNA in a fully hydrated state (47). The mean-field PB theory also neglects ion-ion correlations, which may affect the free energy of ions occupying the highly concentrated region near the molecular surface. Chu et al. argue for the importance of ion correlations when there is a discrepancy between counterion competition data and size-modified NPBE calculations (16). In addition, PB theory neglects solvent degrees of freedom, treating water as a uniform dielectric medium. However, the water near molecular surfaces is highly perturbed, and it is thus unlikely to mediate electrostatic interactions in the same way as would bulk water. Interestingly, Kirmizialtin and co-workers have found that discrepancies between NPBE and all-atom MD for Na+ and Sr2+ ions around RNA could be largely corrected by artificially lowering the solvent dielectric constant near the surface (17). The physical justification for this correction is unclear, but it points to a central role of water in mediating ion-DNA interactions.
We posit that under physiological conditions, the ion atmospheres around DNA are strongly influenced by the electrostatic screening properties of the solvent near the molecular surface. These screened electrostatic fields are important determinants of the overall free energy for conformation changes and ligand interactions. SAXS-based measurements of the spatial distribution of ions and water around highly charged molecules such as DNA provides a valuable experimental constraint on theories that seek to account for such complex solvent interactions. The recent application of integral equation theory to macromolecular systems promises to provide a realistic treatment of all solvent degrees of freedom without the computational cost of explicit-solvent MD (19,48). The x-ray scattering methods presented here will be essential for testing these and other emerging first-principles computational models.
Author Contributions
L.P. designed the research, S.P.M and S.A.P. performed the research, and S.P.M. analyzed the data. All authors wrote the article.
Acknowledgments
We thank Cornell High Energy Synchrotron Source (CHESS) scientists Arthur Woll and Ken Finkelstein and CHESS staff for assistance with the experiments; members of the Pollack Lab including Julie Sutton, Andrea Katz, Joshua Tokuda, Yujie Chen, Joshua Blose, and Huimin Chen for help with x-ray data collection; and David Case, Hung Nguyen, Nathan Baker, Serdal Kirmizialtin, and Ron Elber for insightful discussions.
This work was supported by the National Institutes of Health (NIH) (R01-GM085062). CHESS is supported by the National Science Foundation (NSF) and by the National Institutes of Health/National Institute of General Medical Sciences (NIH/NIGMS) via NSF award DMR-0936384, and the MacCHESS resource is supported by NIGMS award GM-103485.
Editor: James Cole.
Supporting Material
Supporting Citations
References (49–59) appear in the Supporting Material.
References
- 1.Qiu X., Kwok L.W., Pollack L. Measuring inter-DNA potentials in solution. Phys. Rev. Lett. 2006;96:138101. doi: 10.1103/PhysRevLett.96.138101. [DOI] [PubMed] [Google Scholar]
- 2.Qiu X., Andresen K., Pollack L. Abrupt transition from a free, repulsive to a condensed, attractive DNA phase, induced by multivalent polyamine cations. Phys. Rev. Lett. 2008;101:228101. doi: 10.1103/PhysRevLett.101.228101. [DOI] [PMC free article] [PubMed] [Google Scholar]
- 3.Qiu X., Parsegian V.A., Rau D.C. Divalent counterion-induced condensation of triple-strand DNA. Proc. Natl. Acad. Sci. USA. 2010;107:21482–21486. doi: 10.1073/pnas.1003374107. [DOI] [PMC free article] [PubMed] [Google Scholar]
- 4.Bloomfield V.A. DNA condensation by multivalent cations. Biopolymers. 1997;44:269–282. doi: 10.1002/(SICI)1097-0282(1997)44:3<269::AID-BIP6>3.0.CO;2-T. [DOI] [PubMed] [Google Scholar]
- 5.Abouzar M.H., Poghossian A., Schöning M.J. Label-free electrical detection of DNA by means of field-effect nanoplate capacitors: experiments and modeling. Physica Status Solidi A Appl. Mater. Sci. 2012;209:925–934. [Google Scholar]
- 6.Poghossian A., Cherstvy A., Schöning M. Possibilities and limitations of label-free detection of DNA hybridization with field-effect-based devices. Sens. Actuators B Chem. 2005;111–112:470–480. [Google Scholar]
- 7.Stern E., Wagner R., Reed M.A. Importance of the Debye screening length on nanowire field effect transistor sensors. Nano Lett. 2007;7:3405–3409. doi: 10.1021/nl071792z. [DOI] [PMC free article] [PubMed] [Google Scholar]
- 8.Star A., Tu E., Valcke C. Label-free detection of DNA hybridization using carbon nanotube network field-effect transistors. Proc. Natl. Acad. Sci. USA. 2006;103:921–926. doi: 10.1073/pnas.0504146103. [DOI] [PMC free article] [PubMed] [Google Scholar]
- 9.Wong I.Y., Melosh N.A. Directed hybridization and melting of DNA linkers using counterion-screened electric fields. Nano Lett. 2009;9:3521–3526. doi: 10.1021/nl901710n. [DOI] [PubMed] [Google Scholar]
- 10.Grochowski P., Trylska J. Continuum molecular electrostatics, salt effects, and counterion binding—a review of the Poisson-Boltzmann theory and its modifications. Biopolymers. 2008;89:93–113. doi: 10.1002/bip.20877. [DOI] [PubMed] [Google Scholar]
- 11.Rocchia W., Alexov E., Honig B. Extending the applicability of the nonlinear Poisson-Boltzmann equation: multiple dielectric constants and multivalent ions. J. Phys. Chem. B. 2001;105:6507–6514. [Google Scholar]
- 12.Baker N.A., Sept D., McCammon J.A. Electrostatics of nanosystems: application to microtubules and the ribosome. Proc. Natl. Acad. Sci. USA. 2001;98:10037–10041. doi: 10.1073/pnas.181342398. [DOI] [PMC free article] [PubMed] [Google Scholar]
- 13.Holst M., Baker N., Wang F. Adaptive multilevel finite element solution of the Poisson-Boltzmann equation I. Algorithms and examples. J. Comput. Chem. 2000;21:1319–1342. [Google Scholar]
- 14.Bai Y., Greenfeld M., Herschlag D. Quantitative and comprehensive decomposition of the ion atmosphere around nucleic acids. J. Am. Chem. Soc. 2007;129:14981–14988. doi: 10.1021/ja075020g. [DOI] [PMC free article] [PubMed] [Google Scholar]
- 15.Das R., Mills T.T., Pollack L. Counterion distribution around DNA probed by solution x-ray scattering. Phys. Rev. Lett. 2003;90:188103. doi: 10.1103/PhysRevLett.90.188103. [DOI] [PubMed] [Google Scholar]
- 16.Chu V.B., Bai Y., Doniach S. Evaluation of ion binding to DNA duplexes using a size-modified Poisson-Boltzmann theory. Biophys. J. 2007;93:3202–3209. doi: 10.1529/biophysj.106.099168. [DOI] [PMC free article] [PubMed] [Google Scholar]
- 17.Kirmizialtin S., Silalahi A.R., Fenley M.O. The ionic atmosphere around A-RNA: Poisson-Boltzmann and molecular dynamics simulations. Biophys. J. 2012;102:829–838. doi: 10.1016/j.bpj.2011.12.055. [DOI] [PMC free article] [PubMed] [Google Scholar]
- 18.Tan Z.-J., Chen S.-J. Predicting electrostatic forces in RNA folding. Methods Enzymol. 2009;469:465–487. doi: 10.1016/S0076-6879(09)69022-4. [DOI] [PMC free article] [PubMed] [Google Scholar]
- 19.Giambaşu G.M., Luchko T., Case D.A. Ion counting from explicit-solvent simulations and 3D-RISM. Biophys. J. 2014;106:883–894. doi: 10.1016/j.bpj.2014.01.021. [DOI] [PMC free article] [PubMed] [Google Scholar]
- 20.Kirmizialtin S., Pabit S.A., Elber R. RNA and its ionic cloud: solution scattering experiments and atomically detailed simulations. Biophys. J. 2012;102:819–828. doi: 10.1016/j.bpj.2012.01.013. [DOI] [PMC free article] [PubMed] [Google Scholar]
- 21.Chang S.L., Chen S.H., Lin J. Measurements of monovalent and divalent counterion distributions around persistence length DNA fragments in solution. J. Phys. Chem. 1990;94:8025–8028. [Google Scholar]
- 22.Morfin I., Horkay F., Geissler E. Adsorption of divalent cations on DNA. Biophys. J. 2004;87:2897–2904. doi: 10.1529/biophysj.104.045542. [DOI] [PMC free article] [PubMed] [Google Scholar]
- 23.Pabit S.A., Finkelstein K.D., Pollack L. Using anomalous small angle x-ray scattering to probe the ion atmosphere around nucleic acids. Methods Enzymol. 2009;469:391–410. doi: 10.1016/S0076-6879(09)69019-4. [DOI] [PubMed] [Google Scholar]
- 24.Andresen K., Das R., Pollack L. Spatial distribution of competing ions around DNA in solution. Phys. Rev. Lett. 2004;93:248103. doi: 10.1103/PhysRevLett.93.248103. [DOI] [PubMed] [Google Scholar]
- 25.Pabit S.A., Meisburger S.P., Pollack L. Counting ions around DNA with anomalous small-angle x-ray scattering. J. Am. Chem. Soc. 2010;132:16334–16336. doi: 10.1021/ja107259y. [DOI] [PMC free article] [PubMed] [Google Scholar]
- 26.Greenfeld M., Herschlag D. Probing nucleic acid-ion interactions with buffer exchange-atomic emission spectroscopy. Methods Enzymol. 2009;469:375–389. doi: 10.1016/S0076-6879(09)69018-2. [DOI] [PubMed] [Google Scholar]
- 27.Strauss U.P., Helfgott C., Pink H. Interactions of polyelectrolytes with simple electrolytes. II. Donnan equilibria obtained with DNA in solutions of 1-1 electrolytes. J. Phys. Chem. 1967;71:2550–2556. doi: 10.1021/j100867a024. [DOI] [PubMed] [Google Scholar]
- 28.Grilley D., Soto A.M., Draper D.E. Direct quantitation of Mg2+-RNA interactions by use of a fluorescent dye. Methods Enzymol. 2009;455:71–94. doi: 10.1016/S0076-6879(08)04203-1. [DOI] [PMC free article] [PubMed] [Google Scholar]
- 29.Kuwamoto S., Akiyama S., Fujisawa T. Radiation damage to a protein solution, detected by synchrotron x-ray small-angle scattering: dose-related considerations and suppression by cryoprotectants. J. Synchrotron Radiat. 2004;11:462–468. doi: 10.1107/S0909049504019272. [DOI] [PubMed] [Google Scholar]
- 30.Luzzati V., Masson F., Saludjian P. X-ray scattering study of rigid polyelectrolyte solution. lithium, sodium, and cesium salts of DNA. Biopolymers. 1967;5:491–508. [Google Scholar]
- 31.Meisburger S.P., Sutton J.L., Pollack L. Polyelectrolyte properties of single stranded DNA measured using SAXS and single-molecule FRET: beyond the wormlike chain model. Biopolymers. 2013;99:1032–1045. doi: 10.1002/bip.22265. [DOI] [PMC free article] [PubMed] [Google Scholar]
- 32.Bardhan J.P. Biomolecular electrostatics—I want your solvation (model) Comput. Sci. Discov. 2012;5:013001. [Google Scholar]
- 33.Nielsen S.S., Møller M., Gillilan R.E. High-throughput biological small-angle x-ray scattering with a robotically loaded capillary cell. J. Appl. Cryst. 2012;45:213–223. doi: 10.1107/S0021889812000957. [DOI] [PMC free article] [PubMed] [Google Scholar]
- 34.Huang T.C., Toraya H., Wu Y. X-ray powder diffraction analysis of silver behenate, a possible low-angle diffraction standard. J. Appl. Crystallogr. 1993;26:180–184. [Google Scholar]
- 35.Orthaber D., Bergmann A., Glatter O. SAXS experiments on absolute scale with Kratky systems using water as a secondary standard. J. Appl. Crystallogr. 2000;33:218–225. [Google Scholar]
- 36.Hansen S. Bayesian estimation of hyperparameters for indirect Fourier transformation in small-angle scattering. J. Appl. Crystallogr. 2000;33:1415–1421. [Google Scholar]
- 37.Pollack L. SAXS studies of ion-nucleic acid interactions. Annu Rev Biophys. 2011;40:225–242. doi: 10.1146/annurev-biophys-042910-155349. [DOI] [PubMed] [Google Scholar]
- 38.Qiu X., Andresen K., Pollack L. Inter-DNA attraction mediated by divalent counterions. Phys. Rev. Lett. 2007;99:038104. doi: 10.1103/PhysRevLett.99.038104. [DOI] [PubMed] [Google Scholar]
- 39.Haynes W.M. 95th ed. CRC Press; Boca Raton, FL: 2014. CRC Handbook of Chemistry and Physics. [Google Scholar]
- 40.Marcus Y. Wiley; Hoboken, NJ: 1985. Ion Solvation. [Google Scholar]
- 41.Marcus Y. Ionic radii in aqueous solutions. Chem. Rev. 1988;88:1475–1498. [Google Scholar]
- 42.Anderson C.F., Record M.T., Jr. Ion distributions around DNA and other cylindrical polyions: theoretical descriptions and physical implications. Annu. Rev. Biophys. Biophys. Chem. 1990;19:423–465. doi: 10.1146/annurev.bb.19.060190.002231. [DOI] [PubMed] [Google Scholar]
- 43.Svergun D., Barberato C., Koch M.H.J. CRYSOL—a program to evaluate x-ray solution scattering of biological macromolecules from atomic coordinates. J. Appl. Crystallogr. 1995;28:768–773. [Google Scholar]
- 44.Tan Z.-J., Chen S.-J. Electrostatic correlations and fluctuations for ion binding to a finite length polyelectrolyte. J. Chem. Phys. 2005;122:44903. doi: 10.1063/1.1842059. [DOI] [PMC free article] [PubMed] [Google Scholar]
- 45.Pabit S.A., Qiu X., Pollack L. Both helix topology and counterion distribution contribute to the more effective charge screening in dsRNA compared with dsDNA. Nucleic Acids Res. 2009;37:3887–3896. doi: 10.1093/nar/gkp257. [DOI] [PMC free article] [PubMed] [Google Scholar]
- 46.Draper D.E. A guide to ions and RNA structure. RNA. 2004;10:335–343. doi: 10.1261/rna.5205404. [DOI] [PMC free article] [PubMed] [Google Scholar]
- 47.Braunlin W.H. NMR studies of cation-binding environments on nucleic acids. In: Bush Allen., editor. Vol. 5. Newnes; Burlington, MA: 1996. (Advances in Biophysical Chemistry). [Google Scholar]
- 48.Nguyen H.T., Pabit S.A., Case D.A. Accurate small and wide angle x-ray scattering profiles from atomic models of proteins and nucleic acids. J. Chem. Phys. 2014;141:22D508. doi: 10.1063/1.4896220. [DOI] [PMC free article] [PubMed] [Google Scholar]
- 49.Andresen K., Qiu X., Pollack L. Mono- and trivalent ions around DNA: a small-angle scattering study of competition and interactions. Biophys. J. 2008;95:287–295. doi: 10.1529/biophysj.107.123174. [DOI] [PMC free article] [PubMed] [Google Scholar]
- 50.Li L., Pabit S.A., Pollack L. Double-stranded RNA resists condensation. Phys. Rev. Lett. 2011;106:108101. doi: 10.1103/PhysRevLett.106.108101. [DOI] [PMC free article] [PubMed] [Google Scholar]
- 51.Blose J.M., Pabit S.A., Pollack L. Effects of a protecting osmolyte on the ion atmosphere surrounding DNA duplexes. Biochemistry. 2011;50:8540–8547. doi: 10.1021/bi200710m. [DOI] [PMC free article] [PubMed] [Google Scholar]
- 52.Cantor C.R., Warshaw M.M., Shapiro H. Oligonucleotide interactions. 3. Circular dichroism studies of the conformation of deoxyoligonucleotides. Biopolymers. 1970;9:1059–1077. doi: 10.1002/bip.1970.360090909. [DOI] [PubMed] [Google Scholar]
- 53.Tataurov A.V., You Y., Owczarzy R. Predicting ultraviolet spectrum of single stranded and double stranded deoxyribonucleic acids. Biophys. Chem. 2008;133:66–70. doi: 10.1016/j.bpc.2007.12.004. [DOI] [PubMed] [Google Scholar]
- 54.Park S., Bardhan J.P., Makowski L. Simulated x-ray scattering of protein solutions using explicit-solvent models. J. Chem. Phys. 2009;130:134114. doi: 10.1063/1.3099611. [DOI] [PMC free article] [PubMed] [Google Scholar]
- 55.Durchschlag H., Zipper P. Modeling the hydration of proteins: prediction of structural and hydrodynamic parameters from x-ray diffraction and scattering data. Eur. Biophys. J. 2003;32:487–502. doi: 10.1007/s00249-003-0293-z. [DOI] [PubMed] [Google Scholar]
- 56.Yang S., Parisien M., Roux B. RNA structure determination using SAXS data. J. Phys. Chem. B. 2010;114:10039–10048. doi: 10.1021/jp1057308. [DOI] [PMC free article] [PubMed] [Google Scholar]
- 57.Merzel F., Smith J.C. SASSIM: a method for calculating small-angle x-ray and neutron scattering and the associated molecular envelope from explicit-atom models of solvated proteins. Acta Crystallogr. D Biol. Crystallogr. 2002;58:242–249. doi: 10.1107/s0907444901019576. [DOI] [PubMed] [Google Scholar]
- 58.Dolinsky T.J., Nielsen J.E., Baker N.A. PDB2PQR: an automated pipeline for the setup of Poisson-Boltzmann electrostatics calculations. Nucleic Acids Res. 2004;32:W665–W667. doi: 10.1093/nar/gkh381. [DOI] [PMC free article] [PubMed] [Google Scholar]
- 59.Kell G.S. Isothermal compressibility of liquid water at 1 atm. J. Chem. Eng. Data. 1970;15:119–122. [Google Scholar]
Associated Data
This section collects any data citations, data availability statements, or supplementary materials included in this article.