

Abstract
AMPA receptors are the principal mediators of excitatory synaptic transmission in the mammalian central nervous system. The subunit composition of these tetrameric receptors helps to define their functional properties, and may also influence the synaptic trafficking implicated in long-term synaptic plasticity. However, the organization of AMPAR subunits within the synapse remains unclear. Here, we use postembedding immunogold electron microscopy to study the synaptic organization of AMPAR subunits in stratum radiatum of CA1 hippocampus in the adult rat. We find that GluA1 concentrates away from the center of the synapse, extending at least 25 nm beyond the synaptic specialization; in contrast, GluA3 is uniformly distributed along the synapse, and seldom extends beyond its lateral border. The fraction of extrasynaptic GluA1 is markedly higher in small than in large synapses; no such effect is seen for GluA3. These observations imply that different kinds of AMPARs are differently trafficked to and/or anchored at the synapse.
Keywords: AMPA receptors, GluA1, GluA3, synaptic organization, receptor trafficking
Introduction
Excitatory synaptic currents in the mammalian brain flow mainly through ionotropic glutamate receptors in the plasma membrane, which concentrate at the postsynaptic specialization. Fast excitatory neurotransmission is mediated primarily by the α-amino-3-hydroxy-5-methyl-4-isoxazolepropionic acid type of glutamate receptor (AMPAR) (Dingledine et al., 1999; Palmer et al., 2005). AMPARs are tetrameric heteromers assembled from the four subunits, GluA1–4 (also termed Gria1–4; Hollmann and Heinemann, 1994; Mano and Teichberg, 1998; Rosenmund et al., 1998; Gouaux, 2004). The most common subunit combinations at synapses in adult hippocampus are 2•GluA1+2•GluA2 (“GluA1/2”), and 2•GluA2+2•GluA3 (“GluA2/3”; Wenthold et al., 1996; Mansour et al., 2001; Lu et al., 2009).
AMPARs are quite mobile, at least in culture (Borgdorff and Choquet, 2002; Choquet, 2010), and can cycle into the postsynaptic membrane through both activity-dependent and constitutive insertion (Shepherd and Huganir, 2007; Santos et al., 2009); this trafficking is thought to play a major role in the regulation of synaptic strength (Huganir and Nicoll, 2013). Synaptic insertion may be subunit-dependent: GluA1-containing AMPARs have been reported to enter the plasma membrane in response to intense synaptic activity, whereas GluA2/3 receptors undergo constitutive recycling (Shi et al., 1999; Hayashi et al., 2000; Passafaro et al., 2001; Shi et al., 2001; Kessels and Malinow, 2009; Tanaka and Hirano, 2012; but see Granger et al., 2013; Nabavi et al., 2013).
AMPARs are removed from the postsynaptic membrane at a specialized zone lateral to the postsynaptic density (PSD, Racz et al., 2004; MacGillavry et al., 2011). In contrast, the site(s) of AMPAR insertion remain more contentious. Work in reduced systems has demonstrated insertion of AMPARs into the plasma membrane at a variety of locations, including the soma (Adesnik et al., 2007; Tao-Cheng et al., 2011), dendritic shaft (Yudowski et al., 2007; Jaskolski et al., 2009; Makino and Malinow, 2009; Patterson et al., 2010) and spine (Kopec et al., 2006; Yang et al., 2008; Kennedy et al., 2010), as well as at the synapse itself (Gerges et al., 2006). Contributing to this uncertainty, it remains unclear whether GluA1/2 and GluA2/3 receptors are inserted at different subcellular locations. If these receptors are trafficked to different regions of the postsynaptic membrane, differences in their organization might remain for some time, notwithstanding possible effects of diffusional mixing. Besides these dynamic effects, there may be sustained differences in subunit organization, since different scaffold proteins are reported to associate preferentially with different AMPAR subunits (Leonard et al., 1998; Valtschanoff et al., 2000).
Here, we use postembedding immunogold electron microscopy to study the organization of AMPAR subunits in axospinous synapses from CA1 stratum radiatum of the rodent hippocampus. We find that GluA1 concentrates away from the PSD center, extending into extrasynaptic regions of the plasma membrane, while GluA3 lies more centrally within the PSD. These data provide an independent line of support for the hypothesis that GluA1/2 receptors enter and exit the synapse via lateral diffusion, while GluA2/3 receptors traffic more directly into the PSD; moreover, this hitherto-unrecognized organizational complexity tangentially along the synaptic apposition raises the possibility that GluA3-containing AMPARs may play a distinct functional role in synaptic transmission.
Materials and Methods
Tissue Preparation
All procedures related to the care and treatment of animals were conducted according to institutional and NIH guidelines. For this study, we used material from six male Sprague-Dawley rats (Charles River Laboratories; Raleigh, NC), 2 to 4.5 months old; to assess whether synaptic organization might differ in the juvenile, we also used a 40-day-old rat (Supporting Information Table 1). To control for antibody specificity, we used material from two GluA1 KO mice, two GluA2 KO mice, and one C57BL/6 WT mouse (1–2 months old). GluA1 KO and GluA2 KO mice were generated as previously described (Jia et al., 1996; Zamanillo et al., 1999) and were initially maintained on a C57BL/6 background.
After anesthetizing rats with sodium pentobarbital (60 mg/kg), and mice with a mixture of ketamine (100 mg/kg) and xylazine (10 mg/kg), animals were intracardially perfused with saline, followed by ∼500 ml (for rats) and ∼50 ml (for mice) of a mixture of 2% paraformaldehyde and 2% glutaraldehyde in phosphate buffer. Brains were removed and postfixed 12 to 48 h in the same fixative at 4°C. Coronal sections were cut on a Vibratome at 200 to 250 μm and collected in cold phosphate buffer.
Sections pretreated with 0.1% CaCl2 in sodium acetate were cryoprotected in 30% glycerol overnight. Small blocks including stratum radiatum of CA1 were cut from sections and frozen in isopentane chilled with dry ice. Frozen blocks were immersed in 1.5% uranyl acetate in methanol at −90° C for 48 h within a freeze-substitution instrument (AFS, Leica). Blocks were gradually warmed to −45°C, then infiltrated with Lowicryl HM-20 (Electron Microscopy Science, Hatfield, PA) and polymerized under ultraviolet light.
Antibodies
Primary antibodies included affinity-purified rabbit polyclonal antibodies against AMPA receptor subunit 1 (GluA1; 0.8-2.0 μg/ml; Chemicon, Temecula, CA; AB1504) and AMPA receptor subunits 2 and 3 (GluA2–3 0.4–0.8 μg/ml; Chemicon; AB1506), and a mouse monoclonal antibody raised against AMPA receptor subunit 3 (GluA3; 0.5–1.0 μg/mL; Chemicon; MAB5416). The GluA1 antibody was raised against a peptide (SHSSGNPLGATGL) corresponding to the carboxyl terminus of human GluA1, conjugated to keyhole limpet hemocyanin. In Western blot of homogenate from cells that had been transfected with GluA1 cDNA, this antibody recognized a single band at ∼108 kDa corresponding to GluA1, while antibodies against GluA2, GluA3, or GluA4 produced no staining (Wenthold et al., 1992).
To determine whether results might depend on the epitope, we also performed pilot experiments with an anti-GluA1 antibody raised against its N-terminus. This rabbit monoclonal from Novus Biologicals (Littleton, CO; product E308, #NB110–57005), prepared against a peptide conjugate corresponding to a sequence between amino acids 25 to 75 of human GluA1, was used at a concentration of 1:100. The antibody recognizes a single band on Western blot corresponding to the predicted molecular weight (migrating slightly above 100 kDa), and has been used in previous studies (see e.g. van Vuurden et al., 2009).
The GluA2–3 antibody was raised against a peptide (EGYNVYGIESVKI) corresponding to the carboxyl terminus of rat GluA2, conjugated to bovine serum albumin. In Western blot of homogenate from transfected cells, this antibody recognized both GluA2 and GluA3 (whose C-terminal is nearly identical to GluA2) with equal efficacy, but did not recognize GluA1 (Wenthold et al., 1992).
The GluA3 antibody was raised against a fusion protein containing amino acids 245 to 451 of GluA3. Its specificity has been demonstrated in Western blots of human embryonic kidney cell lysates transfected with various AMPAR cDNAs; the antibody reacted with lysate containing GluA3, but not lysate from cells expressing GluA1, GluA2, or GluA4 (Moga et al., 2003).
Postembedding Electron Microscopy
Postembedding immunogold labeling was performed as outlined in Valtschanoff et al. (2000). Sixty nanometer sections were cut from the polymerized tissue blocks and collected on nickel mesh grids. For serial-section electron microscopy, 50 nm sections were collected on Formvar-coated nickel slot grids to preserve cutting order. Grids were pretreated with 4% p-phenylenediamine in TRIS-buffered saline with 0.005% Tergitol NP-10 (TBSN), pH 7.6 before treatment with 1% bovine serum albumin in TBSN, pH 7.6, followed by overnight treatment with the primary antibody. Grids were subsequently treated with 1% normal goat serum in TBSN pH 8.2, after which a gold-conjugated secondary was applied (BBI goat anti-rabbit F(ab')2 IgG, conjugated to 10 nm colloidal gold, from Ted Pella, Redding, CA). For double-labeling, we were able to combine primary antibodies to GluA1 (1 μg/ml) with GluA3 (0.77 μg/ml), since they were raised in two different species. Likewise, the secondary antibodies (goat anti-rabbit IgG conjugated to 20 nm gold particles, and goat anti-mouse F(ab')2 conjugated to 10 nm gold particles) were mixed together. After immunoprocessing, the sections were post-stained using uranyl acetate and Sato's lead salts. Grids were examined on a Philips Tecnai (FEI, Hillsboro, OR) electron microscope at 80 kV; images were collected with a cooled CCD camera (Gatan, 12 bits, 1,024 × 1,024 pixels).
Analysis of Immunogold Labeling
To determine the fraction of synapses immunopositive for GluA1, GluA2–3, and GluA3, we examined synapses from random fields of CA1 stratum radiatum, counting the first 100 asymmetric synapses found in a grid square. Synapses containing at least one gold particle within 100 nm of the PSD were counted as “positive”; all other synapses were considered “negative.” We examined 500 synapses for each antibody on WT, GluA1 KO, and GluA2 KO tissue. These data were used to calculate the fraction of synapses immunopositive for each antibody; for statistical analysis, each grid square was taken as a single sample.
To determine AMPAR position within the PSD, we surveyed the proximal half of CA1 stratum radiatum, collecting electron micrographs from randomly selected synapses with a clearly-defined postsynaptic membrane that contained gold particles within 100 nm of the PSD. Using ImageJ, we measured “axodendritic” position, the distance from the center of each gold particle to the postsynaptic plasma membrane; and “lateral” position, the distance (measured tangentially along the plasma membrane) from the particle to each edge of the postsynaptic density (Fig. 1). From these data, we calculated the “normalized lateral” (NL) position for each particle, using the following formula:
Figure 1.
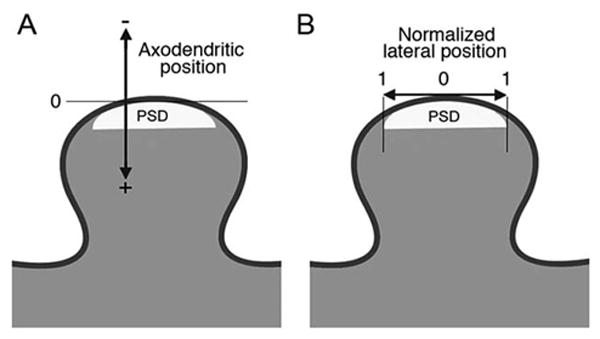
Procedure for defining positions of gold particles. (A) Cartoon diagram of a dendritic spine. Arrow indicates the axis, zero-point, and sign for measurements of “axodendritic” position of immunogold labeling. (B) Arrow indicates the axis for measurement of “lateral” position. “Normalized lateral position” is defined by 0 (at the center of the synapse) and 1 (at the edge of the PSD).
Thus, an NL position of 0 corresponds to a particle lying at the middle of the synapse, and a position of 1.0 to a particle lying at its lateral edge (for further details, see Kharazia and Weinberg, 1997; Valtschanoff and Weinberg, 2001). Finding that the pattern of labeling in the 40-day-old animal closely resembled that of the six adult rats (Supporting Information Table 1), we combined data from all seven rats in our analyses.
For axodendritic position, the postsynaptic direction was denoted by positive numbers, and the presynaptic direction by negative numbers (Fig. 1A). To restrict the sample to gold particles associated with the synapse, we limited analysis of axodendritic position to gold particles whose NL position was less than 1.5 and did not lie more than 60 nm away from the edge of the PSD. When calculating the mean axodendritic position, we wanted to evaluate receptors that plausibly might be inserted into the plasma membrane, and therefore considered only particles lying in the range from −50 to +50 nm in the axodendritic axis. For graphical representation of axodendritic position, we broke the data into 5 nm bins. To minimize noise, we smoothed these data with a three-point weighted running average,
Data analysis was performed in Excel (Microsoft, Redmond, WA); graphs were prepared with KaleidaGraph (Synergy Software, Reading, PA), and statistical significance was assessed using Data Desk (Data Description, Ithaca, NY). Values are reported as mean positions or normalized positions ± standard errors, calculated either by treating each gold particle as a sample (to provide an optimal estimate of the population mean, in the face of random measurement noise), or by calculating averages for each animal and treating these average values as single samples (to permit robust testing of possible differences between data sets). To assess statistical significance of differences in position or normalized position, we used two-sided paired t tests. We also computed ratios of particles in different regions of the synapse (see Results); to assess significance of difference within these ratiometric data sets, we used the Wilcoxon signed-rank test.
Modeling
To explore how measurement noise might have modified results, we performed modeling studies, adding Gaussian noise to experimentally-determined particle positions. To determine whether nonuniformities detected in our experiments might have arisen as an unforeseen consequence of measurement noise, we added Gaussian noise to random uniformly-distributed particles. Random numbers were generated in Data-Desk, arithmetical calculations were performed with Excel, and statistics were computed and graphs prepared with Kaleidagraph.
Serial Section Analysis
To maximize sample size and statistical power, most EM images were collected from randomly selected synapses on mesh grids. Serial section analysis offers important advantages, but besides its labor-intensive nature, we find that immunoreaction is impaired when serial sections are used (perhaps because only one side of the thin section is exposed to antibody). Nevertheless, to assess whether reliance on single sections might have led to misleading conclusions, we performed a limited serial section analysis, collecting several series of electron micrographs of the same area from grids containing ∼50 nm thick serial sections immunoreacted for either GluA1 or GluA3. We chose areas containing landmarks, to simplify tracking the same synapse. For analysis, labeled synapses were examined across multiple sections until no longer visible; PSD length and gold particle position(s) were measured. In addition to our standard approach for measurement of normalized lateral position, we also computed a modified normalized lateral position, after reconstructing en face models of each synapse from the serial section data (see Results for details).
Image Preparation
Figures were composed, and contrast and brightness adjusted, with Adobe Photoshop CS (v 9.0.2, Adobe Systems, Mountain View, CA). All processing of micrographs was applied uniformly across the entire image.
Results
Tissue processed with our freeze-substitution protocol exhibited good ultrastructural preservation, while retaining immunoreactivity against all three AMPAR antibodies. Contrast was weaker than typical for standard material that has been post-fixed with osmium tetroxide, but membranes were clear and synapses were well defined. Immunogold label for all three antibodies showed a clear association with asymmetric synapses, concentrating in the vicinity of the postsynaptic membrane (Fig. 2). Synaptic labeling for GluA2–3 was particularly abundant, whereas GluA3 labeled fewer synapses. We had the impression that gold particles coding for GluA1 and GluA2–3 typically lay just cytoplasmic to the plasma membrane, whereas particles coding for GluA3 often lay in the synaptic cleft, but variability of the labeling made it difficult to reach firm conclusions from visual inspection.
Figure 2.
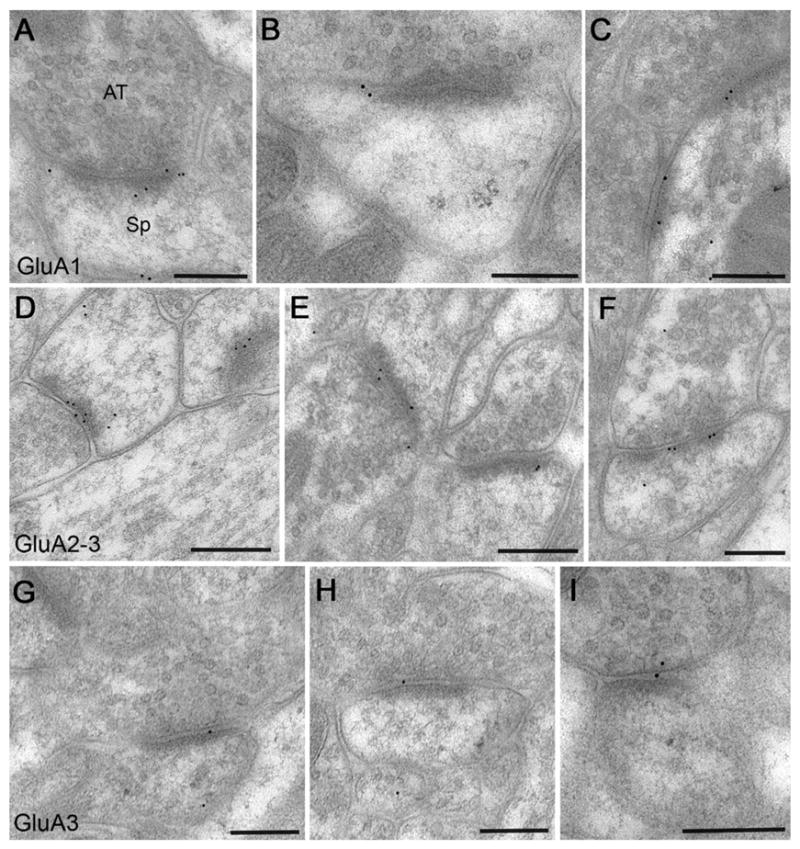
Postembedding immunogold labeling for AMPAR subunits. Micrographs illustrate the material used in this study. All images are from the proximal half of stratum radiatum of CA1 hippocampus, from adult rat. Gold particles (black dots) are ∼10 nm in diameter. Material in top panel (A–C) was reacted with an antibody to GluA1; in the middle panel (D–F), with an antibody recognizing both GluA2 and GluA3; and in bottom panel (G–I), with an antibody to GluA3. Most of the labeling is clearly associated with asymmetric synapses. (A) An axospinous synapse strongly labeled for GluA1 (presynaptic axon terminal is at top). (B) Large axospinous synapse; labeling lies near the left edge of the synaptic specialization. (C) A small dendritic shaft (identified by microtubules cut en face, and by a mitochondrial profile at bottom right of image) receives two immunopositive synaptic contacts. Axodendritic synapses were excluded from our analysis, which focused exclusively on axospinous synapses. (D, E) Each micrograph shows two axospinous synapses, both immunopositive for GluA2–3. (F) Favorable plane of section through an axospinous synapse allows clear visualization of the entire plasma membrane of the spine. Besides labeling associated with the postsynaptic specialization, a particle is also visible within the spine cytoplasm. Synapses in F and at left in D exhibit incomplete perforation; we excluded synapses with complete perforation in the plane of section from analysis of lateral position. (G–I) Labeling for GluA3 was weaker than for the other antibodies. Synaptic labeling often lay outside the plasma membrane of the spine. Scale bars=200 nm.
Validation of Immunolabeling
To verify antibody specificity, we performed immunogold staining in GluA1 KO and GluA2 KO mice, focusing on CA1 stratum radiatum. These results must be treated with caution, since the observed fraction of immunolabeled synapses likely underestimates the true fraction of synapses that contain the antigen. The measured value is instead a composite estimate that reflects antibody binding efficacy, the fraction of synapses that contain the subunit probed, and the density of subunit protein within these synapses. However, while absolute values are difficult to interpret, differences detected between comparable tissue samples should reflect underlying differences in protein expression.
We found that the GluA1 antibody labeled 47.2% of synapses in grids prepared from a WT mouse, whereas only 6.4% of synapses were labeled in the GluA1 KO, implying that ∼86% (100% × (1–6.4/47.2)) of label in the WT mouse reflected authentic GluA1 (Table 1). The reduction in label distant from the synapse was less noticeable; we presume this reflects background unrelated to specific antibody binding. Likewise, the GluA2–3 antibody (expected to recognize both GluA2 and GluA3) labeled 54% of WT synapses, but only 11% of synapses in the GluA2 KO mouse (Table 1). This fivefold reduction in labeling also supports the specificity of the immunogold signal, especially considering that much of the signal remaining in the GluA2 KO likely reflects authentic GluA3 protein.
Table 1. Effects of AMPAR Subunit Deletion on Immunogold Labeling.
| WT (N = 1) | GluA1 KO (N = 2) | GluA2 KO (N = 2) | |
|---|---|---|---|
| GluA1 | 47.2±3.2% | 6.4±0.2% (0.14) | 26.0±1.7% (0.56) |
| GluA2–3 | 54.0±2.2% | 45.0±1.9% (0.83) | 11.4±1.8% (0.21) |
| GluA3 | 42.4±1.2% | 26.8±2.2% (0.63) | 22.6±2.7% (0.53) |
Percent of synapses immunopositive for each antibody listed (±standard error, from N = 5 grid squares, 100 synapses/square). Numbers in parentheses represent the fraction of labeling remaining in knockout material, compared with wild-type controls.
Notwithstanding the small sample, these results may also have biological implications. The 44% reduction in GluA1-positive synapses in the GluA2 KO presumably reflects the predominance of GluA1/GluA2 heteromeric receptors in the intact animal (Wenthold et al., 1996), though we cannot exclude the possibility of GluA1 homomers in the WT mouse, nor the aberrant expression of GluA1 homomers in the GluA2 knockout (Sans et al., 2003; Rozov et al., 2012). Likewise, the synaptic GluA3 remaining in the GluA2 KO animal might reflect aberrant presence of GluA1/GluA3 receptors after deletion of GluA2 (Table 1; Sans et al., 2003). However, the 37% reduction of synaptic GluA3 in the GluA1 KO mouse raises the possibility that GluA1/GluA3 receptors are present in the hippocampus even in the normal animal.
We were unable to obtain GluA3 KO mice. To assess specificity of the GluA3 antibody, we instead compared immunogold labeling for GluA2–3 and GluA3 in cerebellar cortex, whose layers (easily recognized at the electron microscope) express mRNA for different AMPAR subunits at markedly different levels. In situ hybridization indicates high levels of gene expression for both GluA2 and GluA3 in the molecular layer; in contrast, GluA3 expression is substantially reduced in the granule cell layer, while message for GluA2 remains high (Lein et al., 2007). Therefore, one would predict that a greater fraction of synapses would label for GluA3 in the molecular layer than in the granule cell layer, while comparable fractions would label for GluA2 in both layers. Consistent with this expectation, 53% of synapses in the molecular layer labeled for GluA3, whereas only 22% of synapses labeled for GluA3 in the granule cell layer. In contrast, there was little difference in GluA2–3 labeling between the molecular and the granule cell layers (43% vs. 40% immunopositive, respectively).
In summary, our data, together with the extensive published work using these antibodies, lead us to conclude that the large majority of the observed labeling represents authentic AMPAR subunit protein.
Relationship of AMPAR Subunits to the Postsynaptic Plasma Membrane
We measured the axodendritic position of gold particles coding for GluA1, GluA2–3, and GluA3 subunits in synapses from rat stratum radiatum (see Fig. 1A). The shapes of the axodendritic distributions for all three antibodies were similar bell-shaped curves, with a modest tail extending into the postsynaptic cytoplasm (Fig. 3). Considering only particles within the range of ±50 nm from the plasma membrane (thus focusing on receptor embedded within the plasma membrane), the standard deviation of the distribution for GluA1 was 19.2 nm; for GluA2/3, σ=20.0 nm; and for GluA3, σ=20.4 nm. To confirm our impression that these distributions were approximately Gaussian, we replotted the data as cumulative distributions, with abscissa scaled according to the normal distribution, confirming that all three distributions were nearly linear, with slope very close to that of Gaussian normal distributions with 20 nm standard deviation (Supporting Information Fig. 1).
Figure 3.
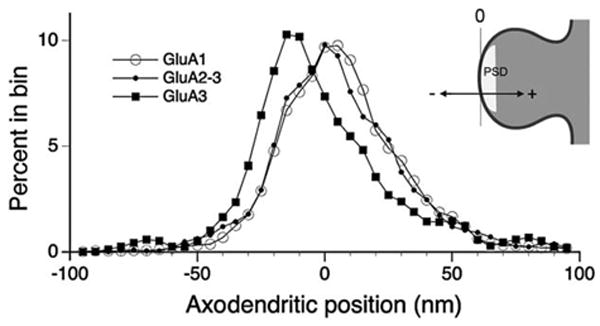
Axodendritic distribution of labeling for three antibodies. 0 on the x-axis of the graph corresponds to the postsynaptic membrane; positive numbers are in the postsynaptic direction, and negative numbers are in the presynaptic direction (see diagram at upper right). Data were computed for 5 nm bins; to reduce noise, the curves were smoothed using a three-point weighted moving average (see Methods for details). Labeling for both GluA1 and GluA2–3 was predominantly postsynaptic, while GluA3 label concentrated in the synaptic cleft. These data are shown in a different form in Supporting Information Figure 1.
Mean positions for both GluA1 and GluA2–3 were postsynaptic; considering all gold particles lying within 50 nm of the postsynaptic membrane, GluA1 and GluA2–3 averaged+4.2±0.6 nm (N = 1,064) and +3.3±0.6 nm (N = 1,044 particles) inside the postsynaptic membrane, respectively. In contrast, GluA3 lay predominantly within the synaptic cleft, with a mean value of −4.3±0.8 nm from the postsynaptic membrane (N = 663). The mean axo-dendritic position of GluA3 was significantly different from that of both GluA1 and GluA2–3 (P < 0.001 for GluA1 vs. GluA3, P < 0.005 for GluA2–3 vs. GluA3, two-sided paired t-test; N = 7 animals), whereas GluA1 was not significantly different from GluA2–3.
These different axodendritic positions likely reflect the different placement of the epitopes recognized by the three antibodies: the GluA1 and GluA2–3 antibodies were raised against peptides corresponding to the C terminals (predicted to lie within the postsynaptic cytoplasm when the receptor is inserted into the plasma membrane), whereas the GluA3 antibody was raised against a peptide corresponding to an extracellular region near the N terminal. To verify that this difference indeed reflects the topology of the protein, we performed experiments with a GluA1 antibody raised against an N-terminal region (after validating its specificity on knockout mouse material; data not shown). For gold particles lying within ±50 nm of the plasma membrane, the mean position of immunolabeling for this antibody was −6.5±1.6 nm (N = 122).
Together, these results suggest that the large majority of immunogold-detected AMPARs lying within 50 nm of the postsynaptic plasma membrane are embedded within the plasma membrane.
Tangential Organization of AMPAR Subunits
We next wanted to compare the tangential organization of labeling for different AMPAR subunits along the synapse. To get a qualitative impression, we examined material double-stained for GluA1 and GluA3 (see Materials and Methods for details). In this material it was easy to identify individual synapses that were unlabeled, single-labeled for either antibody, or double-labeled. We noted many cases where GluA1 lay at or beyond the lateral edge of the synapse, associated with extrasynaptic plasma membrane; this was much less commonly seen for GluA3 (Supporting Information Fig. 2). Unfortunately, results were variable and often noisy (as typical with double-labeling in our hands); consequently, we considered only single-labeled material for quantitative analysis.
Since our main goal was to characterize the organization of functional AMPARs, we considered only gold particles likely to reflect receptor that had been inserted into the plasma membrane. Accordingly, for GluA1 and GluA2–3 antibodies (both targeted against the cytoplasmic C terminus) we considered only particles lying in a 50 nm window between −20 nm and +30 nm from the postsynaptic membrane (i.e., within ∼25 nm of the likely position of the relevant epitope, as predicted theoretically and confirmed empirically). Likewise, for the GluA3 antibody (targeted against an extracellular N-terminal region) we considered only particles lying between −30 nm and +20 nm. Nearly all AMPA receptors in hippocampus are either GluA1•GluA2 or GluA2•GluA3 heteromers (Wenthold et al., 1996); accordingly, we focused mainly on the relative pattern of labeling of GluA1 and GluA3, as selective probes for the two major types of heteromeric receptors.
Analysis of normalized lateral data (see Fig. 1B) revealed that labeling for GluA1 tended to lie in the periphery of the synapse, with a mean NL position of 0.64±0.01 (N = 860). Labeling for GluA3 concentrated significantly more centrally, with a mean NL position of 0.50±0.01 (N = 504; P < 0.005, paired t-test, N = 7 animals). Labeling for GluA2–3 lay between GluA1 and GluA3, with an average NL position of 0.59±0.01 (N = 816), as would be expected, since this antibody recognizes both GluA1/2 and GluA2/3 heteromeric receptors. Notwithstanding these differences, the density of labeling associated with the plasma membrane declined to very low levels within 50 nm beyond the edge of the synaptic specialization, for all three antibodies.
We also measured the NL position of AMPAR subunits in KO mice (though these data must be treated with caution, considering the restricted sample size, as well as possible species differences). In the GluA2 KO, the average NL position of GluA1, GluA2–3, and GluA3 were 0.62, 0.55, and 0.52, respectively; close to the values for WT rats. In contrast, in the GluA1 KO animal, the NL position of GluA2–3 changed from 0.59 (for WT) to 0.47 (see Supporting Information Table 2). Thus, labeling for GluA2–3 was markedly more central than in WT animals, presumably because the GluA1 KO lacks GluA1/2 heteromers, so only GluA2/3 receptors are detected by the antibody. We speculate that the slight change in GluA2–3 position in the GluA2 KO might reflect traces of GluA1/3 heteromer at the synapse (Sans et al., 2003).
Our postembedding method, which unmasks antigen by the mechanical disruption caused by cutting thin sections, is thought to expose epitopes in an unbiased manner independent of tissue consistency or protein-protein interactions. Nevertheless, to control for the possibility that the difference observed between GluA1 and GluA3 might reflect some peculiarity of the cytoplasmic PSD matrix encountered by the GluA1 antibody, but not by the GluA3 antibody (which was raised to an extracellular epitope), we examined the NL position of GluA1 as defined by an N-terminus antibody. Synaptic labeling detected with this antibody was predominantly extracellular, as expected (see above); importantly, the mean NL position of GluA1 estimated by the N-terminus antibody was 0.65, very similar to that of the C-terminal antibody. We conclude that our estimate of NL position was not significantly affected by the tissue microenvironment of the antigen.
The GluA1 antibody is expected to label GluA1/2 receptors but not GluA2/3 receptors, while the GluA3 antibody should label GluA2/3 receptors but not GluA1/2 receptors. Since the GluA2–3 antibody can bind to AMPARs containing either GluA1/2 or GluA2/3 subunits, we focused on results from the GluA1 and GluA3 antibodies. Labeling for GluA1 was diminished at the center of the synapse, and extended beyond the limits of the PSD. In contrast, labeling for GluA3 concentrated in the central part of the synapse, with very little labeling beyond its lateral edge (Fig. 4A). The differential pattern of labeling is more clearly illustrated by the cumulative probability plot shown in Figure 4B, which reveals that the two distributions diverge between ∼0.2 and ∼0.6 NL units. To compare these differences further, we computed the “NL position ratio,” defined as
Figure 4.
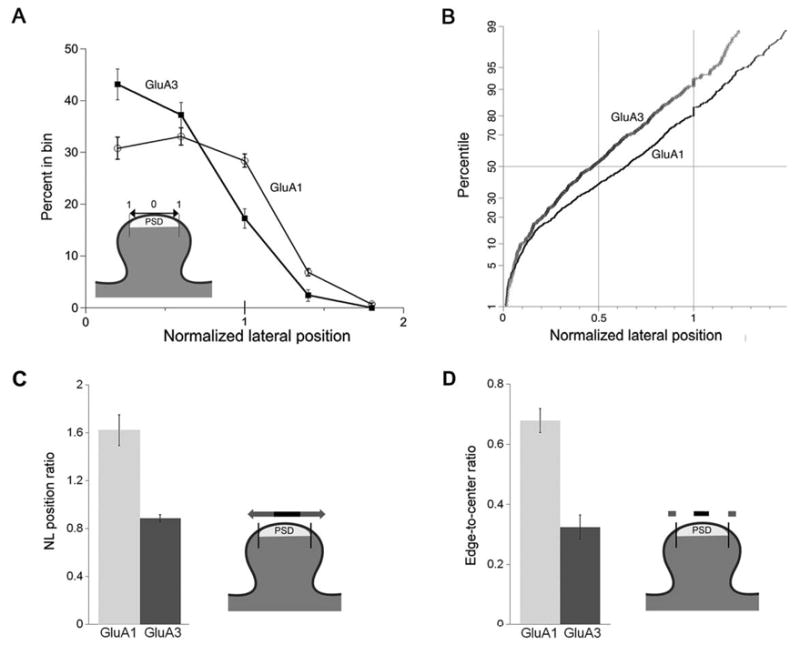
Lateral positions of GluA1 and GluA3 along the synapse. (A) Graphs of normalized lateral position. Data were broken into five bins; 0 corresponds to the center of the PSD, and 1 corresponds to its edge (see diagram). Labeling for GluA1 is present at high levels all along the synapse. It increases slightly away from the center, and extends beyond the edge of the PSD. In contrast, GluA3 concentrates more centrally. The fraction of synapses labeled for GluA3 was significantly greater than for GluA1 in the 0–0.4 bin (P < 0.01), and significantly less than GluA1 in the 0.8–1.2 bin (P < 0.001) and the 1.2–1.6 bin (P < 0.005; paired t-tests, N = 7 animals). (B) To avoid possible distortions arising from binning, this graph shows normalized lateral positions for GluA1 and GluA3, plotted as cumulative distributions (percentile scaled to correspond to the normal distribution). A slight jog in both curves at NL position =1.0 reflects rounding error associated with measurements. The GluA3 curve lies above the GluA1 curve, showing that NL values for GluA3 are generally smaller than those for GluA1. The two curves diverge in the region from 0.2 to 0.6 units. (C) Histogram comparing the “NL position ratio” (the number of postsynaptic membrane-associated gold particles with NL position >0.5, divided by the number of particles with NL position ≤0.5) for GluA1 and for GluA3 (see diagram). The NL position for GluA1 was significantly larger than for GluA3 (N = 7 animals, Wilcoxon; P < 0.05). (D) Histogram comparing the “edge-to-center ratio” (the number of particles lying 0–25 nm beyond each edge of the synapse, divided by the number of particles lying in the central 50 nm of the synapse; see diagram). The edge-to-center ratio was significantly larger for GluA1 than for GluA3 (P < 0.05; Wilcoxon).
for both GluA1 and GluA3 (Fig. 4C). The NL position ratio for GluA1 was almost double that for GluA3 (1.62 vs. 0.89; N = 7 animals, P < 0.05, Wilcoxon), confirming that GluA1 lies significantly closer than GluA3 to the PSD edge.
The use of normalized lateral positions facilitated comparisons among synapses of different sizes. However, we were concerned that at least part of the observed effect might represent an artifact arising from the normalization procedure. To exclude this possibility, we also examined the data without normalization, comparing the number of immunogold particles lying just beyond the edge of the synapse with the number of particles in its center, for both antigens. Accordingly, we computed the “edge-to-center” ratio, defined as
(Fig. 4D). The edge-to-center ratio for GluA1 was more than twice that for GluA3 (0.68 vs. 0.32; P < 0.05, Wilcoxon), confirming that significantly more GluA1 than GluA3 lies beyond the edge of the synapse.
Impact of Measurement Noise
Our estimates of antigen location are affected by random noise (arising largely from the IgG bridges required for immunocytochemistry; see Kellenberger and Hayat, 1991). Might the observed differences between GluA1 and GluA3 arise as a consequence of this measurement noise, rather than representing a genuine biological difference between the two subunits? This seems unlikely, since the standard deviation of axodendritic position (a proxy for measurement error in the tangential axis) was very similar for GluA1 and GluA3; in fact, the experimentally-determined axodendritic distributions for all three antibodies were close to Gaussian normals with standard deviation of 20 nm (see Fig. 3 and Supporting Information Fig. 1). Since the large majority of AMPA receptors close to the postsynaptic membrane are probably inserted into the plasma membrane, these data suggest that our measurements may include up to ∼20 nm of random noise.
We performed simulation experiments to determine more directly whether the inclusion of 20 nm of noise to our estimates of antigen position in the tangential axis might influence our conclusion that synaptic GluA1 tends to lie more lateral than GluA3. We tested the effect of adding Gaussian noise (σ = 20 nm) to our measurements of lateral position, performing five independent simulations. We found that estimates of mean lateral position were minimally impacted by additional noise, suggesting that noise of the magnitude we expect based on axodendritic measurements was very unlikely to have an appreciable impact on estimates of lateral position (Table 2). We conclude that the observed differences between GluA1 and GluA3 cannot be explained by measurement error.
Table 2. Effects of Noise on Measures of Lateral Position.
| GluA1 | GluA1+noise | GluA3 | GluA3+noise | Uniform+noise | |
|---|---|---|---|---|---|
| NL position | 0.64±0.01 | 0.65±0.01 | 0.51±0.03 | 0.52±0.005 | 0.50±0.003 |
| NL ratio | 1.62±0.12 | 1.56±0.01 | 0.89±0.06 | 0.90±0.02 | 1.01±0.02 |
| E-C ratio | 0.68±0.12 | 0.64±0.03 | 0.32±0.09 | 0.34±0.04 | 0.30±0.05 |
Experimental data from N = 7 animals; models are from five independent simulations that include Gaussian noise (σ = 20 nm).
However, with substantial measurement noise, even a uniform distribution strictly limited to the borders of the synapse might seem to lie away from the PSD center; could this account for our GluA1 results? To test this possibility, we generated a uniform lateral distribution of particles strictly confined to the synapse, using PSD lengths corresponding to those of our experimental measurements of 860 particles coding for GluA1, and explored the impact of random noise. We found that adding 20 nm of Gaussian noise to a uniform distribution (Table 2, last column) had only subtle effects on lateral position estimates, and could not account for the accumulation of GluA1 away from the center of the synapse. In contrast, we found that a noisy uniform distribution exhibited a lateral distribution close to that experimentally observed for GluA3, suggesting that our impression that GluA3 concentrates at the center of the synapse may at least in part represent an artifact of the measurement procedure. Nevertheless, we conclude that measurement noise of magnitude comparable to that encountered in this study could not account for more than a small fraction of the observed differences in lateral position between GluA1 and GluA3.
Serial Section Analysis
When examining single sections, it is impossible to know whether short synaptic profiles represent small PSDs, or instead originate from thin sections that were cut near the edges of larger PSDs; no doubt our experimental sample includes both. This effect should introduce little or no error to the mean NL position if the antigen in fact concentrates at the center of the synapse, but could lead to an underestimate of NL position if the antigen actually concentrates near the edge of the synapse. To explore whether this problem might have affected our conclusions, we performed a pilot study using serial-section electron microscopy (Figs. 5A–F). The distribution of receptor subunits laterally along the synapse was similar to that from EM of single sections: labeling for GluA1 extended beyond the PSD edge, while GluA3 concentrated in the center of the PSD (Fig. 5G); moreover, the NL position of GluA1 (0.61±0.04, N = 137 particles) was significantly larger than that of GluA3 (0.46±0.04, N = 89; P < 0.005, t-test). To assess whether data from the z-axis “edges” of the synapse (i.e., the first and last sections in a series before the PSD is no longer visible) might affect our conclusion, we compared NL position estimates based on the entire data set, with NL positions computed after excluding data from thin sections collected at the edge of the synapse, finding only modest effects (Fig. 5H). Thus, for data without the edge sections, the mean NL position for GluA1 was 0.59 ± 0.04 (N = 81), and for GluA3, the mean position was 0.44 ± 0.04 (N = 54); the NL position for GluA1 remained significantly larger than for GluA3 (P < 0.02).
Figure 5.
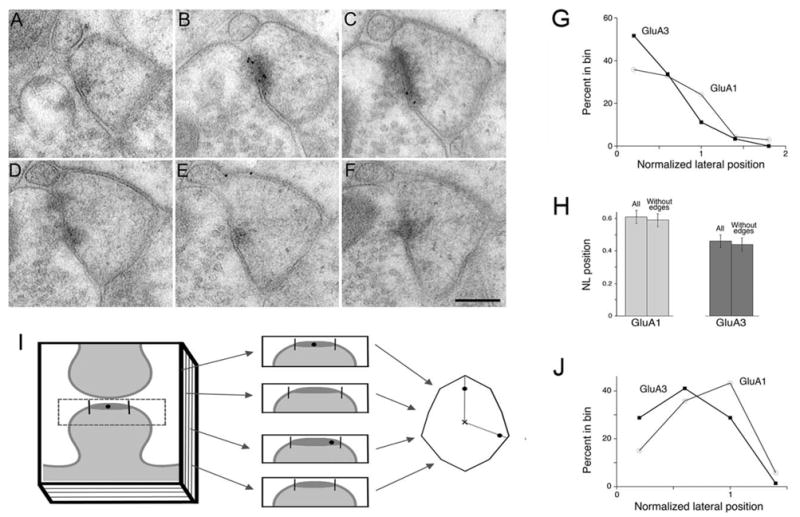
Analysis of lateral position in serial thin sections. (A–F) Micrographs show serial ∼60 nm sections through a synapse, immunoreacted for GluA1. In (A), a well-defined synapse is undetectable, though an area of increased electron density near the postsynaptic membrane is visible, corresponding to the edge of the PSD. PSDs in (B) and (C) label for GluA1; note that gold particles in (B) seem to lie in the middle of the PSD, but are actually closer to its edge, when considered in three dimensions. Scale bar=200 nm. (G) Graph shows normalized lateral positions of GluA1 and GluA3 from our serial section data. These are similar to the distributions of GluA1 and GluA3 using single sections (compare with Fig. 4A). (H) Average NL position for the complete data set (“all”), and after removing data from sections found to originate from the edge of the PSD (“without edges”). Removal of “edge” data has very little effect on sample means. (I) Diagram illustrates the approach used to analyze NL position in two dimensions. Serial sections through a schematic axospinous synapse (left) are shown in middle; vertical lines mark edges of the synapse. These are redrawn as a polygon (right), corresponding to an en face reconstruction of the synapse (y-axis computed from ∼50 nm section thickness). Each gold particle is depicted as a black dot. A line from center of the polygon (“x”) through the dot to the edge of polygon, allows estimation of NL position. (J) Computed in this way, GluA1 still tends to lie lateral to GluA3.
We further analyzed the serial sections through each synapse treated as three-dimensional data, constructing models and computing normalized lateral position as diagrammed in Figure 5I. The shapes of the NL position curves are changed in this analysis (for example, since very few particles could lie at the very center of a two-dimensional polygon, the number of particles at NL positions close to zero is expected to be small), but comparisons between GluA1 and GluA3 remain valid as before. Again, GluA1 lies closer to the edge of the synapse (and beyond) than GluA3 (Fig. 5J).
In summary, we conclude from serial-section analysis that errors introduced by restricting our analysis to single sections did not significantly influence our results.
Lateral Position of AMPAR Subunits Depends on PSD size
Classical results from serial-section electron microscopy demonstrate a marked variation in PSD size even within the seemingly homogeneous population of axospinous synapses in stratum radiatum of CA1 in the adult rat (Harris and Stevens, 1989; Mishchenko et al., 2010). The surface area of synaptic contacts varies by more than an order of magnitude; this variation is closely correlated with spine volume, and also with measures of synaptic efficacy, including the number of AMPARs (Kharazia and Weinberg, 1999, Takumi et al., 1999, Racca et al., 2000; Matsuzaki et al., 2001; Nicholson and Geinisman, 2009). Furthermore, large spines (which receive large synaptic contacts) are generally stable, whereas small spines (with small synapses) may be quite plastic (Trachtenberg JT et al., 2002; Holtmaat et al., 2005, 2006; Bourne and Harris, 2007; Yasumatsu et al., 2008; Kasai et al., 2010).
These considerations led us to wonder whether the organization of AMPARs might vary depending on the size of the synapse. To test this possibility, we compared the lateral position of GluA1 and GluA3 subunits in small synapses with those in large synapses (Fig. 6A). We found that GluA1 in “short” synapses (with PSD lengths ranging from 75 to 237 nm) spread over the synapse, with a considerable number of extrasynaptic particles (NL position 0.70±0.02, N = 7 animals), whereas GluA1 in “long” synapses (237–501 nm) concentrated in the center, with few extrasynaptic particles (NL position 0.59±0.03, N = 7); this difference was significant across animals (P < 0.05, paired t-test). In contrast, PSD length had little or no effect on the distribution of GluA3; for short synapses (87–237 nm), NL position was 0.52±0.03 (N = 7), whereas for long synapses (237–530 nm), NL position was 0.51±0.04. These observations also imply that the difference in normalized lateral position between GluA1 and GluA3 was much more pronounced for small (0.70 vs. 0.52) than for large (0.59 vs. 0.51) synapses.
Figure 6.
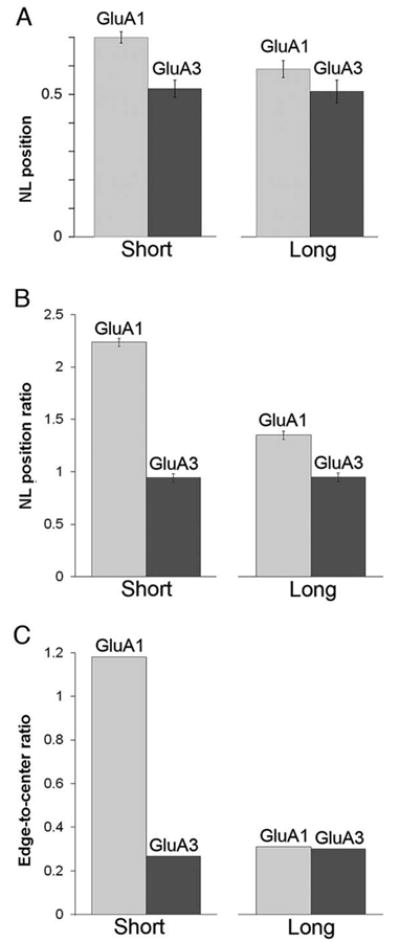
AMPAR subunit positions for short and long PSDs. To determine whether AMPAR subunits are differently organized depending on PSD size, data for each antibody were divided in half according to PSD length. (A) In short PSDs (left), the mean NL position of GluA1 was substantially greater than that for GluA3; this difference was much less pronounced for long PSDs (right). (B) In short PSDs, the mean NL position ratio of GluA1 was much larger than the NL position ratio of GluA3. In contrast, the difference between the NL position ratios of the two receptors was much less pronounced in long PSDs. (C) In short PSDs, the edge-to-center ratio of GluA1 was much larger for GluA1 than GluA3. In long PSDs, the edge-to-center ratio was similar for both subunits.
To analyze these effects further, we examined NL position ratios (Fig. 6B). For short synapses, the NL position ratio was 2.24 for GluA1, but only 0.94 for GluA3 (P < 0.05, Wilcoxon). Much less difference was seen in long synapses; the NL position ratio was 1.35 for GluA1, and 0.95 for GluA3 (P ∼ 0.1). Analogous differences were found when we computed edge-to-center ratios for short versus long synapses, but to an even greater extent (Fig. 6C). The relatively weak labeling for GluA3 made it unfeasible to compute the arithmetic mean of edge-to-center ratios over the seven animals. We therefore determined means by computing the total number of particles from all experiments in the peripheral bin, divided by the total number of particles in the central bin, while assessing significance levels for N = 7 animals with nonparametric statistics. Pooling over the entire data set, we found that the edge-to-center ratio of short synapses was 1.18 for GluA1, but only 0.27 for GluA3 (P < 0.05; Wilcoxon). In contrast, the edge-to-center ratio of long synapses was 0.31 for GluA1, and 0.30 for GluA3 (P ∼0.8).
Measurement noise should have a stronger influence on NL position estimates for short synapses than for long ones; could measurement noise explain these effects? The possibility seems remote, since estimates for both subunits included equivalent levels of measurement noise Nevertheless, to determine more directly whether measurement error could explain the effects seen for GluA1, we reanalyzed the data from models of noisy uniform distributions, bifurcating the results into “small” and “large” halves according to synaptic length. We found that after adding 20 nm of noise to points randomly distributed along the synapse, the mean NL position was 0.52 for small synapses, versus 0.51 for large synapses; the NL position ratio was 1.00 for small synapses, versus 1.02 for large synapses, and the edge-to-center ratio was 0.303 for small synapses, versus 0.296 for large synapses. Thus, noise of this magnitude has only a minimal impact on our results.
We conclude that GluA1-containing AMPARs concentrate away from the center of the synapse and extend beyond its edge, while GluA3-containing receptors are restricted to the synaptic specialization; furthermore, this difference in subunit organization is far more pronounced in small than in large synapses.
Synaptic Expression of Different AMPARs
The relative levels of GluA1/2 and GluA2/3 receptors in mature hippocampal synapses remain controversial (Wenthold et al., 1996; Lu et al., 2009). Our data on the lateral distribution of subunits provides a novel way to estimate the proportion of synaptic AMPARs that contain GluA1/2 versus GluA2/3. Assuming that AMPARs in the postsynaptic membrane of CA1 pyramidal cells are tetramers comprising either (2•GluA1+2•GluA2), or (2•GluA2+2•GluA3 (Wenthold et al., 1996)), the antibody against GluA1 would label only GluA1/2 receptors, while the antibody against GluA3 would label only GluA2/3 receptors. Therefore, the NL position for GluA1 (0.64) should reflect the mean position of GluA1/2 receptors in the synapse, whereas the NL position of GluA3 (0.50) should reflect the mean position of GluA2/3 receptors. In contrast, the NL position of the GluA2–3 antibody (0.59) includes information from both GluA1/2 and GluA2/3 receptors. By combining these data, we can estimate the relative fraction of synaptic AMPARs that are GluA1/2 versus GluA2/3.
The GluA2–3 antibody recognizes a C-terminal epitope shared by GluA2 and GluA3; accordingly, it can be expected to bind to both subunits with comparable efficiency. However, considering the stoichiometry of AMPA receptors, one would expect twice as many gold particles coding for the GluA2–3 antibody to bind to GluA2/3 receptors as to GluA1/2 receptors. Thus,
Solving this equation, our data on the normalized lateral position of labeling for the three antibodies yields an estimate that 79% of AMPARs are GluA1/2 heteromers, while 21% are GluA2/3 heteromers, close to previous estimates based on different methods (Lu et al., 2009).
Discussion
Relationship of AMPAR Epitopes to the Plasma Membrane
Postembedding immunogold electron microscopy provides a high-resolution estimate of the organization of antigens in intact brain, at the cost of limited sensitivity. This required us to average data from a large number of synapses, obscuring the extent of synapse-to-synapse variability. However, since postembedding immunogold provides an unbiased estimate of antigen distribution, the mean values are likely to be quite accurate. Assuming a probable error of ∼20 nm in estimating the position of an epitope with immunogold techniques, the law of large numbers implies that the probable error of the mean of 1,000 particles (computed in the present study) would be reduced by a factor of √1, 000, to ∼0.6 nm, very close to the standard error of mean axodendritic positions reported here.
Numerous studies concur that AMPARs concentrate in the vicinity of the postsynaptic plasma membrane, but only meager quantitative information is available. One previous immunogold study addressed the question, reporting a mean distance of +2.95 nm for the GluA2–3 epitope (Kharazia and Weinberg, 1999), close to our estimate of +3.3 nm. In the present study, GluA1 lay at a mean distance of +4.2 nm from the plasma membrane, which might reflect its longer C-terminal tail, though its difference from the mean position of GluA2–3 did not attain statistical significance. These distances are less than the ∼6 to 12 nm from the plasma membrane predicted for an alpha helix ∼40 to 80 amino acids long (depending on the subunit and the exact binding site of the antibody; Nakagawa, 2010), suggesting that the native conformation of the C terminus is tortuous or obliquely directed away from the plasma membrane. Labeling with the N-terminal antibody (raised against a peptide corresponding to a region within amino acids 25–75) lay close to the plasma membrane even though the N terminal of GluA1 is ∼500 amino acids from the first transmembrane domain, presumably reflecting its native orientation.
Tangential Distribution of AMPARs
Previous postembedding immunogold studies found AMPARs preferentially at the periphery of the synapse in the organ of Corti (a specialized synapse especially suitable for study of tangential localization), neostriatum, and cerebral cortex (Matsubara et al., 1996; Bernard et al., 1997; Kharazia et al., 1997; Ottersen et al., 1998). A study of dendrodendritic synapses in the olfactory bulb yielded somewhat different results, finding that GluA2/3 concentrated only slightly away from the center of the synapse (Sassoè-Poegnetto and Ottersen, 2000); likewise, a study of synapses in rat substantia nigra found no clear evidence that GluA2/3 concentrated away from the center of the synapse (Chatha et al., 2000). Nevertheless, these findings may also be consistent with the present results, which show important differences in the tangential organization of two subunits: GluA1 distributed along the postsynaptic membrane, extending beyond its lateral edge into an extrasynaptic region, while GluA3 was more centrally restricted. (Note that our term “extrasynaptic,” literally meaning “outside or beyond the border of the synapse,” corresponds to the term “perisynaptic” used by others, who reserve “extrasynaptic” for sites remote from the synapse.)
While our measurements are inherently noisy, and further noise may have been introduced by the averaging procedure, statistical considerations imply that differences we detected in lateral organization of subunits likely underestimate the true magnitude of the differences between GluA1 and GluA3. Our results are consistent with electrophysiological work suggesting that GluA1-containing receptors are present at both synaptic and extrasynaptic sites, whereas GluA3-containing receptors are confined to synapses (He et al., 2009; Lu et al., 2009). On the other hand, our results document the high concentration of AMPARs at the synapse, and show that the density in the plasma membrane of even GluA1 is reduced by at least an order of magnitude within 50 nm of the edge of the synapse.
SDS/freeze-fracture methods (Antal et al., 2008; Shinohara et al., 2008; Tarusawa et al., 2009; Rubio et al., 2014) applied to spinal cord, cochlear nucleus, thalamus, hippocampus, and accessory olfactory bulb have in general failed to confirm our conclusion that GluA1 lies in the lateral zone of the synapse, but they did not address this question directly. This research, along with an elegant superresolution light microscopic study (Dani et al., 2010) instead emphasizes the heterogeneity of AMPAR organization within synapses even from a single brain region. Our approach, which averaged results across synapses, was unable to assess heterogeneity, instead assessing mean distributions. In contrast, the electron tomographic study of Chen et al. (2008), using an approach that also provides very high detection efficiency, was generally consistent with our finding of a preferential lateral position. The only directly comparable previous immunogold study found that GluA2–3 labeling was slightly peripheral to GluA1 (Bernard et al., 1997), though GluA3 was not directly studied. The difference between our result and that of Bernard et al. could reflect technical issues, but this discrepancy raises the tantalizing possibility that AMPAR organization at the synapse in CA1 pyramidal neurons may differ from that in the GABAergic medium spiny neurons of striatum studied by Bernard et al. Indeed, recent evidence suggests that other PSD-related proteins may be organized differently in excitatory vs. GABAergic neurons (Burette et al., 2014).
Our estimates of relative abundance of heteromeric combinations at the synapse yielded a slightly higher fraction of GluA2/3 versus GluA1/2 than reported in previous work based on electrophysiological assessment (Lu et al., 2009). This modest discrepancy could reflect a difference between functional and silent receptors; a difference between extrasynaptic receptors as defined electrophysiologically versus anatomically; or conceivably some effect of slice preparation, or a species difference between mouse and rat. However, considering the many possible sources of error, we are instead impressed by the concordance of the estimates. Our results support previous work indicating that GluA3 is a relatively modest constituent of the axospinous synapse in CA1 hippocampus; for this reason, our conclusion that GluA3 is uniformly distributed along the synapse is not inconsistent with previous evidence that AMPARs in cerebral cortex concentrate at the periphery of the synapse (Kharazia and Weinberg, 1997).
Implications of the Observed Tangential Organization
Computational studies predict that precise alignment between presynaptic sites of glutamate release and postsynaptic receptors increases synaptic efficiency (Xie et al., 1997; Raghavachari et al., 2004; Franks et al., 2003; Freche et al., 2011; Rusakov et al., 2011; Allam et al., 2012). The functional consequences of situating GluA3-containing receptors in the central part of the synapse are unclear, though N-methyl-d-aspartate receptors (NMDARs) also concentrate in this central zone (Kharazia and Weinberg, 1997), raising the possibility of a subunit-specific local interaction between NMDARs and GluA2/3 receptors (Bai et al., 2002). GluA3-containing receptors may have especially rapid kinetics (Pei et al., 2007), increasing their sensitivity to modulation via alignment, though this idea remains speculative, since both alternative splicing (flip vs. flop) and accessory subunits also help to define biophysical properties of the receptor channel.
While the functional implications of the observed tangential organization remain obscure, the published data offer possible mechanistic explanations for the different tangential organization of GluA1 and GluA3. The differential lateral organization of different AMPAR subunits reported here might reflect differences in trafficking. Insertion of GluA1/2 receptor into the postsynaptic membrane appears to be activity-dependent, while GluA2/3 receptor trafficking is constitutive, but it remains unknown whether the two receptor subtypes enter the synapse via the same route (Henley et al., 2011). Multiple studies suggest that AMPARs enter the plasma membrane outside of the PSD (Kopec et al., 2006; Park et al., 2006; Yudowski et al., 2007; Yang et al., 2008; Makino and Malinow, 2009; Kennedy et al., 2010) and then diffuse laterally to enter the PSD (Borgdorff et al., 2002; Choquet, 2010; Opazo et al., 2012). However, one study presented evidence that AMPARs might also be directly inserted into the PSD (Gerges et al., 2006). The present immunogold results are consistent with the possibility that GluA1-containing receptors enter the synaptic region from the side, while GluA3-containg receptors enter directly through the center of the PSD.
Our data are also consistent with other possible mechanisms. For example, GluA1-containing receptors may simply be more diffusible than those lacking GluA1. At the same time, protein-protein interactions between AMPARs and synaptic scaffolds like PSD-95 and SAP97 can limit AMPAR diffusion (Newpher and Ehlers, 2008; MacGillavry et al., 2011; Anggono and Huganir, 2012; Opazo et al., 2012), potentially controlling the lateral distribution of AMPARs. Overexpression and knockdown experiments point to an interaction between PSD-95 and AMPARs (El-Husseini et al., 2000; Elias et al., 2006; Ehrlich et al., 2007). Anatomical evidence suggests that PSD-95 distributes fairly uniformly along the synapse (Valtschanoff and Weinberg, 2001; Sassoe-Pognetto et al., 2003). In contrast, SAP97, which interacts with the PDZ binding motif of GluA1 but not GluA3, concentrates at the edge of the PSD, in a pattern reminiscent of that reported here for GluA1 (Valtschanoff et al., 2000; DeGiorgis et al., 2006).
We here demonstrate a strong relationship between AMPAR organization and size. In small synapses, GluA1 was particularly abundant at the synaptic periphery, but this tendency was far less marked in large synapses. In contrast, GluA3 was uniformly distributed along the synapse irrespective of its size. Small synapses are associated with small spines (Harris and Stevens 1989), which in turn are associated with especially plastic and unstable synaptic connections (Holtmaat et al., 2005, 2006; Bourne and Harris 2007; Kasai et al., 2010). Thus, our data suggest that different types of AMPARs are distributed quite differently in nascent synapses (perhaps reflecting different paths of entry into the synapse), while the lack of differences in receptor distribution in large (mature) synapses may reflect slow diffusional mixing.
Acknowledgments
The authors thank Kristen Phend for histological advice and assistance, Roger Nicoll for providing knockout mice, and Alain Burette, Viktor Kharazia, Roger Nicoll and our reviewers for their careful reading of the manuscript.
Grant sponsor: NIH; Grant numbers: R01 NS-35527 and NS-39444 (to R.J.W.).
Footnotes
Additional Supporting Information may be found in the online version of this article.
A.L.J. performed all experiments and collected data; A.L.J. and R.J.W. analyzed data and wrote the text.
References
- Adesnik H, Nicoll RA. Conservation of glutamate receptor 2-containing AMPA receptors during long-term potentiation. J Neurosci. 2007;27:4598–4602. doi: 10.1523/JNEUROSCI.0325-07.2007. [DOI] [PMC free article] [PubMed] [Google Scholar]
- Allam SL, Bouteiller JM, Hu E, Greget R, Ambert N, Bischoff S, Baudry M, Berger TW. Influence of ionotropic receptor location on their dynamics at glutamatergic synapses. Conf Proc IEEE Eng Med Biol Soc. 2012;2012:1374–1377. doi: 10.1109/EMBC.2012.6346194. [DOI] [PubMed] [Google Scholar]
- Anggono V, Huganir RL. Regulation of AMPA receptor trafficking and synaptic plasticity. Curr Opin Neurobiol. 2012;22:461–469. doi: 10.1016/j.conb.2011.12.006. [DOI] [PMC free article] [PubMed] [Google Scholar]
- Antal M, Fukazawa Y, Eördögh M, Muszil D, Molnár E, Itakura M, Takahashi M, Shigemoto R. Numbers, densities, and colocalization of AMPA- and NMDA-type glutamate receptors at individual synapses in the superficial spinal dorsal horn of rats. J Neurosci. 2008;28:9692–9701. doi: 10.1523/JNEUROSCI.1551-08.2008. [DOI] [PMC free article] [PubMed] [Google Scholar]
- Bai D, Muller RU, Roder JC. Non-ionotropic cross-talk between AMPA and NMDA receptors in rodent hippocampal neurones. J Physiol. 2002;543:23–33. doi: 10.1113/jphysiol.2002.020321. [DOI] [PMC free article] [PubMed] [Google Scholar]
- Bernard V, Somogyi P, Bolam JP. Cellular, subcellular, and subsynaptic distribution of AMPA-type glutamate receptor subunits in the neostriatum of the rat. J Neurosci. 1997;17:819–833. doi: 10.1523/JNEUROSCI.17-02-00819.1997. [DOI] [PMC free article] [PubMed] [Google Scholar]
- Borgdorff AJ, Choquet D. Regulation of AMPA receptor lateral movements. Nature. 2002;417:649–653. doi: 10.1038/nature00780. [DOI] [PubMed] [Google Scholar]
- Bourne J, Harris KM. Do thin spines learn to be mushroom spines that remember? Curr Opin Neurobiol. 2007;17:381–386. doi: 10.1016/j.conb.2007.04.009. [DOI] [PubMed] [Google Scholar]
- Burette AC, Park H, Weinberg RJ. Postsynaptic distribution of IRSp53 in spiny excitatory and inhibitory neurons. J Comp Neurol. 2014;522:2164–2178. doi: 10.1002/cne.23526. [DOI] [PMC free article] [PubMed] [Google Scholar]
- Chatha BT, Bernard V, Streit P, Bolam JP. Synaptic localization of ionotropic glutamate receptors in the rat substantia nigra. Neuroscience. 2000;101:1037–1051. doi: 10.1016/s0306-4522(00)00432-2. [DOI] [PubMed] [Google Scholar]
- Chen X, Winters C, Azzam R, Li X, Galbraith JA, Leapman RD, Reese TS. Organization of the core structure of the postsynaptic density. Proc Natl Acad Sci USA. 2008;105:4453–4458. doi: 10.1073/pnas.0800897105. [DOI] [PMC free article] [PubMed] [Google Scholar]
- Choquet D. Fast AMPAR trafficking for a high-frequency synaptic transmission. Eur J Neurosci. 2010;32:250–260. doi: 10.1111/j.1460-9568.2010.07350.x. [DOI] [PubMed] [Google Scholar]
- Dani A, Huang B, Bergan J, Dulac C, Zhuang X. Superresolution imaging of chemical synapses in the brain. Neuron. 2010;68:843–856. doi: 10.1016/j.neuron.2010.11.021. [DOI] [PMC free article] [PubMed] [Google Scholar]
- DeGiorgis JA, Galbraith JA, Dosemeci A, Chen X, Reese TS. Distribution of the scaffolding proteins PSD-95, PSD-93, and SAP97 in isolated PSDs. Brain Cell Biol. 2006;35:239–250. doi: 10.1007/s11068-007-9017-0. [DOI] [PubMed] [Google Scholar]
- Dingledine R, Borges K, Bowie D, Traynelis SF. The glutamate receptor ion channels. Pharmacol Rev. 1999;51:7–61. [PubMed] [Google Scholar]
- Ehrlich I, Klein M, Rumpel S, Malinow R. PSD-95 is required for activity-driven synapse stabilization. Proc Natl Acad Sci USA. 2007;104:4176–4181. doi: 10.1073/pnas.0609307104. [DOI] [PMC free article] [PubMed] [Google Scholar]
- El-Husseini AE, Schnell E, Chetkovich DM, Nicoll RA, Bredt DS. PSD-95 involvement in maturation of excitatory synapses. Science. 2000;290:1364–1368. [PubMed] [Google Scholar]
- Elias GM, Funke L, Stein V, Grant SG, Bredt DS, Nicoll RA. Synapse-specific and developmentally regulated targeting of AMPA receptors by a family of MAGUK scaffolding proteins. Neuron. 2006;52:307–320. doi: 10.1016/j.neuron.2006.09.012. [DOI] [PubMed] [Google Scholar]
- Franks KM, Stevens CF, Sejnowski TJ. Independent sources of quantal variability at single glutamatergic synapses. J Neurosci. 2003;23:3186–3195. doi: 10.1523/JNEUROSCI.23-08-03186.2003. [DOI] [PMC free article] [PubMed] [Google Scholar]
- Freche D, Pannasch U, Rouach N, Holcman D. Synapse geometry and receptor dynamics modulate synaptic strength. PLoS One. 2011;6:e25122. doi: 10.1371/journal.pone.0025122. [DOI] [PMC free article] [PubMed] [Google Scholar]
- Gerges NZ, Backos DS, Rupasinghe CN, Spaller MR, Esteban JA. Dual role of the exocyst in AMPA receptor targeting and insertion into the postsynaptic membrane. EMBO J. 2006;25:1623–1634. doi: 10.1038/sj.emboj.7601065. [DOI] [PMC free article] [PubMed] [Google Scholar]
- Gouaux E. Structure and function of AMPA receptors. J Physiol. 2004;554:249–253. doi: 10.1113/jphysiol.2003.054320. [DOI] [PMC free article] [PubMed] [Google Scholar]
- Granger AJ, Shi Y, Lu W, Cerpas M, Nicoll RA. LTP requires a reserve pool of glutamate receptors independent of subunit type. Nature. 2013;493:495–500. doi: 10.1038/nature11775. [DOI] [PMC free article] [PubMed] [Google Scholar]
- Harris KM, Stevens JK. Dendritic spines of CA 1 pyramidal cells in the rat hippocampus: serial electron microscopy with reference to their biophysical characteristics. J Neurosci. 1989;9:2982–2997. doi: 10.1523/JNEUROSCI.09-08-02982.1989. [DOI] [PMC free article] [PubMed] [Google Scholar]
- Hayashi Y, Shi SH, Esteban JA, Piccini A, Poncer JC, Malinow R. Driving AMPA receptors into synapses by LTP and CaMKII: Requirement for GluR1 and PDZ domain interaction. Science. 2000;287:2262–2267. doi: 10.1126/science.287.5461.2262. [DOI] [PubMed] [Google Scholar]
- He K, Song L, Cummings LW, Goldman J, Huganir RL, Lee HK. Stabilization of Ca2+-permeable AMPA receptors at perisynaptic sites by GluR1-S845 phosphorylation. Proc Natl Acad Sci USA. 2009;106:20033–20038. doi: 10.1073/pnas.0910338106. [DOI] [PMC free article] [PubMed] [Google Scholar]
- Henley JM, Barker EA, Glebov OO. Routes, destinations and delays: Recent advances in AMPA receptor trafficking. Trends Neurosci. 2011;34:258–268. doi: 10.1016/j.tins.2011.02.004. [DOI] [PMC free article] [PubMed] [Google Scholar]
- Hollmann M, Heinemann S. Cloned glutamate receptors. Annu Rev Neurosci. 1994;17:31–108. doi: 10.1146/annurev.ne.17.030194.000335. [DOI] [PubMed] [Google Scholar]
- Holtmaat A, Wilbrecht L, Knott GW, Welker E, Svoboda K. Experience-dependent and cell-type-specific spine growth in the neocortex. Nature. 2006;441:979–983. doi: 10.1038/nature04783. [DOI] [PubMed] [Google Scholar]
- Holtmaat AJ, Trachtenberg JT, Wilbrecht L, Shepherd GM, Zhang X, Knott GW, Svoboda K. Transient and persistent dendritic spines in the neocortex in vivo. Neuron. 2005;45:279–291. doi: 10.1016/j.neuron.2005.01.003. [DOI] [PubMed] [Google Scholar]
- Huganir R, Nicoll R. AMPARs and synaptic plasticity: The last 25 years. Neuron. 2013;80:704–717. doi: 10.1016/j.neuron.2013.10.025. [DOI] [PMC free article] [PubMed] [Google Scholar]
- Jaskolski F, Mayo-Martin B, Jane D, Henley JM. Dynamin-dependent membrane drift recruits AMPA receptors to dendritic spines. J Biol Chem. 2009;284:12491–1503. doi: 10.1074/jbc.M808401200. [DOI] [PMC free article] [PubMed] [Google Scholar]
- Jia Z, Agopyan N, Miu P, Xiong Z, Henderson J, Gerlai R, Taverna FA, Velumian A, MacDonald J, Carlen P, Abramow-Newerly W, Roder J. Enhanced LTP in mice deficient in the AMPA receptor GluR2. Neuron. 1996;17:945–56. doi: 10.1016/s0896-6273(00)80225-1. [DOI] [PubMed] [Google Scholar]
- Kasai H, Fukuda M, Watanabe S, Hayashi-Takagi A, Noguchi J. Structural dynamics of dendritic spines in memory and cognition. Trends Neurosci. 2010;33:121–129. doi: 10.1016/j.tins.2010.01.001. [DOI] [PubMed] [Google Scholar]
- Kellenberger E, Hayat MA. Some basic concepts for the choice of methods. In: Hayat MA, editor. Colloidal Gold: Principles, Methods, and Applications. Vol. 3. San Diego: Academic; 1991. pp. 1–30. [Google Scholar]
- Kennedy MJ, Davison IG, Robinson CG, Ehlers MD. Syntaxin-4 defines a domain for activity-dependent exocytosis in dendritic spines. Cell. 2010;141:524–535. doi: 10.1016/j.cell.2010.02.042. [DOI] [PMC free article] [PubMed] [Google Scholar]
- Kessels HW, Malinow R. Synaptic AMPA receptor plasticity and behavior. Neuron. 2009;61:340–350. doi: 10.1016/j.neuron.2009.01.015. [DOI] [PMC free article] [PubMed] [Google Scholar]
- Kharazia VN, Weinberg RJ. Tangential synaptic distribution of NMDA and AMPA receptors in rat neocortex. Neurosci Lett. 1997;238:41–44. doi: 10.1016/s0304-3940(97)00846-x. [DOI] [PubMed] [Google Scholar]
- Kharazia VN, Weinberg RJ. Immunogold localization of AMPA and NMDA receptors in somatic sensory cortex of albino rat. J Comp Neurol. 1999;412:292–302. doi: 10.1002/(sici)1096-9861(19990920)412:2<292::aid-cne8>3.0.co;2-g. [DOI] [PubMed] [Google Scholar]
- Kopec CD, Li B, Wei W, Boehm J, Malinow R. Glutamate receptor exocytosis and spine enlargement during chemically induced long-term potentiation. J Neurosci. 2006;26:2000–2009. doi: 10.1523/JNEUROSCI.3918-05.2006. [DOI] [PMC free article] [PubMed] [Google Scholar]
- Lein ES, Hawrylycz MJ, Ao N, Ayres M, Bensinger A, Bernard A, Boe AF, Boguski MS, Brockway KS, Byrnes EJ, et al. Genome-wide atlas of gene expression in the adult mouse brain. Nature. 2007;445:168–176. doi: 10.1038/nature05453. [DOI] [PubMed] [Google Scholar]
- Leonard AS, Davare MA, Horne MC, Garner CC, Hell JW. SAP97 is associated with the alpha-amino-3-hydroxy-5-methylisoxazole-4-propionic acid receptor GluR1 subunit. J Biol Chem. 1998;273:19518–19524. doi: 10.1074/jbc.273.31.19518. [DOI] [PubMed] [Google Scholar]
- Lu W, Shi Y, Jackson AC, Bjorgan K, During MJ, Sprengel R, Seeburg PH, Nicoll RA. Subunit composition of synaptic AMPA receptors revealed by a single-cell genetic approach. Neuron. 2009;62:254–268. doi: 10.1016/j.neuron.2009.02.027. [DOI] [PMC free article] [PubMed] [Google Scholar]
- MacGillavry HD, Kerr JM, Blanpied TA. Lateral organization of the postsynaptic density. Mol Cell Neurosci. 2011;48:321–331. doi: 10.1016/j.mcn.2011.09.001. [DOI] [PMC free article] [PubMed] [Google Scholar]
- Makino H, Malinow R. AMPA receptor incorporation into synapses during LTP: The role of lateral movement and exocytosis. Neuron. 2009;64:381–390. doi: 10.1016/j.neuron.2009.08.035. [DOI] [PMC free article] [PubMed] [Google Scholar]
- Mano I, Teichberg VI. A tetrameric subunit stoichiometry for a glutamate receptor-channel complex. Neuroreport. 1998;9:327–331. doi: 10.1097/00001756-199801260-00027. [DOI] [PubMed] [Google Scholar]
- Mansour M, Nagarajan N, Nehring RB, Clements JD, Rosenmund C. Heteromeric AMPA receptors assemble with a preferred subunit stoichiometry and spatial arrangement. Neuron. 2001;32:841–853. doi: 10.1016/s0896-6273(01)00520-7. [DOI] [PubMed] [Google Scholar]
- Matsubara A, Laake JH, Davanger S, Usami S, Ottersen OP. Organization of AMPA receptor subunits at a glutamate synapse: A quantitative immunogold analysis of hair cell synapses in the rat organ of Corti. J Neurosci. 1996;16:4457–4467. doi: 10.1523/JNEUROSCI.16-14-04457.1996. [DOI] [PMC free article] [PubMed] [Google Scholar]
- Matsuzaki M, Ellis-Davies GC, Nemoto T, Miyashita Y, Iino M, Kasai H. Dendritic spine geometry is critical for AMPA receptor expression in hippocampal CA1 pyramidal neurons. Nat Neurosci. 2001;4:1086–1092. doi: 10.1038/nn736. [DOI] [PMC free article] [PubMed] [Google Scholar]
- Mishchenko Y, Hu T, Spacek J, Mendenhall J, Harris KM, Chklovskii DB. Ultrastructural analysis of hippocampal neuropil from the connectomics perspective. Neuron. 2010;67:1009–1020. doi: 10.1016/j.neuron.2010.08.014. [DOI] [PMC free article] [PubMed] [Google Scholar]
- Moga DE, Janssen WG, Vissavajjhala P, Czelusniak SM, Moran TM, Hof PR, Morrison JH. Glutamate receptor subunit 3 (GluR3) immunoreactivity delineates a subpopulation of parvalbumin-containing interneurons in the rat hippocampus. J Comp Neurol. 2003;462:15–28. doi: 10.1002/cne.10710. [DOI] [PubMed] [Google Scholar]
- Nabavi S, Fox R, Alfonso S, Aow J, Malinow R. GluA1 trafficking and metabotropic NMDA: Addressing results from other laboratories inconsistent with ours. Philos Trans R Soc B. 2013;369:20130145. doi: 10.1098/rstb.2013.0145. [DOI] [PMC free article] [PubMed] [Google Scholar]
- Nakagawa T. The biochemistry, ultrastructure, and subunit assembly mechanism of AMPA receptors. Mol Neurobiol. 2010;42:161–184. doi: 10.1007/s12035-010-8149-x. [DOI] [PMC free article] [PubMed] [Google Scholar]
- Newpher TM, Ehlers MD. Glutamate receptor dynamics in dendritic microdomains. Neuron. 2008;58:472–497. doi: 10.1016/j.neuron.2008.04.030. [DOI] [PMC free article] [PubMed] [Google Scholar]
- Nicholson DA, Geinisman Y. Axospinous synaptic subtype-specific differences in structure, size, ionotropic receptor expression, and connectivity in apical dendritic regions of rat hippocampal CA1 pyramidal neurons. J Comp Neurol. 2009;512:399–418. doi: 10.1002/cne.21896. [DOI] [PMC free article] [PubMed] [Google Scholar]
- Opazo P, Sainlos M, Choquet D. Regulation of AMPA receptor surface diffusion by PSD-95 slots. Curr Opin Neurobiol. 2012;22:453–460. doi: 10.1016/j.conb.2011.10.010. [DOI] [PubMed] [Google Scholar]
- Ottersen OP, Takumi Y, Matsubara A, Landsend AS, Laake JH, Usami S. Molecular organization of a type of peripheral glutamate synapse: The afferent synapses of hair cells in the inner ear. Prog Neurobiol. 1998;54:127–148. doi: 10.1016/s0301-0082(97)00054-3. [DOI] [PubMed] [Google Scholar]
- Palmer CL, Cotton L, Henley JM. The molecular pharmacology and cell biology of alpha-amino-3-hydroxy-5-methyl-4-isoxazolepropionic acid receptors. Pharmacol Rev. 2005;57:253–277. doi: 10.1124/pr.57.2.7. [DOI] [PMC free article] [PubMed] [Google Scholar]
- Park M, Salgado JM, Ostroff L, Helton TD, Robinson CG, Harris KM, Ehlers MD. Plasticity-induced growth of dendritic spines by exocytic trafficking from recycling endosomes. Neuron. 2006;52:817–830. doi: 10.1016/j.neuron.2006.09.040. [DOI] [PMC free article] [PubMed] [Google Scholar]
- Passafaro M, Piech V, Sheng M. Subunit-specific temporal and spatial patterns of AMPA receptor exocytosis in hippocampal neurons. Nat Neurosci. 2001;4:917–926. doi: 10.1038/nn0901-917. [DOI] [PubMed] [Google Scholar]
- Patterson MA, Szatmari EM, Yasuda R. AMPA receptors are exocytosed in stimulated spines and adjacent dendrites in a Ras-ERK-dependent manner during long-term potentiation. Proc Natl Acad Sci USA. 2010;107:15951–15956. doi: 10.1073/pnas.0913875107. [DOI] [PMC free article] [PubMed] [Google Scholar]
- Pei W, Huang Z, Niu L. GluR3 flip and flop: differences in channel opening kinetics. Biochemistry. 2007;46:2027–2036. doi: 10.1021/bi062213s. [DOI] [PubMed] [Google Scholar]
- Racca C, Stephenson FA, Streit P, Roberts JD, Somogyi P. NMDA receptor content of synapses in stratum radiatum of the hippocampal CA1 area. J Neurosci. 2000;20:2512–2522. doi: 10.1523/JNEUROSCI.20-07-02512.2000. [DOI] [PMC free article] [PubMed] [Google Scholar]
- Racz B, Blanpied TA, Ehlers MD, Weinberg RJ. Lateral organization of endocytic machinery in dendritic spines. Nat Neurosci. 2004;7:917–918. doi: 10.1038/nn1303. [DOI] [PubMed] [Google Scholar]
- Raghavachari S, Lisman JE. Properties of quantal transmission at CA1 synapses. J Neurophysiol. 2004;92:2456–2467. doi: 10.1152/jn.00258.2004. [DOI] [PubMed] [Google Scholar]
- Rosenmund C, Stern-Bach Y, Stevens CF. The tetrameric structure of a glutamate receptor channel. Science. 1998;280:1596–1599. doi: 10.1126/science.280.5369.1596. [DOI] [PubMed] [Google Scholar]
- Rozov A, Sprengel R, Seeburg PH. GluA2-lacking AMPA receptors in hippocampal CA1 cell synapses: evidence from genetargeted mice. Front Mol Neurosci. 2012;5:22. doi: 10.3389/fnmol.2012.00022. [DOI] [PMC free article] [PubMed] [Google Scholar]
- Rubio ME, Fukazawa Y, Kamasawa N, Clarkson C, Molnár E, Shigemoto R. Target- and input-dependent organization of AMPA and NMDA receptors in synaptic connections of the cochlear nucleus. J Comp Neurol. 2012;522:4023–4042. doi: 10.1002/cne.23654. [DOI] [PMC free article] [PubMed] [Google Scholar]
- Rusakov DA, Savtchenko LP, Zheng K, Henley JM. Shaping the synaptic signal: molecular mobility inside and outside the cleft. Trends Neurosci. 2011;34:359–369. doi: 10.1016/j.tins.2011.03.002. [DOI] [PMC free article] [PubMed] [Google Scholar]
- Sans N, Vissel B, Petralia RS, Wang YX, Chang K, Royle GA, Wang CY, O'Gorman S, Heinemann SF, Wenthold RJ. Aberrant formation of glutamate receptor complexes in hippocampal neurons of mice lacking the GluR2 AMPA receptor subunit. J Neurosci. 2003;23:9367–9373. doi: 10.1523/JNEUROSCI.23-28-09367.2003. [DOI] [PMC free article] [PubMed] [Google Scholar]
- Santos SD, Carvalho AL, Caldeira MV, Duarte CB. Regulation of AMPA receptors and synaptic plasticity. Neuroscience. 2009;158:105–125. doi: 10.1016/j.neuroscience.2008.02.037. [DOI] [PubMed] [Google Scholar]
- Sassoe-Pognetto M, Ottersen OP. Organization of ionotropic glutamate receptors at dendrodendritic synapses in the rat olfactory bulb. J Neurosci. 2000;20:2192–2201. doi: 10.1523/JNEUROSCI.20-06-02192.2000. [DOI] [PMC free article] [PubMed] [Google Scholar]
- Sassoe-Pognetto M, Utvik JK, Camoletto P, Watanabe M, Stephenson FA, Bredt DS, Ottersen OP. Organization of postsynaptic density proteins and glutamate receptors in axodendritic and dendrodendritic synapses of the rat olfactory bulb. J Comp Neurol. 2003;463:237–248. doi: 10.1002/cne.10745. [DOI] [PubMed] [Google Scholar]
- Shepherd JD, Huganir RL. The cell biology of synaptic plasticity: AMPA receptor trafficking. Annu Rev Cell Dev Biol. 2007;23:613–643. doi: 10.1146/annurev.cellbio.23.090506.123516. [DOI] [PubMed] [Google Scholar]
- Shi S, Hayashi Y, Esteban JA, Malinow R. Subunit-specific rules governing AMPA receptor trafficking to synapses in hippocampal pyramidal neurons. Cell. 2001;105:331–343. doi: 10.1016/s0092-8674(01)00321-x. [DOI] [PubMed] [Google Scholar]
- Shi SH, Hayashi Y, Petralia RS, Zaman SH, Wenthold RJ, Svoboda K, Malinow R. Rapid spine delivery and redistribution of AMPA receptors after synaptic NMDA receptor activation. Science. 1999;284:1811–1816. doi: 10.1126/science.284.5421.1811. [DOI] [PubMed] [Google Scholar]
- Shinohara Y, Hirase H, Watanabe M, Itakura M, Takahashi M, Shigemoto R. Left-right asymmetry of the hippocampal synapses with differential subunit allocation of glutamate receptors. Proc Natl Acad Sci USA. 2008;105:19498–19503. doi: 10.1073/pnas.0807461105. [DOI] [PMC free article] [PubMed] [Google Scholar]
- Takumi Y, Ramirez-Leon V, Laake P, Rinvik E, Ottersen OP. Different modes of expression of AMPA and NMDA receptors in hippocampal synapses. Nat Neurosci. 1999;2:618–624. doi: 10.1038/10172. [DOI] [PubMed] [Google Scholar]
- Tanaka H, Hirano T. Visualization of subunit-specific delivery of glutamate receptors to postsynaptic membrane during hippocampal long-term potentiation. Cell Rep. 2012;1:291–298. doi: 10.1016/j.celrep.2012.02.004. [DOI] [PubMed] [Google Scholar]
- Tao-Cheng JH, Crocker VT, Winters CA, Azzam R, Chludzinski J, Reese TS. Trafficking of AMPA receptors at plasma membranes of hippocampal neurons. J Neurosci. 2011;31:4834–4843. doi: 10.1523/JNEUROSCI.4745-10.2011. [DOI] [PMC free article] [PubMed] [Google Scholar]
- Tarusawa E, Matsui K, Budisantoso T, Molnár E, Watanabe M, Matsui M, Fukazawa Y, Shigemoto R. Input-specific intrasynaptic arrangements of ionotropic glutamate receptors and their impact on postsynaptic responses. J Neurosci. 2009;29:12896–12908. doi: 10.1523/JNEUROSCI.6160-08.2009. [DOI] [PMC free article] [PubMed] [Google Scholar]
- Trachtenberg JT, Chen BE, Knott GW, Feng G, Sanes JR, Welker E, Svoboda K. Long-term in vivo imaging of experience-dependent synaptic plasticity in adult cortex. Nature. 2002;420:788–794. doi: 10.1038/nature01273. [DOI] [PubMed] [Google Scholar]
- Valtschanoff JG, Burette A, Davare MA, Leonard AS, Hell JW, Weinberg RJ. SAP97 concentrates at the postsynaptic density in cerebral cortex. Eur J Neurosci. 2000;12:3605–36014. doi: 10.1046/j.1460-9568.2000.00256.x. [DOI] [PubMed] [Google Scholar]
- Valtschanoff JG, Weinberg RJ. Laminar organization of the NMDA receptor complex within the postsynaptic density. J Neurosci. 2001;21:1211–1127. doi: 10.1523/JNEUROSCI.21-04-01211.2001. [DOI] [PMC free article] [PubMed] [Google Scholar]
- van Vuurden DG, Yazdani M, Bosma I, Broekhuizen AJ, Postma TJ, Heimans JJ, van der Valk P, Aronica E, Tannous BA, Wiürdinger T, Kaspers GJ, Cloos J. Attenuated AMPA receptor expression allows glioblastoma cell survival in glutamate-rich environment. PLoS One. 2009;4:e5953. doi: 10.1371/journal.pone.0005953. [DOI] [PMC free article] [PubMed] [Google Scholar]
- Wenthold RJ, Yokotani N, Doi K, Wada K. Immunochemical characterization of the non-NMDA glutamate receptor using subunit-specific antibodies. Evidence for a hetero-oligomeric structure in rat brain. J Biol Chem. 1992;267:501–507. [PubMed] [Google Scholar]
- Wenthold RJ, Petralia RS, Blahos J, II, Niedzielski AS. Evidence for multiple AMPA receptor complexes in hippocampal CA1/CA2 neurons. J Neurosci. 1996;16:1982–1989. doi: 10.1523/JNEUROSCI.16-06-01982.1996. [DOI] [PMC free article] [PubMed] [Google Scholar]
- Xie X, Liaw JS, Baudry M, Berger TW. Novel expression mechanism for synaptic potentiation: alignment of presynaptic release site and postsynaptic receptor. Proc Natl Acad Sci USA. 1997;94:6983–6988. doi: 10.1073/pnas.94.13.6983. [DOI] [PMC free article] [PubMed] [Google Scholar]
- Yasumatsu N, Matsuzaki M, Miyazaki T, Noguchi J, Kasai H. Principles of long-term dynamics of dendritic spines. J Neurosci. 2008;28:13592–13608. doi: 10.1523/JNEUROSCI.0603-08.2008. [DOI] [PMC free article] [PubMed] [Google Scholar]
- Yang Y, Wang XB, Frerking M, Zhou Q. Delivery of AMPA receptors to perisynaptic sites precedes the full expression of long-term potentiation. Proc Natl Acad Sci USA. 2008;105:11388–11393. doi: 10.1073/pnas.0802978105. [DOI] [PMC free article] [PubMed] [Google Scholar]
- Yudowski GA, Puthenveedu MA, Leonoudakis D, Panicker S, Thorn KS, Beattie EC, von Zastrow M. Real-time imaging of discrete exocytic events mediating surface delivery of AMPA receptors. J Neurosci. 2007;27:11112–11121. doi: 10.1523/JNEUROSCI.2465-07.2007. [DOI] [PMC free article] [PubMed] [Google Scholar]
- Zamanillo D, Sprengel R, Hvalby O, Jensen V, Burnashev N, Rozov A, Kaiser KM, Koster HJ, Borchardt T, Worley P, et al. Importance of AMPA receptors for hippocampal synaptic plasticity but not for spatial learning. Science. 1999;284:1805–1811. doi: 10.1126/science.284.5421.1805. [DOI] [PubMed] [Google Scholar]