Abstract
Multifunctional nanoparticles are synthesized for both pH-triggered drug release and imaging with radioluminescence, upconversion luminescent, and magnetic resonance imaging (MRI). The particles have a yolk-in-shell morphology, with a radioluminescent core, an upconverting shell, and a hollow region between the core and shell for loading drugs. They are synthesized by controlled encapsulation of a radioluminescent nanophosphor yolk in a silica shell, partial etching of the yolk in acid, and encapsulation of the silica with an upconverting luminescent shell. Metroxantrone, a chemotherapy drug, was loaded into the hollow space between X-ray phosphor yolk and up-conversion phosphor shell through pores in the shell. To encapsulate the drug and control the release rate, the nanoparticles are coated with pH-responsive biocompatible polyelectrolyte layers of charged hyaluronic acid sodium salt and chitosan. The nanophosphors display bright luminescence under X-ray, blue light (480 nm), and infrared light (980 nm). They also served as T1 and T2 MRI contrast agents with relaxivities of 3.5 mM−1 s−1 (r1) and 64 mM−1s−1 (r2). These multifunctional nanocapsules have applications in controlled drug delivery and multimodal imaging.
Keywords: upconversion, radioluminescence, nanophosphors, controlled drug release, MRI contrast agent
1. Introduction
Mitoxantrone (MTX) is a chemotherapy drug used to treat breast and prostate cancer but its clinical application has been limited due to severe cardiotoxicity.[1] Drug-loaded spherical nanocapsules or yolk-in-shell nanocapsules are promising drug-delivery agents because their size, shape, and surface can be controlled to improve specific delivery to cancer cells while reducing toxicity from systemic release into the blood.[2] The nanocapsules could be targeted to tumors by the enhanced permeability and retention (EPR) effect whereby nanocapsules enter the tumor via leaky vasculature, and by functionalizing the nanocapsule surface with appropriate antibodies or other cancer-targeting molecules. Nanoparticles fabricated with lipids, liposomes, or polyester have been studied to improve the MTX delivery but poor controlled release behaviour limited their application.[3, 4, 5] Nanocapsules can also be coated with shells to control release in a pH-dependent manner so that they rapidly release drugs after endocytosis in acidic tumor lysosomes and endosomes, but only gradually release drug in blood (pH ~7.4). Silica nanoparticles loaded with MTX using electrostatic interactions were recently reported to show pH-dependent release rates.[6, 7] However, the non-controllable burst release of these nanodrug system limits their practical applications.[8] In this work, we developed particles with ~30 day release times at physiological pH (~7.4) and 16.5 hr release at pH 5.0 by coating rare-earth-doped yolk-in-shell nanocapsules in alternating layers of hyaluronic acid sodium salt (HL) and chitosan (CS), which are widely used biocompatible polymers in tissue engineering.[9, 10]
Rare-earth-doped inorganic radioluminescent and up-conversion nanophosphors have attracted broad interest as imaging agents because they are excited by wavelengths that produce minimal backgrounds from tissue, and both excitation and emission light penetrate deeply through tissue. They have also been employed in biomedical applications such as drug delivery carriers,[11, 12, 13, 14] magnetic resonance imaging (MRI),[11, 15, 16] and fluorescent labelling.[15, 16] Radioluminescent phosphors can be localized through deep tissue (>~1 cm) at a resolution limited by the X-ray beam width[17, 18] by using a narrow X-ray beam to excite only the phosphors within the beam.[17, 18, 19, 20, 21, 22] Upconversion nanophosphors do not require ionizing radiation so they can generate bright luminescence signals over long time intervals. Although upconversion nanophopshors can be imaged with submicron diffraction-limited resolution in vitro and through thin tissue (<~1 mm),[23] through thick tissue almost all the incident excitation photons are scattered and image resolution becomes poor (i.e. the width of the point-spread-function is approximately equal to the tissue depth).[24, 25] In general, radioluminescent nanophosphors are more appropriate for submillimeter resolution imaging through thick tissue, while upconversion nanophosphors are more appropriate for detecting low concentrations of particles over long periods.
Herein, we describe a novel strategy to fabricate bright radioluminescent and upconversion nanoparticles with combined advantages of radioluminescent and up-conversion nanophosphors for pH-triggered release of the anti-cancer drug (MTX) and MRI imaging. These multifunctional rare-earth-doped gadolinium oxysulfide (GOS) nanophosphors were, for the first time, used to carry the anti-cancer drug MTX and were detected optically through 1 cm deep tissue. A selective etching strategy was used to create a hollow space for drug loading. Multiple layers of biocompatible polyelectrolytes were coated on the surface of nanocarrers to control the drug release rate by pH. The radioluminescent nanocores and porous upconversion nanoshell are good T2 and T1 weighted contrast agents. These dual MRI imaging contrast nanocapsules have great promise for locating and tracking the nanocapsules during drug delivery.
2. Results and discussion
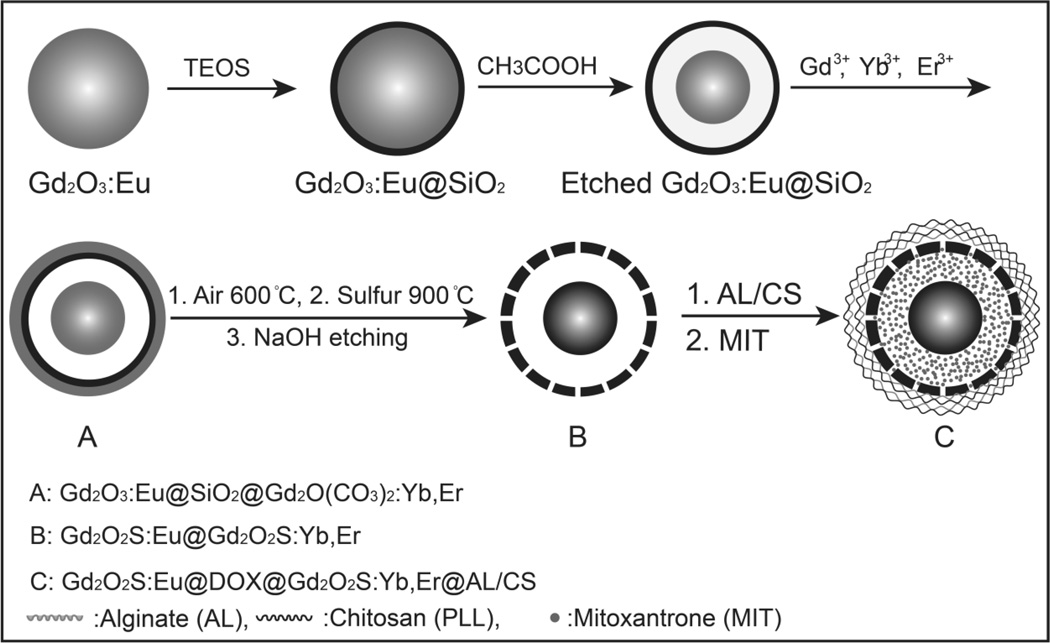
To improve delivery of tumor contrast agents and drug delivery vehicles, it is important to control the particle size, shape and surface chemistry to prolong circulation in the blood stream before clearance by the kidneys and liver. In general, particles in the 10~200 nm diameter range have slower clearance by the reticulo-endothelial system (RES) system than larger particles, [26, 27, 28] and accumulate in tumors due to the EPR effect. Our previous studies used relatively large spindle-shaped radioluminescent nanocapsules (500 nm in length) as nanocarriers for doxorubicin.[11] In order to reduce the RES uptake of the nanoparticles, spherical nanoparticles with smaller size (75 nm) were fabricated in this work. A schematic of the yolk-in-shell fabrication protocol is shown in Figure 1. First, Gd2O3:Eu nanospheres (50 nm) were prepared by precipitation of Gd3+ and Eu3+ during the decomposition of urea and then calcined at 600 °C in the air for 2 h. The Gd2O3:Eu nanoparticles were then treated through a modified Stöber procedure to form a ~7 nm silica shell.[11] This flexible template synthesis technique can control the nanoparticle size (50 nm to 300 nm) by varying the synthesis condition of the precursor template.[16] To create a hollow space for drug loading, the Gd2O3:Eu nanocore was partially dissolved by etching in acetic acid (v/v=0.4%) for 3 h. The monodispersed silica shell were then coated with a layer of Gd2O(CO3)2•H2O doped with Yb3+ and Tm3+through a homogeneous precipitation method.[11] After heat treatment at 600 °C for 1 h, the amorphous Gd2O(CO3)2•H2O:Yb/Tm layer transformed into Gd2O3:Yb/Tm. The above product was treated by sulphur gas with argon flow at 900 °C for 1 h to convert the host material (Gd2O3) in the core and shell to Gd2O2S. The inner silica shell was finally removed by incubation in NaOH (2.0 M for 12 h). To use these nanophosphors for pH triggered drug release, multiple layers of biocompatible polyelectrolytes (5 layers of negatively charged hyaluronic acid sodium salt (HL) and 5 layers of positively charged Chitosan (CS)) were alternately coated onto the positively charged (+31 mV, ζ-potential) radioluminescent and up-conversion nanophosphros (Gd2O2S:Eu@Gd2O2S:Yb/Tm).
Figure 1.
(A) Schematic showing the synthesis route of hyaluronic acid sodium salt and chitosan coated radioluminescent and up-conversion nanophosphors for pH triggered mitoxantrone release.
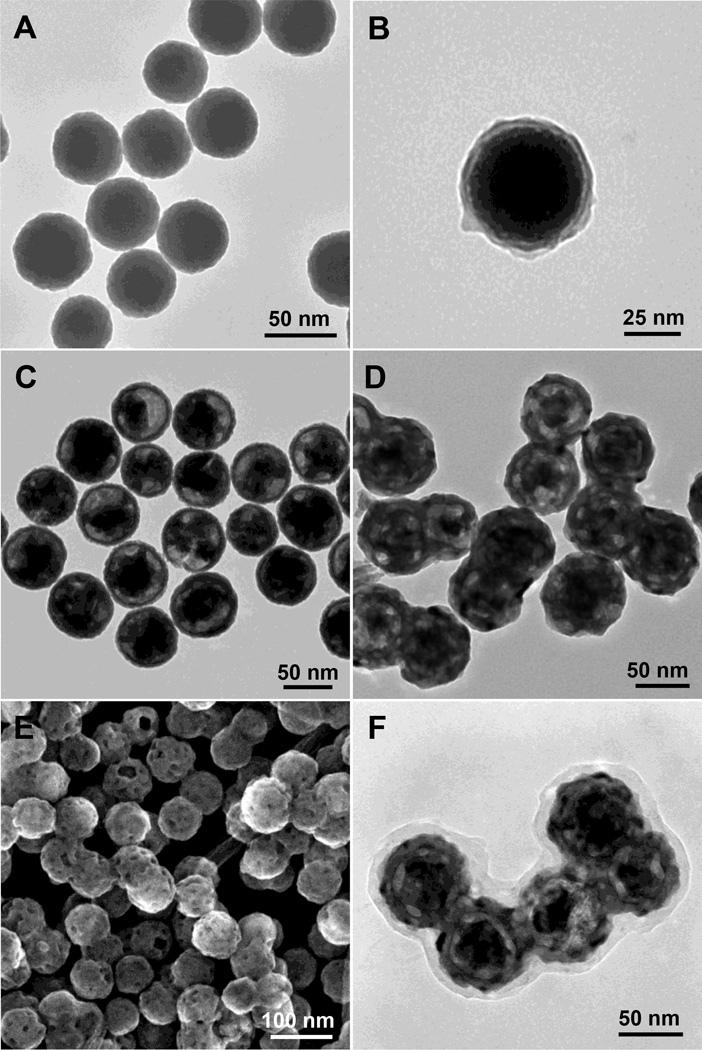
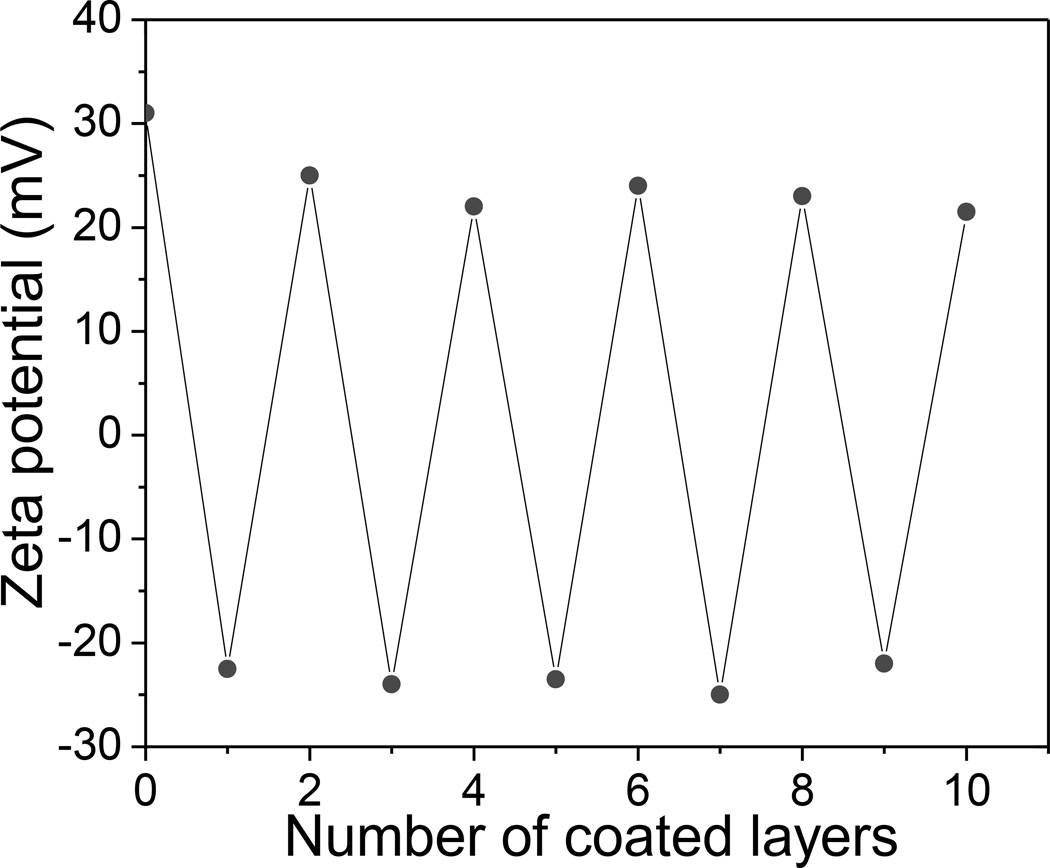
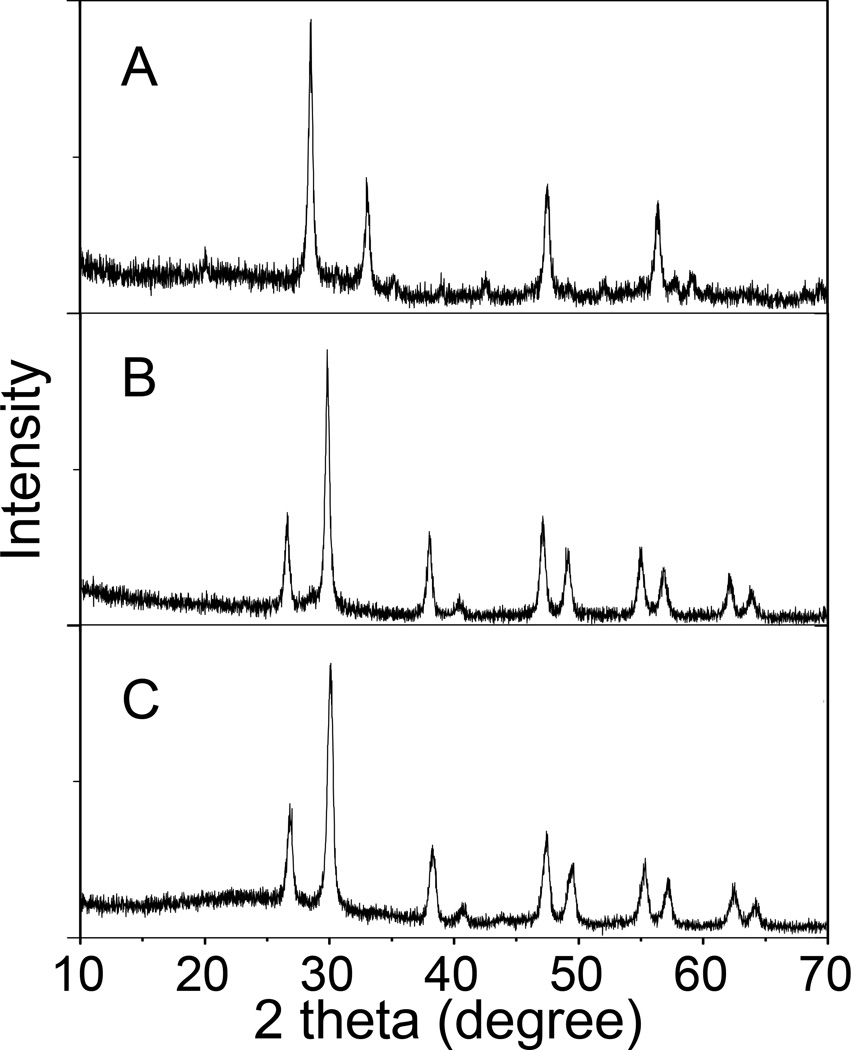
The SEM image in Figure 2A shows that monodispersed radioluminescent and upconversion nanophosphors were obtained with an average diameter of 75 ±10 nm and a porous shell. BJT analysis indicated that the average diameter of pores in the shell was 8 nm, which is sufficient for the drug loading and release (Figure S1, Supporting Information). As shown in Figure 3, the ζ-potentials of the HL/CS multiple layers deposited nanophosphors changed from positive to negative as each layer was alternatively coated. The ~10 nm thick polyelectrolyte layer can be distinguished especially in Figure 2C due to the difference in electron penetration between the radioluminescent core, upconversion shell, and polyelectrolytes. Crystal structure and composition of these nanopheres were characterized by powder X-ray diffraction (XRD). After the sulfidation reaction in sulphur gas at 900 °C, the XRD spectrum of the radioluminescent upconversion nanophosphors showed a pure hexagonal phase of Gd2O2S (Figure 4B). Coating these phosphors with the biocompatible polyeletrolyte coating had no evident effect the XRD spectrum of the nanophosphors (Figure 4C). Furthermore, the FTIR spectrum of Gd2O2S:Eu@Gd2O2S:Yb/Tm@HL/CS (Figure S2, Supporting Information) confirms the successful surface coating of HL and CS.
Figure 2.
(A) TEM image of Gd2O3:Eu nanotemplates, (B) TEM image of silica-coated Gd2O3:Eu, (C) TEM image of silica coated with partially etched Gd2O3:Eu core (Gd2O3@SiO2), (D) TEM image of radioluminescent and upconversion nanophosphors (Gd2O2S:Eu@Gd2O2S:Yb/Tm), (E) SEM image of radioluminescent and upconversion nanophosphors (Gd2O2S:Eu@Gd2O2S:Yb/Tm), (F) TEM image of HL/CS coated radioluminescent and upconversion nanophosphors with encapsulated MTX (Gd2O2S:Eu@MTX@Gd2O2S:Yb/Tm@HL/CS).
Figure 3.
ζ-Potential of Gd2O2S:Eu@ Gd2O2S:Yb/Tm nanocapsules during sequential coating with HL and CS polyelectrolyte layers as a function of layer number.
Figure 4.
XRD powder patterns of (A) nanotemplate Gd2O3:Eu, (B) Radioluminescent and upconversion nanophosphors (Gd2O2S:Eu@Gd2O2S:Yb/Tm), (C) Radioluminescent and up-conversion nanophosphors, with encapsulated MTX and coated with multiple layers of HL and CS (Gd2O2S:Eu@MTX@Gd2O2S:Yb/Tm@HL/CS).
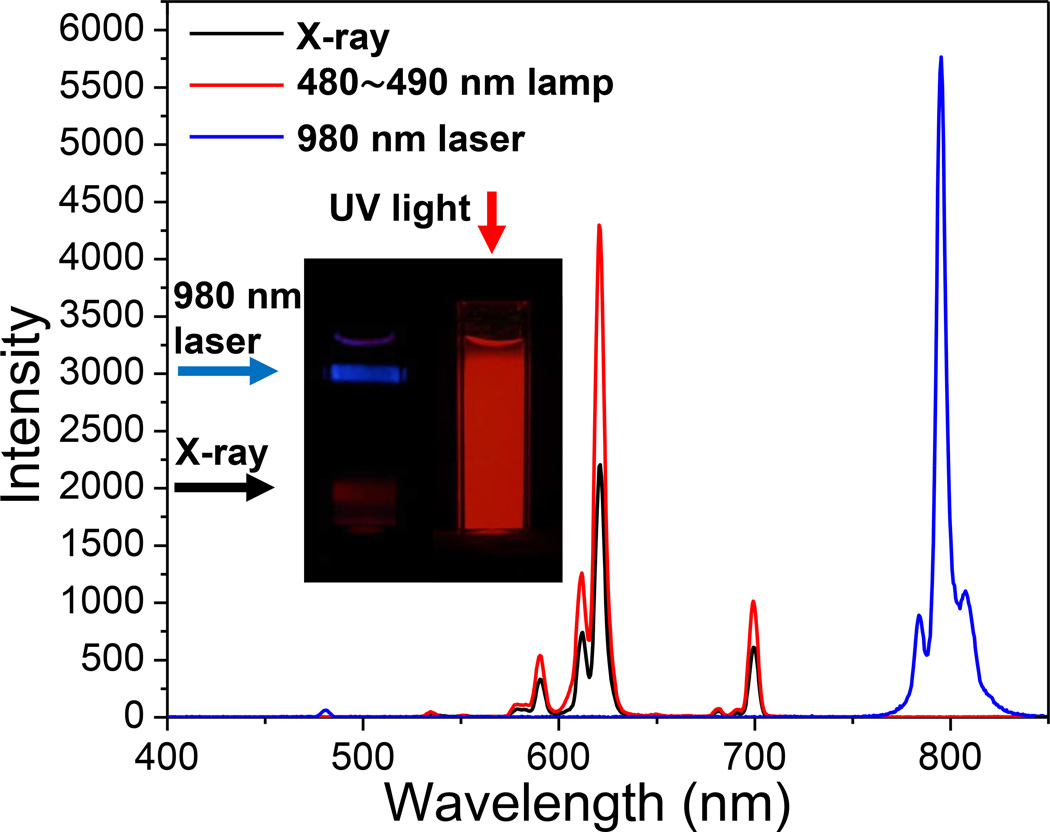
Figure 5 shows the luminescence spectra of the radioluminescent upconversion nanophosphors (Gd2O2S:Eu@Gd2O2S:Yb/Tm), under X-ray, 488 nm lamp, and 980 nm laser excitation. When the yolk-in-shell nanophosphors are irradiated by X-rays or blue light, the narrow luminescent peaks at 590, 612, 621, and 700 nm are attributed to the Eu3+ ion transitions 5D0,1→7FJ (J= 1, 2, 4) in the Gd2O2S:Eu core. The strongest red emission arises from the forced electric-dipole 5D0→7F2 transitions of the Eu3+ ions and is split into two peaks at 612 and 621 nm. These yolk-in-shell nanophosphors also display bright upconversion luminescence under 980 nm laser excitation (Figure 5). The main upconversion emission peaks were attributed to the Tm3+ ion transitions from the Gd2O2S:Yb/Tm shell, at 478 nm corresponding to 1G4→3H6 and at 800 nm corresponding to the 3H4→3H6 transition. Although solid GOS particles were fabricated containing all the dopants, Eu3+, Yb3+, and Tm, the resultant radioluminescent and upconversion luminescence intensity was reduced by 84% and 91%, respectively compared to the yolk-in-shell particles. This may be due to the cross-quenching of Eu3+ and Yb3+/Tm3+ in the matrix.
Figure 5.
Luminescence spectra of radioluminescent and upconversion nanophosphors under X-ray, 480~490 nm lamp, and 980 nm laser. Inset: photographs of cuvettes filled with a colloidal sollution of nanophosphors excited by irradiation with 980 nm light, X-rays, or UV light.
The nanocapsules were coated with a polyelectrolyte layer by iteratively suspending in a solution of negatively charged HL, followed by centrifugation, washing, and resuspending in positively charged CS. To build layer thickness in order to provide larger barrier for drug release, this coating process was repeated five times, ending with a positive charged CS surface. The first polyelectrolyte layer was negatively charged HL because the bare nanocapsules had a positively zeta potential (+31 mV). After the final layer was deposited, the polyelectrolyte coating was an average of 10 nm thick (Figure 2F). Cell viability test indicated that the nanophosphors (Gd2O2S:Eu@Gd2O2S:Yb/Tm) and the HL/CS multilayers coated nanocapsules Gd2O2S:Eu@Gd2O2S:Yb/Tm@HL/CS) showed no significant toxicity up to a concentration of at least 1000 µg/ml, the highest concentration measured (Figure S3, Supporting Information).
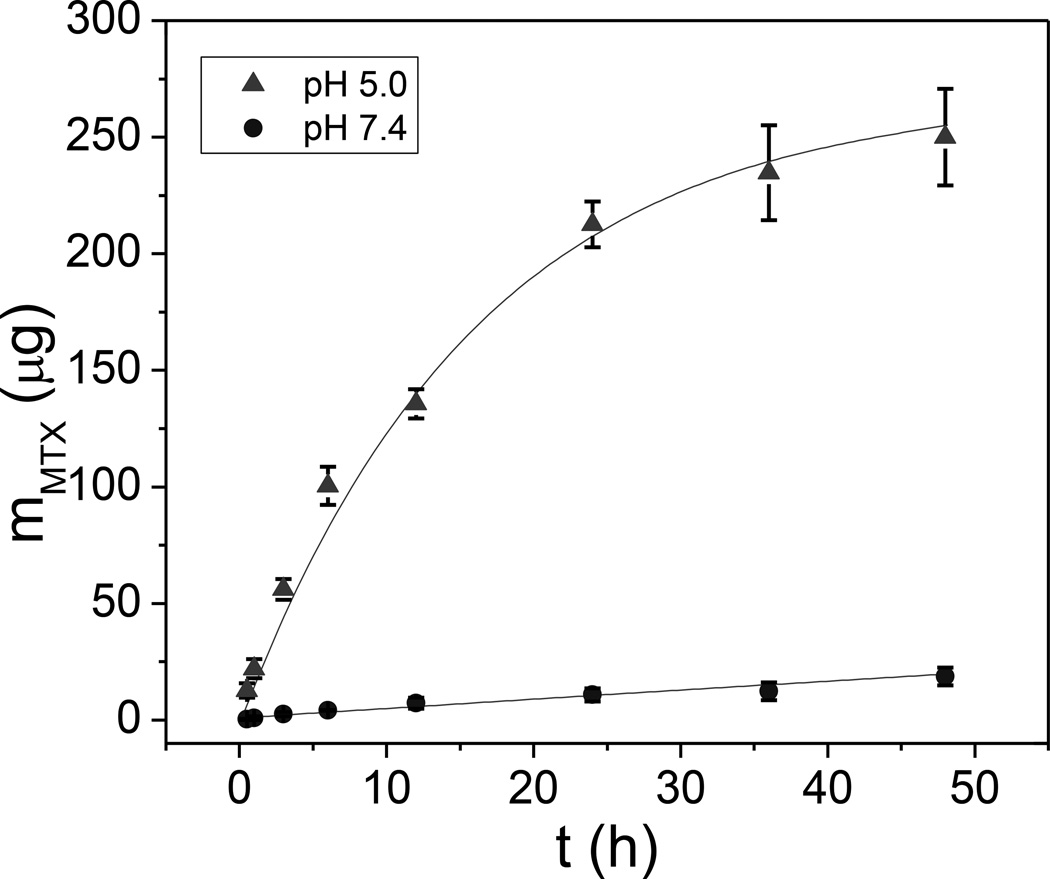
To study MTX release at normal physiological pH and in acidic conditions, we used high performance liquid chromatography (HPLC) to measure the release profile in PBS at pH 7.4 and 5.0, respectively (Figure 6). The drug was relatively rapidly released at pH 5.0 which is applicable for cancer therapy due to the low pH environment in tumors and within endosomes after internalization by cancer cells.[29] Based upon exponential fitting to the release curve, the release rate time constant was estimated to be ~ 30 days at pH 7.4, and 16.5 h at pH 5.0, respectively. From the amount of MTX released at pH 5.0 after 48 h, the encapsulated MTX in Gd2O2S:Eu@MTX@Gd2O2S:Yb/Tm@HL/CS was over 10 % of the nanoparticle weight.
Figure 6.
pH-dependent MTX release profile from 2.5 mg of Gd2O2S:Eu@MTX@Gd2O2S:Yb/Tm@HL/CS.
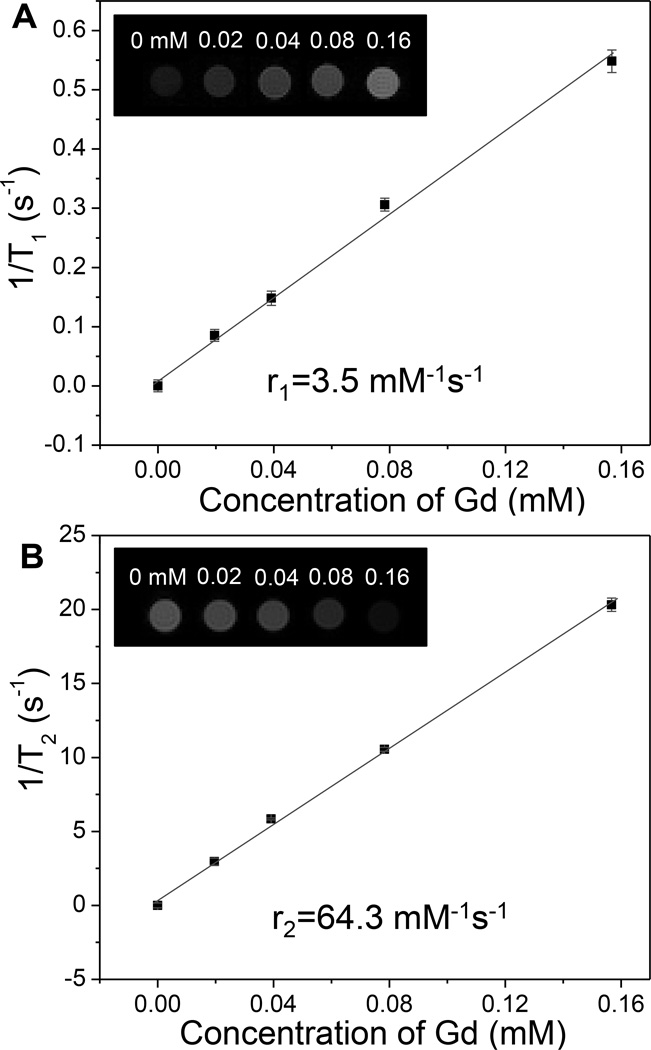
These radioluminescent upconversion nanophosphors also potentially serve as T1 and T2-weighted MRI contrast agents due to their paramagnetic composition (Figure S4, Supporting Information). In order to measure their MRI relaxivities, different concentrations of radioluminescent and upconversion nanophosphors with encapsulated MTX were prepared in 1 wt% agarose gel and imaged with a 4.7 T MRI instrument. Figure 7 clearly shows the positive T1 and negative T2 contrast effects of the radioluminescent nanophosphors: the T1-weighted images become brighter with increased particle concentration, while the T2-weighted images become darker with increased particle concentration. The T1 relaxivity coefficient (r1) for the nanophosphors could also be calculated from the curve of 1/T1 vs. concentration of gadolinium (Figure 7A). The data shows that r1 is 3.5 mM−1 s−1. The calculated r2 is 64 mM−1 s−1 which is close to FDA-approved iron oxide nanoparticle contrast agents such as Ferumoxtran (Resovist®, 65 mM−1 s−1), cross-linked iron oxide particle (CLIO-Tat, 62 mM−1 s−1), and water soluble iron oxide (WSIO, 78 mM−1s−1).[30, 31, 32]
Figure 7.
(A) T1-weighted and (B) T2-weighted MRI relaxivity as a function of nanophosphors concentration (in terms of dissolved Gd3+). Insets show T1 or T2 weighted images of magnetic at echo time of 4 ms.
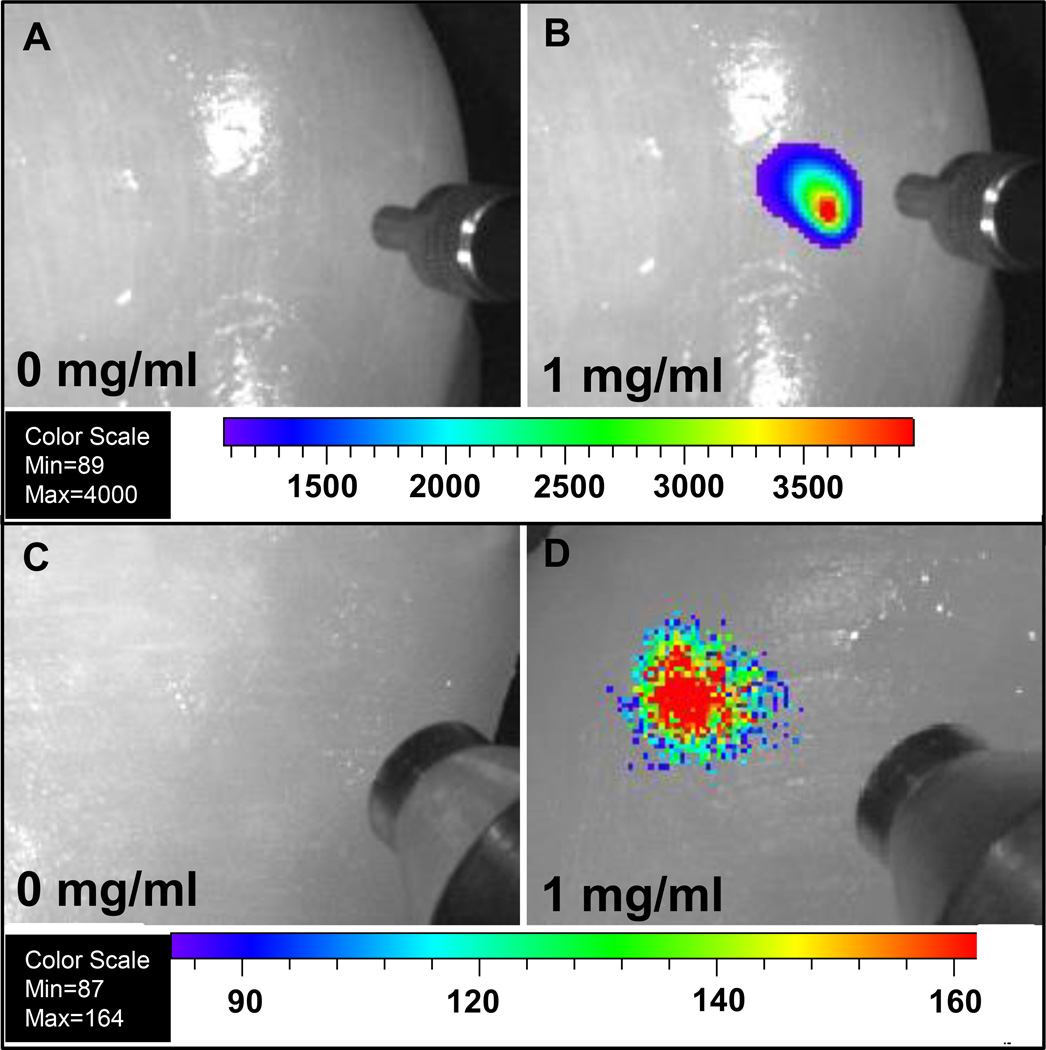
Although UV and visible-excited fluorescence measurements are challenging for tissue imaging due to relatively short tissue optical penetration depths and large background autofluorescence, our nanocapsules can be detected in deep tissue with almost no background using deeply penetrating X-rays and near infrared light (980 nm), respectively. To explore whether these nanophosphors could serve as imaging probes to locate tumours in tissue, these radioluminescent and upconversion nanophosphors (loaded with MTX) were injected into chicken breast. The nanophosphors display bright luminescence without background signal under 1 cm thickness of chicken breast at a dose of 1 mg/mL (200 µL), see Figure 8.
Figure 8.
Deep tissue imaging of radioluminescent and upconversion nanophosphors following injection 1 cm deep into chicken breast for 200 µl of (A) PBS solution under 980 nm laser, (B) 1 mg/mL nanophosphors with encapsulated MTX under 980 nm laser, (C) PBS solution under X-ray, (D) 1 mg/mL nanophosphors with encapsulated MTX under X-ray. The concentric cylindrical object in Figure A and B at the right of each image is a SMA905 terminus of an optical fiber used to illuminate the tissue with 980 nm light. The concentric cylindrical object in Figure C and D at the right of each image is a mini-X-ray tube.
3. Conclusion
In summary, multifunctional nanocapsules were prepared with a radioluminescent yolk, an upconversion luminescent shell, a polyelectrolyte coating for pH-dependent drug release, and dual T1/T2 MRI contrast enhancement. Compared with the codoped nanophsphors (Gd2O2S:Eu/Yb/Tm), the separated doping of Eu3+ and Yb3+/Tm3+prevents quenching of both radioluminescence and upconversion luminescence. The MTX release rate is controlled by pH due to the biocompatible multiple layers of polyelectrolytes on the surface of the nanophosphors. Serving as T1 and T2 weighted MRI contrast agent is advantageous as it allows multimodal MRI tracking of the nanophosphors and encapsulated drug. We expect that such nanocarriers, combining the advantages of multifunctional luminescence, controlled drug release, and MRI contrast, will find applications in anti-cancer imaging and therapy. Our synthesis technique is highly versatile because multifunctional particles can be prepared by coating the core templates by multiple layers of materials with controlled thickness. Different sizes of the nanophosphors and the hollow space between the core and shell can be obtained by varying the size of the Gd2O3:Eu templates and etching time by acetic acid, respectively. Future work will study the drug release and localization in vivo by radioluminescent luminescence, upconversion luminescence, and dual T1/T2 MRI images.
4. Experimental Section
4.1. Materials
Tetraethoxysilane (TEOS), hyaluronic acid sodium salt (HL, MW 15,000–30,000), and chitosan (CS, Medium molecular weight), sodium choride, and Mitoxantrone dihydrochloride were purchased from Sigma-Aldrich (St. Louis, MO). Gadolinium nitrate, ytterbium nitrate, europium nitrate, and thulium nitrate were purchased from Alfa Aesar (Ward Hill, MA). Ethanol (96%), urea, acetic acid, ammonium hydroxide, sodium chloride and nitric acid were obtained from BDH Chemicals Ltd (Poole, Dorset, UK). Deionized (DI) water was purchased from EMD Chemicals Inc. (Gibbstown, NJ, USA). Polyvinylpyrrolidone (PVP K-30, MW 40,000) was purchased from Spectrum Chemicals (Gardena, CA). Agarose (low melting point) was purchased from Shelton Scientific (Peosta, IA). All chemicals were used as received without further purification.
4.2. Preparation of monodispersed Gd2O3:Eu
2 ml Gd(NO3)3 (1M) with 1 mL Eu(NO3)3 (80 mM) and 12 g PVP in 2 L DI water was heated to 80 °C before 30 g urea was added to the solution. The solution was maintained at 80 °C for 40 min. Then, the reaction was quenched by placing the solution in an ice water bath. The particles were collected by centrifugation at 10,000 rpm (RCF: 11952 ×g, Beckman JA21 Centrifuge, Beckman Coulter, Inc, Brea CA) for 10 min and washed three times with DI water and one time with ethanol. The obtained particles were first dried in an oven at 80 °C for 3 h and then calcined at 600 °C for 1 h in air.
4.3. Preparation of silica coated and partially etched Gd2O3:Eu (Gd2O3:Eu@SiO2)
Gd2O3:Eu nanoparticles prepared in the previous step were suspended in 100 mL ethanol with 4 mL distilled water, 0.6 g PVP, and 4 ml ammonium hydroxide. TEOS (160 µL) was then added to the solution after the solution was stirred for 15 min. The particles were aged for 3 h before collected with centrifuge. The particles were washed with distilled water three times prior to use. In order to partially etch the Gd2O3:Eu core in the silica shell, the particles obtained in the previous step were resuspended in 100 ml distilled water with 0.3 g PVP and 400 µl acetic acid. After the particles were aged with acetic acid for 3h. The reaction was quenched by adding 5 g urea and the particles were recollected with centrifuge and washed with distilled water three times.
4.4. Preparation of radioluminescent and upconversion nanophosphors (Gd2O2S:Eu@Gd2O2S:Yb/Tm)
All the synthesized particles in the previous step were resuspeneded in 200 mL DI water. After this solution was heated to 80 °C, 2 mL Gd(NO3)3 (1M) with 1.875 mL Yb(NO3)3 (80 mM), 0.375 mL Tm(NO3)3 (80 mM), and 12 g urea were added to the solution. This solution was kept stirring at 80 °C for 60 min. This reaction was quenched by an ice water bath. The precursor was collected by centrifugation at 10,000 rpm for 10 min and washed three times with DI water and once with ethanol. The precursor of radioluminescent and upconversion nanophosphorswere collected by centrifugation and calcined in a furnace at 600 °C for 60 min. The powder was then transferred to a tube furnace with a sulfur/argon flow at 900 °C for 60 min. The silica inner shell was etched by incubation of the nanophosphors in NaOH (2 M) for 12 h.
4.5. Preparation of HL and CS coated nanophosphors with loaded MTX (Gd2O2S:Eu@MTX@Gd2O2S:Yb/Tm@ HL/CS)
Layer-by-layer (LBL) deposition was performed by the dipping method. The first layer was coated by addition of 2 mL radioluminescent and upconversion nanophosphors (15 mg/L) drop by drop into 10 mL aqueous HL solution (1 mg/mL) containing 0.5 M NaCl. The mixture was sonicated for 10 min to deposit the HL layer on the surface of nanophosphors. The excess HL was removed by three repeated cycles of centrifugation (10,000 rpm, 20 min) and washing. The particles were redispersed into 2 mL DI water. The following CS layer was deposited on the particles obtained in the previous step bydrop by drop adding the 2 mL nanophosphors into 10 mL CS solution (1.0 mg/mL) containing 0.3 vol% acetic acid and 0.5 M NaCl. Subsequent alternating HL and CS layers were deposited in the same way until the desired number of polyelectrolyte layers was achieved.
The MTX was loaded into the biocompatible polymer-coated yolk-in-shell radioluminescent and upcoversion nanoparticles by incubating MTX (20 mg) with the nanoparticles (20 mg) in 2 ml water (pH 5.0, adjusted by 1 mM HCl) at room temperature under vacuum. After the water completely evaporated, the free MTX was removed by multiple times washing with water (pH 8.0, adjusted by 1 mM NaOH) until the supernatant was clear.
4.6. In vitro pH-triggered drug release study
200 µL of MTX encapsulated nanophosphors with polyelectrolyte multilayers (12.5 mg/ml) were suspended with release media at pH 5.0 and 7.4 in Slide-A-Lyzer MINI dialysis units at room temperature. The release medium was removed for analysis at given time intervals, and replaced with the same volume of fresh release medium. The MTX concentration was measured by HPLC.
4.7. Preparation of nanophosphors for MRI Imaging
T1 and T2 MRI measurements were acquired for the nanoparticles (Gd2O2S:Eu@MTX@Gd2O2S:Yb/Tm@ HL/CS) at a series of concentrations. The particles were dispersed in 1% agarose gel at 80 °C and cooled to room temperature in NRM tubes to set the gel. The gel prevented settling and aggregation allowing MRI imaging several days after preparation.
4.8. Cell viability assay
MCF-7 breast cancer cells were seeded at a density of 10,000 cells/well in a 96-well plate. Cells were stored at 37 °C at 5% CO2 and attached to the plate overnight. Nanocapsules were suspended in media, sonicated for 10 minutes to disperse, and diluted to 1000, 500, 250, 100, and 50 µg/ml. Media was removed from wells and fresh media or nanoparticle in media was added to each well. Five repeats were done for each concentration. Nanoparticles were incubated with cells overnight and the next day a Presto Blue assay (Life Technologies) was performed. Media was removed and 100 µl of a 1:9 ratio Presto Blue in culture media was added to each well. Cells were incubated at 37 °C and 5% CO2 for 45 minutes. Fluorescent intensity was measured with a plate reader with an excitation wavelength of 560 nm and an emission wavelength of 590 nm. Fluorescent intensity for each concentration of nanoparticle was normalized as a percentage of the fluorescent intensity of the control cells. Percent viability averages were plotted with error bars of one standard deviation.
4.9. Characterization methods
Transmission and scanning electron microscopy were performed on a H9500 operated at 300 kV and HD2000 microscope operated at 100 kV, respectively. An X-ray diffractometer (Rigaku; MiniFlex, Cu Kα) was used to characterize the XRD pattern of the prepared nanoparticles. The Zeta-potential of nanoparticles was measured with a Zetasizer Nano ZS (equipped with a 633 nm He-Ne laser) from Malvern Instruments. Prior to the experiment, the particles were diluted in distilled water (0.1 mg/ml). Magnetization measurements were performed at 300 K using vibrating sample magnetometer (VSM) option of physical property measurement system (PPMS, Quantum Design, USA), with the applied magnetic field sweeping between +/− 3.0 Tesla at a rate of 50 Oe/sec. To measure radioluminescence, X-ray was generated by a mini X-ray tube (Amptek Inc. MA, USA), the X-ray tube was operated with tube voltage of 40 kV and tube current of 99 µA. X-ray and up-conversion luminescence images were captured in an IVIS Lumina-XR Imaging System (Caliper Life Sciences, Hopkinton, MA, US) with 1 s exposure time, respectively, in “bioluminescence mode”. The Zeta-potential of nanoparticles was measured with a Zetasizer Nano ZS (equipped with a 633 nm He-Ne laser) from Malvern Instruments. Prior to the experiment, the particles were diluted in DI water to desired concentration. Determination of the gadolinium content in a sample was performed by inductively coupled plasma (ICP) (Optima 3100 RL, Perkin-Elmer). Fourier transform infrared spectra (FTIR) were acquired with a Thermo-Nicolet Magna 550 FTIR instrument. The pore size distribution of the nanophosphors was measured by the Barret-Joner-Halenda (BJH) method.
All MRI experiments were performed on a Varian 4.7 T horizontal bore imaging system (Agilent Inc, Santa Clara, CA). Samples, contained in 5 mm NMR tubes, were placed in a 63 mm inner diameter quadrature RF coil for imaging. MRI gradient echo scout images were collected in all three imaging planes (axial, coronal, and sagittal) for subsequent image planning, with repetition time (TR) = 100 ms, echo time (TE) = 4 ms, number of slices =20, slice thickness =2, matrix size 128×128, field of view (FOV) = 40 mm×40 mm, number of acquisitions (NEX) =2. Relaxivity measurements were then collected on a single 2 mm thick imaging slice, approximately perpendicular to the long axis of the NMR tubes. T2 relaxivity measurements were acquired with FOV = 36 mm×36 mm, using a multi-spin echo imaging sequence with TR = 3000, NEX = 10, echo spacing = 4ms, number of echoes = 10, and 128×128 matrix. T1 relaxivity measurements were acquired using the same slice geometry and imaging matrix with a segmented fast low angle shot (FLASH) sequence with inversion recovery with inversion times of 50, 97, 186, 360, 695, 1341, 2590, and 5000ms, with TR = 6000 ms, TE = 2.1 ms, and NEX = 8.
Following data collection, images were analyzed using Matlab 2011a (The Mathworks, Inc., Natick, MA). Regions of interest (ROI’s), encompassing approximately 70–80 voxels, were manually drawn in each sample, and the signals from those voxels averaged to obtain a mean signal for each sample. The same ROI was used to calculate the mean signal of the sample across all echo times.
Supplementary Material
Acknowledgement
This research was supported in part by National Science Foundation (NSF) CAREER award CHE1255535 to HC, FW, and JNA, an NSF award CMMI-1100684 to BQ and OTM, and an NSF award CMMI-1130636 to TC. Electron microscopy images were acquired at the Clemson University Electron Microscope Facility and use of this facility was funded by The Center of Biomaterials for Tissue Regeneration (CBTR) funded under National Institutes of Health (NIH) grants 5P20RR021949 and 8P20GM103444.
Footnotes
Supporting Information, comprising characterization data via pore size distribution and FTIR spectroscopy, a cytotoxicity assay, and a vibrating sample magnetometer magnetic hysteresis loop, is available from the Wiley Online Library or from the author.
References
- 1.van Dalen EC, van der Pal HJH, Bakker PJM, Caron HN, Kremer LCM. European Journal of Cancer. 2004;40:643. doi: 10.1016/j.ejca.2003.12.006. [DOI] [PubMed] [Google Scholar]
- 2.Liu J, Qiao SZ, Chen JS, Lou XW, Xing X, Lu GQ. Chemical Communications. 2011;47:12578. doi: 10.1039/c1cc13658e. [DOI] [PubMed] [Google Scholar]
- 3.Lu B, Xiong S-B, Yang H, Yin X-D, Chao R-B. European Journal of Pharmaceutical Sciences. 2006;28:86. doi: 10.1016/j.ejps.2006.01.001. [DOI] [PubMed] [Google Scholar]
- 4.Law SL, Ho CK, Jang TF, Chang P, Lin FM. International Journal of Pharmaceutics. 1996;128:139. [Google Scholar]
- 5.Chen H, Yang W, Chen H, Liu L, Gao F, Yang X, Jiang Q, Zhang Q, Wang Y. Colloids and Surfaces. B. Biointerfaces. 2009;73:212. doi: 10.1016/j.colsurfb.2009.05.020. [DOI] [PubMed] [Google Scholar]
- 6.Ma Y, Zhou L, Zheng H, Xing L, Li C, Cui J, Che S. Journal of Materials Chemistry. 2011;21:9483. [Google Scholar]
- 7.Wani A, Muthuswamy E, Savithra GL, Mao G, Brock S, Oupický D. Pharm Res. 2012;29:2407. doi: 10.1007/s11095-012-0766-9. [DOI] [PubMed] [Google Scholar]
- 8.Huang X, Brazel CS. Journal of Controlled Release. 2001;73:121. doi: 10.1016/s0168-3659(01)00248-6. [DOI] [PubMed] [Google Scholar]
- 9.Croisier F, Jérôme C. European Polymer Journal. 2013;49:780. [Google Scholar]
- 10.Nam H, An J, Chung D, Kim J-H, Chung C-P. Macromol. Res. 2006;14:530. [Google Scholar]
- 11.Chen H, Moore T, Qi B, Colvin DC, Jelen EK, Hitchcock DA, He J, Mefford OT, Gore JC, Alexis F, Anker JN. ACS Nano. 2013 doi: 10.1021/nn304369m. [DOI] [PMC free article] [PubMed] [Google Scholar]
- 12.Xu Z, Li C, Ma Pa, Hou Z, Yang D, Kang X, Lin J. Nanoscale. 2011;3:661. doi: 10.1039/c0nr00695e. [DOI] [PubMed] [Google Scholar]
- 13.Kang X, Cheng Z, Li C, Yang D, Shang M, Ma Pa, Li G, Liu N, Lin J. The Journal of Physical Chemistry C. 2011;115:15801. [Google Scholar]
- 14.Moore T, Chen H, Morrison R, Wang F, Anker JN, Alexis F. Molecular Pharmaceutics. 2013;11:24. doi: 10.1021/mp400419k. [DOI] [PMC free article] [PubMed] [Google Scholar]
- 15.van Veggel FCJM, Dong C, Johnson NJJ, Pichaandi J. Nanoscale. 2012;4:7309. doi: 10.1039/c2nr32124f. [DOI] [PubMed] [Google Scholar]
- 16.Chen H, Qi B, Moore T, Colvin DC, Crawford T, Gore JC, Alexis F, Mefford OT, Anker JN. Small. 2013 doi: 10.1002/smll.201300828. [DOI] [PMC free article] [PubMed] [Google Scholar]
- 17.Chen H, Longfield DE, Varahagiri VS, Nguyen KT, Patrick AL, Qian H, VanDerveer DG, Anker JN. Analyst. 2011;136:3438. doi: 10.1039/c0an00931h. [DOI] [PubMed] [Google Scholar]
- 18.Chen H, Patrick AL, Yang Z, VanDerveer DG, Anker JN. Analytical Chemistry. 2011;83:5045. doi: 10.1021/ac200054v. [DOI] [PubMed] [Google Scholar]
- 19.Chen H, Rogalski MM, Anker JN. Physical Chemistry Chemical Physics. 2012;14:13469. doi: 10.1039/c2cp41858d. [DOI] [PMC free article] [PubMed] [Google Scholar]
- 20.Carpenter CM, Sun C, Pratx G, Liu H, Cheng Z, Xing L. Opt. Express. 2012;20:11598. doi: 10.1364/OE.20.011598. [DOI] [PMC free article] [PubMed] [Google Scholar]
- 21.Pratx G, Carpenter CM, Sun C, Lei X. Medical Imaging, IEEE Transactions on. 2010;29:1992. doi: 10.1109/TMI.2010.2055883. [DOI] [PubMed] [Google Scholar]
- 22.Chen D, Zhu S, Yi H, Zhang X, Chen D, Liang J, Tian J. Medical Physics. 2013;40:031111. doi: 10.1118/1.4790694. [DOI] [PubMed] [Google Scholar]
- 23.Ntziachristos V. Nat Meth. 2010;7:603. doi: 10.1038/nmeth.1483. [DOI] [PubMed] [Google Scholar]
- 24.Xu CT, Svenmarker P, Liu H, Wu X, Messing ME, Wallenberg LR, Andersson-Engels S. ACS Nano. 2012;6:4788. doi: 10.1021/nn3015807. [DOI] [PubMed] [Google Scholar]
- 25.Shimizu K, Tochio K, Kato Y. Appl. Opt. 2005;44:2154. doi: 10.1364/ao.44.002154. [DOI] [PubMed] [Google Scholar]
- 26.Oyewumi MO, Yokel RA, Jay M, Coakley T, Mumper RJ. Journal of Controlled Release. 2004;95:613. doi: 10.1016/j.jconrel.2004.01.002. [DOI] [PubMed] [Google Scholar]
- 27.Sonavane G, Tomoda K, Makino K. Colloids and Surfaces. B. Biointerfaces. 2008;66:274. doi: 10.1016/j.colsurfb.2008.07.004. [DOI] [PubMed] [Google Scholar]
- 28.Kulkarni S, Feng S-S. Pharm Res. 2013;30:2512. doi: 10.1007/s11095-012-0958-3. [DOI] [PubMed] [Google Scholar]
- 29.Schmaljohann D. Advanced Drug Delivery Reviews. 2006;58:1655. doi: 10.1016/j.addr.2006.09.020. [DOI] [PubMed] [Google Scholar]
- 30.Wang Y, Hussain S, Krestin G. European radiology. 2001;11:2319. doi: 10.1007/s003300100908. [DOI] [PubMed] [Google Scholar]
- 31.Josephson L, Tung C, Moore A, Weissleder R. Bioconjugate Chemistry. 1999;10:186. doi: 10.1021/bc980125h. [DOI] [PubMed] [Google Scholar]
- 32.Jun Y, Huh Y, Choi J, Lee J, Song H, Kim K, Yoon S, Kim K, Shin J, Suh J, Cheon J. Journal of the American Chemical Society. 2005;127:5732. doi: 10.1021/ja0422155. [DOI] [PubMed] [Google Scholar]
Associated Data
This section collects any data citations, data availability statements, or supplementary materials included in this article.


