

Abstract
Lay Abstract
Background
Conversation requires integration of information from faces and voices to fully understand the speaker’s message. To detect auditory-visual asynchrony of speech, listeners must integrate visual movements of the face, particularly the mouth, with auditory speech information. Individuals with autism spectrum disorder (ASD) may be less successful at such multisensory integration, despite their demonstrated preference for looking at the mouth region of a speaker.
Method
We showed a split-screen video of two identical individuals speaking side by side. Only one of the speakers was in synchrony with the corresponding audio track and synchrony switched between the two speakers every few seconds. Participants had to watch the video, without further instructions (implicit condition) or specifically watch the in-synch speaker (explicit condition). We recorded which part of the screen and face their eyes targeted
Participants
Individuals with and without high-functioning autism (HFA) aged 8–19.
Results
Both groups looked at the in-synch video significantly more with explicit instructions. However, participants with HFA looked at the in-synch video less than typically developing (TD) peers and did not increase their gaze time as much as TD participants in the explicit task. Importantly, the HFA group looked significantly less at the mouth than their TD peers, and significantly more at the non-face regions of the image. There were no between-group differences for eye-directed gaze.
Conclusions
Individuals with HFA spend less time looking at the crucially important mouth region of the face during auditory-visual speech integration, which is non-effective gaze behavior for this type of task.
Scientific Abstract
Background
Conversation requires integration of information from faces and voices to fully understand the speaker’s message. To detect auditory-visual asynchrony of speech listeners must integrate visual movements of the face, particularly the mouth, with auditory speech information. Individuals with autism spectrum disorder (ASD) may be less successful at such multisensory integration, despite their demonstrated preference for looking at the mouth region of a speaker.
Method
We showed a split-screen video of two identical individuals speaking side by side. Only one of the speakers was in synchrony with the corresponding audio track and synchrony switched between the two speakers every few seconds. Participants were asked to watch the video, without further instructions (implicit condition) or to specifically watch the in-synch speaker (explicit condition). We recorded which part of the screen and face their eyes targeted.
Participants
Individuals with and without high-functioning autism (HFA) aged 8–19.
Results
Both groups looked at the in-synch video significantly more with explicit instructions. However, participants with HFA looked at the in-synch video less than typically developing (TD) peers and did not increase their gaze time as much as TD participants in the explicit task. Importantly, the HFA group looked significantly less at the mouth than their TD peers, and significantly more at non-face regions of the image. There were no between-group differences for eye-directed gaze.
Conclusions
Individuals with HFA spend less time looking at the crucially important mouth region of the face during auditory-visual speech integration, which is maladaptive gaze behavior for this type of task.
Keywords: Face perception, Audio-visual integration, High-functioning autism, eye tracking, mouth-directed gaze
During daily communication, spoken words are combined with facial and manual gestures to allow for more complete understanding of our messages. Visual speech information (e.g. lip movements) is rapidly integrated with auditory signals and supports comprehension, particularly in noisy environments (Sumby & Pollack, 1954). Individuals with autism spectrum disorder (ASD) have demonstrated difficulty integrating information from different sensory modalities (see Iarocci & McDonald, 2006b for review), although the evidence is not clear cut.
There are data showing that low-level integration of simple, non-verbal visual and auditory stimuli, such as beeps and flashes are preserved in ASD (van der Smagt, van Engeland, & Kemner, 2007; Zainal et al., 2014). On the other hand, studies have demonstrated reduced robustness in this population of the McGurk effect (McGurk & MacDonald, 1976), in which auditory /ga/ is blended with visual speech /ba/ to be perceived as /da/ (de Gelder, Vroomen, & van der Heide, 1991; Hampson, van Anders, & Mullin, 2006; Irwin, 2006; Magnée, de Gelder, van Engeland, & Kemner, 2008; Zainal et al., 2014). This task is often used to determine how people integrate speech information from voices and faces, as necessary in every-day speech. Children with ASD tend to give perceptual priority to auditory over visual speech information in this type of task. However, this deficit is not always present (Nishiyama & Kanne, 2014) and may be driven mostly by reduced lipreading skills (Medeiros & Winsler, 2014). This lipreading deficit may result in greater reliance on auditory over visual aspects of audio-visual (AV) speech (Iarocci, Rombough, Yager, Weeks, & Chua, 2010) and explain why individuals with high-functioning autism (HFA) have reduced attention to visual speech (de Gelder et al., 1991) and do not derive as much comprehension benefit from lip movements as typically developing (TD) peers in a speech-in-noise paradigm (Smith & Bennetto, 2007), which may have negative impact on comprehension during social communication.
Receptive speech tasks in which the auditory and visual channels are out of temporal synchrony place high demands on AV speech integration. The visual system (high spatial acuity) and the auditory system (high temporal acuity) both contribute significantly to resolving conflicting intermodal timing information and individuals with ASD may have difficulty with this type of multi-modal speech integration (Iarocci & McDonald, 2006b; Iarocci et al., 2010; Shams, Kamitani, & Shimojo, 2004). However, the evidence is not without contradiction. Some studies show reduced ability to detect AV asynchrony for speech and non-speech (flashes and beeps) stimuli with short (40–320ms) temporal offsets (Piven & Sasson, 2014) or large (3000ms) temporal offset (Ulloa & Pineda, 2007). Other data show that children with HFA are as capable as their TD peers at detecting audio-visual asynchrony with a range of short temporal offsets (Grossman, Schneps, & Tager-Flusberg, 2009).
The lack of consensus across studies may stem from differences in experimental paradigms and participant selection. Grossman et al. (2009) studied adolescents, presenting phrase-level speech with audio lagging behind video by 4–12 (120–400ms) frames. Participants with HFA detected asynchrony as accurately as TD peers for all audio-lag rates. By contrast, Bebko et al. (2006) used significantly longer temporal offsets (3 seconds) in a preferential looking paradigm with preschool-aged children. Here, the ASD group – in contrast to the TD group - exhibited no preference for looking at synchronous linguistic stimuli, but preserved preferential looking toward synchronous non-linguistic stimuli. de Boer-Schellekens et al. (2013) found that adolescents with ASD were less sensitive to very small differences in audio-visual synchrony of non-linguistic and linguistic (syllables) stimuli than TD peers. Overall, individuals with ASD seem to have some ability to integrate auditory and visual information, but may attend to each of these channels differently across stimuli and task demands. The relative attentional allocation on visual speech can by better understood through analysis of gaze patterns to speaking faces, specifically the degree of visual fixation to the mouth region, which contains most relevant information for integration of auditory-visual speech signals.
Eyetracking studies of individuals with HFA have documented a preference to gaze at the mouth and avoid the eye region of a face (Jones W, 2008; Joseph & Tanaka, 2003; Klin, Jones, Schultz, Volkmar, & Cohen, 2002; Langdell, 1978; Neumann, Spezio, Piven, & Adolphs, 2006; Paul, Campbell, Gilbert, & Tsiouri, 2013; Pelphrey et al., 2002; Spezio, Adolphs, Hurley, & Piven, 2007), although recently, several studies have not shown this effect (Bar-Haim, Shulman, Lamy, & Reuveni, 2006; Nishimura, Rutherford, & Maurer, 2008; Rutherford & McIntosh, 2007; Rutherford & Towns, 2008). However, these findings are not based on auditory-visual speech integration tasks. Eyetracking evidence for visual speech processing shows that TD individuals prefer gazing at central face areas in tasks requiring greater reliance on visual speech, such as scenarios with low-intensity auditory signals (Buchan, Pare, & Munhall, 2007) or specifically the mouth (Lansing & McConkie, 2003; Vatikiotis-Bateson, Eigsti, Yano, & Munhall, 1998). TD participants derive significant comprehension benefit from mouth movements (Sumby & Pollack, 1954) and show reduced AV integration when relying on peripheral face regions (Paré, Richler, Hove, & Munhall, 2003). If individuals with ASD have an a-priori preference for gazing at the mouth, this should provide them with an advantage in speech reading tasks, which has not been noted in the literature. On the other hand, a deficit in AV integration might mitigate a potential mouth-gaze advantage.
Task design and response demands may also influence performance on AV speech integration. Summerfield and McGrath (1984) showed that TD individuals are susceptible to instruction bias when attending to audio-visual information. When asked to report what they heard, participants showed greater reliance on the auditory component, than when the instructions were phrased more neutrally. Iarocci et al. (2010) emphasize the importance of taking this potential bias into account when investigating inter-modal sensory integration in children with ASD. The type of behavioral response required (e.g. verbal or manual button presses) may also influence the performance (Nuske, Vivanti, & Dissanayake, 2014). To determine the ability of individuals with ASD to integrate AV speech information, studies should use ecologically valid stimuli, such as continuous speech, in tasks involving instructions and response types that impose no sensory bias. Eyetracking analysis will allow us to determine whether reduced ability to integrate bimodal speech in this population is based on reduced gaze to relevant face areas or a separate sensory integration deficit.
We created an AV integration task for continuous, natural speech without required task response. To investigate the effects of task instructions, we presented implicit (no instructions given other than “look and listen”) and explicit (“look at the person who’s talking”) conditions. We used eyetracking to determine whether individuals with HFA use mouth-directed gaze to process AV asynchrony and whether gaze patterns to the crucially important mouth region change with explicit task instructions. We hypothesize that participants with HFA will 1.) Gaze at the in-synch speaker in the implicit task less than their TD peers, 2.) Increase gaze to the in-synch face with explicit instructions, but less so than TD participants, 3.) Show no overall increased gaze to the mouth, or 4.) Decreased gaze to the eyes compared to TD peers.
Methods
We enrolled children and adolescents with high-functioning autism (HFA, N=30) and TD controls (N=30) aged 8–19 years, matched on age, sex, IQ and receptive vocabulary skills. All participants passed vision, color vision, and hearing screenings. Participants were recruited through local schools, advertisements in magazines, newspapers, the internet, autism advocacy groups, and word of mouth. All descriptive characteristics are in Table 1. Informed consent was obtained under a protocol of the University of Massachusetts Medical School Institutional Review Board.
Table 1.
Descriptive Characteristics of Participant groups
| HFA (n=30) M(SD) |
TD (n=30) M(SD) |
|
|---|---|---|
| Age | 11:10(1:4) | 12:5(0:11) |
| Range: 8:5– 19:0 | Range: 8:6 – 17:11 | |
| Sex | 28 male | 25 male |
| 2 female | 5 female | |
| IQ | 104(15.9) | 109(11.2) |
| Range: 80 – 137 | Range: 82–128 | |
| PPVT-III | 107.8(20.5) | 113.9(11.9) |
| Range: 80 – 154 | Range: 90 – 135 |
Diagnosis of HFA
Participants with ASD met DSM-IV criteria for autistic disorder, based on expert clinical impression and confirmed by the Autism Diagnostic Observation Schedule – Module 3 (ADOS, Lord, Rutter, DiLavore, & Risi, 1999) administered by experienced examiners. Participants with known genetic disorders were excluded to reduce heterogeneity of the cohort. Based on ADOS algorithm scores, 15 participants met criteria for autism and 15 met criteria for ASD. We also conducted standardized IQ (Leiter International Performance Scale Revised (Leiter-R, Roid & Miller, 1997) and receptive vocabulary (Peabody Picture Vocabulary Test (PPVT-III; Dunn & Dunn, 1997) tests to verify that participants in the ASD group also had language and cognitive skills within normal limits, allowing us to describe them as having High-Functioning Autism (HFA). Using multivariate ANOVA with group as the independent variable we verified that the HFA and TD groups did not differ significantly in age, F (1, 59) = .84, p = .36, IQ, F (1,59) = 1.93, p = .17, or receptive vocabulary ability, F (1,59) = 1.98, p = .16. A chi-squared analysis showed that the groups did not differ in distribution of gender (χ2 (1,N = 60) = 1.46, p = .42).
Stimuli
The video showed a woman’s head and neck against a neutral background, speaking in simple, clear language, using high-frequency vocabulary and sentence structure (Grossman et al., 2009). We presented the same video in side-by-side frames on a computer monitor, with one of the two videos lagging behind the other by 10 frames, or 330ms. We chose to delay the audio, rather than the video, because an audio delay was found to produce more reliable detection levels (Grossman et al., 2009) and not to result in age-related differences that could have been a confound (Kozlowski & Cutting, 1977). The 330ms delay was chosen because it is significantly longer than the temporal binding windows for low-level bimodal stimuli, such as flashes and beeps (Hall, Szechtman, & Nahmias, 2003) and syllables (Nuske et al., 2014) in this population (<184ms). We are therefore confident that eye-gaze patterns recorded in our task were not affected by low-threshold differences in temporal binding. In addition, our prior study showed that cohorts with and without HFA could detect onset asynchrony above chance (>63%) at this audio delay (Grossman et al., 2009), thereby making this task difficult enough to maintain attention and avoid ceiling-level performance, while also enabling participants to detect the synchronous speaker at above-chance levels.
We created two versions of the stimuli, one showing the left video lagging behind the right and the other showing the right video lagging behind the left. We alternated presentation of the two versions in the implicit condition across participants and showed the alternate version in the explicit condition. A single audio track accompanied the two videos and switched from being in synch with the left or right video every 8–18 seconds with a pseudo-random distribution of longer and shorter intervals. The audio was always in synch with one of the two videos and lagged behind the other by 10 frames. Since the audio-switch edit points contained visually noticeable “blips,” we inserted additional edit points - or “blips” - into the video every eight or nine seconds, not all of which were followed by an audio synchrony switch. This served to disguise audio switching points and effectively eliminated potential cueing of participants. The complete stimulus video was 4 minutes and 37 seconds long and shown using Presentation software (Neurobehavioral Systems, http://www.neurobs.com).
Procedure
Participants sat in front of a monitor connected to an ISCAN RK-826 PCI Pupil/Corneal Reflection 60Hz Tracking System (ISCAN Corp., Woburn, MA) at a comfortable viewing distance. The infrared light source and eye camera were mounted below the monitor, affording participants free range of head movements. All participants successfully completed a calibration task guiding them to look at the four corners and center of the screen.
In the first (implicit) condition participants were introduced to the task and provided minimal instructions (““look and listen” to the video of a woman talking about baking dessert”), so we could record unbiased gaze behavior. No overt response was required. After completion of the implicit condition, we introduced an unrelated distractor task, followed by presentation of the second (explicit) condition. We told participants they would see the same video as before, but that the audio would be in synch with only one of the two faces at a time and that synchrony would switch back and forth between the two sides at random intervals. Their instructions were to “listen carefully and look only at the person speaking.” Again, no response, other than eye gaze was required, thereby eliminating sensory bias in response type between the two conditions.
Results
We recorded x- and y- coordinates of the point of regard for every time sample (60 Hz). A fixation was defined as point of regard maintaining maximum horizontal deviation of 5 pixels and maximum vertical deviation of 3 pixels for a minimum of 40ms. We analyzed three eyetracking variables: 1. Looking time to a specified region of interest (ROI, described below) as a percentage of overall looking time to the screen, 2. Number of fixations to an ROI, 3. Time to first fixation (in seconds) to an ROI after each synchrony side change.
We defined six ROIs: eyes, mouth, upper face, lower face, non-face, and video (see Figure 1). The eye ROI encompassed the upper and lower lids, and eyebrows. The mouth ROI encompassed the lips and surrounding areas involved in speech. The upper face ROI was defined by a horizontal line across the tip of the nose as the lower border and encompassed the area up to the hairline and ears (including the eyes). The lower face ROI was defined with the same horizontal line as the upper border and encompassed the area down to and including the chin and both cheeks (including the mouth). The non-face ROI included the hair, neck, and background of each image. The video ROI encompassed the entire video of each speaker, providing an overall measure of whether participants were looking at the in-synch video. Initial analysis showed that upper face and lower face ROI results were driven almost exclusively by data from eye and mouth ROIs, so data presentation will focus on eyes, mouth, non-face, and video ROIs. Results for all six ROIs are in Tables 2, 3, and 4.
Figure 1.
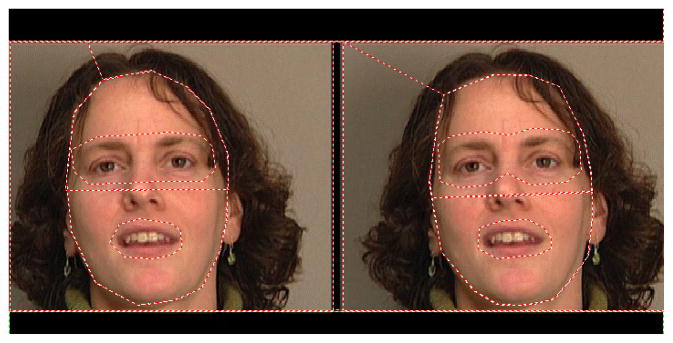
Screenshot of video stimuli with Regions of Interest
Table 2.
Percent Looking Time
| Task Version | ROI | HFA (N=30) Mean (StDev) |
TD (N=30) Mean (StDev) |
|---|---|---|---|
| Implicit | Eyes | 7.53 (8.55) | 7.57 (7.77) |
| Mouth | 3.1 (2.96) | 8.53 (8.98) | |
| Side | 31.25 (12.04) | 44.7 (20.37) | |
| Non-face | 4.73 (3.29) | 2.92 (2.9) | |
| Upper Face | 11.62 (11.28) | 13.58 (13.23) | |
| Lower Face | 14.9 (8.51) | 28.2 (21.56) | |
|
| |||
| Explicit | Eyes | 6.1 (5.45) | 8.25 (8.34) |
| Mouth | 3.27 (5.02) | 11.3 (11.16) | |
| Side | 35.23 (15.86) | 56.68 (22.96) | |
| Non-face | 6.25 (3.03) | 3.95 (4.47) | |
| Upper Face | 11.82 (9.56) | 14.5 (12.47) | |
| Lower Face | 17.17 (15.17) | 38.23 (24.37) | |
Table 3.
Number of Fixations
| Task Version | ROI | HFA (N=30) Mean (StDev) |
TD (N=30) Mean (StDev) |
|---|---|---|---|
| Implicit | Eyes | 142.07 (121.77) | 150.53 (113.87) |
| Mouth | 62.03 (59.32) | 99.43 (77.28) | |
| Side | 702.43 (364.59) | 729.37 (360.47) | |
| Non-face | 145.5 (85.53) | 99.03 (93.85) | |
| Upper Face | 247.63 (231.54) | 260.87 (198.89) | |
| Lower Face | 309.3 (222.57) | 369.47 (199.86) | |
|
| |||
| Explicit | Eyes | 114.1 (121.05) | 134.93 (108.69) |
| Mouth | 57.87 (53.27 | 92.57 (88.66) | |
| Side | 773.63 (347.43) | 727.8 (413.62) | |
| Non-face | 185.03 (85.0) | 98.7 (113.71) | |
| Upper Face | 271.93 (228.77) | 239.77 (180.55) | |
| Lower Face | 316.67 (236.37) | 389.33 (289.67) | |
Table 4.
Time to First Fixation, in Seconds
| Task Version | ROI | HFA (N=30) Mean (StDev) |
TD (N=30) Mean (StDev) |
|---|---|---|---|
| Implicit | Eyes | 3.24 (1.22) | 3.24 (1.09) |
| Mouth | 3.76 (.99) | 3.14 (1.3) | |
| Side | 2.92 (.64) | 2.76 (.54) | |
| Non-face | 3.26 (1.01) | 3.33 (1.24) | |
| Upper Face | 2.87 (1.1) | 2.95 (1.25) | |
| Lower Face | 2.62 (1.02) | 1.99 (.82) | |
|
| |||
| Explicit | Eyes | 3.41 (.99) | 3.29 (.90) |
| Mouth | 3.19 (1.16) | 3.02 (1.49) | |
| Side | 2.84 (.51) | 2.83 (.58) | |
| Non-face | 3.02 (.65) | 3.81 (1.43) | |
| Upper Face | 3.11 (1.24) | 2.71 (.79) | |
| Lower Face | 2.41 (.87) | 1.97 (.92) | |
To investigate whether participants could perform the task we conducted within-group paired t-tests, which revealed that both groups gazed at the in-synch video significantly longer than the out-of-synch video in the implicit condition (HFA: t (1, 29) =5.33, p < .0001, TD: t (1, 29) =4.48, p < .0001) and the explicit condition (HFA: t (1, 29) =5.31, p < .0001, TD: t (1, 29) =7.7, p < .0001). Based on these results we restricted further analyses of gaze patterns to only the in-synch videos of both conditions. Given the relatively large age range of participants, we explored correlations of our measures with age and found no significant correlations with looking patterns to any of the in-synch video ROIs.
Our subsequent analyses focused on looking time (expressed as percent of looking to a given ROI relative to total looking time to the screen), number of fixations to an ROI, and time to the first fixation to the ROI.
Gaze Patterns to the video ROI
We conducted 2 (group) by 2 (condition: implicit, explicit) repeated measures ANOVA for percent looking time to the correct video. We found main effects for group (F (1,58) = 16.59, p < .0001, partial η2 = .22) and condition (F (1,58) = 16.13, p < .0001, partial η2 = .22). Both participant groups gazed at the correct side significantly longer in the explicit than the implicit condition (p < .0001), indicating they both modulated gaze behavior based on task instructions (Figure 2). However, the TD group spent a greater percentage of their looking time gazing at the correct side than their HFA peers, regardless of condition. There was also a significant group by condition interaction (F (1,58) = 4.1, p = .05, partial η2 = .065), showing that the increase in gaze to the in synch video during the explicit condition was greater in the TD group than the HFA group. Follow-up within-group t-tests (FDR corrected) showed that the TD group gazed at the in-synch video significantly longer in the explicit than implicit condition (t (1, 29) = 3.8, q = .008), but the HFA group did not (t (1, 29) = 1.65, q < .37). There were no significant between or within group differences for number of fixations or time to first fixation to this ROI.
Figure 2.

Percent Looking Time to In-Synch Video
Gaze Patterns to smaller ROIs
We conducted a 2 (group) by 2 (condition: implicit, explicit) by 3 (ROI: eyes, mouth, non-face) repeated measures ANOVA of percent looking time showing main effects for group (F (1,58) = 10.1, p = .002, partial η2 = .15), condition (F (1,58) = 4.62, p = .036, partial η2 = .08), and ROI (F (2,116) = 3.38, p = .037, partial η2 = .06). We also identified a significant interaction between ROI and group (F (2,116) = 7.49, p = .001, partial η2 = .11). A 2 (group) by 2 (condition: implicit, explicit) by 3 (ROI: eyes, mouth, non-face) repeated measures ANOVA of time to first fixation revealed no main effects for group, condition, or ROI, but a significant interaction between ROI and group (F (2,116) = 3.52, p = .033, partial η2 = .06). A 2 (group) by 2 (condition: implicit, explicit) by 3 (ROI: eyes, mouth, non-face) Repeated Measures ANOVA of number of fixations showed no main effects for group or condition, but a significant effect for ROI (F (2,116) = 13.35, p < .0001, partial η2 = .19) and a significant ROI by group interaction (F (2,116) = 7.44, p = .001, partial η2 = .11).
We then conducted more in-depth analyses using a series of 2 (group) by 2 (condition: implicit, explicit) repeated measures ANOVAs of percent looking time, number of fixations, and time to first fixation within and between groups for gaze patterns to the three within-video ROIs (eyes, mouth, nonface).
Gaze patterns to the eye ROI
There were no significant differences between or within groups in percent looking time, number of fixations, or time to first fixation to the eyes.
Gaze patterns to the mouth ROI
There were main effects for group with the TD group looking longer to the mouth ROI (F (1,58) = 14.46, p < .0001, partial η2 = .2, Figure 3) and making more fixations to the mouth than the HFA group (F (1,58) = 5.56, p = .02, partial η2 = .09). There was also a main effect for condition (F (1,58) = 4.03, p = .05, partial η2 = .07) with both groups making their first fixation to the mouth faster in the explicit vs. implicit condition. No other comparisons or interactions were significant for this ROI.
Figure 3.

Time to First Fixation to In-Synch Mouth, in Seconds
Gaze Patterns to the Non-Face ROI
A repeated measures ANOVA for percent looking time revealed a main effect for condition (F (1,58) = 4.81, p = .03, partial η2 = .08), with both groups looking longer at the non-face during the explicit than implicit condition. Since this was the largest within-video ROI, this effect may simply have been a corollary of increased looking time to in-synch video during the explicit task. Separate repeated measures ANOVAs for percent looking time, number of fixations, and time to first fixation revealed main effects for group, with the HFA group looking longer at the non-face than the TD group (F (1,58) = 9.06, p = .004, partial η2 = .14), making more fixations in this ROI (F (1,58) = 12.06, p = .01, partial η2 = .17), and being faster to fixate on the non-face than the TD group (F (1,58) = 4.62, p = .004, partial η2 = .07), regardless of condition. The analyses revealed no significant group by condition interactions for this ROI.
We repeated the same set of between-within group analyses for all ROIs in both task conditions comparing the two HFA groups (autism vs. ASD, as differentiated by ADOS algorithm cut-off scores) with 15 participants per group to determine whether performance differed between these two subgroups. We found no significant differences for any measure or condition and no significant correlations of gaze pattern data with ADOS algorithm scores. This indicates that – as far as this task is concerned –participants with HFA showed a fairly homogeneous gaze pattern profile, regardless of sub-group or characteristics of social communication deficits.
Discussion
This study examined the gaze patterns of children with and without HFA during processing of bimodal (auditory and visual) asynchronous speech. We investigated the effect of task instructions through comparison of implicit vs. explicit conditions. Explicit instructions were designed to contain an equal number of visual (“look”) and auditory (“talking”) words, to avoid biasing attention to either sensory modality. Lastly, we eliminated potential response bias by focusing exclusively on eye tracking data.
Results show both groups looking significantly more to the in-synch than the out-of-synch video, in both conditions, indicating that in-synch speech draws the eye of both participant groups more than the novelty, or strangeness of out-of-synch speech, even in the absence of task instructions. However, confirming our first hypothesis, participants with HFA do not gaze at the in-synch speaker as much as their TD peers in the implicit task. When comparing gaze patterns across task conditions, individuals with HFA do not increase their gaze to the in-synch-video as much as the TD cohort after explicit instructions to look at the in-synch speaker. These data support our second hypothesis that the gaze behavior of participants with HFA would be less responsive than TD peers to explicit task instructions. Although there is a main effect showing both groups gazing longer at the in-synch speaker in the explicit vs. implicit condition, Figure 2 shows that this increased gaze time is larger for TD participants than participants with HFA. Participants with HFA do gaze at the crucially important mouth region significantly faster in the explicit vs. the implicit task, indicating that they can and do change gaze behavior in response to explicit task instructions but may be less able to sustain this behavioral change.
Our third hypothesis was that children with HFA would show gaze patterns to the mouth that are similar to those of their TD peers in both task conditions. Contrary to our hypothesis, we detected significantly decreased gaze (looking time and number of fixations) to the mouth for HFA compared to TD participants, regardless of condition. These data are particularly startling given the existing literature on increased mouth-directed gaze in ASD vs. TD individuals (Jones W, 2008; Joseph & Tanaka, 2003; Klin et al., 2002; Langdell, 1978; Neumann et al., 2006; Paul et al., 2013; Pelphrey et al., 2002; Spezio et al., 2007). In contrast to prior studies, our task focused on visual speech, not emotion or identity recognition, which may prompt different gaze behavior in both participant cohorts. Nevertheless, participants with HFA neither implicitly nor explicitly modified gaze behavior in a way that would demonstrate understanding that the mouth was the primary source of visual information for AV speech integration.
TD individuals in our study did not gaze at the mouth faster, but did sustain longer visual attention to that region during the explicit condition. These data are well supported by existing literature. Lansing and McConkie (2003) found that TD adults gazed at the eyes of non-speaking faces, but fixated longer on the mouth of speaking faces, particularly in more difficult comprehension contexts, such as low volume speech. The authors proposed that TD adults gazed at the eyes of resting faces to determine emotional or social information, but diverted their gaze to the mouth when asked to comprehend AV speech with degraded audio signal. Other data suggest that TD individuals obtain sufficient information for AV speech comprehension by fixating on the eyes and noting dynamic information from the lips through non-foveal vision (Vatikiotis-Bateson, Eigsti, & Yano, 1994). These findings appear to be contradictory, until we take the difficulty of the task into account. Peripheral or non-foveal perception of the mouth may be sufficient in simpler speech recognition tasks (Massaro, 1998; Vatikiotis-Bateson et al., 1998), but increased difficulty of the speech recognition task drives TD observers to increase foveal fixations to the mouth region of the face, while at the same time reducing fixation to other regions of the face (Lansing & McConkie, 2003). Although the audio-quality of the stimuli used here was not degraded, the AV slip rate was difficult enough to reach above-chance, but still low (>63%), accuracy levels. We therefore propose that this high level of difficulty redirected gaze patterns of TD participants from the eyes to the mouth in an attempt to improve AV asynchrony detection, particularly in the explicit condition.
Participants with HFA did not follow this adaptive gaze pattern. In contrast, this cohort showed significantly fewer fixations to the mouth region and significantly more and longer fixations to the non-face region, which contains no relevant information for this task. Dynamic information from regions other than the central face or mouth region do not enhance AV speech recognition (Ijsseldijk, 1992; Marassa & Lansing, 1995), thereby making the gaze pattern of participants with HFA a maladaptive strategy for difficult AV speech tasks. One possible explanation for this gaze pattern difference is that individuals with HFA were actively avoiding looking at the mouth - focusing on the nonface area instead - to reduce the demands of multi-sensory integration, which have frequently been reported to be difficult for this population (Iarocci & McDonald, 2006a). However, data also show that individuals with ASD have preserved multisensory integration abilities for low-level non-linguistic stimuli (van der Smagt et al., 2007) and meaningful language contexts (Grossman et al., 2009), despite possible differences in the timing of that integration (Foss-Feig et al., 2010; Kwakye, Foss-Feig, Cascio, Stone, & Wallace, 2011). These data collectively do not point to a clear deficit in multisensory integration for meaningful linguistic stimuli. In addition, participants with HFA in this study did modulate their gaze pattern in response to explicit instructions by gazing at the mouth faster than in the implicit task, thereby demonstrating a willingness to engage with task demands for multisensory integration. Although this cohort demonstrated the ability to shift gaze quickly to the mouth region in the explicit condition, they did not sustain foveal gaze to this crucially important region, thereby signifciantly reducing their chance of successully integrating AV speech information and supporting comprehension.
Our fourth hypothesis stated that participants with HFA would show the same eye-directed gaze patterns as their TD peers, which was confirmed by a lack of group differences in looking time, number of fixations, and time to first fixation toward the eyes. These data support existing findings that there are no significant deficits for eye-directed gaze in this population (Bar-Haim et al., 2006; Grossman, Smith, Steinhart, & Mitchell, 2012; Nishimura et al., 2008; Rutherford & McIntosh, 2007; Rutherford & Towns, 2008), but stand in contrast to findings of deficits in this area (e.g. Klin et al., 2002; Neumann et al., 2006; Paul et al., 2013; Pelphrey et al., 2002). The results presented here are the first data on gaze patterns of children with HFA in a non-emotional visual speech task and it is possible that the elimination of emotional content and focus on speech processing enabled individuals with HFA to gaze at the eyes more freely than when they contain potentially over-stimulating emotional information (Klin et al., 2002; Neumann et al., 2006; Pelphrey et al., 2002). These data also resonate with the findings of Lansing and McConkie (2003) that TD observers gazed at eyes more before and after speech, but redirected their gaze from the eyes to the mouth region during a visual speech task. Both participant cohorts may have recognized the relatively reduced contribution of the eye region in a difficult AV speech integration task and reduced their fixation time to this ROI. Alternatively, task demands appropriately and robustly drove TD fixations away from the eyes and toward the mouth, while the HFA cohort did not alter their gaze patterns effectively, thereby masking a potential group difference in eye-directed gaze. Future studies should follow up on this interaction between AV speech task difficulty and eye gaze, as well as investigate whether individuals with ASD have the flexibility to adapt gaze behavior based on other task demands. It would be interesting to investigate gaze patterns for in-synch speakers, to determine potential differences in mouth-directed and eye-directed gaze behavior between TD and HFA individuals for visual speech in a simpler task.
Conclusion
Participants with HFA fixate significantly less on the mouth for AV asynchronous speech than TD peers, which stands in contrast to prior findings of increased mouth gaze for neutral or emotional faces. By fixating less on the crucially important mouth region and more on the irrelevant non-face area, individuals with HFA don’t maximize their ability to integrate visual speech cues. These findings suggest that the visual fixation patterns of individuals with HFA to speaking faces are less adapted to task demands and not sufficiently focused on integrating AV dynamic speech cues. A potential intervention target for face-gaze in this population could therefore be flexible deployment of gaze toward sources of greatest information, directing children with HFA to increase gaze toward eyes when processing emotional facial expressions, but toward the mouth to enhance AV speech comprehension.
Acknowledgments
Grant sponsor: NIH-NIDCD; Grant number R21 DC010867-01
Grant sponsor: NIH IDDRC; Grant number P30 HDP30HD004147
Funding was provided by NIDCD Grant R21 DC010867-01 (R. Grossman, P.I.) and by NIH Intellectual and Developmental Disabilities Research Center P30 Grant HDP30HD004147. We thank Christopher Bianrosa, Kerri Green, Gregory Hurst, Emily Levoy, Matthew Schneps, and Kelly Wessel for their assistance in stimulus creation. We also thank the children and families who gave their time to participate in this study.
Footnotes
We have no conflict of interest to declare.
Works Cited
- Bar-Haim Y, Shulman C, Lamy D, Reuveni A. Attention to eyes and mouth in high-functioning children with autism. Journal of Autism and Developmental Disorders. 2006;36(1):131–137. doi: 10.1007/s10803-005-0046-1. [DOI] [PubMed] [Google Scholar]
- Buchan JN, Pare M, Munhall KG. Spatial statistics of gaze fixations during dynamic face processing. Soc Neurosci. 2007;2(1):1–13. doi: 10.1080/17470910601043644. [DOI] [PubMed] [Google Scholar]
- de Gelder B, Vroomen J, van der Heide L. Face recognition and lip-reading in autism. European Journal of Cognitive Psychology. 1991;3(1):69–86. [Google Scholar]
- Dunn LM, Dunn LM. Peabody Picture Vocabulary Test. 3. Circle Pines, MN: American Guidance Service; 1997. [Google Scholar]
- Foss-Feig J, Kwakye L, Cascio C, Burnette C, Kadivar H, Stone W, Wallace M. An extended multisensory temporal binding window in autism spectrum disorders. Experimental Brain Research. 2010;203(2):381–389. doi: 10.1007/s00221-010-2240-4. [DOI] [PMC free article] [PubMed] [Google Scholar]
- Grossman RB, Schneps MH, Tager-Flusberg H. Slipped lips: onset asynchrony detection of auditory-visual language in autism. Journal of Child Psychology and Psychiatry. 2009;50(4):491–497. doi: 10.1111/j.1469-7610.2008.02002.x. JCPP2002 [pii] [DOI] [PMC free article] [PubMed] [Google Scholar]
- Grossman RB, Smith A, Steinhart E, Mitchell T. Visual scanning of facial expression with high and low intensity. Poster presented at Gatlinburg Conference; Annapolis, MD. 2012. [Google Scholar]
- Hall GB, Szechtman H, Nahmias C. Enhanced salience and emotion recognition in Autism: a PET study. Am J Psychiatry. 2003;160(8):1439–1441. doi: 10.1176/appi.ajp.160.8.1439. [DOI] [PubMed] [Google Scholar]
- Hampson E, van Anders SM, Mullin LI. A female advantage in the recognition of emotional facial expressions: test of an evolutionary hypothesis. Evolution and Human Behavior. 2006;27(6):401–416. http://dx.doi.org/10.1016/j.evolhumbehav.2006.05.002. [Google Scholar]
- Iarocci &, McDonald Sensory integration and the perceptual experience of persons with autism. Journal of Autism & Developmental Disorders. 2006a;36(1):77–90. doi: 10.1007/s10803-005-0044-3. [DOI] [PubMed] [Google Scholar]
- Iarocci G, McDonald J. Sensory Integration and the Perceptual Experience of Persons with Autism. [Article] Journal of Autism & Developmental Disorders. 2006b;36(1):77–90. doi: 10.1007/s10803-005-0044-3. [DOI] [PubMed] [Google Scholar]
- Iarocci G, Rombough A, Yager J, Weeks DJ, Chua R. Visual influences on speech perception in children with autism. Autism. 2010;14(4):305–320. doi: 10.1177/1362361309353615. [DOI] [PubMed] [Google Scholar]
- Ijsseldijk F. Speechreading performance under different conditions of video image, repetition, and speech rate. Journal of Speech Language & Hearing Research. 1992;35(2):466–471. doi: 10.1044/jshr.3502.466. [DOI] [PubMed] [Google Scholar]
- Irwin J. Audiovisual speech integration in children with autism spectrum disorders. Journal of the Accoustic Society of America. 2006;120(5 Pt 2):3348. [Google Scholar]
- Jones WCKKA. Absence of preferential looking to the eyes of approaching adults predicts level of social disability in 2-year-old toddlers with autism spectrum disorder. Archives of General Psychiatry. 2008;65(8):946–954. doi: 10.1001/archpsyc.65.8.946. [DOI] [PubMed] [Google Scholar]
- Joseph RM, Tanaka J. Holistic and part-based face recognition in children with autism. Journal of Child Psychology and Psychiatry. 2003;44(4):529–542. doi: 10.1111/1469-7610.00142. [DOI] [PubMed] [Google Scholar]
- Klin A, Jones W, Schultz R, Volkmar F, Cohen D. Visual Fixation Patterns During Viewing of Naturalistic Social Situations as Predictors of Social Competence in Individuals With Autism. Archives in General Psychiatry. 2002;59(9):809–816. doi: 10.1001/archpsyc.59.9.809. [DOI] [PubMed] [Google Scholar]
- Kozlowski L, Cutting J. Recognizing the sex of a walker from a dynamic point-light display. Perception & Psychophysics. 1977;21(6):575–580. doi: 10.3758/bf03198740. [DOI] [Google Scholar]
- Kwakye LD, Foss-Feig JH, Cascio CJ, Stone WL, Wallace MT. Altered auditory and multisensory temporal processing in autism spectrum disorders. Front Integr Neurosci. 2011;4:129. doi: 10.3389/fnint.2010.00129. [DOI] [PMC free article] [PubMed] [Google Scholar]
- Langdell T. RECOGNITION OF FACES: AN APPROACH TO THE STUDY OF AUTISM. Journal of Child Psychology and Psychiatry. 1978;19(3):255–268. doi: 10.1111/j.1469-7610.1978.tb00468.x. [DOI] [PubMed] [Google Scholar]
- Lansing CR, McConkie GW. Word identification and eye fixation locations in visual and visual-plus-auditory presentations of spoken sentences. [Research Support, U.S. Gov’t, P.H.S.] Perception & psychophysics. 2003;65(4):536–552. doi: 10.3758/bf03194581. [DOI] [PubMed] [Google Scholar]
- Lord C, Rutter M, DiLavore PC, Risi S. Autism Diagnostic Observation Schedule - WPS (ADOS-WPS) Los Angeles, CA: Western Psychological Services; 1999. [Google Scholar]
- Magnée MJCM, de Gelder B, van Engeland H, Kemner C. Audiovisual speech integration in pervasive developmental disorder: evidence from event-related potentials. Journal of Child Psychology and Psychiatry. 2008;49(9):995–1000. doi: 10.1111/j.1469-7610.2008.01902.x. [DOI] [PubMed] [Google Scholar]
- Marassa LK, Lansing CR. Visual word recognition in two facial motion conditions: full-face versus lips-plus-mandible. Journal of Speech Language & Hearing Research. 1995;38(6):1387–1394. doi: 10.1044/jshr.3806.1387. [DOI] [PubMed] [Google Scholar]
- Massaro DW. Perceiving talking faces: From speech perception to a behavioral principle. Cambridge, MA: MIT Press, Bradford Books; 1998. [Google Scholar]
- McGurk H, MacDonald J. Hearing lips and seeing voices. Nature. 1976;264(5588):746–748. doi: 10.1038/264746a0. [DOI] [PubMed] [Google Scholar]
- Medeiros K, Winsler A. Parent–Child Gesture Use During Problem Solving in Autistic Spectrum Disorder. Journal of Autism and Developmental Disorders. 2014;44(8):1946–1958. doi: 10.1007/s10803-014-2069-y. [DOI] [PubMed] [Google Scholar]
- Neumann D, Spezio ML, Piven J, Adolphs R. Looking you in the mouth: abnormal gaze in autism resulting from impaired top-down modulation of visual attention. Social Cognitive and Affective Neuroscience. 2006;1(3):194–202. doi: 10.1093/scan/nsl030. [DOI] [PMC free article] [PubMed] [Google Scholar]
- Nishimura M, Rutherford MD, Maurer D. Converging evidence of configural processing of faces in high-functioning adults with autism spectrum disorders. [doi: 10.1080/13506280701538514] Visual Cognition. 2008;16(7):859–891. doi: 10.1080/13506280701538514. [DOI] [Google Scholar]
- Nishiyama T, Kanne S. On the Misapplication of the BAPQ in a Study of Autism. Journal of Autism and Developmental Disorders. 2014;44(8):2079–2080. doi: 10.1007/s10803-014-2077-y. [DOI] [PubMed] [Google Scholar]
- Nuske H, Vivanti G, Dissanayake C. Brief Report: Evidence for Normative Resting-State Physiology in Autism. Journal of Autism and Developmental Disorders. 2014;44(8):2057–2063. doi: 10.1007/s10803-014-2068-z. [DOI] [PubMed] [Google Scholar]
- Paré M, Richler R, Hove M, Munhall KG. Gaze behavior in audiovisual speech perception: The influence of ocular fixations on the McGurk effect. Perception & psychophysics. 2003;65(4):553–567. doi: 10.3758/bf03194582. [DOI] [PubMed] [Google Scholar]
- Paul R, Campbell D, Gilbert K, Tsiouri I. Comparing spoken language treatments for minimally verbal preschoolers with autism spectrum disorders. Journal of Autism & Developmental Disorders. 2013;43(2):418–431. doi: 10.1007/s10803-012-1583-z. [DOI] [PubMed] [Google Scholar]
- Pelphrey KA, Sasson NJ, Reznick JS, Paul G, Goldman BD, Piven J. Visual scanning of faces in autism. Journal of Autism & Developmental Disorders. 2002;32(4):249–261. doi: 10.1023/a:1016374617369. [DOI] [PubMed] [Google Scholar]
- Piven J, Sasson N. On the Misapplication of the Broad Autism Phenotype Questionnaire in a Study of Autism. Journal of Autism and Developmental Disorders. 2014;44(8):2077–2078. doi: 10.1007/s10803-014-2076-z. [DOI] [PubMed] [Google Scholar]
- Roid GH, Miller LJ. Leiter International Performance Scale - Revised. Wood Dale, IL: Stoelting Co; 1997. [Google Scholar]
- Rutherford M, McIntosh D. Rules versus Prototype Matching: Strategies of Perception of Emotional Facial Expressions in the Autism Spectrum. Journal of Autism and Developmental Disorders. 2007;37(2):187–196. doi: 10.1007/s10803-006-0151-9. [DOI] [PubMed] [Google Scholar]
- Rutherford M, Towns A. Scan Path Differences and Similarities During Emotion Perception in those With and Without Autism Spectrum Disorders. Journal of Autism and Developmental Disorders. 2008;38(7):1371–1381. doi: 10.1007/s10803-007-0525-7. [DOI] [PubMed] [Google Scholar]
- Shams L, Kamitani Y, Shimojo S. Modulation of visual perception by sound. In: Calvert, Spence, Stein, editors. The handbook of multisensory processes. Cambridge, MA: MIT Press; 2004. pp. 26–33. [Google Scholar]
- Smith EG, Bennetto L. Audiovisual speech integration and lipreading in autism. Journal of Child Psychology and Psychiatry. 2007;48(8):813–821. doi: 10.1111/j.1469-7610.2007.01766.x. [DOI] [PubMed] [Google Scholar]
- Spezio ML, Adolphs R, Hurley RS, Piven J. Abnormal use of facial information in high-functioning autism. Journal of Autism & Developmental Disorders. 2007;37(5):929–939. doi: 10.1007/s10803-006-0232-9. [DOI] [PubMed] [Google Scholar]
- Sumby WH, Pollack I. Visual contribution to speech intelligibility in noise. Journal of the Acoustical Society of America. 1954;26:212–215. [Google Scholar]
- Summerfield Q, McGrath M. Detection and resolution of audio-visual incompatibility in the perception of vowels. The Quarterly Journal of Experimental Psychology Section A. 1984;36(1):51–74. doi: 10.1080/14640748408401503. [DOI] [PubMed] [Google Scholar]
- Ulloa ER, Pineda JA. Recognition of point-light biological motion: Mu rhythms and mirror neuron activity. Behavioural Brain Research. 2007;183(2):188–194. doi: 10.1016/j.bbr.2007.06.007. http://dx.doi.org/10.1016/j.bbr.2007.06.007. [DOI] [PubMed] [Google Scholar]
- van der Smagt MJ, van Engeland H, Kemner C. Brief report: can you see what is not there? low-level auditory-visual integration in autism spectrum disorder. Journal of Autism & Developmental Disorders. 2007;37(10):2014–2019. doi: 10.1007/s10803-006-0346-0. [DOI] [PubMed] [Google Scholar]
- Vatikiotis-Bateson E, Eigsti IM, Yano S. Listener eye movement behavior during audiovisual perception. Proceedings of the acoustical society of Japan. 1994;94(3):679–680. [Google Scholar]
- Vatikiotis-Bateson E, Eigsti IM, Yano S, Munhall KG. Eye movement of perceivers during audiovisual speech perception. [Comparative Study] Perception & psychophysics. 1998;60(6):926–940. doi: 10.3758/bf03211929. [DOI] [PubMed] [Google Scholar]
- Zainal H, Magiati I, Tan JL, Sung M, Fung DS, Howlin P. A Preliminary Investigation of the Spence Children’s Anxiety Parent Scale as a Screening Tool for Anxiety in Young People with Autism Spectrum Disorders. Journal of Autism and Developmental Disorders. 2014;44(8):1982–1994. doi: 10.1007/s10803-014-2075-0. [DOI] [PubMed] [Google Scholar]