

Abstract
Purpose:
To develop a new computer-aided diagnosis (CAD) scheme using a content-based image retrieval (CBIR) approach for classification between the malignant and benign breast lesions depicted on the digital mammograms and assess CAD performance and reproducibility.
Methods:
An image dataset including 820 regions of interest (ROIs) was used. Among them, 431 ROIs depict malignant lesions and 389 depict benign lesions. After applying an image preprocessing process to define the lesion center, two image features were computed from each ROI. The first feature is an average pixel value of a mapped region generated using a watershed algorithm. The second feature is an average pixel value difference between a ROI’s center region and the rest of the image. A two-step CBIR approach uses these two features sequentially to search for ten most similar reference ROIs for each queried ROI. A similarity based classification score was then computed to predict the likelihood of the queried ROI depicting a malignant lesion. To assess the reproducibility of the CAD scheme, we selected another independent testing dataset of 100 ROIs. For each ROI in the testing dataset, we added four randomly queried lesion center pixels and examined the variation of the classification scores.
Results:
The area under the ROC curve (AUC) = 0.962 ± 0.006 was obtained when applying a leave-one-out validation method to 820 ROIs. Using the independent testing dataset, the initial AUC value was 0.832 ± 0.040, and using the median classification score of each ROI with five queried seeds, AUC value increased to 0.878 ± 0.035.
Conclusions:
The authors demonstrated that (1) a simple and efficient CBIR scheme using two lesion density distribution related features achieved high performance in classifying breast lesions without actual lesion segmentation and (2) similar to the conventional CAD schemes using global optimization approaches, improving reproducibility is also one of the challenges in developing CAD schemes using a CBIR based regional optimization approach.
Keywords: content-based image retrieval (CBIR), interactive computer-aided diagnosis (ICAD), classification of breast lesions, reproducibility of CAD schemes
1. INTRODUCTION
In current population-based breast cancer screening paradigm, mammography is the only clinically accepted imaging screening modality.1 Scientific evidence has shown that earlier cancer detection combined with the advancement of treatment methods has substantially reduced mortality rates of breast cancer patients over the last four decades.2 In the screening environment, once a suspicious breast lesion is detected on mammograms, the radiologist assesses a likelihood score of the lesion being malignant using an established breast imaging reporting and data system (BIRADS) by assigning the lesion into one of the five BIRADS categories (1–5).3 The higher category numbers indicate a higher likelihood of the detected lesion being malignant. Hence, the lesions assigned to BIRADS categories 4 and 5 are usually recommended for biopsy examinations. However, due to the large variability of breast abnormalities and possible overlapping of dense fibro-glandular tissue, classifying between malignant and benign breast lesions depicted on mammograms is quite difficult4 and often inconsistent among the radiologists due to a large inter-reader variability.5,6 As a result, performance of current screening mammography is not satisfactory.7 It generates high false-positive recall and/or biopsy rates8 that add anxiety with potentially long-term psychosocial consequences and harms many women with eventually proved benign or negative examinations.9 Therefore, the efficacy of screening mammography remains quite controversial to date.10
To improve the efficacy of screening mammography, many approaches have been proposed and investigated. Among them, one of the key issues is to help radiologists achieve higher performance in classification between malignant and benign breast lesions, which helps reduce unnecessary (false-positive) biopsies and the associated overdiagnosis. For this purpose, developing computer-aided detection and/or diagnosis (CAD) schemes of mammograms have been intensively investigated as “a second reader” to aid radiologists in reading and interpreting screening mammograms. Although the commercialized CAD schemes have been installed in many digital mammography systems and are routinely used in clinical practice, they are unable to help improve radiologists’ performance in detecting and classifying masslike lesions.11,12 Hence, exploring and developing new and more effective CAD approaches and cueing methods are still needed to help improve the efficacy of screening mammography.13
Instead of automatic detection of suspiciously malignant breast lesions, research effort has also been made to focus on predicting the likelihood of the lesions detected by radiologists on the mammograms being malignant. The content-based image retrieval (CBIR) method14 has been approved as a popular and effective approach used in developing the diagnosis or classification based CAD schemes of mammograms.15–22 These schemes apply an adaptive approach to generate each detection or classification result based on the selection of different hypotheses or local approximations as the target function for each testing query (a suspicious region depicted on an image). Specifically, a CBIR approach is applied to select a set of “most similar” ROIs from a pre-established reference image database based on a set of image features. Then, a classification score is computed by the weighted ratios between the most similar malignant (or true-positive) and benign (or false-positive) images or regions of interests (ROIs).
Despite the promising results reported in the previous studies of developing and testing CAD schemes using the CBIR approach, these types of CAD schemes still face a number of challenges that have not been well investigated. For example, (1) most of the CBIR schemes search for similar reference lesions based on a set of image features computed from the automatically segmented breast lesions. Due to the difficulty in accurate and robust segmentation of the subtle breast lesion boundary contour from the digital mammograms,23 many lesion morphological features may not accurately represent the characteristics of the targeted lesions, which reduces the lesion classification accuracy and/or reliability. (2) Unlike human eyes, quantitative image features computed from the breast lesions are often quite sensitive to changes of a variety of computational conditions. Thus, similar to the conventional CAD schemes that have lower reproducibility,24,25 the reproducibility of CAD schemes using CBIR approach also needs to be investigated and compensated when the approach can be applied to future clinical applications. The purpose of this study focuses on investigating the above two issues to develop an optimal, highly computationally efficient and more robust CAD scheme using the CBIR approach. First, we developed and tested a new CBIR scheme that sequentially uses two lesion density distribution pattern based image features (contents) as the image retrieval comparison indices without performing lesion segmentation. Second, we assessed the reproducibility of this CBIR approach when it is used in an interactive computer-aided diagnosis (ICAD) environment26 and also proposed a new approach to improve the reproducibility of the scheme classification performance. The detailed study procedure and experimental results are reported in Secs. 2–4.
2. MATERIALS AND METHODS
2.A. Two image datasets
From an existing fully anonymized full-field digital mammography (FFDM) image database used in our previous studies,27,28 we assembled a reference dataset for developing and testing a new CBIR scheme in this study. The dataset includes 820 ROIs that were extracted from the original images of 820 independent FFDM examination cases. The size of each ROI is fixed at 512 × 512 pixels (or 38.4 × 38.4 mm). The image has a 12-bit gray level resolution (from 0 to 4095 pixel values). Each ROI depicts one mass-type lesion that has been biopsied in the original screening examination. Based on the pathology examination reports of the biopsied specimens, 431 ROIs depict verified malignant mass regions and 389 depict benign mass regions. Although the lesion sizes vary in different cases, the lesion centers are always located at the center of the extracted ROIs. In addition, we also selected another independent testing dataset of 100 ROIs that include 50 malignant lesions and 50 benign lesions. These 100 ROIs were not included in the reference dataset of 820 ROIs. This dataset was used to test reproducibility of scheme performance. Figures 1 and 2 display 50 malignant ROIs and 50 benign ROIs of the testing dataset, respectively, which show the different characteristics among these 100 testing ROIs (i.e., mass size, density, contrast, shape, boundary margin, and the surrounding overlapping tissue patterns).
FIG. 1.
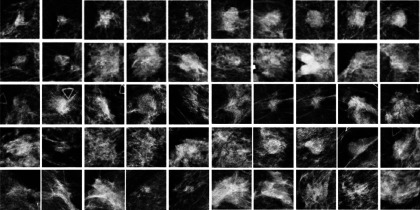
Illustration of 50 malignant ROIs extracted in our independent testing dataset.
FIG. 2.
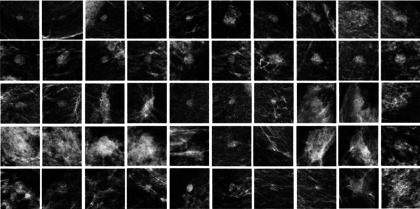
Illustration of 50 benign ROIs extracted in our independent testing dataset.
2.B. A CBIR based CAD scheme
When using a CBIR based CAD scheme in an interactive environment,26 a suspicious lesion depicted on the mammogram is typically queried by an observer (e.g., a radiologist) who determines and marks a seed (pixel) as the lesion center. Starting from this marked seed, the scheme extracts a ROI surrounding the queried lesion, computes image features, retrieves the similar reference ROIs, and then generates a final classification score. Since defining a lesion center is a subjective process with large interobserver variability,29 our scheme does not simply accept the queried center point made by the users as the lesion center or growth seed. We applied an image preprocessing step to redefine “the lesion center.” The scheme takes the queried point as a central pixel to open a square frame (i.e., 32 × 32 pixels). For each pixel inside the frame, the scheme computes a normalized average pixel value based on the 8-connected neighborhood as follows:
| (1) |
If the average pixel value computed is greater than a predetermined threshold, , the pixel is selected; otherwise, the pixel is discarded. To select an optimal threshold, we conducted an initial experiment to test and compare a set of different threshold values starting from 0.4 to 0.8 in an increment of 0.1. Based on our initial empirical test results, we selected PDT = 0.7 in this study. Finally, the scheme computed the geometrical center of the remaining pixels (N) inside the initially selected square frame. The coordinate of the selected “lesion center pixel” is thus determined by
| (2) |
Next, based on our experience in observing and discussing with radiologists to understand the important phenotypic image features used in classifying between malignant and benign breast lesions, we hypothesized that lesion density levels and distribution (e.g., heterogeneity) are two important image features with higher discriminatory power in distinguishing between malignant and benign lesions. Specifically, the lesions with higher density level (more stiffness) and greater density fluctuation (heterogeneity) are more likely to be malignant. Thus, using the computer scheme defined “lesion center” as a seed, we explored and computed two image features.
The first image feature aims to detect and measure the density heterogeneity inside the central region of a lesion. For this purpose, we applied a watershed algorithm introduced by Beucher and Lantuéjoul in 1979 (Ref. 30) to process the central region of the lesion. Using the watershed algorithm, a 2D projection gray-level image (such as a mammogram) can also be considered as a 3D topographic relief, whereby the pixel value (gray level) of the image is interpreted as its altitude in the third dimension. Then, a simulated water drop falling from the top of the topographic relief flows along the topographic or geometrical path within the image to finally reach a global minimum valley.
We applied a matlab watershed function, L = watershed(I) (http://www.mathworks.com/help/images/ref/watershed.html), to process a N1 × N1 matrix extracted from the predefined lesion center and generate a new mapped matrix. Figure 3 shows an example of applying the watershed process to a 8 × 8 matrix. From the watershed algorithm generated output map, our scheme computed the first feature, which is the average pixel value of the watershed map,
| (3) |
FIG. 3.
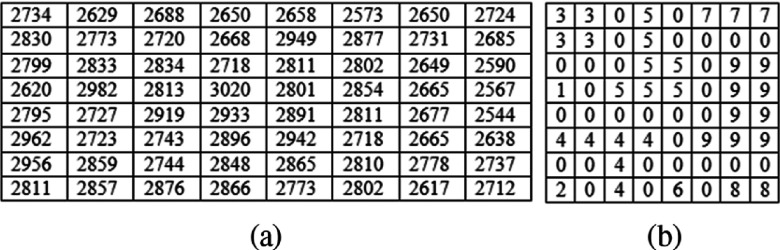
An example of a matrix extracted from “a lesion center” (a) and the corresponding output of applying watershed function processing (b).
For example, using the watershed algorithm generated result map as shown in Fig. 3(b), we computed F1 = 3.098. A larger feature value of F1 indicates a greater density heterogeneity around the lesion central region.
The second feature was computed as the average image pixel value difference between the central region of a lesion and its surrounding background. Specifically, we divided the entire ROI into two sections. One is the central region of the lesion (e.g., N2 × N2 pixels) and the other is the rest of the ROI (excluding the extracted central region). By computing the average pixel values of these two sections, Iave−C and Iave−S, respectively, the second image feature was computed as the absolute difference between the two average pixel values,
| (4) |
The basis or premise of computing this feature is based on our observation that in reading and interpreting mammograms, the density difference between a lesion and its background is an important feature widely used by radiologists for classification between malignant and benign masses. Furthermore, in our recent experiment,31 the density of the mass compared to its surrounding background was also selected as an important feature for a CAD scheme to classify between malignant and benign ROIs.
The CAD scheme was applied to process each of 820 ROIs in the reference image dataset and compute two image features. The computed features were then combined to generate a reference image feature dataset associated with the original image (ROI) dataset. Using these two features, we developed and tested a new CBIR scheme. Since equally weighting each feature is not an optimal approach,32 we applied and tested a two-step (hierarchical) similarity comparison method to search for and retrieve similar reference ROIs to the queried ROI. Since it is important to optimally identify the order of the features to develop a CBIR scheme with hierarchical arrangement,22 we tested the options of using either feature one (F1) or feature two (F2) in the first step of the scheme. Based on the testing result, we identified that F1 was a more effective prefilter to be used in the first step to early discard the irrelevant reference ROIs and then F2 can more focus on the similarity searching in the second step. Therefore, our CBIR scheme first computed the Euclidean distance between the queried ROI and each of the reference ROIs in the dataset using F1, and sorted the reference ROIs from the minimum to the maximum distance values. From the sorting results, the K most similar ROIs with the smallest distances to the queried ROI were selected. Second, the scheme weighted each selected ROI based on its difference to the queried ROI using F2. The weighting factor is computed as
| (5) |
Finally, based on the number of malignant ROIs (M) and benign ROIs (B) in the K most similar reference ROIs and the corresponding weighting factors, the scheme computed a likelihood score of the queried ROI depicting a malignant lesion,
| (6) |
2.C. Performance assessment
To test the performance of this new CBIR scheme in classifying between the malignant and benign lesions, we first applied a leave-one-ROI-out validation method in which one ROI was selected as a queried ROI and the remaining 819 ROIs in the database were used as reference ROIs. The CBIR scheme searched for the K most similar ROIs to the queried one, and computed a classification score (Sq). This process was repeated 820 times so that each ROI was used as a queried (testing) ROI once in the whole process. As a result, 820 classification scores were generated by the CBIR scheme. A ROC curve fitting program (rockit, http://xray.bsd.uchicago.edu/krl/roc_soft.htm) was then applied to process these 820 classification scores in the malignant and benign case groups. The area under the ROC curve (AUC) was used to assess classification performance.
Based on our previous experience in developing CBIR-based interactive CAD schemes33 as well as initial experiments performed in this study, we initially select (1) kernel size of the matrix (N1 = 8) to compute feature 1 (F1), (2) kernel size of the central region (N2 = 16) to computer feature 2 (F2), and (3) the number of retrieved reference ROIs (K = 10) used in computing similarity score of Eq. (6). To evaluate the acceptability of selecting the combination of these three parameters, we also performed three systematic experiments to test the selection of these parameters on the final classification performance using the entire reference database of 820 ROIs and a leave-one-ROI-out validation method. In each experiment, we applied an exhaustive-search method to change one parameter and examine the change of AUC value. For example, by fixing N2 = 16 and K = 10, we systematically increased N1 = 4–100 to compute feature 1 (F1) and the final AUC values. The same evaluation process was also applied to examine the impact of N2 and K value change on the final AUC values.
In addition, since when applying a CAD scheme using the CBIR approach in an interactive CAD system and environment, the lesion center queried by different users (radiologists) varies; we thus tested the reproducibility of the classification performance as a function of the change of the queried lesion center seeds (pixels) using the independent testing dataset (as shown in Figs. 1 and 2). For each ROI, our CAD scheme was applied five times to classify this ROI using five queried “lesion center seeds,” which include one original seed used to extract ROI and four random seeds placed by a computer program within a window of 10 × 10 pixels around the original lesion center seed. We compared and analyzed the variation of the five CAD-generated classification scores for each ROI. To achieve optimal classification results as measured using AUC values of the ROC curves, we also tested and searched for an optimal method to combine the classification scores.
3. RESULTS
Figure 4 shows the change of AUC values versus the change of kernel size of the watershed matrix used to compute feature 1 (F1). The figure shows that the AUC values initially increase from a small kernel size of N1 = 4. The AUC value reaches the maximum value at N1 = 8 and then drops quickly to reach its first local minimum at N1 = 28. Beyond this kernel size, the AUC values start fluctuating in the narrowed range. Hence, selecting N1 = 8 is an “optimal” parameter to compute F1. Experimental results also showed that N2 = 16 and K = 10 were also acceptable parameters to develop this new CBIR-based CAD scheme.
FIG. 4.

A diagram showing the variation of AUC values versus the increase of kernel size of a watershed matrix to compute feature 1 (F1).
Figure 5 shows an image feature scatter diagram of 820 ROIs. It shows that the two computed image features are highly overlapping between the malignant and benign ROIs. It is thus difficult to separate the two classes using a global optimization method (i.e., using artificial neural networks or support vector machines). However, our testing results indicate that using a CBIR scheme and a k-nearest neighborhood (kNN) based local (or regional) optimization method, the CAD classification results are quite different. For example, in a queried ROI (which is the first malignant ROI shown in the first row of Fig. 1), feature values of F1 = 3.0938 and F2 = 1608.3 were computed by CAD scheme. Table I shows the feature distribution of the ten most similar reference ROIs selected by the CBIR scheme for this queried sample ROI. Among these ROIs, six are associated with malignant lesions and four with benign ones. The final computed classification score is Sq = 0.934 indicating a high likelihood of the queried ROI being malignant. Figure 6 compares two histograms of the number of malignant reference ROIs retrieved by using F1 among the 50 malignant and 50 benign testing ROIs, which demonstrate that in general more malignant ROIs were retrieved for the queried malignant ROIs than for the queried benign ROIs.
FIG. 5.

A scatter diagram showing the distribution of two image features computed from 820 ROIs. The red square marks indicate malignant ROIs, and the blue diamond marks represent benign ROIs.
TABLE I.
Distribution of two image features computed from ten most similar reference ROIs (six malignant and four benign) to a queried testing ROI (the first ROI shown in Fig. 1).
| Malignant ROIs | Benign ROIs | ||
|---|---|---|---|
| Feature F1 | Feature F2 | Feature F1 | Feature F2 |
| 3.0938 | 1640.98 | 3.0938 | 1064.925 |
| 3.0938 | 1647.01 | 3.0781 | 1588.598 |
| 3.0781 | 957.005 | 3.0781 | 69.1627 |
| 3.0781 | 1571.13 | 3.1094 | 1470.609 |
| 3.0781 | 2350.72 | ||
| 3.1094 | 1444.18 | ||
FIG. 6.

Histograms of the number of malignant reference ROIs retrieved using feature 1 (F1) among the 50 malignant and 50 benign testing ROIs.
Figure 7 compares three ROC curves. AUC = 0.515 ± 0.020 and 0.603 ± 0.020 when using feature F1 and an equal-weighted (average) method to combine the two features (F1 and F2), respectively. When applying the CAD scheme using a CBIR approach, the classification performance significantly increased to AUC = 0.962 ± 0.006 with a 95% confidence interval of [0.948, 0.972]. Table II demonstrates a confusion matrix of testing all 820 ROIs when applying a threshold of ST = 0.5 on the CAD-generated classification scores. The total classification accuracy was 87.7% (719/820), and the classification sensitivity was 89.6% at a specificity of 85.6%. From Table II, we also computed and found that the scheme yielded a positive predictive value, PPV = 87.3% (386/442), and a negative predictive value, NPV = 88.1% (333/378).
FIG. 7.

Comparison of three ROC curves generated using the rockit program. The computed AUC values are 0.962 ± 0.006, 0.603 ± 0.020, and 0.515 ± 0.020 when using our CBIR based classification scores (a leave-one-ROI-out based validation method), the average of two image features, and the first feature computed from the watershed algorithm generated maps, respectively.
TABLE II.
A confusion matrix of applying the CBIR based CAD scheme to classify 820 ROIs in our reference database using a leave-one-ROI-out method.
| Actual malignant ROIs | Actual benign ROIs | |
|---|---|---|
| Predicted malignant ROIs | 386 | 56 |
| Predicated benign ROIs | 45 | 333 |
The study results also show that the computed image feature values may vary with the shift of the queried lesion center seeds, which thus affect the classification scores of the queried ROI. For example, for malignant lesion one (the first ROI in the first row of Fig. 1), the five classification scores are 0.816, 0.815, 0.890, 0.880, and 0.621 when using five randomly queried lesion center seeds, respectively, while for benign lesion one (the first ROI in the third row of Fig. 1), the five classification scores are 0.298, 0.488, 0.348, 0.623, and 0.174, respectively. Figure 8 shows the classification score distributions obtained from 50 malignant ROIs and 50 benign ROIs of our independent testing dataset, which include the classification scores computed based on the first originally queried seeds and the median classification scores of the five queried seeds for each ROI. It is clear that variation of the classification scores on the same queried ROIs affects the final classification performance on the testing dataset (e.g., AUC values). The figure also shows that using median score of each ROI, the average classification score of all 50 malignant ROIs (a dashed blue line) is higher than the average classification score of using the original seed (a solid red line), whereas for the group of 50 benign ROIs, the relationship between two average score lines reverses, which indicates that using median scores could potentially yield higher classification performance than using the original (or first randomly marked) lesion center seed due to the increased difference of two average scores between the groups of malignant and benign cases (the bigger distance between the two dashed blue lines than that between the two solid red lines).
FIG. 8.

Distribution of classification scores computed using the original queried lesion center seeds (marked by *) and the median classification scores (marked by ∘) among 50 malignant ROIs (a) and 50 benign ROIs (b). In both diagrams (a) and (b), the solid red line and dashed blue line indicate the average classification score level of the 50 ROIs using the original seeds and median classification scores using the five seeds, respectively.
Figure 9 shows and compares two ROC curves generated using the classification scores computed based on the first originally queried lesion center seed and the median classification scores computed from the total of five queried lesion center seeds. The two computed AUC values were 0.832 ± 0.040 and 0.878 ± 0.035, respectively. Due to the small number of testing ROIs and larger standard deviations, the difference between these two AUC values computed by rockit program was not statistically significant (p = 0.18). However, these two ROC curves show quite different classification patterns. The classification sensitivity at higher specificity was substantially increased when using the median classification scores. For example, at 90% specificity (0.1 fraction of benign ROIs), the sensitivity levels increased from 55.6% to 71.2%. In addition, Table III shows and compares two confusion matrices generated using the first original classification scores and the median classification scores when a threshold of ST = 0.5 was applied on the classification scores. The result shows a 5% increase of classification accuracy from 75% (75/100) to 80% (80/100).
FIG. 9.

Comparison of two ROC curves generated using two different sets of classification scores of 100 testing ROIs. In these two ROC curves, AUC = 0.832 ± 0.040 and 0.878 ± 0.035 when using the classification scores computed based on the original queried lesion center seed and the median classification scores computed from five randomly placed lesion center seeds, respectively.
TABLE III.
Comparison of two confusion matrices generated using the original classification scores based on the queried lesion center and the median classification scores after adding four randomly placed lesion center seeds. The latter approach corrected five misclassified malignant and benign ROIs.
| Original classification scores | ||
|---|---|---|
| Malignant | Benign | |
| Malignant | 38 | 12 |
| Benign | 13 | 37 |
| Median classification scores | ||
| Malignant | 42 | 8 |
| Benign | 12 | 38 |
4. DISCUSSION
In this study, we investigated and demonstrated the feasibility of developing a new CBIR based CAD scheme to classify between malignant and benign masslike lesions depicted on mammograms. The study has a number of unique characteristics and experimental observations. First, to realize a fast (or “real time”) reference image retrieval and compute a classification score for a queried ROI in CAD or particularly in the interactive CAD application,26 a set of image features is typically precomputed from all selected ROIs in the reference image database. In most of the previous studies, a relatively large number of image features were computed from the segmented lesions (e.g., 14 lesion morphological features were computed and used in our previous CBIR based ICAD study29). Due to the large variation of breast lesions and 3D tissue overlap on the 2D projection based mammograms, fully automated computerized schemes often fail to accurately segment subtle lesions.23,26 Thus, the errors and inconsistencies in the computed lesion morphological and density distribution features can negatively impact or reduce the performance of the CBIR based CAD schemes. To avoid the impact of lesion segmentation error, some researchers have tested other CBIR approaches without lesion segmentation [i.e., using mutual information of the entire ROI (Ref. 18)], which are often computationally expensive when applied to a large reference database. In this study, we tested and demonstrated the feasibility of developing a new approach that can avoid lesion segmentation and at the same time keep the CBIR process computationally efficient.
Second, defining effective and reliable image features is an important step in developing CBIR schemes to achieve high retrieval precision and computational efficiency. In this study, we explored and computed two simple image features that primarily relate to the lesion density/contrast and heterogeneity. The features are computed only from a small central region of the mass. This approach has both advantages and disadvantages. It can be applied to all masses (large and small) without lesion segmentation. However, since it ignores other important lesion information (in particular near the mass boundary), computing an image feature only using a small lesion central region may not be a “best” or optimal approach. Unlike other 3D medical images (i.e., CT and/or MRI), a mammogram is a 2D projection image. Hence, accurately computing image features of a breast mass (i.e., mass density, heterogeneity, and boundary margin information) is quite difficult due to the overlap of fibro-glandular tissues. Increase of the image feature computation area increases both signal and noise. How to achieve the optimal signal-to-noise ratio in computing breast mass features using mammograms is an unresolved issue that needs to be investigated further. However, in this study, the testing results (i.e., as shown in Fig. 4) demonstrated that although sizes of breast lesions vary widely in screening mammograms, the density heterogeneity detected in the lesion center region already contains sufficient information (or a high signal-to-noise ratio) to represent the whole lesion with a higher discriminatory power. Our study results also indicate that using a small number of targeted image features with a closer correlation to human vision or knowledge in the breast lesion classification task may be a better and more efficient choice than using many more general and complicated lesion morphological or texture features that are not easily understandable by the human vision system (i.e., a conventional “black box” approach).
Third, to the best of our knowledge, this is the first study that investigated reproducibility of a CBIR based CAD scheme, which we believe, is an important issue that needs attention in the research field of developing CBIR based CAD schemes before such a scheme can be accepted in future clinical applications. Although CAD and other quantitative image analysis methods have advantages to overcome intra- and interobserver variability among radiologists, CAD also has a disadvantage. The computed image features are much more sensitive than human eyes to small changes in image processing conditions, which could reduce the reproducibility of CAD schemes, in particular for the individual cases.24,25 In an interactive CAD environment, the observer queries or defines the lesion center, which can have larger interobserver variability. The results of this study confirmed that similar to other conventional CAD or quantitative image processing schemes, the changes in computed image feature values also affect CAD performance using a CBIR approach. Although we only tested the reproducibility of a specific CAD scheme using CBIR, based on our previous experience, we believe that this reproducibility issue is not only unique to our scheme. It is also applicable to other CAD schemes using different CBIR approaches.
Fourth, in order to reduce or minimize the impact of the image feature variation on CBIR based CAD performance, we also proposed and tested a new compensation method/scheme. The study results demonstrated that using multiple randomly placed query seeds and a median (or average) of classification scores could be a better choice. Since in screening mammography, increase of sensitivity level at a higher specificity is more important or clinically relevant, it is very encouraging to observe that using a median classification score substantially increases the classification sensitivity at a high specificity level (as shown in Fig. 9), as well as the overall classification accuracy (Table III). The results of this study are also consistent with what we have observed in our previous efforts to improve the reproducibility of the conventional CAD schemes using the global optimization approaches (e.g., an artificial neural network).34,35
In summary, we demonstrated a new CAD scheme of mammograms using a simple and efficient CBIR approach based on two lesion density related image features. The performance and reproducibility of the CAD scheme were tested with a proposed improvement method. Despite this new improved approach and obtained encouraging results, this is a very preliminary study with a number of limitations. First, this is a preliminary technology development study with a limited reference database, which may not represent general breast lesions in a diverse screening mammography practice. Second, to perform the watershed algorithm processing and compute the two image features, we used a number of empirically determined thresholds or parameters based on our specific reference dataset. Although we performed several systematic experiments to assess the impact of choosing these parameters on the final classification performance, we only applied an exhaustive-search method to incrementally change the value of one parameter in each experiment. Hence, how to more effectively select or adaptively optimize these parameters using different image databases still needs to be investigated in the future studies. Third, although we investigated the reproducibility issue of CAD schemes using a CBIR approach, this was a very simple and preliminary test. Many questions of how to identify more invariant image features and improve reproducibility of CAD schemes using CBIR approaches remain, which also need to be investigated further in future studies. Fourth, we only explored and used two lesion density related features. Using these two features is not likely to achieve optimal performance as demonstrated in this study. Fusion with other effective image features (i.e., the features related to the lesion shape and boundary margin) has potential to further improve CAD performance and robustness in the future studies. Therefore, our research will continue to explore new methods to efficiently compute and optimally add other types of lesion image features with higher discriminatory power into our CBIR based CAD scheme.
ACKNOWLEDGMENTS
This work is supported in part by Grant of R01 CA160205 from the National Cancer Institute, National Institutes of Health. The authors would like to acknowledge the support from the Peggy and Charles Stephenson Cancer Center, University of Oklahoma as well.
REFERENCES
- 1.Siegel R., Naishadham D., and Jemal A., “Cancer statistics, 2013,” Ca-Cancer J. Clin. 63, 11–30 (2013). 10.3322/caac.21166 [DOI] [PubMed] [Google Scholar]
- 2.Cady B. and Michaelson J. S., “The life-sparing potential of mammographic screening,” Cancer 91, 1699–1703 (2001). [DOI] [PubMed] [Google Scholar]
- 3.American College of Radiology , ACR Breast Imaging Reporting and Data System Atlas (BI-RADS Atlas) (American College of Radiology, Reston, VA, 2003). [Google Scholar]
- 4.Berg W. A. et al. , “Diagnostic accuracy of mammography, clinical examination, US, and MR imaging in preoperative assessment of breast cancer,” Radiology 233, 830–849 (2004). 10.1148/radiol.2333031484 [DOI] [PubMed] [Google Scholar]
- 5.Sickles E. A., Wolverton D. E., and Dee K. E., “Performance parameters for screening and diagnostic mammography: Specialist and general radiologists,” Radiology 224, 861–869 (2002). 10.1148/radiol.2243011482 [DOI] [PubMed] [Google Scholar]
- 6.Fenton J. J. et al. , “Reality check: Perceived versus actual performance of community mammographers,” Am. J. Roentgenol. 187, 42–46 (2006). 10.2214/AJR.05.0455 [DOI] [PMC free article] [PubMed] [Google Scholar]
- 7.Berg W. A. et al. , “Detection of breast cancer with addition of annual screening ultrasound or a single screening MRI to mammography in women with elevated breast cancer risk,” JAMA 307, 1394–1404 (2012). 10.1001/jama.2012.388 [DOI] [PMC free article] [PubMed] [Google Scholar]
- 8.Hubbard R. A. et al. , “Cumulative probability of false-positive recall or biopsy recommendation after 10 years of screening mammography: A cohort study,” Ann. Intern. Med. 155, 481–492 (2011). 10.7326/0003-4819-155-8-201110180-00004 [DOI] [PMC free article] [PubMed] [Google Scholar]
- 9.Brodersen J. and Siersma V. D., “Long-term psychosocial consequences of false-positive screening mammography,” Ann. Fam. Med. 11, 106–115 (2013). 10.1370/afm.1466 [DOI] [PMC free article] [PubMed] [Google Scholar]
- 10.Berlin L. and Hall F. M., “More mammography muddle: Emotions, politics, science, costs and polarization,” Radiology 255, 311–316 (2010). 10.1148/radiol.10100056 [DOI] [PubMed] [Google Scholar]
- 11.Gur D. et al. , “Changes in breast cancer detection and mammography recall rates after the introduction of a computer-aided detection system,” J. Natl. Cancer Inst. 96, 185–190 (2004). 10.1093/jnci/djh067 [DOI] [PubMed] [Google Scholar]
- 12.Fenton J. J. et al. , “Effectiveness of computer-aided detection in community mammography practice,” J. Natl. Cancer Inst. 103, 1152–1161 (2011). 10.1093/jnci/djr206 [DOI] [PMC free article] [PubMed] [Google Scholar]
- 13.Nishikawa R. M. and Gur D., “CADe for early detection of breast cancer—Current status and why we need to continue to explore new approaches,” Acad. Radiol. 21, 1320–1321 (2014). 10.1016/j.acra.2014.05.018 [DOI] [PubMed] [Google Scholar]
- 14.Akgul C. et al. , “Content-based image retrieval in radiology: Current status and future direction,” J. Digital Imaging 24, 208–222 (2011). 10.1007/s10278-010-9290-9 [DOI] [PMC free article] [PubMed] [Google Scholar]
- 15.El-Naga I. et al. , “A similarity learning approach to content-based image retrieval: Application to digital mammography,” IEEE Trans. Med. Imaging 23, 1233–1244 (2004). 10.1109/tmi.2004.834601 [DOI] [PubMed] [Google Scholar]
- 16.Alto H., Rangayyan R. M., and Desautels J. E., “Content-based retrieval and analysis of mammographic masses,” J. Electron Imaging 14, 023016 (2005). 10.1117/1.1902996 [DOI] [Google Scholar]
- 17.Varela C., Timp S., and Karssemeijer N., “Use of border information in the classification of mammographic masses,” Phys. Med. Biol. 51, 425–441 (2006). 10.1088/0031-9155/51/2/016 [DOI] [PubMed] [Google Scholar]
- 18.Tourassi G. D. et al. , “Evaluation of information-theoretic similarity measures for content-based retrieval and detection of masses in mammograms,” Med. Phys. 34, 140–150 (2007). 10.1118/1.2401667 [DOI] [PubMed] [Google Scholar]
- 19.Heidt S., Elter M., Wittenberg T., and Paulus D., “Model-based characterization of mammographic masses,” in Bildverarbeitung für die Medizin, Informatik aktuell, edited byMeinzer H.-P., Deserno T. M., Handels H., and Tolxdorff T. (Springer, Berlin Heidelberg, 2009), pp. 287–291. [Google Scholar]
- 20.Yang L. et al. , “A boosting framework for visuality-preserving distance metric learning and its application to medical image retrieval,” IEEE Trans. Pattern Anal. Mach. Intell. 32, 30–44 (2010). 10.1109/tpami.2008.273 [DOI] [PubMed] [Google Scholar]
- 21.Wang X., Park S., and Zheng B., “Assessment of performance and reliability of computer-aided detection scheme using content-based image retrieval approach and limited reference database,” J. Digital Imaging 24, 352–359 (2011). 10.1007/s10278-010-9281-x [DOI] [PMC free article] [PubMed] [Google Scholar]
- 22.Wei C., Chen S., and Liu X., “Mammogram retrieval on similar mass lesions,” Comput. Methods Programs Biomed. 106, 234–248 (2012). 10.1016/j.cmpb.2010.09.002 [DOI] [PubMed] [Google Scholar]
- 23.Oliver A. et al. , “A review of automatic mass detection and segmentation in mammographic images,” Med. Image Anal. 14, 87–100 (2010). 10.1016/j.media.2009.12.005 [DOI] [PubMed] [Google Scholar]
- 24.Zheng B. et al. , “Computer-aided detection in mammography: A reproducibility assessment—Initial experience,” Radiology 228, 58–62 (2003). 10.1148/radiol.2281020489 [DOI] [PubMed] [Google Scholar]
- 25.Baker J. A., Lo L. Y., Delong D. M., and Floyd C. E., “Computer-aided detection in screening mammography: Variability in cues,” Radiology 233, 411–417 (2004). 10.1148/radiol.2332031200 [DOI] [PubMed] [Google Scholar]
- 26.Wang X. et al. , “An interactive system for computer-aided diagnosis of breast masses,” J. Digital Imaging 25, 570–579 (2012). 10.1007/s10278-012-9451-0 [DOI] [PMC free article] [PubMed] [Google Scholar]
- 27.Zheng B. et al. , “Computer-aided detection of breast masses depicted on full-field digital mammograms: A performance assessment,” Br. J. Radiol. 85, e153–e161 (2012). 10.1259/bjr/51461617 [DOI] [PMC free article] [PubMed] [Google Scholar]
- 28.Tan M., Pu J., and Zheng B., “Reduction of false-positive recalls using a computerized mammographic image feature analysis scheme,” Phys. Med. Biol. 59, 4357–4373 (2014). 10.1088/0031-9155/59/15/4357 [DOI] [PMC free article] [PubMed] [Google Scholar]
- 29.Zheng B. et al. , “A method to improve visual similarity of breast masses for an interactive computer-aided diagnosis environment,” Med. Phys. 33, 111–117 (2006). 10.1118/1.2143139 [DOI] [PubMed] [Google Scholar]
- 30.Beucher S. and Lantuéjoul C., “Use of watersheds in contour detection,” in International Workshop on Image Processing, Real-Time Edge and Motion Detection/Estimation, Rennes, France, September 17–21 (1979), available at http://cmm.ensmp.fr/~beucher/publi/watershed.pdf. [Google Scholar]
- 31.Tan M., Pu J., and Zheng B., “Optimization of breast mass classification using sequential forward floating selection (SFFS) and a support vector machine (SVM) model,” Int. J. Comput. Assisted Radiol. Surg. 9, 1005–1020 (2014). 10.1007/s11548-014-0992-1 [DOI] [PMC free article] [PubMed] [Google Scholar]
- 32.Muller H., Michoux N., Bandon D., and Geissbuhler A., “A review of content-based image retrieval systems in medical applications—Clinical benefits and future directions,” Int. J. Med. Inf. 73, 1–23 (2004). 10.1016/j.ijmedinf.2003.11.024 [DOI] [PubMed] [Google Scholar]
- 33.Zheng B., “Computer-aided diagnosis in mammography using content-based image retrieval approaches: Current status and future perspectives,” Algorithms 2, 828–849 (2009). 10.3390/a2020828 [DOI] [PMC free article] [PubMed] [Google Scholar]
- 34.Zheng B., Gur D., Good W. F., and Hardesty L. A., “A method to test the reproducibility and to improve performance of computer-aided detection schemes for digitized mammograms,” Med. Phys. 31, 2964–2972 (2004). 10.1118/1.1806291 [DOI] [PubMed] [Google Scholar]
- 35.Zheng B. et al. , “Performance and reproducibility of a computerized mass detection scheme for digitized mammography using rotated and re-sampled images—An assessment,” Am. J. Roentgenol. 185, 194–198 (2005). 10.2214/ajr.185.1.01850194 [DOI] [PubMed] [Google Scholar]