

Abstract
Graph theory provides a useful framework to study functional brain networks from neuroimaging data. In epilepsy research, recent findings suggest that it offers unique insight into the fingerprints of this pathology on brain dynamics. Most studies hitherto have focused on seizure activity during focal epilepsy, but less is known about functional epileptic brain networks during interictal activity in frontal focal and generalized epilepsy. Besides, it is not clear yet which measures are most suitable to characterize these networks. To address these issues, we recorded magnetoencephalographic (MEG) data using two orthogonal planar gradiometers from 45 subjects from three groups (15 healthy controls (7 males, 24 ± 6 years), 15 frontal focal (8 male, 32 ± 16 years) and 15 generalized epileptic (6 male, 27 ± 7 years) patients) during interictal resting state with closed eyes. Then, we estimated the total and relative spectral power of the largest principal component of the gradiometers, and the degree of phase synchronization between each sensor site in the frequency range [0.5–40 Hz]. We further calculated a comprehensive battery of 15 graph-theoretic measures and used the affinity propagation clustering algorithm to elucidate the minimum set of them that fully describe these functional brain networks. The results show that differences in spectral power between the control and the other two groups have a distinctive pattern: generalized epilepsy presents higher total power for all frequencies except the alpha band over a widespread set of sensors; frontal focal epilepsy shows higher relative power in the beta band bilaterally in the fronto-central sensors. Moreover, all network indices can be clustered into three groups, whose exemplars are the global network efficiency, the eccentricity and the synchronizability. Again, the patterns of differences were clear: the brain network of the generalized epilepsy patients presented greater efficiency and lower eccentricity than the control subjects for the high frequency bands, without a clear topography. Besides, the frontal focal epileptic patients showed only reduced eccentricity for the theta band over fronto-temporal and central sensors. These outcomes indicate that functional epileptic brain networks are different to those of healthy subjects during interictal stage at rest, with a unique pattern of dissimilarities for each type of epilepsy. Further, when properly selected, three network indices suffice to provide a comprehensive description of these differences. Yet, since such uniqueness in the pattern of differences is also evident in the power spectrum, we conclude that the added value of the graph theory approach in this context should not be overestimated.
Abbreviations: FC, functional connectivity; MEG, magnetoencephalography; PLV, phase locking value; PS, phase synchronization
Keywords: Magnetoencephalography, Epilepsy, Phase synchronization, Functional connectivity, Graph theory
Highlights
-
•
We study MEG activity during interictal resting state with closed eyes.
-
•
Generalized epilepsy presents higher total power over a widespread set of sensors.
-
•
Frontal epilepsy shows higher relative power in beta band on fronto-central sensors.
-
•
We also found altered functional brain networks in epilepsy using graph theory.
-
•
The pattern of differences from control subjects is unique for each type of epilepsy.
1. Introduction
Epilepsy is one of the most common neurological disorders, which affects more than 50 million people worldwide, according to the World Health Organization. It is characterized by a predisposition to generate seizures of highly synchronous neuronal activity. The gradual process by which a normal neural network changes into a hyper-excitable one leading to epilepsy is known as epileptogenesis (Viteri-Torres, 2003). This hyper-excitability depends on the functional features of the cortical neurons and the organization of the neural networks. In focal epilepsy it is assumed that the hiper-synchronous discharges are originated in a specific region of the cortex, known as the ictal onset zone. Discharges can then propagate from this zone to other adjacent or deeper areas. Up to date, most of the work in focal epilepsy has centered on the study of the interictal epileptogenic abnormal activity to localize the onset zone, since it would be the main target for surgical treatment in refractory focal epilepsy. Understanding the mechanisms underlying epileptic brains is one of the greatest challenges of our days, as nowadays, around 1 out of 3 epileptic patients do not have seizure control even with the best available medications or surgery. The interest on the study of the dynamic and the intrinsic properties of the epileptic networks has recently increased, questioning the classical approach to both the focal and the generalized epilepsies.
According to the classification of epilepsy proposed by the ILAE in 1989, in this study we evaluated two big syndromes: first, we studied patients with frontal focal epilepsy; second, we also analyzed, one of the most frequent epilepsies in infancy and adolescence, the idiopathic generalized epilepsy (specifically the Juvenile Myoclonic Epilepsy) (ILAE, 1989).
Frontal focal epileptic seizures are originated within networks limited to one hemisphere/brain region, which in our case are mainly frontal areas. Generalized epileptic seizures, on the other hand, are originated at some point within, and rapidly engaging, bilaterally distributed networks (but see also (Pati and Cole, 2014)).
The reason to compare these two epileptic syndromes arises from the controversy of the very definition of Idiopathic Generalized Epilepsy (IGE), since an increasing number of authors consider it another form of frontal epilepsy given their similarities. Different neuroimaging studies have identified structural and functional alterations on the lobes of patients with IGE (Savic et al., 2000; Simister et al., 2003; O'Muircheartaigh et al., 2011; O'Muircheartaigh and Richardson, 2012; Vollmar et al., 2012; de Araujo Filho et al., 2013). Besides, recent neuropsychological studies have also demonstrated the existence of personality disorders and cognitive deficits similar to those observed in patients with lesional frontal lobe epilepsy (Devinsky et al., 1997; Sonmez et al., 2004; Trinka et al., 2006; de Araújo Filho et al., 2007; Plattner et al., 2007; Pascalicchio et al., 2007; Piazzini et al., 2008; Karachristianou et al., 2008; Roebling et al., 2009; de Araujo Filho and Yacubian, 2013).
Research in epilepsy has historically focused on the molecular, anatomical and cellular physiological changes involved in its development (epileptogenesis) and in the initiation of seizures (ictogenesis) (Kramer and Cash, 2012). Yet, seizures are an extreme form of synchronous brain activity, a perfect example of pathological connectivity (hiper-synchronization) (Penfield and Jasper, 1954). Thus, epilepsy has been studied from the viewpoint of functional brain connectivity from the earliest stages of the field (see, e.g., (Le van Quyen et al., 1998)). More recently, interest has been drawn to analyze the way in which different brain regions communicate using complex network analysis. First indications that this approach might be useful to understand epilepsy came from model studies (Netoff et al., 2004). Since then, there is mounting empirical evidence for the hypothesis that changes in brain network topology might play a crucial role in epilepsy. Recently, Ponten et al. (2009) and Gupta et al. (2011) have proved, with surface EEG and MEG during absence seizures, that a more regular network topology could be related to seizure generation. Moreover, several studies have shown that interictal functional networks in epilepsy patients may be characterized by increased connectivity, a shift to a more regular topology, changes in modular structure and prominent hub-like regions (Chavez et al., 2010; Douw et al., 2010; Horstmann et al., 2010; Bartolomei et al., 2013; Clemens et al., 2013).
Most studies hitherto have used network characteristics such as clustering coefficient and average path length. However, this may be not enough to fully understand the relation between network organization and brain functioning in epilepsy (Haneef and Chiang, 2014). Thus, new studies are increasingly focusing on other network characteristics. For example, Wilke et al. (2011) used betweenness centrality, and found that it correlates with the location of the resected cortical regions in patients who were seizure-free following surgical intervention. Also van Dellen et al. (2012) have found that a less modular organization, decreased clustering coefficient, and a lower synchronizability (i.e., a measure for the stability of the synchronous state in a network) were associated with increased seizure occurrence and with cognitive decline in patients with brain tumor who had clinical seizures.
Several recent studies (see, e.g., (Burgess, 2011; Foley et al., 2014; Haneef and Chiang, 2014)) have also reported on the clinical relevance of the evaluating brain connectivity with M/EEG, and how this information can be combined with that of static structural connectivity to improve whole brain models in epilepsy (Taylor et al., 2014). Besides, van Diessen et al. (2013b) have for the first time developed a multivariable diagnostic prediction model based on functional network characteristics. However, despite extensive research on the characterization of epileptic functional brain networks from M/EEG (Otte et al., 2012; van Dellen et al., 2012; Bartolomei et al., 2013; Quraan et al., 2013; Ramon and Holmes, 2013; van Diessen et al., 2013a; Burns et al., 2014; Chiang and Haneef, 2014) or functional magnetic resonance data (e.g., (Zhang et al., 2011; Centeno and Carmichael, 2014)), there is no consensus on which measure (or set of them) is most suitable for the purpose, with different studies using difference measures. Besides, there is theoretic and empirical evidence (Lynall et al., 2010; Li et al., 2011; Hahn et al., 2015) that many of them are strongly correlated with each other. Therefore, we analyze here, using a battery of graph theoretic indices, the structure of the functional brain network during resting state interictal magnetoencephalography (MEG) from two different groups of epileptic patients (frontal focal and idiopathic generalized) and one of healthy subjects. We also compared these results with those from the more traditional power spectral analysis. Our aim is twofold: firstly, we seek to elucidate whether epileptic brain networks behave differently to normal ones even in the absence of spikes, to gain further insight into brain dynamics of epilepsy during the interictal stage. Secondly, we want to determine the minimal subset of measures that provide a comprehensive description of the structure of functional brain networks' structure from these data and what additional information, if any, they offer on interictal brain activity.
2. Material & methods
2.1. Subjects
60 subjects volunteered for the study, however, after data quality exclusion criteria, only 45 were finally analized: 15 patients (8 male, 32 ± 16 years) suffering from frontal focal epilepsy (FE), 15 patients (6 male, 27 ± 7 years) suffering from idiopathic generalized epilepsy (they all meet the criteria Juvenile Myoclonic Epilepsy or presumed genetic, as the new terminology stands) (GE) and 15 (7 males, 24 ± 6 years) healthy subjects (HS). All patients were classified independently by two neurologists. For the diagnosis and classification of seizures and epileptic syndromes, the clinical and electroencephalographic classifications of the ILAE (1989) were applied (ILAE, 1989). Patients were seen consecutively during the period between May 2009 and December 2011 in the outpatient clinics of neurology at the University General Hospital of Ciudad Real, with average evolution track of 10 years, and were free from epileptic crisis during the last 6 months prior to the recording. They were all free from mental retardation, connate anoxia history, history of head trauma or meningitis in early childhood. Each clinical history gathered epidemiological data (sex, age of onset of the first seizure, personal history, pregnancy and delivery…), clinical data (type of seizures and neurological findings) and treatments used. These data were combined with additional examinations (EEG, neuroimaging studies, magnetic resonance imaging (MRI) of 1.5 or 3 Tesla following the protocol for epilepsy that includes 3D-T1 isotropic voxel sequences of 1 mm and 2–3 mm axial and coronal slices with T2, FLAIR and T2* sequences), to establish if the etiology was idiopathic, symptomatic or cryptogenic. The entire cohort of patients was also evaluated using a comprehensive neuropsychological test battery. Table S1 in Supplementary material provides a detailed account of each individual epileptic patient. In total 57% epileptic patients were on monto-therapy and 43% on bi-therapy (in FE group 7 patients were on monotherapy and 8 in bitherapy; in GE group 10 on monotherapy and 5 on biotherapy). 43% patients were taking valproic acid alone or in combination (8 in FE and 5 in GE). All data were analyzed anonymously and ethical approval was granted by the Local Ethics Committee of the Hospital.
2.2. MEG acquisition
MEG recordings were obtained using a 306-channel whole head Elekta Neuromag® MEG system (Elekta Oy, Helsinki, Finland), comprising 102 magnetometers and 204 planar gradiometers in a helmet-shaped array covering the entire scalp, while subjects were seated inside a magnetically shielded room (Vacuumschmelze GmbH, Hanau, Germany). Eye movements were monitored by simultaneously recording the electrooculogram (EOG) with three Ag/Cl electrodes, two above and below the right eye and one at the right earlobe (ground reference). Four head position indicator (HPI) coils, whose data were used to correct head movement during the session, were placed on the scalp, appropriately spaced in the region covered by the MEG helmet. The locations of the nasion, two pre-auricular points, and the 4 HPI coils were digitized prior to each MEG study using a 3D-digitizer (FASTRACK; Polhemus, Colchester, VT) to define the subject-specific Cartesian head coordinate system. 100–200 additional anatomical points were digitized on the head surface to provide a more accurate shape of the subject's head. Once a subject was comfortably positioned in the MEG machine, short electrical signals were sent to the HPI coils to localize them with respect to the MEG sensor array.
2.3. Task and parameters
MEG data were acquired (sampling rate 1 kHz, on-line band-pass filter 0.10–330 Hz) during a single 20 min session of resting state; 10 min with eyes open fixating vision on a cross on the screen, followed by 10 min with eyes closed (EC). Only the EC data were used here, to ensure they were free from blinking artifacts and that epileptic behavior (especially the interictal epileptiform discharges) could be easily identified.
External noise was removed, as recently suggested in MEG literature (Gross et al., 2013), by using the temporal extension of Signal-Space Separation (tSSS) (Taulu and Kajola, 2005) as implemented with the MaxFilter® software (version 2.0 ElektaNeuromag®; sliding window of 10 s, subspace correlation limit of 0.98 (Hillebrand et al., 2013)), configured with an inner expansion order of 8, which leads to a maximum of 80 spherical harmonics, as recommended by Elekta (Taulu and Kajola, 2005; Taulu and Simola, 2006), which avoids the problems associated to a low truncation order. The optimal number of harmonics to be used in the tSSS expansion remains, to the best of our knowledge, an unsolved issue. It is beyond the scope of the present work to try to solve it here. We did try, however, a higher number of the inner expansion order (10) in a subsample of the subjects, and did not find any significant change in the results. Finally, we applied movement compensation to our data, to correct for subject's head movement during the recording.
2.4. Data selection
From the 10 min of closed eyes resting state, non-overlapping quasistationary segments of 5000 ms, free from eye or muscular artifact, and epileptic activities and far (at least 20 s) from any inter epileptic discharge, were extracted (max–min number of segment per subject: 127–85). To ensure the same number of segments per subject, we further selected the 40 most stationary segments from each participant by using the KPSS test for stationarity (Kipiński et al., 2011) (see Supplementary material for details). This number of 40 segments represents a good trade-off between the quality of the data selected and the quantity of available data segments.
2.5. Selection of the sensor type
Our MEG system has two orthogonally oriented planar gradiometers (gx and gy). These types of sensors present maximum sensitivity to sources directly below them, i.e., superficial cortical sources (Hämäläinen, 1995; Hansen et al., 2010), which makes them less sensitive to artifacts, distant disturbances and deeper brain sources. This is important in FC analysis at the sensor level, because gradiometers offer certain degree of protection against the well-known issue of volume conduction effect (Nolte et al., 2004). There is no consensus in the literature, however, as to how the information of the two orthogonal gradiometers should be combined in FC analysis: some authors (Deuker et al., 2009; Hsiao et al., 2009) use the whole 204 × 204 matrix of interdependencies between the four possible combinations of sensors; others take the gradiometer pair with the largest connectivity value (Palva et al., 2005) or combine the two planar gradiometers into an overall amplitude (Kitzbichler et al., 2011). Here, we estimated from the two planar gradiometers the first principal component (gPC) of the duplet (gx, gy), to reduce to one single variable the information contained in the gradiometers, in a data-driven, adaptive way (see Section 2 in Supplementary material for details). On average, gPC explained about 60–65% of the variance of (gx, gy), and there were no statistical between-group differences in the percentage of explained variance in the gPC (Wilcoxon test).
2.6. Power spectral density
2.6.1. Total and relative band power
We analyze total and relative power spectral density (PSD) of the data by computing them for a range of frequencies of interest between 0.1 and 40 Hz, which contains practically all the power in the EC condition (i.e., P0–40 Hz ≈ PTotal (Mormann et al., 2007)), in steps of 2 Hz, using the multitaper method based on Discrete Prolate Spheroidal (Slepian) Sequences, as implemented in Fieldtrip toolbox (Oostenveld et al., 2011). The spectral smoothing factor was set to 2 Hz. Both total and relative power were computed for every segment and sensor, and then averaged across segments to estimate their topographical distribution. Finally, we also estimate the grand average of both powers across the entire scalp in each group.
2.7. Functional connectivity
We analyzed functional brain connectivity from the MEG data by computing a phase synchronization (PS) measure: the phase-locking value (PLV) (Lachaux et al., 1999; Mormann, 2000), using HERMES toolbox, available at http://hermes.ctb.upm.es/ (Niso et al., 2013). PLV was selected as the FC measure because it is able to detect weaker synchronization regimes, where the phases of the oscillatory component are coupled whereas the amplitude may not be (Rosenblum et al., 1996; Hramov et al., 2005). Instead, amplitude-based measures such as mutual information or measures of generalized synchronization are unsuitable to analyze such synchronization regimes. We computed the index on bands centered in the frequencies going from 2 to 40 Hz with a bandwidth of 4 Hz, which we believe represent a reasonable tradeoff between two mutually opposed requirements. First, the frequency bands should be narrow enough to allow a proper phase reconstruction (see, e.g., (Thiel et al., 2006)). Second, selecting extremely narrow bands would require a very high order filter, which may distort part of the data segments due to border effects (see Supplementary material for details on PLV calculation). Finally, we focused on the 6 frequency bands commonly used in the literature: delta [0.1–4] Hz, theta [4–8] Hz, alpha [8–12] Hz, beta1 [12–20] Hz, beta2 [20–28] Hz and low gamma [28–40] Hz.
2.8. Functional brain networks
The FC matrix obtained in the previous section can be interpreted as the adjacency matrix of an undirected weighted network (Bullmore and Sporns, 2009; Rubinov and Sporns, 2010). In this approach, MEG sensors are considered as vertices (nodes) of the network, and the PLV between sensors as edges, which represent the strength of the connection between the vertices. We used the weighted version of the matrix because it potentially contains more information (i.e., the strength of the connection between the nodes) than its unweighted (binary) counterpart, although some studies showed that the results from both kind of networks do not differ (Li et al., 2009; Ponten et al., 2009), (but see also (Kim et al., 2013)). With either type of reconstruction strategy, however, the problem of setting an appropriate threshold below which the value of a connectivity index between two sensors should not be considered significant, remains unsolved (see, e.g., (Fornito et al., 2013; Kim et al., 2013; Quraan et al., 2013; Wilenius et al., 2013; Lehnertz et al., 2014)). We address this issue here, following recent results (Kim et al., 2013), by using the so-called fixed density approach, whereby the weights are rank sorted and a fixed proportion of the highest links (0 < k < 1; in our case, k = 0.35) is used to construct the network. In this way, we also avoid the problems associated to the comparison of networks of different densities (van Wijk et al., 2010) (see Section 5 in Supplementary material for details).
Network analysis methods derived from graph theory (Rubinov and Sporns, 2010) can then be applied to assess the features of this brain connectivity network (see (Chavez et al., 2010; van Dellen et al., 2012; Quraan et al., 2013) for recent examples and (Richardson, 2012; Engel et al., 2013; van Diessen et al., 2013a; Haneef and Chiang, 2014; Lehnertz et al., 2014) for recent reviews in epilepsy research). To characterize it, a long list of measures are currently in use (Rubinov and Sporns, 2010; Kaiser, 2011; Fornito et al., 2013). Thus, in this work we calculated many of the indices most commonly used for this purpose. Namely, the average degree (D) the strength (S), the clustering coefficient (C), transitivity (T), local efficiency (El), modularity (Q), the characteristic path length (L), global efficiency (Eg), eccentricity (ecc), network radius (rad) and diameter (diam), betweenness (B), eigenvector spectral density (v) and Small Worldness (SW), algebraic connectivity (ac) and synchronizability (sync) (see Supplementary material for details). Then, we use Pearson's correlation coefficient1 to estimate the similarity between any two of these network measures and apply the affinity propagation (AP) clustering algorithm (Frey and Dueck, 2007; Givoni and Frey, 2009), (see Supplementary material) to the resulting 15 × 15 correlation matrix to evaluate how many truly different groups of measures are actually there, and which of these measures should be taken as a representative exemplar of each group. To compare global measures, local measures at the sensor level (D, S, C, El, ecc, B and v) were averaged for each segment, so that the whole network is finally characterized by a reduced set of measures.
2.9. Statistical tests
Before carrying out any statistical test, for each of the calculated indices (whether spectral power, connectivity and graph measures), we estimated a mean value per subject by averaging across the 40 most stationary segments selected, to avoid the artificial increase of the sample size and the inflation of the alpha level (i.e., a higher probability of a type I error (Meyers et al., 2012)) that would have resulted if we have taken all the segments as individual samples.2
2.9.1. Brain connectivity networks and spectral power
Brain connectivity networks and spectral power can be compared at two levels (Meskaldji et al., 2013): global (averaged over all sensors) and local, which is further divided in two: sensors (nodes, for both the power spectral density analysis and brain connectivity networks), and edges (connectivity values, which is specific of the network indices).
2.9.2. Global level comparison
We tested for statistical differences at the global level between the two epileptic groups and the control one (GE vs. HS and FE vs. HS), by performing a Wilcoxon rank sum test, with p < 0.05/2 = 0.025 as the critical value (i.e., the “traditional” p < 0.05 Bonferroni adjusted for two test). These p-values were further corrected for multiple comparisons for all the frequency ranges by using the type I false discovery rate (FDR) method at the q < 0.1 level, as described in Benjamini and Yekutieli (2001) (see also Supplementary material).
2.9.3. Local level comparison
Here, we compare the values of the local network indices/power on each node to test for frequency-specific differences in their topographical distributions. Pairwise differences between the two epileptic groups with respect to control (GE vs. HS and FE vs. HS) as well as between the two epileptic groups (GE vs. FE) were analyzed by means of the two-sided non-parametric Wilcoxon test. Differences were considered significant if p < 0.05, corrected with FDR type I (Benjamini and Yekutieli, 2001). Finally, to study between-group differences for the links, a nonparametric permutation test was performed at the edge level, whereby the matrix from each subject was randomly ascribed to one of the groups and a t-test was performed between the control group and each of the other two groups. The number of permutations was set to 1000 and differences were considered significant at the p < 0.01 level if the value of the Student's t-function for the actual grouping was higher than those from at least 990 of the permutations.
Fig. 1 and Table S2 from the Supplementary material summarize the information regarding analysis methods.
Fig. 1.
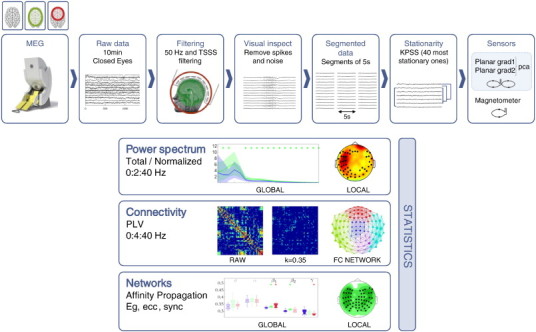
Pipeline showing the steps for data analysis.
3. Results
All figures presented henceforth follow as close as possible the latest recommendations for data visualization in the neurosciences (Allen et al., 2012).
3.1. Results of spectral power density
We only found global differences in the total power between the HS group and the GE group (Fig. 2, panel A), with the epileptic subjects showing higher values in the whole frequency range except for the [8–12 Hz] interval. As for the relative power (Fig. 3, panel A), significant global differences with the HS were only found for the FE group, in the [16–18 Hz]. We found no difference between the two epileptic groups either in the total or in the relative power.
Fig. 2.
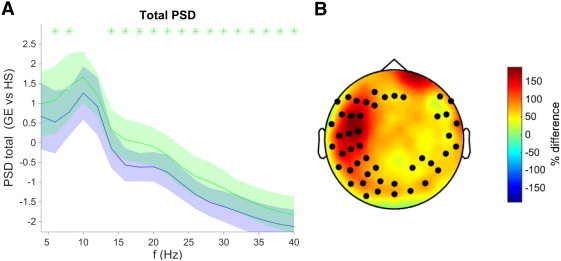
Total spectral power density for GE vs. HS as a function of the frequency. A: Global average in logarithmic units, where the colors represent the groups (blue: HS; green: GE), and shades represent the group's standard deviation. B: Topological distribution of the significant differences in total power expressed as a percentage of the power of the HS group. In A (B) figure, asterisks (bullets) denote statistical significance Wilcoxon test, FDR type I corrected at q-value < 0.05.
Fig. 3.
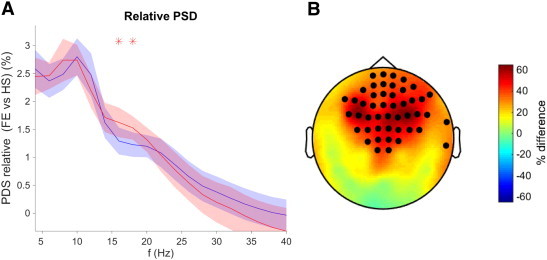
Relative spectral power density for GE vs. HS as a function of the frequency. A: Relative PSD average in logarithmic units, where the colors represent the groups (blue: HS; red FE), and shades represent the group's standard deviation. B: Topological distribution of the significant differences in total power expressed as a percentage of the power of the HS group. In A (B) figure, asterisks (bullets) denote statistical significance Wilcoxon test, FDR type I corrected at q-value < 0.05.
The topographical distribution of the differences in both the total and the relative power (panel B of Figs. 2 and 3, respectively) presents a distinct pattern for the two epileptic groups: whereas IGE showed increased total power in the whole frequency range all over the scalp (mainly in the “periphery” consisting on the fronto-temporal and occipital zones), the FE group showed differences in the relative power in the 15–20 Hz range, which were mostly concentrated in the frontal sensors.
3.2. Comparison of brain functional connectivity networks
3.2.1. Differences between functional connectivity measures
Fig. 4 shows differences in the PLV for the different frequency bands. The GE group showed a clear pattern of higher connectivity values as compared to HS and FE scattered all over the scalp and across all frequency bands (specially alpha and beta1 for HS and delta and theta for FE). Only a few links, mainly for frequencies above 8 Hz, and centered in the fronto-central region, showed the opposite trend (HS > GE and FE > GE). As for the FE subjects, the number of links significantly greater for them as compared to the healthy ones was not as large as for the GE group, and there was even a balance between increased and decreased PLV in some of the bands (alpha, beta2 and gamma), without a clear spatial pattern.
Fig. 4.
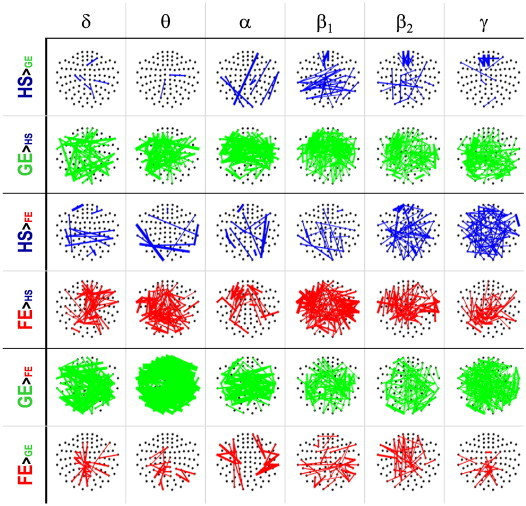
Phase synchronization: PLV indices.The colored lines denote the PLV values that changed significantly (see text for details) between each pair of groups (HS, GE and FE). The thickness of each line indicates the percentage of change for this link, whereas its color represents the group with the higher value. Namely, blue for HS, green for GE and red for FE.
3.2.2. Comparison between global network measures
Prior to test for between-group differences in network measures, we studied the pattern of correlation between all these measures as explained in the Material & methods section, to determine the degree of redundant information provided by them, and which subset should be further analyzed.
There are two types of network measures according to their level:
-
•
Global, with one value for the whole network: Q, T, L, eg, rad, diam, ac, sync.
-
•
Local, with one value for each node: C, S, D, k, El, v, ecc, B.
Thus, to study the correlation pattern, the local measures, were averaged across sensors. The results are presented in Fig. 5.
Fig. 5.
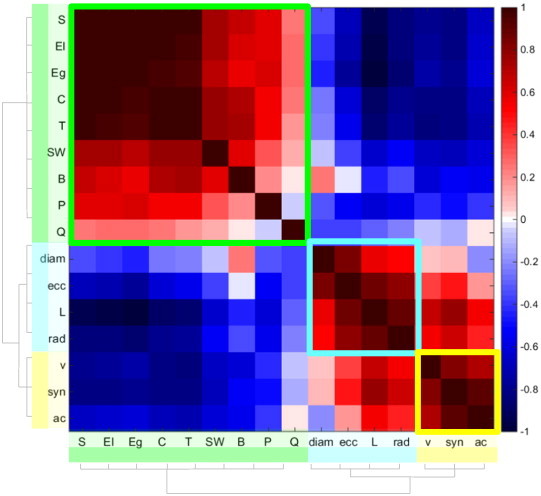
Results from Affinity Propagation clustering. Matrix of correlations between all the network measures. The three colored squares (red, turquoise and yellow) within the matrix are the 3 clusters detected by the AP algorithm. The dendrogram at the left/bottom of the matrix shows the result of applying the traditional hierarchical clustering algorithm with 3 clusters, which coincide with those obtained with the AP algorithm.
The AP algorithm detected the following three clusters of network indices, with their corresponding exemplars:
-
•
Group 1 (exemplar (Eg)): C, T, S, El, Eg, B, Q, SW [relationship]
-
•
Group 2 (exemplar (ecc)): ecc, L, rad, diam [lengths]
-
•
Group 3 (exemplar (v)): v, syn, ac [synchronizability].
These results were consistent with those obtained with the hierarchical clustering, as shown in the dendrogram of Fig. 5, when the number of clusters was fixed to three. Thus, henceforth we will work only with the exemplars of each of the three clusters (Eg, ecc, and v).
3.2.3. Differences of FC global and local network measures
Figs. 6–8 show the between-group differences for all frequency bands for the three network indices selected by the AP algorithm. Boxplots represent the distribution of each measure across sensors, whereas the heads display the topographical distribution of the differences at the local level. The brain network of the GE patients presented higher global efficiency than the HS for the beta1 and gamma bands, and a lower eccentricity for the beta1, beta2 and gamma bands. Also, it showed a lower synchronizability in the delta band. Topographically, differences in both indices were scattered over many sensors, mainly in the temporal, parietal and occipital regions.
Fig. 6.
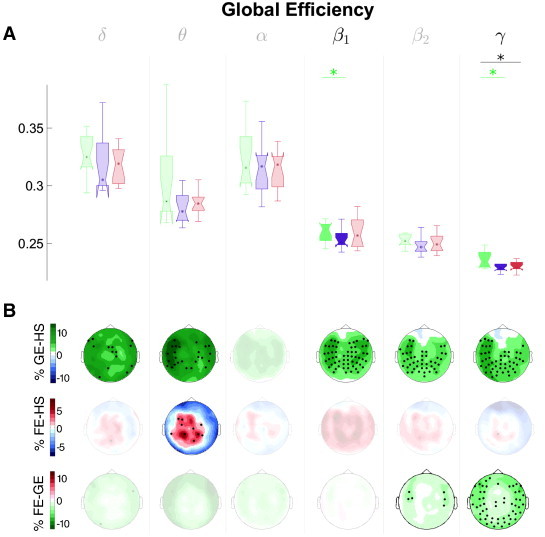
Functional network results: Global efficiency. A: Results of the Wilcoxon test after FDR type I correction (*p < 0.025, **p < 0.01) for the Global efficiency (Eg). Boxplots represent the distribution of each measure for all sensors and groups: Blue: HS; green: GE group; red: FE group. The green asterisks represent significant differences between GE and HS, the red ones, between FE and HS, and the black ones, between GE vs. FE. Bullets of the boxplot indicate the median of the distribution, box represents the 1st (25th percentile) and the 3rd quartile (75th percentile), and whiskers are the maximum/minimum observation, whereas notch indicates the median confidence interval. B: Topographies, where the corresponding sensor level measure (El) is plotted, the color maps represent percentage of variation as compared to the HS (top row: GE, middle row: FE, and bottom row: between the two epilepsies). For the sake of clarity, bands with non-significant differences have been shaded.
Fig. 7.
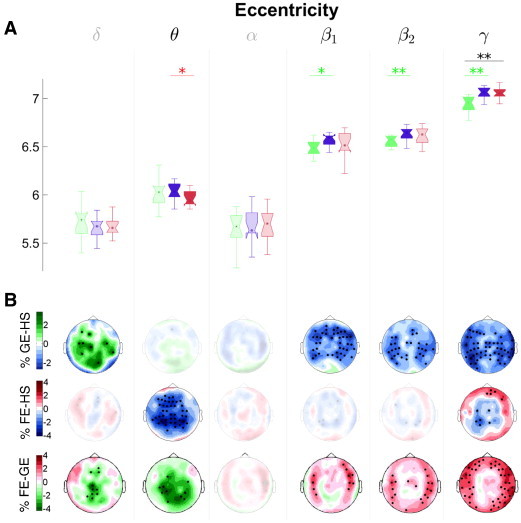
Functional network results: Eccentricity. The same as in Fig. 6 but for the eccentricity (ecc) index.
Fig. 8.
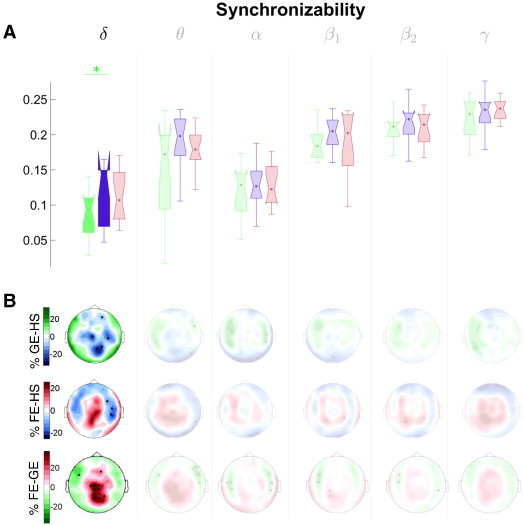
Functional network results: Synchronizability. The same as in Fig. 6 but for the synchronizability (syn) index. Note that here too, it is necessary to take a sensor level index from the same AP cluster (in this case, v) for the topographical map, because syn is a global index.
As for the FE group, its reconstructed functional brain network only differed from that of the HS group in the theta band, where the former one presented higher eccentricity at the global level, mainly for the centro-parietal sensors.
Note that El and v have to be selected for the topographical results as substitutes for Eg and sync belonging to each of the respective AP clusters, as these latter two indices are global measures.
4. Discussion
Complex network theory, as applied to the analysis of functional connectivity patterns derived from multivariate neurophysiological data, has greatly improved our understanding of normal and pathological brain dynamics (Bullmore and Sporns, 2009; Stam, 2014), because it characterizes salient properties of brain function beyond the pairwise correlations between every two brain areas. However, many questions remain open in this framework, such as the optimal combination of functional connectivity index/network measure(s) that best characterize the brain network in each particular context, or the possible relationship between differences in the properties of brain networks and changes in spectral power (Quraan et al., 2013). Besides, in the case of epilepsy research, not much attention has been paid to interictal brain activity and/or generalized epileptic patients, where the few studies so far are inconclusive (Stam, 2014). Here, we characterized in detail interictal epileptic brain activity from MEG data in both FE and GE patients by combining the traditional approach of power spectral analysis with the that of complex network theory, with the aim of elucidating what and how this modern approach can add to our understanding of seizure-free epileptic brain dynamics.
The spectral analysis shows that total power increases in GE patients as compared to HS in the whole frequency range, except for the alpha band, with a peripheral topographical distribution of the sensors across the whole head. The FE group, in turn, presents higher relative power density than the control group in the beta1 band, located mainly in the frontal sensors. There are few works analyzing power spectral density with MEG in epilepsy. Among them, Guggisberg et al. (2008) and Heers et al. (2014) have reported increased beta band activity during epileptic discharges with both MEG and intracranial EEG. Also, Hamandi et al. (2011), have used MEG to show the important role of beta band in epilepsy, in line with our findings. Clemens et al. (2000), using EEG, have found also during resting with closed eyes a trend for diffuse delta–theta–alpha (absolute and relative) power increase in IGE as compared to controls, while relative beta power decreased. These authors also found regional spectral alterations in IGE, especially in bilateral frontal areas, in accordance with our findings.
Another recent study (Quraan et al., 2013) reports similar results, although there signals were band-pass filtered in the 2–20 Hz range, and thus only differences in total power up to alpha band were found for left temporal lobe epilepsy as compared to controls. The discrepancies noted may exist for many reasons, including differences in the technique used (EEG versus MEG), and the types of patients analyzed.
Our main finding with regard to MEG power can be summarized by saying that the GE and the FE groups present a characteristic pattern of changes as compared to control: whereas the former group increases its total power while maintaining the distribution over frequencies as compared to controls; the FE group has regional-specific higher values for the relative power for the beta band, which entails a band-specific increase. Since an increase of total power can be interpreted as enhanced local synchronization in different neuronal populations (Nunez, 1995), these findings are consistent with the intimate relationship of enhanced local neuronal synchronization with epilepsy, particularly in the case of IGE (Engel and Pedley, 2008), and a redistribution of the power from the rest of the frequency range to the beta band for the case of the frontal focal epilepsy.
A potential confound that deserves further consideration is the possibility that differences between patients and the HS are due to the anti-epileptic drug (AED), as the subject from the GE and the FE groups are medicated. There have been studies were IGE patients without medication showed an increase power in delta, theta and alpha band as compared to controls, which reversed to a decrease in delta and theta bands when treated with valproate (Clemens, 2008). A decrease in delta and theta power for IGE patients treated with lamotrigine (Clemens et al., 2007) and in beta power in patients administered acute doses of benzodiazepine have been also reported (Jensen et al., 2005; Hansen et al., 2010). However, these patients took a range of medications with different mechanisms of action, not all of them GABAergic. In our study, patients were chosen in such a way that the medication was similar and controlled between both groups (see the Subjects section in the Material & methods section). Besides, they were stabilized on long term medication and none of the AEDs they take is based on benzodiazepines (see Table S1 from the Supplementary material). Furthermore, the absence of differences in beta band on frontal regions of GE when compared to HS (with very similar medication than FE) (see Figs. 2 and 3), argues against a systematic drug related-bias. Moreover, if the bias were due to medication, most likely it would have been the same in both groups GE and FE. However, both types of epilepsy differ with respect to the controls and between them.
The study of dynamic networks is a noninvasive method that can help to locate the epileptogenic area or ictal onset, ahead to raise a resective surgery in epilepsy. We can speculate that epileptic patients are successfully operated very probably due to the change in the topology of the pathological cortical network in which the resected area was involved.
As for our connectivity results, a methodological comment is in order. Indeed, we have combined PLV with gradiometers to analyze functional MEG connectivity at the sensor level. PLV is known to be sensitive to volume conduction effects. Thus some authors (see, e.g., (Stam et al., 2007)) advocate the use of PS indices insensitive to zero lag correlations. Yet on the one hand, not all zero-lag correlation is due to volume conduction (Vicente et al., 2008); and on the other hand, recent results on real and simulated neurophysiological data (Christodoulakis et al., 2013; Porz et al., 2014) demonstrated that these modified indices are also not free from caveats. Instead, we took advantage of the property of planar gradiometers to be mostly unaffected to deep sources, and dealt with this problem at the hardware rather than at the software level. With this consideration in mind, our connectivity results show that the GE group presents higher connectivity than HS across the whole frequency spectrum and widespread over all sensors, whereas the inverse is true mainly for the frontal sensors in the higher frequency bands (beta1 to gamma). A similar, although less specific, pattern of differences is found between the HS and the FE group, where the main connectivity increase for the epileptic group is found in beta1, whereas the increase is more pronounced for the HS group, widespread across sensor pairs, in the gamma band. Finally, changes in connectivity between the GE and the FE group mostly mirrored those between HS and GE.
Differences between control and epileptic subjects go in line with pre-ictal changes in EEG functional connectivity occurring predominantly in the beta band (Chávez et al., 2003; Mormann et al., 2007). Clemens et al. (2011) analyzed current source densities from EEG recordings, and found decreased FC in the 5–25 Hz range mainly in the anterior parts of the cortex, and increased FC in the posterior ones. In the low frequency bands, the strongest effects for both groups are in the theta band. Douw et al. (2010) have suggested that increased theta band connectivity, as the one we have found here for both GE and FE, is also a hallmark of tumor-related epilepsy. Kitchigina et al. (2013) have also reported “TLE-induced disturbance of theta oscillations in the septohippocampal system (…) and damage of septal and hippocampal GABAergic cells in theta activity abnormalities”, which seems to translate, according to our results, in increased functional connectivity in epilepsy. A recent study using PLV on scalp EEG in a large sample of GE patients (Chowdhury et al., 2014) also agrees in pinpointing theta band as the one showing the greatest differences between GE and HS, which our results suggest are strikingly similar to those between the two types of epilepsy.
Regarding the network indices, the results from the AP algorithm (Frey and Dueck, 2007) are robust in clustering the whole set into three groups, whose members in many cases (but not always) coincide on having related definitions (i.e., they are based on similar concepts). This outcome agrees with previous evidence that has demonstrated the strong correlation between many of these networks indices in MEG (Li et al., 2011), and fMRI (Lynall et al., 2010; Hahn et al., 2015). Thus, by focusing only on a reduced set of network measures, (namely, the representative exemplars of each group) it is possible to fully describe networks' properties.
As for the concrete results, the GE was the only epileptic group showing differences with the HS, mainly on the high frequency bands (beta1 and gamma, with GE > HS, Fig. 6). This result was robust for the rest of the members of the same AP cluster (not shown3), namely, clustering, transitivity, local efficiency and strength. This same increase was found for GE as compared to FE in the highest frequency band. It may reflect the facility the GE brains have to easily “transmit information” or in the case of seizures straightforwardly propagate overall the cortex. Note that this index (Eg) should not be confused with “metabolic efficiency” nor in the sense of how good a brain is, invoking to the colloquial use of the term (the more efficient the better), but just attain to its formal definition (see Supplementary material).
Finally, for the eccentricity (Fig. 7) (and characteristic path length, radius and diameter) the HS presented higher values than the GE group for the three highest frequency bands (beta1, beta2 and gamma). Besides, this is the only index that presented significant differences between the FE and the HS group, which were restricted to the theta band, where the FE group showed lower eccentricity. In both cases (GE and FE), the topographical distribution of these differences at the sensor level was widespread, with frontal, temporal and parietal sensors showing most of the effects. Again, as for the Eg, the pattern of differences in eccentricity between the epileptic groups mimics those between HS and GE in the gamma band. Eccentricity belongs to the same cluster of measures as the popular characteristic path length, L. Thus, these results may be interpreted by saying that interictal epileptic networks are more tightly connected than healthy ones. The literature on interictal network topology of epileptic patients is inconclusive (Stam, 2014). For instance, a recent EEG study (Quraan et al., 2013) indicates that the interictal network of temporal lobe epileptic (TLE) patients becomes more regular in the theta band, whereas a previous one using electrocorticogram records (van Dellen et al., 2009) in the same type of epileptic patients suggests that this regularization may turn to increased randomness in the long term. Yet there seems to be a consensus across neurophysiological modalities that, in general, interictal brain networks in frontal focal epileptic patients are abnormally regular as compared to HS (Chavez et al., 2010; Horstmann et al., 2010; Bartolomei et al., 2013). This is in agreement with our finding for the FE group, which showed a lower eccentricity (more regularity in the theta band), and even more markedly for the generalized epilepsy, which has been much less studied in the EEG/MEG literature, but for which our results show not only a decrease in ecc but a concomitant increase in Eg. Beside, this increase in regularity has a distinctive frequency pattern depending on the type of epilepsy, from high frequency bands in the case of generalized epilepsy to the low frequency theta band in the case of FE patients.
Finally, the GE group showed a lower synchronizability (Fig. 8) than the HS in the lowest frequency band. The interpretation of spectral Laplacian indices in terms of the synchronizability of the network, despite its growing popularity in brain connectivity analysis (Li et al., 2011; de Haan et al., 2012; Lehnertz et al., 2014), is based on the hypothesis that all the nodes of the networks are identical (van Mieghem, 2012), which is scarcely the case for the recorded MEG data. Indeed, a recent result (Duan and Chen, 2012) suggests that the interpretation is not completely clear. Yet, Li et al. (2011) have shown that spectral indices derived from the Laplacian matrix do add valuable information about brain networks' dynamics, which is not provided by any of the other network indices. In our case, the result on the syn index clearly suggests that epileptic brain networks of GE subjects at low frequencies are more easily synchronized, and its synchronized state is more robust (i.e., harder to break) as compared to healthy controls, in agreement with former results on low grade glioma-induced epileptic patients (van Dellen et al., 2012). This fact, which makes perfect sense given our current understanding of epilepsy as a hypersynchronization syndrome, may be also intrinsically related to the occurrence of seizures (Lehnertz et al., 2014). These results also suggest that patients with IGE show a cortical network more prone to enter a state of global synchronization, that is, prone to seizures. While patients with frontal epilepsy show more selective networks with higher spatial concentration (restricted to frontal areas). Thus, the dynamics of brain networks differed significantly when frontal focal and idiopathic generalized epilepsy are compared, which supports the fact that both types of epilepsy (GE and FE) could be considered to have their own clinical entity with a different functional neurophysiological expressions.
The complex network approach allows us to summarize the content of the functional connectivity information (as presented by the FC matrix) attending to different features as described before. Thus, compacting the information into one single value for each sensor or even more globally having one single value for each subject, which could be a convenient approach from the clinical point of view, due to its manageability. This fact also makes it very attractive for many other purposes (e.g., dimensionality reduction for machine learning techniques with diagnosis purposes, or correlation with different instruments such as results from behavior or neuropsychological tests).
One last issue of practical interest that we are currently studying, and that was very briefly introduced above, is the possible usefulness of network connectivity patterns to assist in the classification (diagnosis) of recorded subjects using machine learning algorithms, an area of research that is also growing very fast (see, e.g., (van Diessen et al., 2013a) for an application of scalp EEG FC patterns in epilepsy, and (Richiardi et al., 2013) for a recent review). This latter application is potentially very important from the clinical perspective, but it also circumvents the problem of determining whether the patterns of FC index (or any other connectivity index for that matter) are due to true connectivity or are the result of volume conduction of deep brain sources, which is reflected in many sensors at the same time. As long as these patterns are different in each group, they would be useful to detect deviations from the healthy condition. More research should be done in this respect, namely, compare resting state functional network patterns from epileptic groups with respect to healthy controls in larger cohorts for clinical purposes. Since MEG recordings of epilepsy patients are scarce in comparison to other imaging techniques, some open initiatives are emerging (see, e.g., the Open MEG Archiv, (Niso et al., 2015)), that could facilitate this endeavor.
To summarize, we conclude that, taken together, our results indicate that interictal MEG activity of epileptic patients at rest differs significantly from that of HS in the level of activation of individual sensors (power spectrum), the degree functional connectivity and the pattern of graph measures as assessed by PS analysis. The first and the last approach (power spectral analysis and graph theory) offer the clearest patterns of differences between each epileptic group and the HS: for the power spectra, changes are either in the total power across almost the whole frequency range and widespread over sensors (GE) or in the distribution of the power, confined to the alpha band and in sensors above and around the epileptic focus (FE). Results on the graph measures, in turn, indicate that three indices are enough to provide all the information on brain network dynamics, where differences are mainly between the GE and the HS group especially in the high frequency bands, whereas differences for the FE group are again confined to a single low frequency band (theta). In the case of network measures, the topography of the differences is, however, not as clear-cut as for the power spectra for either of the groups, but it does reveal one fact that remained undisclosed with the spectral power, namely that the features of the brain FC network in the gamma band present clear differences between the two epileptic groups. Thus, although graph theory provides additional insight into the dynamics of brain epileptic networks, it is also clear that the pattern of local activation/deactivations provided by power spectral analysis also highlights important aspects of brain activity in epilepsy. We conclude that the added value of the graph theory approach in this context should not be overestimated, but rather it seems advisable to combine it with the information from power spectral analysis to have a comprehensive picture of the changes in interictal brain in different types of epilepsies.
Acknowledgments
The authors declare no competing financial interests and acknowledge the financial support of the Spanish MINECO through the grants TEC2012-38453-CO4-01 and -03 and the Castilla La Mancha Sanitary System through grant FISCAM 2009. GN received financial support of the Spanish MEC through the FPU grant AP2008-02383. The funding bodies played no role in the design, writing or decision to publish this manuscript.
Footnotes
The results obtained applying the non-parametric version, the Spearman's rank correlation coefficient, were equivalent.
Interestingly, this approach has been recently used in the analysis of interictal brain MEG networks of epileptic patients in a study appearing in a high impact factor journal (Chavez et al., 2010)
Although we have only presented here the results corresponding to the exemplar of each group, these results were checked for each of the network measures, to ascertain that the main significant differences were robust across all the indices in the same cluster.
Contributor Information
Guiomar Niso, Email: guiomar.niso@ctb.upm.es, guiomar.niso@mcgill.ca.
Sira Carrasco, Email: siracarrasco79@gmail.com.
María Gudín, Email: mariagudinrm@gmail.com.
Fernando Maestú, Email: fernando.maestu@ctb.upm.es.
Francisco del-Pozo, Email: francisco.delpozo@ctb.upm.es.
Ernesto Pereda, Email: eperdepa@ull.edu.es.
Appendix A. Supplementary data
Supplementary material.
References
- Allen E.A., Erhardt E.B., Calhoun V.D. Data visualization in the neurosciences: overcoming the curse of dimensionality. Neuron. 2012;74(4):603–608. doi: 10.1016/j.neuron.2012.05.001. 22632718 [DOI] [PMC free article] [PubMed] [Google Scholar]
- Bartolomei F. Interictal network properties in mesial temporal lobe epilepsy: a graph theoretical study from intracerebral recordings. Clin. Neurophysiol. 2013;124(12):2345–2353. doi: 10.1016/j.clinph.2013.06.003. 23810635 [DOI] [PubMed] [Google Scholar]
- Benjamini Y., Yekutieli D. The control of the false discovery rate in multiple testing under dependency. Ann. Stat. 2001;29(4):1165–1188. [Google Scholar]
- Bullmore E.T., Sporns O. Complex brain networks: graph theoretical analysis of structural and functional systems. Nat. Rev. Neurosci. 2009;10(3):186–198. doi: 10.1038/nrn2575. 19190637 [DOI] [PubMed] [Google Scholar]
- Burgess R.C. Evaluation of brain connectivity: the role of magnetoencephalography. Epilepsia. 2011;52(Suppl. 4):28–31. doi: 10.1111/j.1528-1167.2011.03148.x. 21732938 [DOI] [PubMed] [Google Scholar]
- Burns S.P. Network dynamics of the brain and influence of the epileptic seizure onset zone. Proc. Natl. Acad. Sci. U. S. A. 2014;111(49):E5321–E5330. doi: 10.1073/pnas.1401752111. 25404339 [DOI] [PMC free article] [PubMed] [Google Scholar]
- Centeno M., Carmichael D.W. Network connectivity in epilepsy: resting state fMRI and EEG-fMRI contributions. Front. Neurol. 2014;5:93. doi: 10.3389/fneur.2014.00093. 25071695 [DOI] [PMC free article] [PubMed] [Google Scholar]
- Chavez M. Functional modularity of background activities in normal and epileptic brain networks. Phys. Rev. Lett. 2010;104(11):118701. doi: 10.1103/PhysRevLett.104.118701. 20366507 [DOI] [PubMed] [Google Scholar]
- Chávez M., Martinerie J., Le Van Quyen M. Statistical assessment of nonlinear causality: application to epileptic EEG signals. J. Neurosci. Methods. 2003;124(2):113–128. doi: 10.1016/s0165-0270(02)00367-9. 12706841 [DOI] [PubMed] [Google Scholar]
- Chiang S., Haneef Z. Graph theory findings in the pathophysiology of temporal lobe epilepsy. Clin. Neurophysiol. 2014;125(7):1295–1305. doi: 10.1016/j.clinph.2014.04.004. 24831083 [DOI] [PMC free article] [PubMed] [Google Scholar]
- Chowdhury F.A. Revealing a brain network endophenotype in families with idiopathic generalised epilepsy. PLOS ONE. 2014;9(10) doi: 10.1371/journal.pone.0110136. 25302690 [DOI] [PMC free article] [PubMed] [Google Scholar]
- Christodoulakis M. On the effect of volume conduction on graph theoretic measures of brain networks in epilepsy. Neuromethods. 2013;91:103–130. [Google Scholar]
- Clemens B. Characteristic distribution of interictal brain electrical activity in idiopathic generalized epilepsy. Epilepsia. 2007;48(5):941–949. doi: 10.1111/j.1528-1167.2007.01030.x. 17381440 [DOI] [PubMed] [Google Scholar]
- Clemens B. EEG functional connectivity of the intrahemispheric cortico-cortical network of idiopathic generalized epilepsy. Epilepsy Res. 2011;96(1–2):11–23. doi: 10.1016/j.eplepsyres.2011.04.011. 21601428 [DOI] [PubMed] [Google Scholar]
- Clemens B. Neurophysiology of juvenile myoclonic epilepsy: EEG-based network and graph analysis of the interictal and immediate preictal states. Epilepsy Res. 2013;106(3):357–369. doi: 10.1016/j.eplepsyres.2013.06.017. 23886656 [DOI] [PubMed] [Google Scholar]
- Clemens B. Valproate decreases EEG synchronization in a use-dependent manner in idiopathic generalized epilepsy. Seizure. 2008;17(3):224–233. doi: 10.1016/j.seizure.2007.07.005. 17697790 [DOI] [PubMed] [Google Scholar]
- Clemens B., Szigeti G., Barta Z. EEG frequency profiles of idiopathic generalised epilepsy syndromes. Epilepsy Res. 2000;42(2–3):105–115. doi: 10.1016/s0920-1211(00)00167-4. 11074183 [DOI] [PubMed] [Google Scholar]
- de Araújo Filho G.M. Psychiatric disorders in juvenile myoclonic epilepsy: a controlled study of 100 patients. Epilepsy Behav. 2007;10(3):437–441. doi: 10.1016/j.yebeh.2007.01.016. 17347053 [DOI] [PubMed] [Google Scholar]
- de Araujo Filho G.M. Personality traits in juvenile myoclonic epilepsy: evidence of cortical abnormalities from a surface morphometry study. Epilepsy Behav. 2013;27(2):385–392. doi: 10.1016/j.yebeh.2013.02.004. 23510795 [DOI] [PubMed] [Google Scholar]
- de Araujo Filho G.M., Yacubian E.M.T. Juvenile myoclonic epilepsy: psychiatric comorbidity and impact on outcome. Epilepsy Behav. 2013;28:S74–S80. doi: 10.1016/j.yebeh.2013.03.026. 23756487 [DOI] [PubMed] [Google Scholar]
- de Haan W. Disrupted modular brain dynamics reflect cognitive dysfunction in Alzheimer's disease. NeuroImage. 2012;59(4):3085–3093. doi: 10.1016/j.neuroimage.2011.11.055. 22154957 [DOI] [PubMed] [Google Scholar]
- Deuker L. Reproducibility of graph metrics of human brain functional networks. NeuroImage. 2009;47(4):1460–1468. doi: 10.1016/j.neuroimage.2009.05.035. 19463959 [DOI] [PubMed] [Google Scholar]
- Devinsky O. Frontal functions in juvenile myoclonic epilepsy. Cogn. Behav. Neurol. 1997;10(4):243–246. 9359121 [PubMed] [Google Scholar]
- Douw L. Epilepsy is related to theta band brain connectivity and network topology in brain tumor patients. B.M.C. Neurosci. 2010;11:103. doi: 10.1186/1471-2202-11-103. 20731854 [DOI] [PMC free article] [PubMed] [Google Scholar]
- Duan Z.-S., Chen G.-R. Does the eigenratio λ 2/λ N represent the synchronizability of a complex network? Chinese Physics B. 2012;21(8):080506. [Google Scholar]
- Engel J. Connectomics and epilepsy. Curr. Opin. Neurol. 2013;26(2):186–194. doi: 10.1097/WCO.0b013e32835ee5b8. 23406911 [DOI] [PMC free article] [PubMed] [Google Scholar]
- Engel J., Pedley T.A. Epilepsy [Electronic Resource]: A Comprehensive Textbook. Wolters Kluwer Health; 2008. [Google Scholar]
- Foley E. Magnetoencephalography in the study of epilepsy and consciousness. Epilepsy Behav. 2014;30:38–42. doi: 10.1016/j.yebeh.2013.09.005. [DOI] [PubMed] [Google Scholar]
- Fornito A., Zalesky A., Breakspear M. Graph analysis of the human connectome: promise, progress, and pitfalls. NeuroImage. 2013;80:426–444. doi: 10.1016/j.neuroimage.2013.04.087. 23643999 [DOI] [PubMed] [Google Scholar]
- Frey B.J., Dueck D. Clustering by passing messages between data points. Science. 2007;315(5814):972–976. doi: 10.1126/science.1136800. 17218491 [DOI] [PubMed] [Google Scholar]
- Givoni I.E., Frey B.J. A binary variable model for affinity propagation. Neural Comput. 2009;21(6):1589–1600. doi: 10.1162/neco.2009.05-08-785. 19191593 [DOI] [PubMed] [Google Scholar]
- Gross J. Good practice for conducting and reporting MEG research. NeuroImage. 2013;65:349–363. doi: 10.1016/j.neuroimage.2012.10.001. 23046981 [DOI] [PMC free article] [PubMed] [Google Scholar]
- Guggisberg A.G. Fast oscillations associated with interictal spikes localize the epileptogenic zone in patients with partial epilepsy. NeuroImage. 2008;39(2):661–668. doi: 10.1016/j.neuroimage.2007.09.036. 17977022 [DOI] [PMC free article] [PubMed] [Google Scholar]
- Gupta D., Ossenblok P., Van Luijtelaar G. Space–time network connectivity and cortical activations preceding spike wave discharges in human absence epilepsy: a MEG study. Med. Biol. Eng. Comput. 2011;49(5):555–565. doi: 10.1007/s11517-011-0778-3. 21533620 [DOI] [PubMed] [Google Scholar]
- Hahn A. Individual diversity of functional brain network economy. Brain Connect. 2015;5(3):156–165. doi: 10.1089/brain.2014.0306. 25411715 [DOI] [PMC free article] [PubMed] [Google Scholar]
- Hämäläinen M.S. Functional localization based on measurements with a whole-head magnetometer system. Brain Topogr. 1995;7(4):283–289. doi: 10.1007/BF01195254. 7577326 [DOI] [PubMed] [Google Scholar]
- Hamandi K., Singh K.D., Muthukumaraswamy S. Reduced movement-related β desynchronisation in juvenile myoclonic epilepsy: a MEG study of task specific cortical modulation. Clin. Neurophysiol. 2011;122(11):2128–2138. doi: 10.1016/j.clinph.2011.04.017. 21571587 [DOI] [PubMed] [Google Scholar]
- Haneef Z., Chiang S. Clinical correlates of graph theory findings in temporal lobe epilepsy. Seizure. 2014;23(10):809–818. doi: 10.1016/j.seizure.2014.07.004. 25127370 [DOI] [PMC free article] [PubMed] [Google Scholar]
- Hansen P.C., Kringelbach M.L., Salmelin R. MEG An Introduction to Methods. Oxford University Books; 2010. [Google Scholar]
- Heers M. Frequency domain beamforming of magnetoencephalographic beta band activity in epilepsy patients with focal cortical dysplasia. Epilepsy Res. 2014;108(7):1195–1203. doi: 10.1016/j.eplepsyres.2014.05.003. 24907181 [DOI] [PubMed] [Google Scholar]
- Hillebrand A. Feasibility of clinical magnetoencephalography (MEG) functional mapping in the presence of dental artefacts. Clin. Neurophysiol. 2013;124(1):107–113. doi: 10.1016/j.clinph.2012.06.013. 22832101 [DOI] [PubMed] [Google Scholar]
- Horstmann M.-T. State dependent properties of epileptic brain networks: comparative graph-theoretical analyses of simultaneously recorded EEG and MEG. Clin. Neurophysiol. 2010;121(2):172–185. doi: 10.1016/j.clinph.2009.10.013. 20045375 [DOI] [PubMed] [Google Scholar]
- Hramov A.E. Synchronization of spectral components and its regularities in chaotic dynamical systems. Phys. Rev. E. 2005;71(5 Pt 2):056204. doi: 10.1103/PhysRevE.71.056204. 16089631 [DOI] [PubMed] [Google Scholar]
- Hsiao F.-J. Theta oscillation during auditory change detection: an MEG study. Biol. Psychol. 2009;81(1):58–66. doi: 10.1016/j.biopsycho.2009.01.007. 19428969 [DOI] [PubMed] [Google Scholar]
- ILAE Proposal for revised classification of epilepsies and epileptic syndromes. Commission on Classification and Terminology of the International League Against Epilepsy. Epilepsia. 1989;30(4):389–399. doi: 10.1111/j.1528-1157.1989.tb05316.x. 2502382 [DOI] [PubMed] [Google Scholar]
- Jensen O. On the human sensorimotor-cortex beta rhythm: sources and modeling. NeuroImage. 2005;26(2):347–355. doi: 10.1016/j.neuroimage.2005.02.008. 15907295 [DOI] [PubMed] [Google Scholar]
- Kaiser M. A tutorial in connectome analysis: topological and spatial features of brain networks. NeuroImage. 2011;57(3):892–907. doi: 10.1016/j.neuroimage.2011.05.025. 21605688 [DOI] [PubMed] [Google Scholar]
- Karachristianou S., Katsarou Z., Bostantjopoulou S., Economou A., Garyfallos G., Delinikopoulou E. Personality profile of patients with juvenile myoclonic epilepsy. Epilepsy Behav. 2008;13(4):654–657. doi: 10.1016/j.yebeh.2008.08.006. [DOI] [PubMed] [Google Scholar]
- Kim D.J. Disturbed resting state EEG synchronization in bipolar disorder: A graph-theoretic analysis. Neuroimage Clin. 2013;2:414–423. doi: 10.1016/j.nicl.2013.03.007. 24179795 [DOI] [PMC free article] [PubMed] [Google Scholar]
- Kipiński L. Application of modern tests for stationarity to single-trial MEG data: transferring powerful statistical tools from econometrics to neuroscience. Biol. Cybern. 2011;105(3–4):183–195. doi: 10.1007/s00422-011-0456-4. 22095173 [DOI] [PubMed] [Google Scholar]
- Kitchigina V. Disturbances of septohippocampal theta oscillations in the epileptic brain: reasons and consequences. Exp. Neurol. 2013;247:314–327. doi: 10.1016/j.expneurol.2013.01.029. 23384663 [DOI] [PubMed] [Google Scholar]
- Kitzbichler M.G. Cognitive effort drives workspace configuration of human brain functional networks. J. Neurosci. 2011;31(22):8259–8270. doi: 10.1523/JNEUROSCI.0440-11.2011. 21632947 [DOI] [PMC free article] [PubMed] [Google Scholar]
- Kramer M.A., Cash S.S. Epilepsy as a disorder of cortical network organization. Neuroscientist. 2012;18(4):360–372. doi: 10.1177/1073858411422754. 22235060 [DOI] [PMC free article] [PubMed] [Google Scholar]
- Lachaux J.P. Measuring phase synchrony in brain signals. Hum. Brain Mapp. 1999;8(4):194–208. doi: 10.1002/(SICI)1097-0193(1999)8:4<194::AID-HBM4>3.0.CO;2-C. 10619414 [DOI] [PMC free article] [PubMed] [Google Scholar]
- Le van Quyen M. Nonlinear interdependencies of EEG signals in human intracranially recorded temporal lobe seizures. Brain Res. 1998;792(1):24–40. doi: 10.1016/s0006-8993(98)00102-4. 9593809 [DOI] [PubMed] [Google Scholar]
- Lehnertz K., Ansmann G., Bialonski S. Evolving networks in the human epileptic brain. Physica D: Nonlinear Phenomena. 2014;267:7–15. [Google Scholar]
- Li C. The correlation of metrics in complex networks with applications in functional brain networks. J. Stat. Mech. 2011;2011(11):11018. [Google Scholar]
- Li Y. Brain anatomical network and intelligence. PLOS Comput. Biol. 2009;5(5) doi: 10.1371/journal.pcbi.1000395. 19492086 [DOI] [PMC free article] [PubMed] [Google Scholar]
- Lynall M.-E. Functional connectivity and brain networks in schizophrenia. J. neurosci. 2010;30(28):9477–9487. doi: 10.1523/JNEUROSCI.0333-10.2010. 20631176 [DOI] [PMC free article] [PubMed] [Google Scholar]
- Meskaldji D.E. Comparing connectomes across subjects and populations at different scales. NeuroImage. 2013;80:416–425. doi: 10.1016/j.neuroimage.2013.04.084. 23631992 [DOI] [PubMed] [Google Scholar]
- Meyers, L.S., Gamst, G.C., Guarino, A.J., Applied multivariate Research: design and Interpretation 2nd ed. (2012). SAGE Publications
- Mormann F. Seizure prediction: the long and winding road. Brain. 2007;130(2):314–333. doi: 10.1093/brain/awl241. [DOI] [PubMed] [Google Scholar]
- Mormann F. Mean phase coherence as a measure for phase synchronization and its application to the EEG of epilepsy patients. Physica D. 2000;144(3–4):358–369. [Google Scholar]
- Netoff T.I. Epilepsy in small-world networks. J. Neurosci. 2004;24(37):8075–8083. doi: 10.1523/JNEUROSCI.1509-04.2004. 15371508 [DOI] [PMC free article] [PubMed] [Google Scholar]
- Niso G. Hermes: towards an integrated toolbox to characterize functional and effective brain connectivity. Neuroinformatics. 2013;11(4):405–434. doi: 10.1007/s12021-013-9186-1. 23812847 [DOI] [PubMed] [Google Scholar]
- Niso G. Omega: The Open MEG Archive. NeuroImage. 2015 doi: 10.1016/j.neuroimage.2015.04.028. available at: https://omega.bic.mni.mcgill.ca. [DOI] [PubMed] [Google Scholar]
- Nolte G. Identifying true brain interaction from EEG data using the imaginary part of coherency. Clin. Neurophysiol. 2004;115(10):2292–2307. doi: 10.1016/j.clinph.2004.04.029. 15351371 [DOI] [PubMed] [Google Scholar]
- Nunez P. Neocortical Dynamics and Human EEG Rhythms. Oxford University Books; 1995. Quantitative states of neocortex. [Google Scholar]
- O'Muircheartaigh J. Focal structural changes and cognitive dysfunction in juvenile myoclonic epilepsy. Neurology. 2011;76(1):34–40. doi: 10.1212/WNL.0b013e318203e93d. [DOI] [PMC free article] [PubMed] [Google Scholar]
- O'Muircheartaigh J., Richardson M.P. Epilepsy and the frontal lobes. Cortex. 2012;48(2):144–155. doi: 10.1016/j.cortex.2011.11.012. 22176870 [DOI] [PubMed] [Google Scholar]
- Oostenveld R. FieldTrip: open source software for advanced analysis of MEG, EEG, and invasive electrophysiological data. Comput. Intell. neurosci. 2011;2011:156869. doi: 10.1155/2011/156869. 21253357 [DOI] [PMC free article] [PubMed] [Google Scholar]
- Otte W.M. Characterization of functional and structural integrity in experimental focal epilepsy: reduced network efficiency coincides with white matter changes. PLOS One. 2012;7(7):e39078. doi: 10.1371/journal.pone.0039078. 22808026 [DOI] [PMC free article] [PubMed] [Google Scholar]
- Palva J.M., Palva S., Kaila K. Phase synchrony among neuronal oscillations in the human cortex. J. Neurosci. 2005;25(15):3962–3972. doi: 10.1523/JNEUROSCI.4250-04.2005. 15829648 [DOI] [PMC free article] [PubMed] [Google Scholar]
- Pascalicchio T.F. Neuropsychological profile of patients with juvenile myoclonic epilepsy: a controlled study of 50 patients. Epilepsy behav. E B. 2007;10(2):263–267. doi: 10.1016/j.yebeh.2006.11.012. 17258506 [DOI] [PubMed] [Google Scholar]
- Pati S., Cole A.J. How focal is generalized epilepsy: a distinction with a difference? Epilepsy Behav. 2014;34:127–128. doi: 10.1016/j.yebeh.2014.03.007. 24713435 [DOI] [PubMed] [Google Scholar]
- Penfield W., Jasper H. Epilepsy and the functional anatomy of the human brain. Southern Medical Journal. 1954;47(7) [Google Scholar]
- Piazzini A. Frontal cognitive dysfunction in juvenile myoclonic epilepsy. Epilepsia. 2008;49(4):657–662. doi: 10.1111/j.1528-1167.2007.01482.x. 18177360 [DOI] [PubMed] [Google Scholar]
- Plattner B. Juvenile myoclonic epilepsy: a benign disorder? Personality traits and psychiatric symptoms. Epilepsy Behav. 2007;10(4):560–564. doi: 10.1016/j.yebeh.2007.03.008. 17466599 [DOI] [PubMed] [Google Scholar]
- Ponten S.C.C. Indications for network regularization during absence seizures: weighted and unweighted graph theoretical analyses. Exp. Neurol. 2009;217(1):197–204. doi: 10.1016/j.expneurol.2009.02.001. 19232346 [DOI] [PubMed] [Google Scholar]
- Porz S., Kiel M., Lehnertz K. Can spurious indications for phase synchronization due to superimposed signals be avoided? Chaos. 2014;24(3):033112. doi: 10.1063/1.4890568. 25273192 [DOI] [PubMed] [Google Scholar]
- Quraan M.A. Altered resting state brain dynamics in temporal lobe epilepsy can be observed in spectral power, functional connectivity and graph theory metrics. PLOS One. 2013;8(7):e68609. doi: 10.1371/journal.pone.0068609. 23922658 [DOI] [PMC free article] [PubMed] [Google Scholar]
- Ramon C., Holmes M.D. Stochastic behavior of phase synchronization index and cross-frequency couplings in epileptogenic zones during interictal periods measured with scalp dEEG. Front. Neurol. 2013;4:57. doi: 10.3389/fneur.2013.00057. 23720651 [DOI] [PMC free article] [PubMed] [Google Scholar]
- Richardson M.P. Large scale brain models of epilepsy: dynamics meets connectomics. J. Neurol. Neurosurg. Psychiatry. 2012;83(12):1238–1248. doi: 10.1136/jnnp-2011-301944. 22917671 [DOI] [PubMed] [Google Scholar]
- Richiardi J., Achard S., Bunke H., Van De Ville D. Machine Learning with Brain Graphs: Predictive Modeling Approaches for Functional Imaging in Systems Neuroscience. IEEE Signal Process Mag. 2013;30:58–70. [Google Scholar]
- Roebling R. Evaluation of cognition, structural, and functional MRI in juvenile myoclonic epilepsy. Epilepsia. 2009;50(11):2456–2465. doi: 10.1111/j.1528-1167.2009.02127.x. 19490045 [DOI] [PubMed] [Google Scholar]
- Rosenblum M.G., Pikovsky A.S., Kurths J. Phase synchronization of chaotic oscillators. Phys. Rev. Lett. 1996;76(11):1804–1807. doi: 10.1103/PhysRevLett.76.1804. 10060525 [DOI] [PubMed] [Google Scholar]
- Rubinov M., Sporns O. Complex network measures of brain connectivity: uses and interpretations. Neuroimage. 2010;52(3):1059–1069. doi: 10.1016/j.neuroimage.2009.10.003. 19819337 [DOI] [PubMed] [Google Scholar]
- Savic I. MR spectroscopy shows reduced frontal lobe concentrations of N-acetyl aspartate in patients with juvenile myoclonic epilepsy. Epilepsia. 2000;41(3):290–296. doi: 10.1111/j.1528-1157.2000.tb00158.x. 10714400 [DOI] [PubMed] [Google Scholar]
- Simister R.J. Proton MRS reveals frontal lobe metabolite abnormalities in idiopathic generalized epilepsy. Neurology. 2003;61(7):897–902. doi: 10.1212/01.wnl.0000086903.69738.dc. 14557556 [DOI] [PubMed] [Google Scholar]
- Sonmez F. Cognitive function in juvenile myoclonic epilepsy. Epilepsy behav. 2004;5(3):329–336. doi: 10.1016/j.yebeh.2004.01.007. 15145302 [DOI] [PubMed] [Google Scholar]
- Stam C.J. Modern network science of neurological disorders. Nat. Rev. Neurosci. 2014;15(10):683–695. doi: 10.1038/nrn3801. 25186238 [DOI] [PubMed] [Google Scholar]
- Stam C.J., Nolte G., Daffertshofer A. Phase lag index: assessment of functional connectivity from multi channel EEG and MEG with diminished bias from common sources. Hum. Brain Mapp. 2007;28(11):1178–1193. doi: 10.1002/hbm.20346. 17266107 [DOI] [PMC free article] [PubMed] [Google Scholar]
- Taulu S., Kajola M. Presentation of electromagnetic multichannel data: the signal space separation method. J. Appl. Phys. 2005;97(12):124905. [Google Scholar]
- Taulu S., Simola J. Spatiotemporal signal space separation method for rejecting nearby interference in MEG measurements. Phys. Med. biol. 2006;51(7):1759–1768. doi: 10.1088/0031-9155/51/7/008. 16552102 [DOI] [PubMed] [Google Scholar]
- Taylor P.N., Kaiser M., Dauwels J. Structural connectivity based whole brain modelling in epilepsy. J. Neurosci. Methods. 2014;236:51–57. doi: 10.1016/j.jneumeth.2014.08.010. 25149109 [DOI] [PubMed] [Google Scholar]
- Thiel M. Twin surrogates to test for complex synchronisation. Europhysics Lett. 2006;75(4):535–541. [Google Scholar]
- Trinka E. Psychiatric comorbidity in juvenile myoclonic epilepsy. Epilepsia. 2006;47(12):2086–2091. doi: 10.1111/j.1528-1167.2006.00828.x. 17201708 [DOI] [PubMed] [Google Scholar]
- van Dellen E. Long-term effects of temporal lobe epilepsy on local neural networks: a graph theoretical analysis of corticography recordings. PLOS ONE. 2009;4(11):e8081. doi: 10.1371/journal.pone.0008081. 19956634 [DOI] [PMC free article] [PubMed] [Google Scholar]
- van Dellen E. MEG network differences between low- and high-grade glioma related to epilepsy and cognition. PLOS ONE. 2012;7(11):e50122. doi: 10.1371/journal.pone.0050122. 23166829 [DOI] [PMC free article] [PubMed] [Google Scholar]
- van Diessen E., Diederen S.J.H. Functional and structural brain networks in epilepsy: what have we learned? Epilepsia. 2013;54(11):1855–1865. doi: 10.1111/epi.12350. 24032627 [DOI] [PubMed] [Google Scholar]
- van Diessen E., Otte W.M. Improved diagnosis in children with partial epilepsy using a multivariable prediction model based on EEG Network Characteristics. PLOS One. 2013;8(4):e59764. doi: 10.1371/journal.pone.0059764. 23565166 [DOI] [PMC free article] [PubMed] [Google Scholar]
- van Mieghem P. Graph Spectra for Complex Networks. Cambridge University Press; 2012. [Google Scholar]
- van Wijk B.C.M., Stam C.J., Daffertshofer A. Comparing brain networks of different size and connectivity density using graph theory. PLOS One. 2010;5(10):e13701. doi: 10.1371/journal.pone.0013701. 21060892 [DOI] [PMC free article] [PubMed] [Google Scholar]
- Vicente R. Dynamical relaying can yield zero time lag neuronal synchrony despite long conduction delays. Proc. Natl. Acad. Sci. U. S. A. 2008;105(44):17157–17162. doi: 10.1073/pnas.0809353105. 18957544 [DOI] [PMC free article] [PubMed] [Google Scholar]
- Viteri-Torres C. Tratado de Epilepsia. España; 2003. Epileptogénesis; pp. 47–69. [Google Scholar]
- Vollmar C. Altered microstructural connectivity in juvenile myoclonic epilepsy: the missing link. Neurology. 2012;78(20):1555–1559. doi: 10.1212/WNL.0b013e3182563b44. 22551729 [DOI] [PMC free article] [PubMed] [Google Scholar]
- Wilenius J. Interictal MEG reveals focal cortical dysplasias: special focus on patients with no visible MRI lesions. Epilepsy Res. 2013;105(3):337–348. doi: 10.1016/j.eplepsyres.2013.02.023. 23587673 [DOI] [PubMed] [Google Scholar]
- Wilke C., Worrell G., He B. Graph analysis of epileptogenic networks in human partial epilepsy. Epilepsia. 2011;52(1):84–93. doi: 10.1111/j.1528-1167.2010.02785.x. 21126244 [DOI] [PMC free article] [PubMed] [Google Scholar]
- Zhang Z. Altered functional-structural coupling of large-scale brain networks in idiopathic generalized epilepsy. Brain. 2011;134(10):2912–2928. doi: 10.1093/brain/awr223. 21975588 [DOI] [PubMed] [Google Scholar]
Associated Data
This section collects any data citations, data availability statements, or supplementary materials included in this article.
Supplementary Materials
Supplementary material.