Abstract
We present a procedure to test the effect of calibration priors on estimated times, which applies a recently developed calibration-free approach (RelTime) method that produces relative divergence times for all nodes in the tree. We illustrate this protocol by applying it to a timetree of metazoan diversification (Erwin DH, Laflamme M, Tweedt SM, Sperling EA, Pisani D, Peterson KJ. 2011. The Cambrian conundrum: early divergence and later ecological success in the early history of animals. Science 334:1091–1097.), which placed the divergence of animal phyla close to the time of the Cambrian explosion inferred from the fossil record. These analyses revealed that the two maximum-only calibration priors in the pre-Cambrian are the primary determinants of the young divergence times among animal phyla in this study. In fact, these two maximum-only calibrations produce divergence times that severely violate minimum boundaries of almost all of the other 22 calibration constraints. The use of these 22 calibrations produces dates for metazoan divergences that are hundreds of millions of years earlier in the Proterozoic. Our results encourage the use of calibration-free approaches to identify most influential calibration constraints and to evaluate their impact in order to achieve biologically robust interpretations.
Keywords: molecular clocks, animal divergence times, calibration points, RelTime, Cambrian explosion
Introduction
Traditionally placed at the beginning of the Cambrian period (∼541 Ma) based on the poor Precambrian fossil record, the divergence of a majority of animal phyla has been pushed back into the Proterozoic by many molecular dating studies (Wray et al. 1996; Feng et al. 1997; Turner and Young 2000; Otsuka and Sugaya 2003; Hedges et al. 2004; Blair and Hedges 2005a; Berney and Pawlowski 2006; Parfrey et al. 2011). These results have led to a longstanding debate between the relative merits of the use of fossil record and molecular data for establishing divergence times (Cartwright and Collins 2007; Donoghue and Benton 2007; Hug and Roger 2007; Budd 2008; Ho and Phillips 2009; Inoue et al. 2010; Quental and Marshall 2010; Dornburg et al. 2011; Morlon et al. 2011; Parfrey et al. 2011; Parham et al. 2012; Warnock et al. 2012; Wheat and Wahlberg 2013a).
Contributing to this debate are results from many other molecular studies that have placed the divergence of animal phyla at the beginning of the Cambrian period, which are attractive because they close the gap between the dates from molecular data and the fossil data (Doolittle et al. 1996; Bromham et al. 1999; Aris-Brosou and Yang 2002; Aris-Brosou and Yang 2003; Douzery et al. 2004; Peterson et al. 2004, 2008; Peterson and Butterfield 2005; Cartwright and Collins 2007; Erwin et al. 2011; Gueidan et al. 2011; Sperling et al. 2013; Wheat and Wahlberg 2013b). Efforts to investigate discrepancies among timelines have included analyses with increased numbers of species and genes as well as systematic evaluation of the parameters and assumptions made in molecular data analysis. Following this trend to generate better and more reliable estimates of divergence times among animal phyla, Erwin et al. (2011) carried out an extensive analysis of a multigene alignment (2,049 amino acids) from members of all major phyla using 24 calibrations with many minimum-only (12), minimum–maximum (10), and maximum-only (2) constraints. Their analyses placed the divergence of animal phyla close to the time of the Cambrian explosion of animal form as observed in the fossil record, which is different from many previous and recent timetree studies (e.g., Blair and Hedges 2005a, 2005b; Hug and Roger 2007; Blair 2009; Parfrey et al. 2011; Wheat and Wahlberg 2013b).
There is, however, growing evidence that calibration priors can severely alter estimated timelines and that accuracy of time estimation analyses can be improved by a comprehensive evaluation of the effect of calibrations. This is true even in the presence of large amounts of molecular sequence data that cannot offset the effects of assumed priors, including the stringent maximum-only boundaries and root priors (Ho and Phillips 2009; Inoue et al. 2010; Warnock et al. 2012, 2015). So, we developed and employed a protocol to directly assess the robustness of the results obtained by Erwin et al. In this protocol, the effect of calibration constraints on the time estimates are evaluated by comparing the absolute divergence time estimated using any method (e.g., Bayesian) with the relative divergence times obtained without incorporating any calibration constraints by using the RelTime method (Tamura et al. 2012). Analysis of synthetic and actual sequence data has previously shown that RelTime produces accurate relative timelines, without requiring calibration constraints and assumptions about the models of substitution rate changes among lineages (Tamura et al. 2012; Filipski et al. 2014). These relative timelines can be used as an independent framework for hypothesis testing of the effects of all calibrations together and reveal the most influential calibrations. This is because, if priors on calibrations do not significantly constrain the posterior estimates (with all other parameters kept the same), the relative times from the RelTime method are expected to be linearly related with the absolute divergence times obtained by a calibration-dependent molecular clock approach, for example, those times reported by Erwin et al. (2011). However, if the linear relationship is significantly disturbed for one or more nodes in the timetree, then the juxtaposition of the relative times with the calibration boundaries applied would enable the discovery of calibrations responsible for the observed discrepancy. Such a result would identify, in a single analysis, all calibrations that are the primary force driving the resulting timeline and that, therefore, require further scrutiny to assess their reliability. Our procedure is fundamentally different from approaches that use different permutations or jackknifing of calibration constraints to produce multiple nonindependent timelines, which confound the final comparison and diagnosis. For example, Erwin et al. (2011) used a jackknife approach and report consistent divergence times. However, consistency of time estimates based on such permutations is not sufficient due to their nonindependence owing to sharing of a large number of calibration constraints.
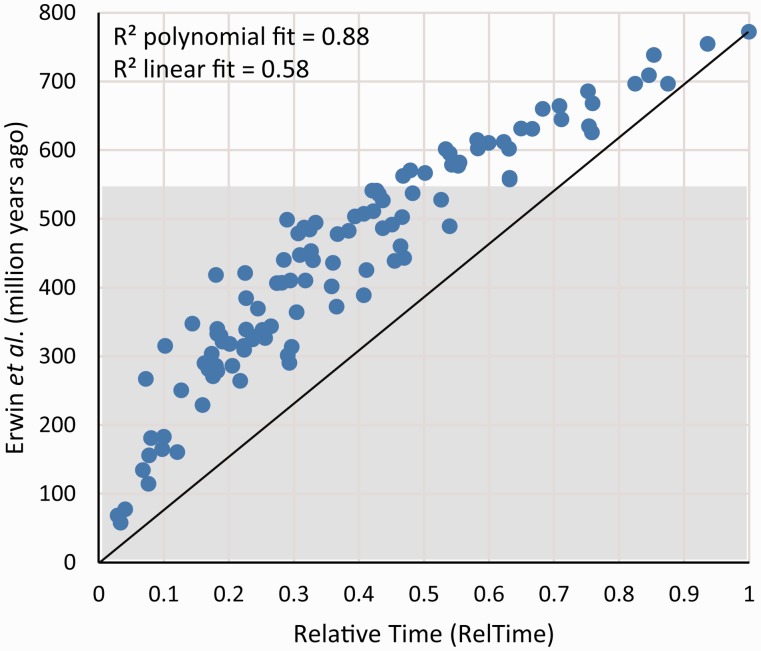
In our approach, the first step is to compare the absolute times (obtained by using all the calibration constraints) with the relative times obtained using the RelTime method. Figure 1 shows the relationship between the RelTime estimates (x axis) and the absolute time estimates (y axis) reported by Erwin et al. (2011), who used the Phylobayes (Pb) software (Lartillot et al. 2009). Overall, there is an excellent correlation between the RelTime and Pb estimates, but the trend is not linear. A polynomial provides a better fit (R2 = 0.88) than a linear trend (R2 = 0.58). Therefore, unlike Erwin et al.’s jackknifing procedure, our approach is able to immediately show that calibration constraints used in this study had significant impact on the final time estimates such that they produced a significant plateauing (compression) of almost all the divergences in the pre-Cambrian.
Fig. 1.
Relationship of divergence times from Erwin et al. (2011) with relative times from RelTime (normalized to 1). Erwin’s et al. values are shown in millions of years. R2 values for the polynomial and linear fit are shown. The black line connects the maximum and minimum values on the scatter graph and highlights the plateauing effect that exists at higher divergence times. Gray-shaded area represents time after the Cambrian explosion.
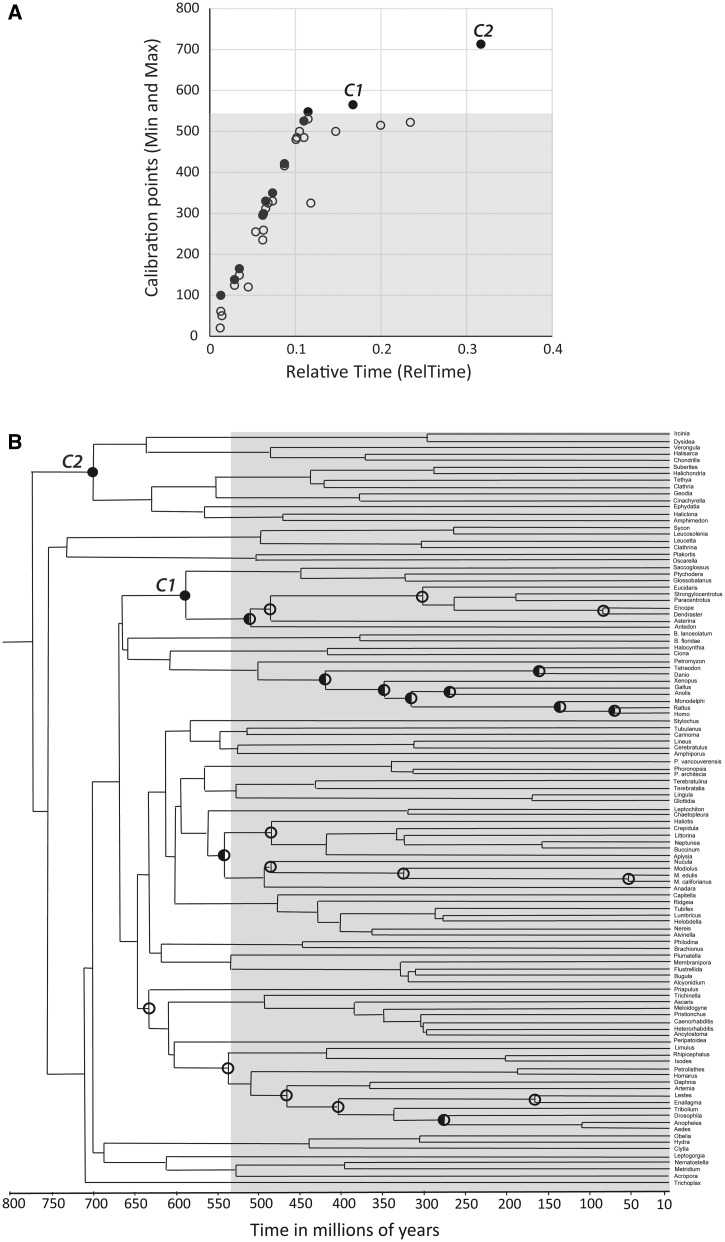
In the second step, we explore the relationship of relative time estimates of the nodes with the 24 calibration boundaries in order to reveal nodes where the two estimates show differences, if any. For Erwin et al.’s data, figure 2 shows this relationship for minimum boundaries (empty circles) and for maximum boundaries (closed circles) for all 24 constraints. RelTime estimates correlate well with the minimum and/or maximum boundaries for nodes younger than the Cambrian boundary (fig. 2A, shaded area). However, two calibrations with maximum-only boundaries in the late Proterozoic deviate significantly from the overall trend (565 and 713 Ma; C1 and C2 in fig. 2). It is already well known that the maximum bounds can strongly constrain nodes in relaxed clock analyses even when using large amounts of molecular sequence data (Blair and Hedges 2005a; Ho and Phillips 2009; Inoue et al. 2010; Warnock et al. 2012). This constraining effect predicts that the placement of deep calibration maxima close to the Cambrian boundary may preclude a priori the possibility of other deep inter-phyla nodes being older than the specified maximum boundaries. A similar effect will be caused by the use of a young maximum root node time, which was set to 1,000 Ma by Erwin et al. despite the fact that the root of the tree of animals has been dated to be up to 50% older in many molecular studies using classical and relaxed clock methods (Nei et al. 2001; Otsuka and Sugaya 2003; Hedges et al. 2004; Blair and Hedges 2005b; Parfrey et al. 2011). Therefore, a large standard deviation around 1,000 Ma needs to be used to avoid placing an unduly restricted root constraint in Bayesian analyses.
Fig. 2.
Calibration boundaries used by Erwin’s et al. (2011). (A) Relation between minimum (empty circles) and maximum (filled circles) boundaries with RelTime estimates. Pre-Cambrian maximum-only calibration boundaries are marked as C1 and C2. (B) Timetree from Erwin et al. with marked calibration boundaries. Maximum-only: filled circles; minimum-only: empty circles; minimum-maximum: half full circles. Gray shaded area shows the time after the Cambrian explosion at 541 Ma.
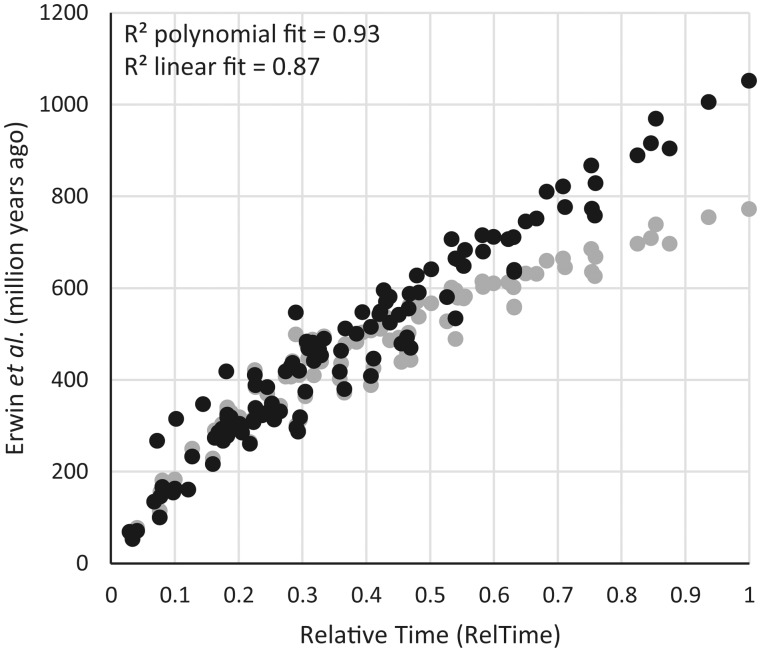
So, in the third step, we evaluated the constraining effect of the two maximum-only calibrations by using all other 22 calibration points from Erwin et al. (i.e., applied 90% of their calibrations as is) in a Pb reanalysis, where the root node was allowed to be more flexible by increasing the standard deviation associated with its boundary (see Materials and Methods). In this way, we could examine if the divergence times are robust to the two calibration assumptions and the root prior. The posterior time estimates changed dramatically with much deeper inter-phyla divergence times produced by the application of the Pb software used by Erwin et al. (fig. 3). The new estimates showed excellent linearity with the RelTime estimates for within-phyla and inter-phyla divergence times (R2 = 0.87).
Fig. 3.
Comparisons of divergence times from RelTime and Erwin et al. (2011) using the original 24 calibrations (gray circles) and a reanalysis without the two maximum-only boundaries and a relaxed root prior (black circles). R2 values for the polynomial and linear fit of the reanalysis are shown.
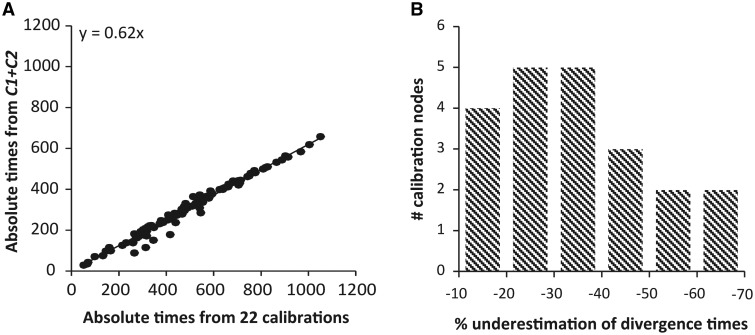
In the fourth step, we verified if the identified constraining calibrations (C1 and C2 in the current case) produce time estimates that are consistent with those produced by the use of the other calibrations (22 calibrations). To do this, we conducted Pb analyses using only the two maximum-only calibrations (C1 and C2) and compared them with those obtained using the remaining 22 calibrations (fig. 4A). The divergence times obtained from C1 and C2 were approximately 40% lower (younger). We found that C1 maximum primarily impacts time estimates within its clade due to its nesting in the phylogeny, but C2 maximum severely impacted inter-phyla divergence times in its sister clade. These analyses confirm that two maximum-only constraints are the primary determinant of Erwin et al.’s conclusions, as these two Precambrian constraints produce time estimates that are very different from those obtained using a vast majority of other calibrations (22 out of 24).
Fig. 4.
Estimates and comparison of divergence times obtained using the maximum-calibrations only (C1 and C2). (A) Comparison of times from C1 + C2 with times obtained using the other 22 calibrations only. All times were estimated with Pb. The equation for the linear trendline through the origin is shown (fit of a linear trend through the origin and with an allowance for intercept was statistically indistinguishable). Altering the strictness of the root node age (see Materials and Methods) did not have a significant effect on the estimated times. (B) The degree of violation of the minimum time required expressed as a percent difference from the minimum time is shown. The minimum requirement was satisfied for only one node.
As a final step, we can test if the identified calibrations (C1 and C2 in the current case) are consistent with the other ones (22 calibrations). This is different from traditional cross-validation procedures because we are testing a specific hypothesis rather than using Near et al. (Near and Sanderson 2004; Near et al. 2005) procedure to test each constraint one-by-one to find the offending calibrations. In the current case, if C1 and C2 maxima are too young, then they are predicted to produce estimates younger than the minimum boundaries for one or more of the other 22 calibrations. Indeed, time estimates of 21 out of 22 nodes with calibration minima were violated with an average underestimation of 31% (11% − 66%) (fig. 4B), which means that C1 and C2 are inconsistent with almost all other calibration boundaries.
In summary, our step-by-step procedure shows that Erwin et al.’s primary conclusion about the concordance between the fossil and molecular times are strongly dependent on the correctness of those two calibration maxima and the prior assumptions about the root age. Therefore, the metazoan timeline is not robust to calibration priors, which was not evident using previously available approaches applied by Erwin et al. (2011). We suggest that future timetree analyses utilize a multi-step approach similar to the one outlined above to analyze the impact of constraints before the time estimates are used to make biological interpretations.
Materials and Methods
A multigene alignment of 7 housekeeping proteins in 117 metazoa species and their evolutionary relationships were obtained from Erwin et al. (2011). In addition to the Pb program (Lartillot et al. 2009) employed by the original authors, we applied the RelTime method (Tamura et al. 2012). The RelTime estimates were compared to the Erwin et al. times obtained from their supplementary materials (DatabaseS2 file). Because this file only contained times for a subset of nodes, we followed Erwin et al. and used Pb on their data to obtain time estimates for the rest of the nodes. We used a 5% relaxation bounds threshold and a root node prior of 1,000 My with standard deviation of 100 My, as done by Erwin et al. These recalculated estimates were almost identical to those reported by Erwin et al. (0.54% difference). We also conducted additional Pb analyses using alternatively only the two maximum-only calibrations (C1: Dendraster/Saccoglossus at 565 Ma, and C2: Geodia/Verongula at 713 Ma; see fig. 2B) or only the remaining 22 calibrations, both of them with the required root node prior relaxed (1,000 My with a standard deviation of 1,000). Other parameters (relaxation bound and rate variation model) were kept as in Erwin et al. (5% and autocorrelated CIR, respectively). Trends of analyses using softer relaxation boundaries (20% and 50%) and an uncorrelated model did not differ significantly from those reported here. Unlike RelTime that took less than 15 min to complete, Pb analyses did not meet the suggested guidelines for convergence (maxdiff <0.3 and effective sample size >50) even after many weeks of calculations with two parallel chains and greater than 20,000 generation cycles. Still, we considered the posterior estimates to be final because of the similarity of our results with those from Erwin et al. and because the chains showed less than 1% difference when checked at different calculation time points.
Acknowledgments
The authors thank many reviewers for helpful comments on previous versions of this manuscript. This research was supported by the National Institute of Health (HG00296-12) and NSF (DBI 1356548) to S.K. and by Oakland University to F.U.B.
References
- Aris-Brosou S, Yang ZH. Effects of models of rate evolution on estimation of divergence dates with special reference to the metazoan 18S ribosomal RNA phylogeny. Syst Biol. 2002;51:703–714. doi: 10.1080/10635150290102375. [DOI] [PubMed] [Google Scholar]
- Aris-Brosou S, Yang ZH. Bayesian models of episodic evolution support a late precambrian explosive diversification of the metazoa. Mol Biol Evol. 2003;20:1947–1954. doi: 10.1093/molbev/msg226. [DOI] [PubMed] [Google Scholar]
- Berney C, Pawlowski J. A molecular time-scale for eukaryote evolution recalibrated with the continuous microfossil record. Proc Biol Sci. 2006;273:1867–1872. doi: 10.1098/rspb.2006.3537. [DOI] [PMC free article] [PubMed] [Google Scholar]
- Blair JE. Animals (metazoa) In: Hedges SB, Kumar S, editors. The timetree of life. New York: Oxford University Press; 2009. [Google Scholar]
- Blair JE, Hedges SB. Molecular clocks do not support the Cambrian explosion. Mol Biol Evol. 2005a;22:387–390. doi: 10.1093/molbev/msi039. [DOI] [PubMed] [Google Scholar]
- Blair JE, Hedges SB. Molecular phylogeny and divergence times of deuterostome animals. Mol Biol Evol. 2005b;22:2275–2284. doi: 10.1093/molbev/msi225. [DOI] [PubMed] [Google Scholar]
- Bromham L, Phillips MJ, Penny D. Growing up with dinosaurs: molecular dates and the mammalian radiation. Trends Ecol Evol. 1999;14:113–118. doi: 10.1016/s0169-5347(98)01507-9. [DOI] [PubMed] [Google Scholar]
- Budd GE. The earliest fossil record of the animals and its significance. Philos Trans R Soc Lond B Biol Sci. 2008;363:1425–1434. doi: 10.1098/rstb.2007.2232. [DOI] [PMC free article] [PubMed] [Google Scholar]
- Cartwright P, Collins A. Fossils and phylogenies: integrating multiple lines of evidence to investigate the origin of early major metazoan lineages. Integr Comp Biol. 2007;47:744–751. doi: 10.1093/icb/icm071. [DOI] [PubMed] [Google Scholar]
- Donoghue PCJ, Benton MJ. Rocks and clocks: calibrating the tree of life using fossils and molecules. Trends Ecol Evol. 2007;22:424–431. doi: 10.1016/j.tree.2007.05.005. [DOI] [PubMed] [Google Scholar]
- Doolittle RF, Feng DF, Tsang S, Cho G, Little E. Determining divergence times of the major kingdoms of living organisms with a protein clock. Science. 1996;271:470–477. doi: 10.1126/science.271.5248.470. [DOI] [PubMed] [Google Scholar]
- Dornburg A, Beaulieu JM, Oliver JC, Near TJ. Integrating fossil preservation biases in the selection of calibrations for molecular divergence time estimation. Syst Biol. 2011;60:519–527. doi: 10.1093/sysbio/syr019. [DOI] [PubMed] [Google Scholar]
- Douzery EJP, Snell EA, Bapteste E, Delsuc F, Philippe H. The timing of eukaryotic evolution: does a relaxed molecular clock reconcile proteins and fossils? Proc Natl Acad Sci U S A. 2004;101:15386–15391. doi: 10.1073/pnas.0403984101. [DOI] [PMC free article] [PubMed] [Google Scholar]
- Erwin DH, Laflamme M, Tweedt SM, Sperling EA, Pisani D, Peterson KJ. The Cambrian conundrum: early divergence and later ecological success in the early history of animals. Science. 2011;334:1091–1097. doi: 10.1126/science.1206375. [DOI] [PubMed] [Google Scholar]
- Feng D-F, Cho G, Doolittle RF. Determining divergence times with a protein clock: update and reevaluation. Proc Natl Acad Sci U S A. 1997;94:13028–13033. doi: 10.1073/pnas.94.24.13028. [DOI] [PMC free article] [PubMed] [Google Scholar]
- Filipski A, Murillo O, Freydenzon A, Tamura K, Kumar S. Prospects for building large timetrees using molecular data with incomplete gene coverage among species. Mol Biol Evol. 2014;31:2542–2550. doi: 10.1093/molbev/msu200. [DOI] [PMC free article] [PubMed] [Google Scholar]
- Gueidan C, Ruibal C, de Hoog GS, Schneider H. Rock-inhabiting fungi originated during periods of dry climate in the late Devonian and middle Triassic. Fungal Biol. 2011;115:987–996. doi: 10.1016/j.funbio.2011.04.002. [DOI] [PubMed] [Google Scholar]
- Hedges SB, Blair JE, Venturi ML, Shoe JL. A molecular timescale of eukaryote evolution and the rise of complex multicellular life. BMC Evol Biol. 2004;4:2. doi: 10.1186/1471-2148-4-2. [DOI] [PMC free article] [PubMed] [Google Scholar]
- Ho SYW, Phillips MJ. Accounting for calibration uncertainty in phylogenetic estimation of evolutionary divergence times. Syst Biol. 2009;58:367–380. doi: 10.1093/sysbio/syp035. [DOI] [PubMed] [Google Scholar]
- Hug LA, Roger AJ. The impact of fossils and taxon sampling on ancient molecular dating analyses. Mol Biol Evol. 2007;24:1889–1897. doi: 10.1093/molbev/msm115. [DOI] [PubMed] [Google Scholar]
- Inoue J, Donoghue PCJ, Yang Z. The impact of representation of fossil calibrations on Bayesian estimation of species divergence times. Syst Biol. 2010;59:74–89. doi: 10.1093/sysbio/syp078. [DOI] [PubMed] [Google Scholar]
- Lartillot N, Lepage T, Blanquart S. PhyloBayes 3: a Bayesian software package for phylogenetic reconstruction and molecular dating. Bioinformatics. 2009;25:2286–2288. doi: 10.1093/bioinformatics/btp368. [DOI] [PubMed] [Google Scholar]
- Morlon H, Parsons TL, Plotkin JB. Reconciling molecular phylogenies with the fossil record. Proc Natl Acad Sci U S A. 2011;108: 16327–16332. doi: 10.1073/pnas.1102543108. [DOI] [PMC free article] [PubMed] [Google Scholar]
- Near TJ, Meylan PA, Shaffer HB. Assessing concordance of fossil calibration points in molecular clock studies: an example using turtles. Am Nat. 2005;165:137–146. doi: 10.1086/427734. [DOI] [PubMed] [Google Scholar]
- Near TJ, Sanderson MJ. Assessing the quality of molecular divergence time estimates by fossil calibrations and fossil-based model selection. Philos Trans R Soc Lond B Biol Sci. 2004;359:1477–1483. doi: 10.1098/rstb.2004.1523. [DOI] [PMC free article] [PubMed] [Google Scholar]
- Nei M, Xu P, Glazko G. Estimation of divergence times from multiprotein sequences for a few mammalian species and several distantly related organisms. Proc Natl Acad Sci U S A. 2001;98:2497–2502. doi: 10.1073/pnas.051611498. [DOI] [PMC free article] [PubMed] [Google Scholar]
- Otsuka J, Sugaya N. Advanced formulation of base pair changes in the stem regions of ribosomal RNAs; its application to mitochondrial rRNAs for resolving the phylogeny of animals. J Theor Biol. 2003;222:447–460. doi: 10.1016/s0022-5193(03)00057-2. [DOI] [PubMed] [Google Scholar]
- Parfrey LW, Lahr DJG, Knoll AH, Katz LA. Estimating the timing of early eukaryotic diversification with multigene molecular clocks. Proc Natl Acad Sci U S A. 2011;108:13624–13629. doi: 10.1073/pnas.1110633108. [DOI] [PMC free article] [PubMed] [Google Scholar]
- Parham JF, Donoghue PCJ, Bell CJ, Calway TD, Head JJ, Holroyd PA, Inoue JG, Irmis RB, Joyce WG, Ksepka DT, et al. Best practices for justifying fossil calibrations. Syst Biol. 2012;61:346–359. doi: 10.1093/sysbio/syr107. [DOI] [PMC free article] [PubMed] [Google Scholar]
- Peterson KJ, Butterfield NJ. Origin of the Eumetazoa: testing ecological predictions of molecular clocks against the Proterozoic fossil record. Proc Natl Acad Sci U S A. 2005;102:9547–9552. doi: 10.1073/pnas.0503660102. [DOI] [PMC free article] [PubMed] [Google Scholar]
- Peterson KJ, Cotton JA, Gehling JG, Pisani D. The Ediacaran emergence of bilaterians: congruence between the genetic and the geological fossil records. Philos Trans R Soc Lond B Biol Sci. 2008;363:1435–1443. doi: 10.1098/rstb.2007.2233. [DOI] [PMC free article] [PubMed] [Google Scholar]
- Peterson KJ, Lyons JB, Nowak KS, Takacs CM, Wargo MJ, McPeek MA. Estimating metazoan divergence times with a molecular clock. Proc Natl Acad Sci U S A. 2004;101:6536–6541. doi: 10.1073/pnas.0401670101. [DOI] [PMC free article] [PubMed] [Google Scholar]
- Quental TB, Marshall CR. Diversity dynamics: molecular phylogenies need the fossil record. Trends Ecol Evol. 2010;25:434–441. doi: 10.1016/j.tree.2010.05.002. [DOI] [PubMed] [Google Scholar]
- Sperling EA, Frieder CA, Raman AV, Girguis PR, Levin LA, Knoll AH. Oxygen, ecology, and the Cambrian radiation of animals. Proc Natl Acad Sci U S A. 2013;110:13446–13451. doi: 10.1073/pnas.1312778110. [DOI] [PMC free article] [PubMed] [Google Scholar]
- Tamura K, Battistuzzi FU, Billing-Ross P, Murillo O, Filipski A, Kumar S. Estimating divergence times in large molecular phylogenies. Proc Natl Acad Sci U S A. 2012;109:19333–19338. doi: 10.1073/pnas.1213199109. [DOI] [PMC free article] [PubMed] [Google Scholar]
- Turner SL, Young JPW. The glutamine synthetases of rhizobia: phylogenetics and evolutionary implications. Mol Biol Evol. 2000;17:309–319. doi: 10.1093/oxfordjournals.molbev.a026311. [DOI] [PubMed] [Google Scholar]
- Warnock RCM, Parham JF, Joyce WG, Lyson TR, Donoghue PCJ. Calibration uncertainty in molecular dating analyses: there is no substitute for the prior evaluation of time priors. Proc R Soc B Biol Sci. 2015;282:20141013. doi: 10.1098/rspb.2014.1013. [DOI] [PMC free article] [PubMed] [Google Scholar]
- Warnock RCM, Yang Z, Donoghue PCJ. Exploring uncertainty in the calibration of the molecular clock. Biol. Lett. 2012;8:156–159. doi: 10.1098/rsbl.2011.0710. [DOI] [PMC free article] [PubMed] [Google Scholar]
- Wheat CW, Wahlberg N. Critiquing blind dating: the dangers of over-confident date estimates in comparative genomics. Trends Ecol Evol. 2013a;28:636–642. doi: 10.1016/j.tree.2013.07.007. [DOI] [PubMed] [Google Scholar]
- Wheat CW, Wahlberg N. Phylogenomic insights into the cambrian explosion, the colonization of land and the evolution of flight in arthropoda. Syst Biol. 2013b;62:93–109. doi: 10.1093/sysbio/sys074. [DOI] [PubMed] [Google Scholar]
- Wray GA, Levinton JS, Shapiro LH. Molecular evidence for deep precambrian divergences among metazoan phyla. Science. 1996;274:568–573. [Google Scholar]


