Abstract
Background
Carbon monoxide poisoning is a significant problem in most countries, and a reliable method of quick diagnosis would greatly improve patient care. Until the recent introduction of a multi-wavelength “pulse CO-oximeter” (Masimo Rainbow SET® Radical-7), carboxyhemoglobin (COHb) levels in blood required blood sampling and laboratory analysis. The purpose of this study was to determine if hypoxemia, which can accompany carbon monoxide poisoning, interferes with the accurate detection of COHb.
Methods
Twelve healthy non-smoking adult volunteers were fitted with 2 standard pulse oximeter finger probes and 2 Rainbow probes for COHb detection. A radial arterial catheter was placed for blood sampling during three interventions: 1) increasing hypoxemia in incremental steps with oxygen saturations (SaO2) of 100-80%; 2) normoxia with incremental increases in %COHb to 12%; and 3) elevated COHb combined with hypoxemia with SaO2 of 100-80%. Pulse oximeter readings (SpCO) were compared with simultaneous arterial blood values at the various increments of hypoxemia and carboxyhemoglobinemia (≈25 samples per subject). Pulse CO-oximeter performance was analyzed by calculating the mean bias (SpCO – %COHb), standard deviation of the bias (precision), and the root mean square error (Arms).
Results
The Radical 7 accurately detected hypoxemia with both normal and elevated levels of COHb (bias mean ± SD: 0.44 ± 1.69% at %COHb < 4%, and −0.29 ± 1.64% at %COHb ≥ 4%, P < 0.0001, and Arms 1.74% vs. 1.67%). COHb was accurately detected during normoxia and moderate hypoxia (bias mean ± SD: −0.98 ± 2.6 at SaO2 ≥ 95%, and −0.7 ± 4.0 at SaO2 < 95%, P = 0.60, and Arms 2.8% vs. 4.0%), but when SaO2 fell below ~85%, the pulse CO-oximeter always gave low signal quality errors and did not report SpCO values.
Conclusions
In healthy volunteers, the Radical 7 pulse CO-oximeter accurately detects hypoxemia with both low and elevated COHb levels, and accurately detects carboxyhemoglobin, but only reads SpCO when SaO2 is greater than about 85%.
Introduction
Carbon monoxide (CO) is a leading cause of unintentional poisoning deaths in the United States. Accidental, non-fire-related CO poisoning is responsible for approximately 15,000 emergency department visits and nearly 500 deaths annually,1 with as many as 50,000 total emergency department visits for all causes of CO poisoning.2 Until the introduction of pulse CO-oximetry (e.g. Masimo Rainbow® pulse oximeters), the detection of CO poisoning required laboratory analysis of a blood sample. Therefore, significant CO poisoning can be missed if not suspected3–5, with diagnosis and treatment delayed while awaiting laboratory measurement.3 Standard pulse oximetry (SpO2) does not detect carboxyhemoglobin (COHb), and SpO2 readings may remain within normal ranges in spite of severely decreased oxygen carrying capacity, dropping only at very high COHb levels.6
The Masimo Rainbow SET® Radical 7 Pulse CO-Oximeter (Masimo Corp, Irvine CA) uses 7 wavelengths of light, to measure levels of both methemoglobin (SpMet) and carboxyhemoglobin (SpCO). In a prior study on healthy volunteers, an early version of the Radical 7 oximeter yielded inaccurate results when hypoxemia was combined with elevated methemoglobin (MetHb), producing errors in both MetHb accuracy and false indications of highly elevated COHb levels.7 The errors in MetHb detection during hypoxia were subsequently corrected.8
Studies on healthy volunteers have demonstrated acceptable accuracy of the Masimo pulse CO-oximeter for detecting COHb during normoxia9,10, although observations in patients revealed limits of agreement exceeding 10%.11–13 To date, no study has examined the effect of hypoxia on COHb measurements with pulse CO-oximetry. Since hypoxemia may occur simultaneously with carbon monoxide poisoning, particularly in fires with smoke inhalation,14 this issue is clinically important. Currently, the United States Food and Drug Administration (FDA) does not have standards of accuracy for detection of elevated COHb during simultaneous hypoxemia, although the current device is approved clinically for continuous noninvasive monitoring of SpO2, SpCO and SpMet. Therefore, we studied the accuracy of Masimo pulse CO-oximeter detection of COHb during both normoxia and during hypoxemia.
Methods
The University of California at San Francisco Committee on Human Research approved the study, and all subjects gave informed written consent. The pool of subjects were healthy non-smoking men and women, from 18 to 49 years of age, willing to volunteer for the study for a nominal payment. The selected group of subjects was gender and ethnically balanced, following the United States Food and Drug Administration (FDA) requirements for standard studies of pulse oximeter accuracy. The final group included 12 healthy adult subjects, 7 men and 5 women, with a range of skin pigmentation (Table 1). The study size was based on prior studies,7,8,15,16 and the size of standard studies of pulse oximeter accuracy for the FDA.
Table 1.
Demographic data.
| Subject | Sex | Age (Years) | Skin | Ethnicity | SpCO Bias | SpMet Bias | Perfusion Index |
|---|---|---|---|---|---|---|---|
| Subject #1 | M | 28 | Light | Caucasian | −0.4 ± 2.0 (23) | −0.2 ± 0.4 (51) | 5.0 |
| Subject #2 | M | 26 | Dark | African American | −3.1 ± 1.2 (22) | 0.1 ± 0.4 (44) | 6.4 |
| Subject #3 | F | 22 | Light | Caucasian | 3.4 ± 1.7 (22) | 0.2 ± 0.5 (50) | 3.2 |
| Subject #4 | F | 22 | Light | Caucasian | −2.9 ± 4.0 (24) | 0.0 ± 0.5 (49) | 1.1 |
| Subject #5 | M | 28 | Medium | Asian/Caucasian | −1.0 ± 2.3 (25) | −0.3 ± 0.2 (50) | 2.6 |
| Subject #6 | F | 22 | Light | Caucasian | −3.3 ± 1.6 (26) | 0.0 ± 0.4 (50) | 0.5 |
| Subject #7 | M | 23 | Medium | Caucasian | 2.1 ± 3.9 (16) | −0.2 ± 0.4 (48) | 7.1 |
| Subject #8 | M | 31 | Medium | Hispanic | 1.1 ± 2.6 (25) | −0.5 ± 0.5 (47) | 3.8 |
| Subject #9 | M | 26 | Light/medium | Caucasian | 1.9 ± 2.1 (30) | −0.3 ± 0.6 (52) | 6.9 |
| Subject #10 | M | 26 | Light/medium | Caucasian | −2.4 ± 2.9 (19) | −0.2 ± 0.6 (50) | 6.5 |
| Subject #11 | F | 19 | Dark | African American/Caucasian | 1.3 ± 3.0 (32) | 0.1 ± 0.4 (41) | 2.0 |
| Subject #12 | F | 28 | Dark | Indian | −2.0 ± 2.6 (19) | 0.2 ± 0.4 (29) | 1.7 |
M = Male, F = Female; SpCO, percent carboxyhemoglobin measured by the Masimo pulse CO-oximeter; SpCO bias, SpCO - measured arterial carboxyhemoglobin; SpMet, percent methemoglobin measured by the Masimo pulse CO-oximeter; SpMet Bias, SpMet - measured arterial methemoglobin; bias displayed as mean ± SD (n); perfusion index is a mean of 4 devices over all data points.
Oximeter probes and instruments were supplied by Masimo, Inc. (Irvine, CA). Rainbow DCI Sensor System oximeter probes (reusable, clip-on probes), Revision H, were used to measure carboxyhemoglobin (SpCO) and oxygen saturation (SpO2). The standard Masimo oximeter probes were the “red DCI” type. Both probe types were connected to Radical-7 oximeters (SET software version 7.6.2.1). One probe of each type was placed on the middle and ring fingers of each hand of each subject. The probe locations were randomized for each subject. The probes were covered with black plastic to shield them from ambient light and prevent interference from other oximeter probes. Both forearms and hands were kept warm with electric heating pads. The oximeter box and probe combination were kept together and considered as a single “device”.
A 22-gauge radial arterial cannula was placed in either the left or right wrist of each subject. Arterial blood was analyzed with a multi-wavelength optical blood analyzer (ABL800 FLEX, Radiometer Medical A/S, Copenhagen, Denmark) to determine arterial oxygen saturation (SaO2), carboxyhemoglobin concentration (%COHb), and methemoglobin concentration (%MetHb).
Studies on each subject began with one arterial blood sample drawn while breathing room air. Hypoxemia was then induced to 4–5 different targeted plateaus from 100-80% by having subjects breathe mixtures of nitrogen, air, and carbon dioxide according to a protocol previously detailed.16 Oxygen saturation is calculated from end-tidal PO2 and CO2 breath-by-breath, which guides the gas mixtures, since pulse oximeter values lag behind. Each saturation plateau level was maintained for at least 60 seconds with pulse oximeter stabilization, then two arterial blood samples were obtained approximately 30 seconds apart. After the final SaO2 plateau, the subject received 100% O2 and then returned to breathing room air. Elevated COHb was induced by breathing carbon monoxide gas to produce a target %COHb level of ≈10–12% based on Barker’s volunteer study9 and accumulated experience in volunteers in our laboratory. To do this, carbon monoxide (15–30 mL) was added to a 1-liter bag prefilled with approximately 500 mL of oxygen. Subjects then briefly rebreathed this mixture from a mouthpiece, allowing us to produce approximately 2% step-wise changes in %COHb. Blood samples were obtained 5 minutes after each administration of carbon monoxide. When %COHb reached target levels (10–12%) hypoxemia was induced in steps and blood samples taken using the prior protocol. Data output from the oximeters were recorded at 1 Hz using custom software developed with LabVIEW 2009 (National Instruments, Austin, TX).
Statistics
No current FDA standard of accuracy exists for SpCO. We did not establish acceptable limits of agreement ahead of time. For SpO2, Arms < 3% is the acceptable accuracy standard established by the FDA. We considered that the SpO2 accuracy would be degraded if elevated %COHb increased Arms to over 3%. Arms < 3% would certainly represent acceptably accurate performance for determining SpCO, although it may not be reasonable to expect the same accuracy and precision as for determining SpO2.
Pulse Oximeter performance was analyzed by calculating mean bias (SpO2-SaO2 or SpCO-%COHb), precision (standard deviation of the bias) and root-mean square error (Arms) over different ranges of %COHb and SaO2. The Shapiro-Wilk test was used to confirm the normality of the distribution of the SpCO bias (individual and pooled devices all > 0.07). Bias was compared with ANOVA and Tukey-Kramer honest significant difference was used for any multiple comparison testing. A 2-sided F-test compared the variances for SpCO bias at SaO2 < 95% or ≥ 95%.
Bias was plotted against %COHb, which was treated as a gold standard. Limits of agreement were calculated according to Bland and Altman with adjustments for multiple measurement for each individual.17 Bias, precision and Arms were determined and analyzed separately for both SpO2 and SpMet.
To examine the effects of other variables on bias, a mixed-effects model was used to analyze within-subjects factors (SaO2 or %COHb) and between-subjects factors (gender and skin color). The effects of SaO2 and %COHb were examined by both univariate analysis, and with both variables, either as an ANOVA (5% SaO2 range intervals) or as linear regression.
SpCO performance was also analyzed by observing the incidence of excessive reading bias at the various levels of SaO2. Sensitivity, specificity, positive and negative predictive values for detecting COHb were calculated from the observed data using different cutoff values. Receiver-operator characteristics were analyzed by setting %COHb ≥ 10% and ≥ 5% as positive tests. The distribution of true and false positives and negatives in different SaO2 ranges was tested with Chi Square.
Data are reported as mean ± SD or mean (95% confidence interval [CI]) as indicated. For all statistical tests, P < 0.05 was considered significant. Data were analyzed with JMP 10.0 (SAS Institute, Cary, NC) and Prism 6.0 (GraphPad Software, La Jolla, CA).
Results
Demographics
Demographic data and summary information for each individual’s instrument reading bias and perfusion index is provided in Table 1.
Accuracy of detecting hypoxemia
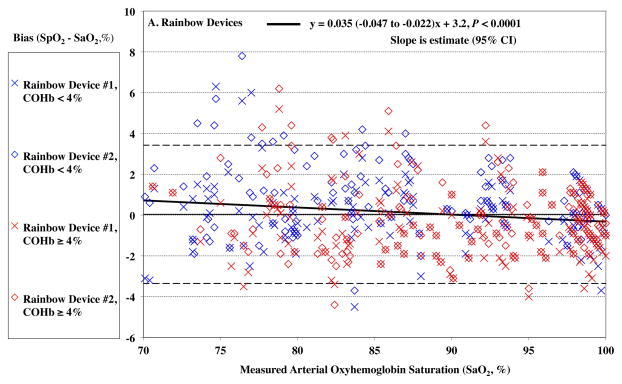
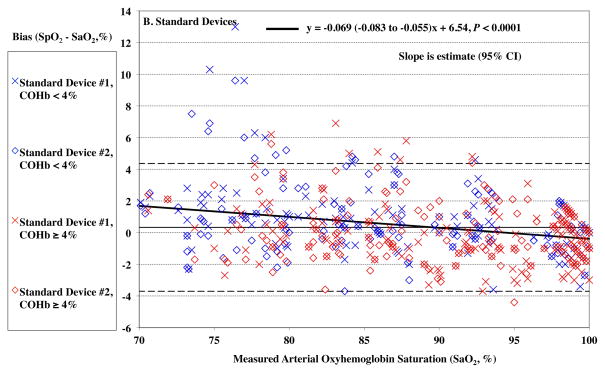
The devices read higher values of SpO2 at lower SaO2 (P < 0.0001), as demonstrated by a positive bias in SpO2 reading. This effect was small, 0.04% for each 1% of desaturation for the Rainbow oximeters (Figure 1A). For the standard pulse oximeters, the bias also increased with desaturation, 0.07% for each 1% change, P < 0.0001 (Figure 1B). The root mean square error (Arms) was 1.70% for the Rainbow oximeters, and 2.05% for the standard device for SaO2 70 – 100%.
Figure 1.
Pulse CO-oximeter SpO2 reading bias (SpO2 – arterial oxygen saturation [SaO2]) is plotted as a function of SaO2 as measured by arterial blood samples. “X’s” (“Device #1”) and open diamonds (“Device #2”) indicate readings from 2 oximeter devices monitoring simultaneously. The solid line shows the mean bias for both devices pooled together. The dashed lines are the upper and lower limits of agreement. Data for high %COHb (≥ 4%) are shown in red, while data for low %COHb (< 4%) are shown in blue. In panel A, SpO2 bias for the Rainbow probes was more positive at lower SaO2 (P < 0.0001). In Panel B, SpO2 bias for standard probes was also more positive at lower SaO2 (P < 0.0001). Regression lines and information are shown on the figures. Regressions for separate COHb ranges were similar (not shown).
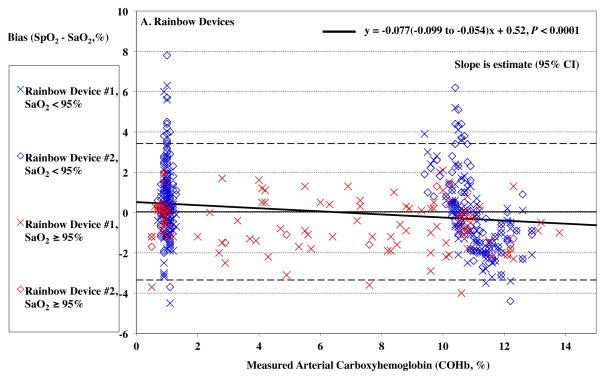
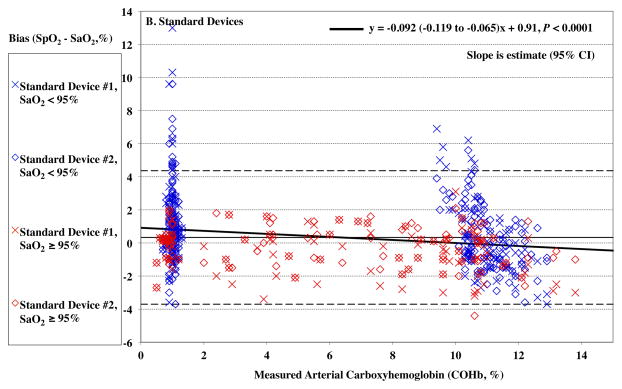
For the Rainbow probes, SpO2 bias at low saturation was also more positive at lower COHb levels (P < 0.0001, Figure 2A). For standard oximeter probes, SpO2 bias was also more positive at lower COHb levels, (P = <0.0001, Figure 2B). The Arms was 1.67% at elevated %COHb (≥4%) for the Rainbow devices and 1.79% for the standard devices.
Figure 2.
Pulse CO-oximeter SpO2 reading bias (SpO2 – arterial oxygen saturation [SaO2]) is plotted as a function of carboxyhemoglobin concentration (COHb) as measured by arterial blood gas analysis. “X’s” (“Device #1”) and open diamonds (“Device #2”) indicate readings from 2 oximeter devices monitoring simultaneously. The solid line shows the mean bias for both devices pooled together. The dashed lines are the upper and lower limits of agreement. Data for high SaO2 (≥ 95%) are shown in red, while data for low SaO2 (< 95%) are shown in blue. In panel A, carboxyhemoglobin had a small but statistically significant effect on SpO2 bias for Rainbow probes (P < 0.0001), with bias more positive at lower COHb. This was true at both low (< 95%, P < 0.0001) and high (≥ 95%, P <0.0001) SaO2. In panel B, SpO2 bias for standard probes was also more positive at lower COHb (P < 0.0001). This was true at both low and high SaO2 (P < 0.0001 and P = 0.001). Regression lines and information are shown on the figure. Regressions for separate SaO2 ranges were similar (not shown).
Accuracy of detecting elevated carboxyhemoglobin during normoxia (room air breathing)
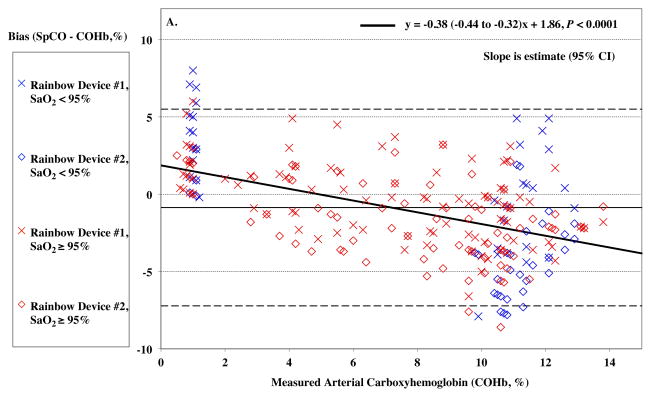
Higher COHb levels lead to an increasingly negative SpCO bias (P < 0.0001), shown in Figure 3A and summarized in Table 2.
Figure 3.
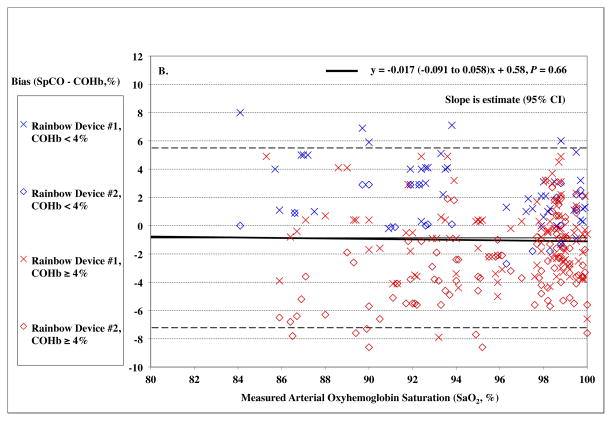
Pulse CO-oximeter SpCO bias (SpCO – percentage of carboxyhemoglobin in arterial blood [%COHb]) as a function of COHb (panel A) and oxygen saturation (SaO2) (panel B) as measured by arterial blood samples. “X’s” (“Device #1”) and open diamonds (“Device #2”) indicate readings from the 2 Rainbow devices monitoring simultaneously. The solid line shows the mean bias for both devices pooled together. The dashed lines are the upper and lower limits of agreement. In Panel A, SpCO bias demonstrates a statistically significant relationship with COHb (P < 0.0001), with more positive bias at low COHb. Data for high SaO2 (≥ 95%) are shown in red, while data for low SaO2 (< 95%) are shown in blue. These show a similar relationship. Panel B shows no statistically significant relationship between SpCO bias and SaO2 (P = 0.66). Data for high COHb (≥ 4%) are indicated in red and show a negative bias at low SaO2 (P = 0.0022), while data for low COHb (< 4%) are indicated in blue and show a positive bias at low SaO2 (P = 0.0019). Regression lines and information are shown on the figures.
Table 2.
SpCO Reading Summary with carboxyhemoglobin level
| %COHb Range | 0% – 15% | 0% – 5% | 5% – 10% | 10% – 15% |
|---|---|---|---|---|
| Device #1 | ||||
| n, paired observations | 154 | 57 | 32 | 65 |
| Mean Bias (%) | 0.3 | 2.3* | −0.9 | −0.7 |
| Precision (%) | 2.9 | 2.4 | 2.8 | 2.5 |
| Arms (%) | 2.9 | 3.3 | 2.9 | 2.6 |
| Limits of Agreement | −5.6 to 6.2 | −2.6 to 7.1 | −6.5 to 4.7 | −5.9 to 4.4 |
| |Bias| > 5% | 5.8% | 12.3% | 6.3% | 0.0% |
| Device #2 | ||||
| n, paired observations | 129 | 30 | 33 | 66 |
| Mean Bias (%) | −2.3† | 0.6 | −2.2 | −3.6 |
| Precision (%) | 2.9 | 1.9 | 2.5 | 2.5 |
| Arms (%) | 3.7 | 2.0 | 3.3 | 4.4 |
| Limits of Agreement | −8.2 to 3.6 | −3.6 to 4.7 | −7.3 to 2.9 | −8.7 to 1.4 |
| |Bias| > 5% | 20.9% | 0.0% | 12.1% | 34.8% |
| Pooled Devices | ||||
| n, paired observations | 283 | 87 | 65 | 131 |
| Mean Bias (%) | −0.9 | 1.7* | −1.5 | −2.2 |
| Precision (%) | 3.2 | 2.4 | 2.7 | 2.9 |
| Arms (%) | 3.3 | 2.9 | 3.1 | 3.6 |
| Limits of Agreement | −7.2 to 5.5 | −3.1 to 6.4 | −7.0 to 3.9 | −8.0 to 3.6 |
| |Bias| > 5% | 12.7% | 8.0% | 9.2% | 17.6% |
SpCO = percentage carboxyhemoglobin level (%COHb) as measured by the Masimo pulse CO-oximeter; SaO2 range = as measured by arterial blood values; mean bias = average of the bias (SpCO - %COHb) within the SaO2 range specified; precision = standard deviation of the bias; Arms = root-mean-square error; comparison of mean bias was by ANOVA with Tukey-Kramer honest significant difference for multiple comparisons; limits of agreement corrected for repeated measures.
Significantly different from all other levels.
All significantly different from each other
Individual mean bias is shown in Table 1. The range of individual bias was from −3.3 to +3.4. Skin color was not a significant predictor of SpCO bias for either device (Table 1).
Carboxyhemoglobin combined with hypoxia
Below SaO2 of 85%, both COHb devices reported low signal errors and read blank values for SpCO. At %COHb values near zero, the devices sometimes displayed blank SpCO readings, rather than zero. Details of missing values at various ranges of SaO2 and COHb values are shown in Table 3.
Table 3.
SpCO Missing Reading Summary
| COHb Range | SaO2 Range | ||||
|---|---|---|---|---|---|
| 75% – 80% | 80% – 85% | 85% – 95% | 95% – 100% | 75% – 100% | |
| 0% – 2% | 48/48 (100%) | 36/38 (94.7%) | 44/78 (56.4%) | 31/54 (57.4%) | 159/218 (72.9%) |
| 2% – 4% | N/A | N/A | N/A | 5/18 (27.8%) | 5/18 (27.8%) |
| 4% – 6% | N/A | N/A | N/A | 1/26 (3.8%) | 1/26 (3.8%) |
| 6% – 8% | N/A | N/A | N/A | 0/18 (0%) | 0/18 (0%) |
| 8% – 10% | N/A | 4/4 (100%) | 5/8 (62.5%) | 0/34 (0%) | 9/46 (19.6%) |
| 10% – 12% | 40/40 (100%) | 32/32 (100%) | 23/74 (31.1%) | 0/50 (0%) | 95/196 (48.5%) |
|
| |||||
| 0% – 12% | 88/88 (100%) | 72/74 (97.3%) | 72/160 (45.0%) | 37/200 (18.5%) | 269/522 (51.5%) |
Data are the number missing/total (%). Data combine both Rainbow devices
SpCO, pulse oximeter measured carboxyhemoglobin percentage; SaO2, measured blood arterial oxygen saturation; COHb, measured arterial carboxyhemoglobin percentage; N/A, not applicable
SaO2 had no significant effect on SpCO bias for the pooled device data, (P = 0.66, Figure 3B). In Table 4, data are shown within SaO2 ranges of 5% increments. The standard deviation of the SpCO bias was significantly higher (precision lower) with hypoxemia (SaO2 < 95%), 4.0 vs. 2.6, P < 0.0001.
Table 4.
SpCO Reading Summary
| SaO2 Range | 80% – 100% | 95% – 100% | 90% – 95% | 85% – 90% | 80% – 85% |
|---|---|---|---|---|---|
| Device #1 | |||||
| n, paired observations | 154 | 95 | 39 | 19 | 1 |
| Mean Bias (%) | 0.3 | −0.3* | 0.8 | 2.1 | 8.0 |
| Precision (%) | 2.9 | 2.5 | 3.4 | 2.7 | N/A |
| Arms (%) | 2.9 | 2.5 | 3.5 | 3.4 | N/A |
| Limits of Agreement | −5.5 to 3.3 | −5.1 to 2.2 | −6.1 to 4.3 | −3.5 to 4.9 | N/A |
| |Bias| > 5% | 5.8% | 3.2% | 10.3% | 5.3% | 100.0% |
| Device #2 | |||||
| n, paired observations | 129 | 82 | 33 | 13 | 1 |
| Mean Bias (%) | −2.3 | −1.8 | −2.7 | −4.5† | 0.0 |
| Precision (%) | 2.9 | 2.6 | 3.2 | 3.4 | N/A |
| Arms (%) | 3.7 | 3.1 | 4.1 | 5.6 | N/A |
| Limits of Agreement | −8.1 to 3.5 | −6.8 to 3.2 | −9.1 to 3.6 | −12.2 to 3.3 | N/A |
| |Bias| > 5% | 20.9% | 11.0% | 30.3% | 61.5% | 0.0% |
| Pooled Devices | |||||
| n, paired observations | 283 | 177 | 72 | 32 | 2 |
| Mean Bias (%) | −0.9 | −1.0 | −0.8 | −0.6 | 4.0 |
| Precision (%) | 3.2 | 2.6 | 3.7 | 4.4 | 5.7 |
| Arms (%) | 3.3 | 2.8 | 3.8 | 4.4 | 5.7 |
| Limits of Agreement | −7.2 to 5.5 | −6.1 to 4.1 | −8.2 to 6.6 | −9.3 to 8.1 | N/A |
| |Bias| > 5% | 12.7% | 6.8% | 19.4% | 28.1% | 50.0% |
SpCO = percentage carboxyhemoglobin level (%COHb) as measured by the Masimo pulse CO-oximeter; SaO2 range = as measured by arterial blood values; mean bias = average of the bias (SpCO - %COHb) within the SaO2 range specified; precision = standard deviation of the bias; Arms = root-mean-square error; N/A = not applicable; comparison of mean bias was by ANOVA with Tukey-Kramer honest significant difference for multiple comparisons; limits of agreement corrected for repeated measures.
Significantly different from all other levels.
Significantly different from 90% – 95% and 95% – 100% levels.
Sensitivity, Specificity and Predictive Value for detecting elevated COHb in the presence of Hypoxia
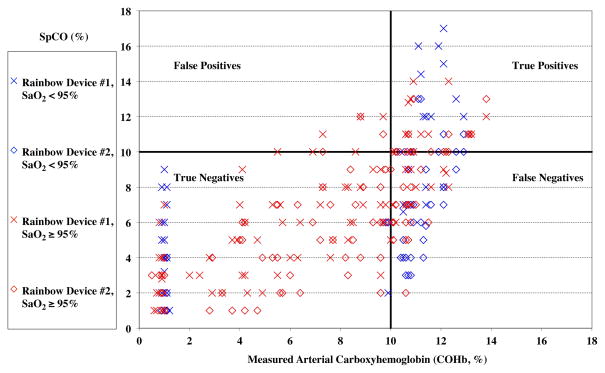
Sensitivity, specificity, positive and negative predictive value is summarized in Table 5 for different ranges of elevated %COHb. The distribution of true and false positives and negatives for the 10% COHb cutoff (shown graphically in Figure 4) was different among the different SaO2 ranges, P = 0.0004. For the 5% cutoff, the distribution was not different (P = 0.20).
Table 5.
SpCO Predictive Performance (0% < %COHb < 15%). Both Carboxyhemoglobin Probesf
| “Positive” | %COHb ≥ 10% | %COHb ≥ 5% | %COHb ≥ 10% | |||||
|---|---|---|---|---|---|---|---|---|
| SpCO Threshold | ≥ 10% | ≥ 5% | ≥ 6.6 | ≥ 5% | ||||
| SaO2 Range | 95–100% | 90–95% | 85–90% | 95–100% | 90–95% | 85–90% | All | All |
| Observations | 177 | 72 | 32 | 177 | 72 | 32 | 283 | 283 |
| PPV = TP/(TP+FP) | 78.0% | 100.0% | 100.0% | 90.0% | 83.3% | 75.0% | 72.9% | 62.1% |
| NPV = TN/(TN+FN) | 76.5% | 50.0% | 52.4% | 68.4% | 77.8% | 50.0% | 79.7% | 79.7% |
| Sensitivity = TP/(TP+FN) | 50.0% | 43.5% | 52.4% | 85.7% | 91.8% | 71.4% | 77.9% | 92.4% |
| Specificity = TN/(TN+FP) | 92.0% | 100.0% | 100.0% | 76.5% | 60.9% | 54.5% | 75.0% | 51.3% |
|
| ||||||||
| Accuracy = (TP+TN)/(P+N) | 76.8% | 63.9% | 68.8% | 83.1% | 81.9% | 65.6% | 76.3% | 70.3% |
SpCO, percentage of carboxyhemoglobin as measured by the Masimo pulse CO-oximeter; %COHb, percentage of carboxyhemoglobin measured in arterial blood; SaO2, arterial blood oxygen saturation; PPV=Positive Predictive Value, NPV=Negative Predictive Value, TP=True Positive, FFP=false Positive, TN=True Negative, FN=False Negative. SpCO=6.6 was the cutoff optimizing sensitivity and specificity by receiver-operator characteristics analysis.
Figure 4.
Pulse CO-oximeter carboxyhemoglobin (SpCO) readings as a function of measured percentage of carboxyhemoglobin in arterial blood (%COHb). “X’s” (“Device #1”) and open diamonds (“Device #2”) indicated readings from the 2 Rainbow devices monitoring simultaneously. Values measured in room air (arterial oxygen saturation [SaO2] ≥ 95%) are shown as in red, and data obtained during hypoxemia (SaO2 < 95%) are shown in blue. The horizontal and vertical lines separate the data into quadrants, representing true or false positives or negatives for detecting a carboxyhemoglobin level of 10% or more.
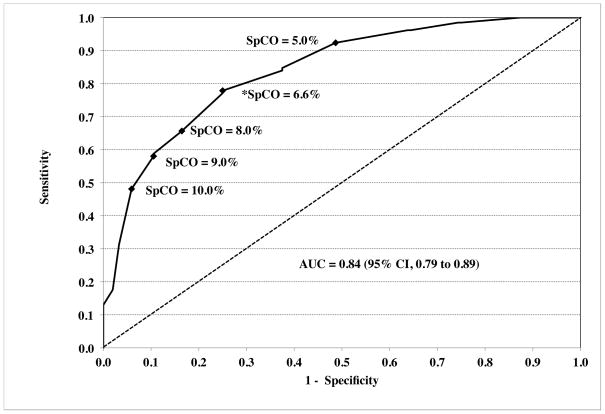
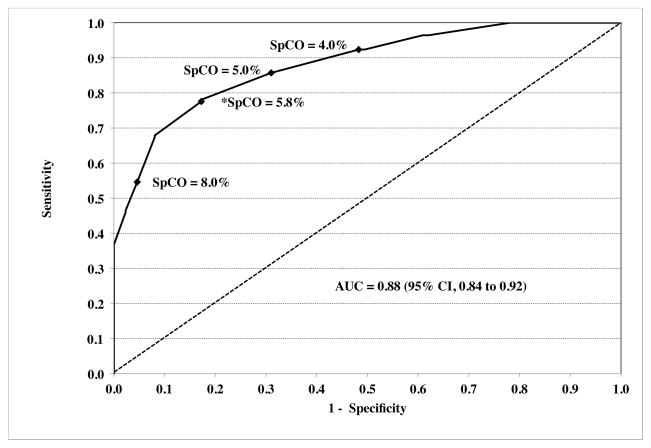
A receiver-operator characteristic (ROC) curve analyzed for %COHb ≥ 10% as significant carboxyhemoglobinemia maximized sensitivity and specificity at an SpCO of 6.6%, with an area under the curve (AUC) of 0.84 (95% CI, 0.79 to 0.89) (Figure 5A). Sensitivity, specificity and predictive value for this cutoff are summarized in Table 5. The ROC curve for %COHb ≥ 5% as “positive” carboxyhemoglobinemia had an AUC of 0.88 (95%CI, 0.84 to 0.92) (Figure 5B).
Figure 5.
Receiver-operator characteristic curves are shown for “positive” carboxyhemoglobinemia as ≥ 10% (panel A) or ≥ 5% (panel B). The dashed diagonal line shows an AUC of 0.50, which would have no discriminatory value. Values for the area under the curve (AUC) were 0.84 (95% CI, 0.79 to 0.89) and 0.88 (95% CI, 0.84 to 0.92) respectively. A number of key points (closed diamonds) along the curve are marked with respective pulse CO-oximeter carboxyhemoglobin (SpCO) values. The values of SpCO that maximized sensitivity and specificity are denoted by asterisks, and were 6.6% and 5.8% respectively.
Methemoglobin
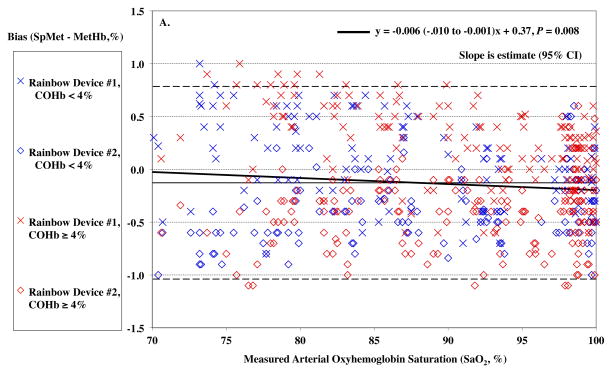
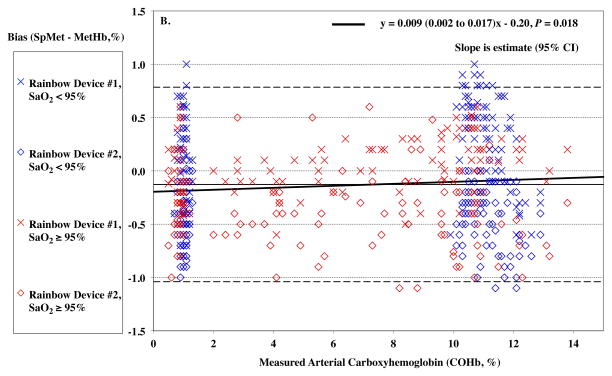
MetHb levels were in the low range of normal for all subjects during the study. SaO2 had a slight effect on SpMet bias (P = 0.008) with a slightly more positive bias as lower SaO2, but this was only 0.006% for every 1% of desaturation (Figure 6A). Carboxyhemoglobin produced a small but statistically significant effect on SpMet bias (P = 0.018, Figure 6B).
Figure 6.
Pulse CO-oximeter SpMet reading bias (SpMet - percentage of methemoglobin in arterial blood [%MetHb]) as a function of oxygen saturation (SaO2) (panel A) and carboxyhemoglobin concentration (COHb) (panel B) as measured by arterial blood gas analysis. “X’s” (“Device #1”) and open diamonds (“Device #2”) indicate readings from the 2 Rainbow devices monitoring simultaneously. The solid line shows the mean bias for both devices pooled together. The dashed lines are the upper and lower limits of agreement. In panel A, SaO2 significantly influenced SpMet bias with a slightly more positive bias as lower SaO2, (P = 0.008). Data for high COHb (≥ 5%) are shown in red, while data for low COHb (< 5%) are shown in blue, and have a similar small but statistically significant effect. In panel B, carboxyhemoglobin produced a small but statistically significant effect on SpMet bias (P =0.018). Data for high SaO2 (≥ 95%) are shown in red, while data for low SaO2 (< 95%) are shown in blue. Regression lines and information are shown on the figures. Regressions for separate COHb and SaO2 ranges were similar (not shown).
Perfusion Index
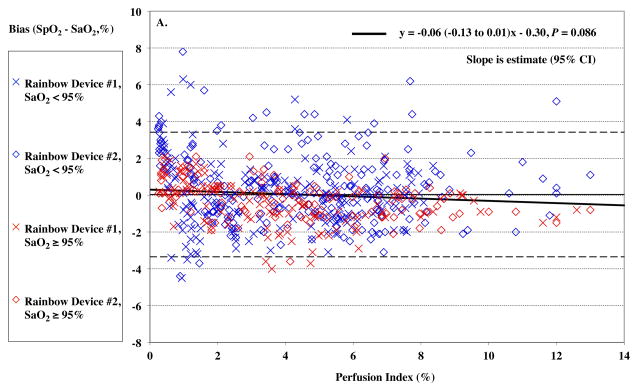
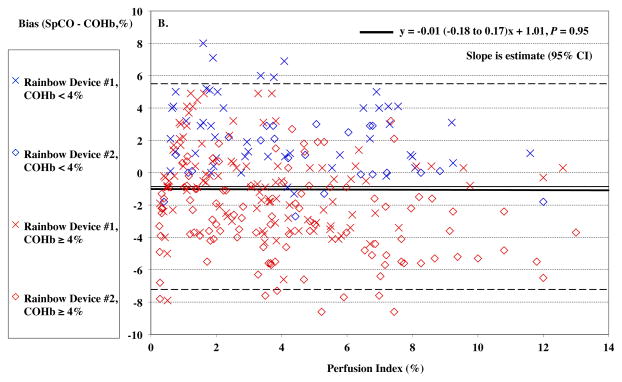
Women had significantly lower perfusion index (PI) than men, mean (95%CI) of 1.7% (0.4–3.0%) vs. 5.5% (3.9–7.1%), P = 0.0014. Despite efforts to warm hands, one female subject had a PI below 1 %. Overall, PI had no significant effect on the Rainbow SpO2 bias (P = 0.086, Figure 7A) or SpCO bias (P = 0.95, Figure 7B). SpO2 bias had lower precision (higher SD) at PI < 2% (P < 0.0001), although SpCO bias did not (P = 0.93).
Figure 7.
Pulse CO-oximeter SpCO bias (SpCO – percentage of carboxyhemoglobin in arterial blood [%COHb]) (Panel A) and SpO2 reading bias (SpO2 – arterial oxygen saturation [SaO2]) (Panel B) as a function of a function of perfusion index (PI). X’s” (“Device #1”) and open diamonds (“Device #2”) indicate readings from the 2 Rainbow devices monitoring simultaneously. The solid line shows the mean bias for both devices pooled together. The dashed lines are the upper and lower limits of agreement. In panel A, data for high SaO2 (≥ 95%) are shown in red, while data for low SaO2 (< 95%) are shown in blue. Data at high SaO2 showed a barely significant effect (P = 0.029). In panel B, data for high %COHb (≥ 4%) are shown in red, while data for low COHb (< 4%) are shown in blue. SpCO bias was higher for both Devices at PI < 2, P < 0.05 and precision lower, P < 0.05. Regression lines and information are shown on the figures. Regressions for separate COHb and SaO2 ranges were similar (not shown).
Discussion
The primary purpose of this study was to assess the accuracy of pulse CO-oximetry measurement of COHb in the presence of mild to moderate hypoxemia. We found that, in the presence of 10–12% COHb, accuracy for detecting hypoxemia was not degraded, with an Arms still < 3%. Mild to moderate hypoxemia did not appreciably degrade the accuracy of COHb measurement as indicated by the bias, but slightly degraded the precision and Arms. However, when the SaO2 was lower than 85%, the devices read “low signal IQ” and would not report SpCO values.
The usefulness of a non-invasive measurement of carboxyhemoglobin has been demonstrated in numerous case reports,18–20 and studies of occult carbon monoxide poisoning.4,5 The ability to diagnose suspected cases of carbon monoxide exposure in a timely fashion, and avoid unnecessary invasive testing, requires good positive and negative predictive value. Detecting elevated COHb levels to enable rapid initiation of appropriate treatment, including normobaric and hyperbaric oxygen, may improve outcomes.21 Detecting elevated COHb levels, even at levels that may not be clinically important, may identify sources of carbon monoxide exposure at home or at work that could cause more serious harm in the future or lead to testing of others exposed to the event. Determining whether COHb levels are improving in patients requires more frequent measurements.
No prior studies involving pulse CO-oximetry in patients mention simultaneous evaluation in the presence of hypoxemia. Previous reports of pulse CO-oximetry in emergency room patients probably involved supplemental oxygen administration.5,12 Simultaneous hypoxemia would be likely in cases of smoke inhalation and loss of consciousness. However, studies comparing SpCO and blood values did not include such data in the field because of the lack of blood analyzers. The manufacturer reports that the Rainbow Radical-7 is not accurate with simultaneous methemoglobinemia. We reported erroneous SpCO reading in an earlier study with induced methemoglobinemia,7 but we did not test the combination of methemoglobin and carboxyhemoglobin in the current study.
Our results concerning the detection of COHb during normoxia were similar to two studies in normal volunteers in laboratory settings at normal levels of oxygen that found good accuracy and precision.9,10 In contrast, studies in ER patients have shown larger bias, from −3% to +4%, and wider limits of agreement, span from lower to upper limit of agreement of 15% to 25%.4,11–13,22 A study on 139 patients in pulmonary function lab found a low bias, but fairly wide limits of agreement.23 In some studies, significant delays occurred between the SpCO reading and blood sampling for COHb measurements, making accurate assessment of bias difficult.4,12
Skin color and gender are known to alter pulse oximeter performance.15,16 Many studies have not reported the gender and skin pigmentation of study subjects, making direct comparison of the results difficult, although Tougher et al. attempted some analysis excluding dark-skinned patients.13 Our subjects were intentionally of different genders, ethnicities and skin color, since it is important that the results apply broadly, and is also required by the United States Food and Drug Administration for studies of pulse oximeter accuracy. Our study did not have the power to resolve differences in performance related to skin pigmentation.
The sensitivity, specificity, positive and negative predictive values for detecting COHb in the presence of mild hypoxia was acceptable (Table 5 and Figure 5). However, our study was not optimally designed to measure these parameters, since most of our data was clustered around subjects’ baseline value and at the target of 10–12% COHb. Testing in human volunteers at these higher levels would not be appropriate, especially if combined with hypoxia. Receiver-operator characteristic analysis of our data (Figure 5 and Table 5) indicated maximum sensitivity and specificity for detecting COHb levels ≥ 10% was an SpCO of 6.6%. Similarly, Roth et al. found that an SpCO of 6.6% was 94% sensitive in identifying the 17 patients with carbon monoxide poisoning, with 77% specificity.12 Lowering the SpCO thresholds to maximize sensitivity in order to prevent missing anyone with potential serious carbon monoxide poisoning might be better for initial screening. For our data, a threshold of 5% SpCO is over 90% sensitive in detecting all subjects with COHb ≥ 10%. While lowering the threshold will decrease specificity, this may be desirable as a screening test for the presence of COHb. In a study of ER patients, Suner et al. reported 94% sensitivity and 54% specificity for the Rad-57 from 64 data points.4 However, Touger et al. found lower sensitivity (48%) but good specificity, positive and negative predictive value for a 15% COHb cutoff.13 The exact clinical threshold indicating treatment necessity is not clear, although a level of COHb of 25% has been suggested for hyperbaric oxygen treatment.22
We studied two devices of each type, randomly placing them on different hands and different fingers. This increased the total number of data points for analysis. The oximeters behaved similarly, although slight differences, typically only 1–2% were apparent at times. We have previously found small difference in probes types.16 Limitations on the reasonable number of probes we can study in volunteers mean that we do not have data on all probes types in this study.
Defining acceptable performance and accuracy is somewhat arbitrary, but depends on the clinical purpose of the device. Clearly, measurement of SpCO is less accurate than for SpO2 and SpMet, being reported only to a whole number. Piatkowski et al. concluded that the bias of 3.15% (precision 2.36%) represented acceptable accuracy.11 Roth et al.12 concluded that accuracy was acceptable at bias of 2.32 ± 4.01. Touger et al. defined ± 5% as acceptable accuracy, reporting that 33% of data fell outside this range,13 which was discussed in an editorial by Maisel and Lewis in the Annals Emergency Medicine.24
Methemoglobin
MetHb readings from the Rad 7 co-oximeters showed excellent stability with changes in carboxyhemoglobin and SaO2. Although a repeated measures analysis is extremely robust in detecting small changes in bias with a large number of measurements, the changes in SpMet bias as shown in Figure 6 are not clinically important. Changes in SpMet bias might not be expected from induced carboxyhemoglobinemia and hypoxemia, however early versions of the pulse CO-oximeter could not discriminate multiple different hemoglobin species.7 This was corrected in subsequent versions.8 Cyanide toxicity can occur in fires due to combustion of nitrogen containing compounds. Treatment is with sodium nitrite, which produces methemoglobinemia.25 This creates a clinical scenario in which MetHb and COHb would be present concurrently.
Oxygen Saturation
Within the range of carboxyhemoglobinemia studied, both the Rainbow and the conventional pulse oximeters were able to detect hypoxemia even in the presence of elevated COHb, with an Arms of 1.70% and 2.05% being well below the acceptable FDA threshold of 3%. Confusion of carboxyhemoglobin and oxyhemoglobin might lead the oximeters to read a higher SpO2 (positive bias) even at low oxygen saturation. Data on standard pulse oximeter accuracy with carboxyhemoglobinemia has shown a slightly negative bias at high COHb levels, with an obvious “gap” in measuring “fractional” oxygen saturation.6,26
Due to the similarity of the absorption spectra of oxyhemoglobin and carboxyhemoglobin, measurement may be intrinsically more difficult than for methemoglobin, which has greater spectral separation from oxyhemoglobin. The “pulse oximeter gap” describes the difference between SpO2 and fractional oxygen saturation with elevated %COHb, and implied that pulse oximeters were reading COHb as if it were oxyhemoglobin.26–28 Current pulse oximeters are calibrated with functional oxygen saturation, so accuracy should properly be considered only for functional SaO2. The ability of the pulse oximeters to detect oxygen desaturation in the presence of elevated COHb suggests there is no clinically relevant “confusion”.
Perfusion Index
Similar to finding with other parameters from pulse oximetry,29–31 accuracy and precision was degraded slightly at lower perfusion index. The effect was not dramatic, and it should be noted that we were actively warming subjects’ hands.
Limitations
A volunteer study has both limitations and advantages over other study designs. In human volunteers, we are limited as to the degree of carboxyhemoglobinemia and hypoxemia that we can safely produce. We have set the upper limit to 15%, with a target of 12% COHb in the setting of hypoxemia. Twelve subjects may not be adequate to produce robust data on sensitivity, specificity and predictive performance, although the study provided a total over 150 data points for SpCO and nearly 300 data points for SpMet and SpO2 with simultaneous arterial blood measurements. However, the repeated measures design is very robust for determining interaction between low SaO2 and elevated COHb. A laboratory setting also provides excellent coordination of blood draws and non-invasive measurement. Our step changes in carboxyhemoglobin, rather than continuous breathing of carbon monoxide, provides better stability for the coordination of SpCO and blood measurements. Continued updates and changes to hardware and software make comparisons between our studies and other past or future studies difficult. We treated laboratory measurements as a gold standard, although even such devices may have inaccuracies. Our population of study subjects may not represent all patient populations, but did have intentional variability of gender and ethnicity. Performance in a controlled laboratory environment may still differ from the clinical setting in patients with multiple comorbidities.
Conclusions
Accuracy of the Masimo pulse CO-oximeter for measuring carboxyhemoglobin was not affected by hypoxemia to a clinically important degree. However, hypoxemia did result in a significant increase in device reported low signal errors and blank COHb readings. COHb elevations up to 12% minimally affected measurements of SpO2 and SpMet. Sensitivity, specificity and predictive value at up to 12% COHb were good (AUC of the ROC curve >0.8), but more data at higher COHb levels would be useful in helping clinicians define appropriate thresholds for optimizing screening for potential carbon monoxide poisoning. Given the history of pulse oximeter development, further investments in multi-wavelength pulse oximeter technology are likely to improve accuracy and performance.
Acknowledgments
Funding: The study was funded by income derived from tests of pulse oximetry accuracy for various companies including Masimo Inc
Footnotes
Conflicts of Interest: None.
Contributor Information
John R. Feiner, Email: feinerj@anesthesia.ucsf.edu, Department of Anesthesia and Perioperative Care, University of California, San Francisco, California. Contribution: Participated in designing and conducting the studies. Recorded and analyzed the data. Prepared the manuscript. Attestation: John Feiner approved the final manuscript. John Feiner attests to the integrity of the original data and the analysis reported. John Feiner is the archival author.
Mark D. Rollins, Email: rollinsm@anesthesia.ucsf.edu, Department of Anesthesia and Perioperative Care, University of California, San Francisco, California. Contribution: Participated in performing studies and revision of manuscript. Attestation: Mark Rollins read and approved the final manuscript.
Jeffrey Sall, Email: sallj@anesthesia.ucsf.edu, Department of Anesthesia and Perioperative Care, University of California, San Francisco, California. Contribution: Participate in performing studies and revision of manuscript. Attestation: Jeffrey Sall read and approved the final manuscript.
Helge Eilers, Email: eilersh@anesthesia.ucsf.edu, Department of Anesthesia and Perioperative Care, University of California, San Francisco, California. Contribution: Participate in performing studies and revision of manuscript. Attestation: Helge Eilers read and approved the final manuscript.
Paul Au, Email: aup@anesthesia.ucsf.edu, Department of Anesthesia and Perioperative Care, University of California, San Francisco, California. Contribution: Recruited study subjects, participated in data collection. Attestation: Paul Au read and approved the final manuscript.
Philip E. Bickler, Email: bicklerp@anesthesia.ucsf.edu, Department of Anesthesia and Perioperative Care, University of California, San Francisco, California. Contribution: Participated in designing and conducting the studies, and revising manuscript. Attestation: Philip Bickler read and approved the final manuscript. Philip Bickler attests to the integrity of the original data and the analysis reported.
References
- 1.Carbon monoxide exposures--United States, 2000–2009. MMWR Morb Mortal Wkly Rep. 2011;60:1014–7. [PubMed] [Google Scholar]
- 2.Hampson NB, Weaver LK. Carbon monoxide poisoning: a new incidence for an old disease. Undersea Hyperb Med. 2007;34:163–8. [PubMed] [Google Scholar]
- 3.Hampson NB, Scott KL, Zmaeff JL. Carboxyhemoglobin measurement by hospitals: implications for the diagnosis of carbon monoxide poisoning. J Emerg Med. 2006;31:13–6. doi: 10.1016/j.jemermed.2005.09.010. [DOI] [PubMed] [Google Scholar]
- 4.Suner S, Partridge R, Sucov A, Valente J, Chee K, Hughes A, Jay G. Non-invasive pulse CO-oximetry screening in the emergency department identifies occult carbon monoxide toxicity. J Emerg Med. 2008;34:441–50. doi: 10.1016/j.jemermed.2007.12.004. [DOI] [PubMed] [Google Scholar]
- 5.Chee KJ, Nilson D, Partridge R, Hughes A, Suner S, Sucov A, Jay G. Finding needles in a haystack: a case series of carbon monoxide poisoning detected using new technology in the emergency department. Clin Toxicol (Phila) 2008;46:461–9. doi: 10.1080/15563650701725110. [DOI] [PubMed] [Google Scholar]
- 6.Hampson NB. Pulse oximetry in severe carbon monoxide poisoning. Chest. 1998;114:1036–41. doi: 10.1378/chest.114.4.1036. [DOI] [PubMed] [Google Scholar]
- 7.Feiner JR, Bickler PE, Mannheimer PD. Accuracy of methemoglobin detection by pulse CO-oximetry during hypoxia. Anesth Analg. 2010;111:143–8. doi: 10.1213/ANE.0b013e3181c91bb6. [DOI] [PubMed] [Google Scholar]
- 8.Feiner JR, Bickler PE. Improved accuracy of methemoglobin detection by pulse CO-oximetry during hypoxia. Anesth Analg. 2010;111:1160–7. doi: 10.1213/ANE.0b013e3181f46da8. [DOI] [PubMed] [Google Scholar]
- 9.Barker SJ, Curry J, Redford D, Morgan S. Measurement of carboxyhemoglobin and methemoglobin by pulse oximetry: a human volunteer study. Anesthesiology. 2006;105:892–7. doi: 10.1097/00000542-200611000-00008. [DOI] [PubMed] [Google Scholar]
- 10.Zaouter C, Zavorsky GS. The measurement of carboxyhemoglobin and methemoglobin using a non-invasive pulse CO-oximeter. Respiratory physiology & neurobiology. 2012;182:88–92. doi: 10.1016/j.resp.2012.05.010. [DOI] [PubMed] [Google Scholar]
- 11.Piatkowski A, Ulrich D, Grieb G, Pallua N. A new tool for the early diagnosis of carbon monoxide intoxication. Inhal Toxicol. 2009;21:1144–7. doi: 10.3109/08958370902839754. [DOI] [PubMed] [Google Scholar]
- 12.Roth D, Herkner H, Schreiber W, Hubmann N, Gamper G, Laggner AN, Havel C. Accuracy of noninvasive multiwave pulse oximetry compared with carboxyhemoglobin from blood gas analysis in unselected emergency department patients. Ann Emerg Med. 2011;58:74–9. doi: 10.1016/j.annemergmed.2010.12.024. [DOI] [PubMed] [Google Scholar]
- 13.Touger M, Birnbaum A, Wang J, Chou K, Pearson D, Bijur P. Performance of the RAD-57 pulse CO-oximeter compared with standard laboratory carboxyhemoglobin measurement. Ann Emerg Med. 2010;56:382–8. doi: 10.1016/j.annemergmed.2010.03.041. [DOI] [PubMed] [Google Scholar]
- 14.Lee AS, Mellins RB. Lung injury from smoke inhalation. Paediatr Respir Rev. 2006;7:123–8. doi: 10.1016/j.prrv.2006.03.003. [DOI] [PubMed] [Google Scholar]
- 15.Bickler PE, Feiner JR, Severinghaus JW. Effects of skin pigmentation on pulse oximeter accuracy at low saturation. Anesthesiology. 2005;102:715–9. doi: 10.1097/00000542-200504000-00004. [DOI] [PubMed] [Google Scholar]
- 16.Feiner JR, Severinghaus JW, Bickler PE. Dark skin decreases the accuracy of pulse oximeters at low oxygen saturation: the effects of oximeter probe type and gender. Anesth Analg. 2007;105:S18–23. doi: 10.1213/01.ane.0000285988.35174.d9. tables of contents. [DOI] [PubMed] [Google Scholar]
- 17.Bland JM, Altman DG. Agreement between methods of measurement with multiple observations per individual. J Biopharm Stat. 2007;17:571–82. doi: 10.1080/10543400701329422. [DOI] [PubMed] [Google Scholar]
- 18.Roth D, Hubmann N, Havel C, Herkner H, Schreiber W, Laggner A. Victim of carbon monoxide poisoning identified by carbon monoxide oximetry. J Emerg Med. 2011;40:640–2. doi: 10.1016/j.jemermed.2009.05.017. [DOI] [PubMed] [Google Scholar]
- 19.Crawford DM, Hampson NB. Fire and ice: diagnosis of carbon monoxide poisoning in a remote environment. Emerg Med J. 2008;25:235–6. doi: 10.1136/emj.2007.051516. [DOI] [PubMed] [Google Scholar]
- 20.Bledsoe BE, Nowicki K, Creel JH, Jr, Carrison D, Severance HW. Use of pulse co-oximetry as a screening and monitoring tool in mass carbon monoxide poisoning. Prehosp Emerg Care. 2010;14:131–3. doi: 10.3109/10903120903349853. [DOI] [PubMed] [Google Scholar]
- 21.Hampson NB. Noninvasive pulse CO-oximetry expedites evaluation and management of patients with carbon monoxide poisoning. Am J Emerg Med. 2012 doi: 10.1016/j.ajem.2012.03.026. [DOI] [PubMed] [Google Scholar]
- 22.Coulange M, Barthelemy A, Hug F, Thierry AL, De Haro L. Reliability of new pulse CO-oximeter in victims of carbon monoxide poisoning. Undersea Hyperb Med. 2008;35:107–11. [PubMed] [Google Scholar]
- 23.Ruppel GL, Wilson HA, Gall VK, Hempkens JA. Multi-wavelength pulse oximeter is not suitable for adjusting D(LCO) measurements. Respir Care. 2011;56:1115–21. doi: 10.4187/respcare.01142. [DOI] [PubMed] [Google Scholar]
- 24.Maisel WH, Lewis RJ. Noninvasive measurement of carboxyhemoglobin: how accurate is accurate enough? Ann Emerg Med. 2010;56:389–91. doi: 10.1016/j.annemergmed.2010.05.025. [DOI] [PubMed] [Google Scholar]
- 25.Cummings TF. The treatment of cyanide poisoning. Occup Med (Lond) 2004;54:82–5. doi: 10.1093/occmed/kqh020. [DOI] [PubMed] [Google Scholar]
- 26.Barker SJ, Tremper KK. The effect of carbon monoxide inhalation on pulse oximetry and transcutaneous PO2. Anesthesiology. 1987;66:677–9. doi: 10.1097/00000542-198705000-00014. [DOI] [PubMed] [Google Scholar]
- 27.Buckley RG, Aks SE, Eshom JL, Rydman R, Schaider J, Shayne P. The pulse oximetry gap in carbon monoxide intoxication. Ann Emerg Med. 1994;24:252–5. doi: 10.1016/s0196-0644(94)70137-7. [DOI] [PubMed] [Google Scholar]
- 28.Toffaletti J, Zijlstra WG. Misconceptions in reporting oxygen saturation. Anesth Analg. 2007;105:S5–9. doi: 10.1213/01.ane.0000278741.29274.e1. [DOI] [PubMed] [Google Scholar]
- 29.Miller RD, Ward TA, Shiboski SC, Cohen NH. A comparison of three methods of hemoglobin monitoring in patients undergoing spine surgery. Anesth Analg. 2011;112:858–63. doi: 10.1213/ANE.0b013e31820eecd1. [DOI] [PubMed] [Google Scholar]
- 30.Gehring H, Hornberger C, Matz H, Konecny E, Schmucker P. The effects of motion artifact and low perfusion on the performance of a new generation of pulse oximeters in volunteers undergoing hypoxemia. Respir Care. 2002;47:48–60. [PubMed] [Google Scholar]
- 31.Broch O, Bein B, Gruenewald M, Hocker J, Schottler J, Meybohm P, Steinfath M, Renner J. Accuracy of the pleth variability index to predict fluid responsiveness depends on the perfusion index. Acta anaesthesiologica Scandinavica. 2011;55:686–93. doi: 10.1111/j.1399-6576.2011.02435.x. [DOI] [PubMed] [Google Scholar]


