

Abstract
To address the issue of quantification for antibody assays with protein microarrays, we firstly developed a Microarray Nonlinear Calibration (MiNC) method that applies in the quantification of antibody binding to the surface of microarray spots. We found that MiNC significantly increased the linear dynamic range and reduced assay variations. A serological analysis of guinea pig Mycobacterium tuberculosis models showed that a larger number of putative antigen targets were identified with MiNC, which is consistent with the improved assay performance of protein microarrays. We expect that our cumulative results will provide scientists with a new appreciation of antibody assays with protein microarrays. Our MiNC method has the potential to be employed in biomedical research with multiplex antibody assays which need quantitation, including the discovery of antibody biomarkers, clinical diagnostics with multi-antibody signatures and construction of immune mathematical models.
Keywords: Microarray Nonlinear Calibration, Nucleic Acid Programmable Protein Arrays, In vitro transcription/translation, Tuberculosis
Introduction
Protein microarrays are useful tools to allow assessment of antibody reactivity against a large number of targets simultaneously utilizing only a minute amount of sample. Detection of primary binding is usually performed with a fluorescent dye conjugated secondary antibody that can bind to the query antibody on the target features. The multiplex ability of protein microarrays has made them widely employed to evaluate antibodies’ specificity and sensitivity, to measure the changes of antibody responses to vaccination or immunotherapy, to screen disease-related antibody biomarkers in high-throughput, and to be potentially used in the early diagnostics and treatment of cancers and infectious diseases with a signature comprising multi antibody biomarkers (1–5). Although numerous successes of protein microarrays are encouraging, current data assessments rely on direct comparison of signal intensities. This dramatically limits the ability to quantitatively interpret the relationship of produced fluorescent signals to the binding antibodies. Unlike the traditional ELISA employing an independent standard curve to quantitate the concentration of target antibodies, there is no common standard for the detection of antibodies to different targets on the arrays in a single experiment. The affinity of different antibodies to their targets in serum varies and no methods exist to objectively quantify these independent antibody concentrations. In addition, improvements in the sensitivity and the linearity of dynamic range would aid in the detection of low-abundant antibodies in clinical serum samples. All of them would lead to the broader applicability and acceptance of protein microarrays as routine biomedical research tools in the future (6–8).
To address these concerns we developed the Microarray Nonlinear Calibration (MiNC) method that applies nonlinear calibration to directly quantify the amount of query antibody binding to the surface of protein microarrays. We demonstrated this approach using the Nucleic Acid Programmable Protein Arrays (NAPPA) developed in our laboratory (9–10). NAPPA is a method for producing protein microarrays in which cDNAs encoding proteins are printed on the array and then converted to proteins by in vitro transcription/translation (IVTT). Translated proteins are captured to the surface by virtue of an epitope tag appended to the protein and a corresponding capture agent.
Materials and Methods
Sera samples
The human serum was obtained from a healthy donor in the lab. The sera from guinea pig TB models were kindly provided by Dr. David McMurray, Texas A&M University which include non vaccinated/noninfected (n = 6) group and a recombinant BCG (rBCG) -vaccinated (n = 7) group. All sera were collected in 5 weeks after the guinea pigs were challenged via the respiratory route with M. tuberculosis H37Rv in an aerosol chamber.
Plasmid repository and high-throughput DNA preparation
Sequence-verified, full-length cDNA expression Mtb plasmids in flexible donor vector systems were obtained from the J. Craig Venter Institute. p53, c-jun, CYRAB and PRDX4-3 plasmids were from Harvard Institute of Proteomics (HIP). They are publicly available (http://dnasu.asu.edu/DNASU/). These genes were converted into the T7-based mammalian expression vector pANT7_GST using LR recombinase (Invitrogen, Carlsbad, CA). The high-throughput preparation of high-quality supercoiled DNA for cell-free protein expression was performed as previously described (9). Briefly, expression plasmids were transformed into E.coli DH5alpha and grown in 1.5 mL terrific broth and ampicillin (100 μg/mL). DNA was purified with the NucleoPrepII anion exchange resin (Macherey-Nagel Inc., Bethlehem, PA) using a Biomek FX (Beckman Coulter, Inc., Fullerton, CA) automated laboratory workstation. Automated addition of all solutions was accomplished using a Matrix WellMate (Thermo Scientific, Hudson, NH) rapid bulk liquid-dispensing instrument. Purified DNA was precipitated by addition of 40 μl NaOAc and 240 μl isopropanol, followed by centrifugation at 5000 rcf for 30 minutes. The DNA pellet was washed with 300μL of 80% ethanol, centrifuged at 5000 rcf for 30 minutes, dried, and resuspended in dH2O. For the experiments of p53 antibody assay and multiplexed antibody assay, the large quantities of p53, c-jun, CYRAB and PRDX4-3 DNA were prepared using standard Nucleobond preparation methods (Macherey-Nagel Inc., Bethlehem, PA). All IgG standards and DyLight549 conjugated secondary antibody were purchased from Jackson ImmunoResearch Labs (West Grove, PA). Mouse anti-p53 antibody was obtained from Santa Cruz Biotech (Santa Cruz, CA). Mouse anti-c-jun antibody was obtained from Invitrogen (Carlsbad, CA). Mouse anti-CYRAB and anti-PRDX4-3 antibodies were obtained from SAIC-Frederick, Inc. (Frederick, MD).
Influence of zone effect and serum on the IgG standards
To examine the influence of zone effect on the IgG standard, the mouse IgG standards were printed at four different locations of the amine coated glass slide. Then the IgG array was incubated with DyLight549 conjugated rabbit anti-mouse IgG antibody (10 μg/ml) for 1h, followed by washing with PBST (PBS, 0.2%Tween) three times and H2O and dried with air. To examine the influence of serum on IgG standards, the guinea pig IgG standards were printed on the slide and incubated with the serum of ten guinea pig individuals (1:300dilution) for 1h, respectively. Then the resulting array was incubated with DyLight549 conjugated rabbit anti-guinea pig IgG antibody (10 μg/ml) for 1h, followed by washing with PBST three times and H2O and dried with air.
Anti-p53 antibody assay and multiplexed antibody assay with protein microarrays
A series amount of mouse IgG molecules (0, 3, 10, 30, 89, 266 fmol) were printed on the amino modified slide along with different concentrations of p53 plasmids DNA (316, 474, 711, 1067, 1600 and 2400 ng/μl) (9–10). Briefly, the plasmid DNA were mixed well with master mix that is composed of capture antibody (50 μg/mL, anti-GST antibody, GE Healthcare Biosciences, Piscataway, NJ), protein crosslinker (2 mM, BS3, Pierce, Rockford, IL) and BSA (3 mg/mL, Sigma-Aldrich). All samples were printed using a Genetix QArray2 with 300 μm solid tungsten pins on amine-treated glass slides. With this approach, the anti-GST antibody, BSA and plasmid DNA can be cross-linked to the amino groups on microarray spots. Arrays were stored in an airtight container at room temperature, protected from light. Before the experiment, the printed DNA was transcribed and translated in situ using previously published protocols (9–10). After the in vitro transcription and translation (IVTT) and blocking with 5 % Milk with 0.2 %Tween20, the resulting p53 array was incubated different concentrations of anti-p53 antibody (0, 3, 8, 24, 74, 222, 667, and 2000 ng/ml) for 1h and DyLight549 conjugated rabbit anti-mouse IgG antibody (10 μg/ml) for 1h separately. Then the slides were washed with PBST three times and H2O and dried with air.
To perform multiple antibody assays, 1500 ng/μl of c-jun, CYRAB and PRDX4-3 DNA plasmids were printed on the slide with the mouse IgG standards in parallel. After IVTT, the resulting protein array was incubated with the antibody mixes comprising of eight concentrations of spiked mouse anti c-jun, anti-CYRAB and anti-PRDX4-3 antibodies in 1: 300 diluted human serum, respectively. The spiked anti-c-Jun antibody concentration was 0, 55, 165, 494, 1481, 4444, 13333, and 40000 ng/ml respectively. The spiked anti-PRDX4-3 antibody concentration was 0, 27, 82, 247, 741, 2222, 6667, and 20000 ng/ml respectively. The spiked anti-CRYAB antibody concentration was 0, 3, 8, 25, 74, 222, 667, and 2000 ng/ml respectively. The detection was performed with DyLight549 conjugated rabbit anti-mouse IgG antibody (10 μg/ml).
Analysis of guinea pig TB models’ serological response using protein microarrays
The serological response of guinea pig TB models was analyzed using high-density microarrays consisting of 849 TB proteins and a graded amount of guinea pig IgG standards (0, 1.6, 5, 15, 44, 133 fmol). To control the quality of TB NAPPA microarrays, the immobilized DNA plasmids were examined using PicoGreen staining (Invitrogen, Carlsbad, CA) diluted at 1: 1800 in Superblock solution (Pierce, Rockford, IL). The protein expression was examined using anti-GST monoclonal antibody (Cell Signaling, Danvers, MA) diluted at 1:200 in 5 % PBST milk. The immobilization of guinea pig IgG standards was examined with DyLight549 conjugated donkey anti-guinea pig antibody (10 μg/ml). For the detection of antibodies in serum, the arrays were incubated with 2.5 ml sera pool of guinea pig models with and without rBCG vaccination, which was diluted 1:300 in 5% PBST milk. All incubations were carried out at 4°C for 16 hs. Detection of the array was carried out using DyLight549 conjugated donkey anti-guinea pig antibody (10 μg/ml). This experiment was repeated three times using the same sera samples.
Data Analysis
All slides were scanned with Tecan’s PowerScanner (Männedorf, Switzerland) and the images were quantitated using Array-Pro Analyzer, version 6.3 (Media Cybernetics, Bethesda, MD). All graphs was drawn using Excel2007 (Microsoft Corp. Redmond, Washington) and OriginLab 8.5 (OriginLab Corp., Northampton, MA). The nonlinear standard curve was either a four-parameter power curve, f(x) = axb + cxd, or a three parameter logistic curve, f(x) = a(1 − e−bx)c, fit according to the least squares principle using the XLfit 5.0 software (IDBS, Alameda, CA).
We computed intra-CV coefficients for six proteins (p53 at concentrations of 711, 1067 and 1600 ng/μl, and jun, CYRAB and PRDX4), for each of two replicated experiments and each of eight antibody concentrations. The differences between MiNC and non-MiNC intra-CV coefficients for each protein were analyzed using (1) a t-test to examine overall differences, and (2) one-way ANOVA with a concentration factor to examine differences by concentration. For each protein and concentration we computed the inter-CV coefficient by calculating the CV of the means for the two experiments. We examined differences between the MiNC and non-MiNC inter-CV coefficients using a paired t-test.
To identify potential antibodies induced by rBCG vaccination, firstly we normalized raw signal intensity and the predicted antibody binding (fmol) by subtracting the background signal attributable to non-specific binding of TB antibodies, which was estimated by the first quartile of the nonspot control, and dividing the result by the median background-adjusted value of proteins on the array. These values were then averaged over duplicate spots to obtain a single normalized value for each protein. To perform statistical analysis, the log-transformed data were analyzed using Significance Analysis of Microarrays (SAM) to select antibodies with higher levels in rBCG group. SAM is a statistical method that was originally used in DNA microarrays for the selection of significantly changed genes from gene expression. SAM uses modified t-statistics to compare antibody levels and permutation analysis to estimate false discovery rates (11). To perform the hierarchical analysis and draw the heat maps, the normalized data were transformed as previously described (12–13) and the analyses were performed using MultiExperiment Viewer 4.1 software (www.tigr.org).
Results and Discussion
The principle of antibody assays performed with MiNC is shown in Figure 1. DNA plasmids encoding a relevant set of targets were printed on the array and expressed by IVTT in the usual fashion (Figure 1A, lower graph, green). In parallel with the DNA, we also printed features containing purified IgG (from the same animal species as the primary antibody) in measured and graded amounts on the array (Figure 1A, lower graph, left, brown). The resulting protein microarrays were probed with either antibodies or serum expected to recognize one or more of the proteins targets on the array (Figure 1A, lower graph, right, brown). These were then visualized using the appropriate secondary anti-IgG antibody coupled to fluorescent dye. In addition to binding any primary antibodies captured to target antigens, the secondary antibody also bound to the concentration series of IgG molecules. Then we fit a nonlinear curve to the signals of the labeled secondary antibody to the IgG standards (Figure 1A, upper graph, brown). By comparing the target feature signals (black) with the nonlinear IgG calibration curve, we interpolated the amount of antibody that bound to the surface of each spot, which was calculated and represented as fmol of bound antibodies (red).
Figure 1. The detection principle of antibody assay using protein microarrays.
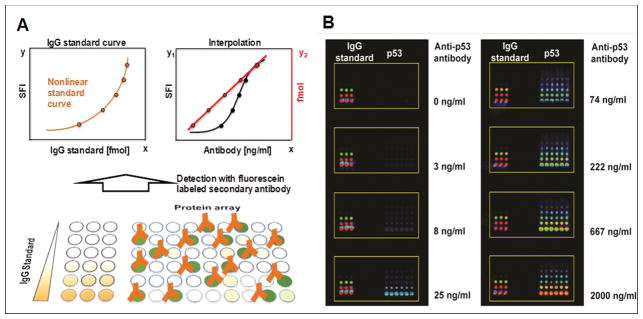
(A) is the schematic illustration of antibody assay using MiNC method. It consists of adding a series of features with different known amounts of IgG standards to a standard array. The IgG used should match the species from which the primary antibody came (lower graph, brown). The IgG standards are used to construct a nonlinear standard curve (upper graph, left) to interpolate the amount of IgG antibodies that bind to the surface of each protein spot after antibody incubation (upper graph, right), which is calculated and represented in fmol (red). The detection is performed with fluorescent dyes conjugated secondary antibody. SFI is the sum of fluorescent intensity within each protein spot (black). (B) is fluorescent images of the detection of different concentrations of mouse anti-p53 antibody. The left sub-array shows the mouse IgG standards (0, 3, 10, 30, 89, 266 fmol) and the right sub-array comprises different concentrations of p53 DNA plasmids (316, 474, 711, 1067, 1600 and 2400 ng/μl) in six replicates used to express proteins by the NAPPA method. The detection was performed with DyLight549 conjugated rabbit anti-mouse IgG secondary antibody.
Linear calibration using IgG standards has been previously used with antigen microarrays in the diagnostics of infectious diseases as an indirect fluorescent detection method. However, the use of a linear standard curve limited the range of detection to approximately one order of magnitude. Signals outside of this range were not reliably quantified (14–15). The use of a nonlinear curve may ameliorate this limitation significantly(16). However, the optimal fitting of a nonlinear curve to data is a non-trivial problem, with solutions depending not only on the data themselves (e.g., number of points, number of unique x values, variability) but also on the desired shape, desired smoothness and intended use of the curve. Thus, no single approach to curve-fitting will be appropriate for all applications. In the context of calibration, fixed-form methods using logistic and power curves are commonly-used (17–19). Alternative methods, based upon flexible splines or hierarchical models have also been proposed (20–21). The ideal calibration curve will fit the data well, be sufficiently smooth in order to be insensitive to experimental errors, and retain the true zero point. Visual inspection of the calibration curves is crucial to assess both fit and smoothness. Findlay and Dillard discuss several important issues in calibration, including different calibration models, methods to fit models, methods to assess model fit and array design(17). Retention of the true zero point is critical to ensure that the calibrated data remains on a ratio scale, which is a required property for the coefficient of variation to be an appropriate measure of error. In our experiments we have found that power and logistic functions, parameterized using 3–4 parameters and estimated according to the least squares principal, typically yield smooth curves that fit the data well. Specifically, in this work we have used both a four-parameter power curve, f(x) = axb + cxd, and a three parameter logistic curve, f(x) = a(1 − e−bx)c. However, we caution that other experimental data and experimental conditions may require different approaches to generating appropriate calibration curves, and that calibration curves should always be inspected visually to ensure both adequate fit and smoothness.
As a first step, we investigated the quality of the IgG calibration features on the NAPPA platform. We examined whether the IgG standard was affected by the printed slide position and found that all of the spots on the slide exhibited excellent feature morphology with the average variations of 14% (range: 3%–27%) (Figure 2A, B). We also compared the IgG standard following incubation with the serum of ten guinea pig Mycobacterium tuberculosis (TB) models individually and found the average variations of 10% (range: 6–14%) (Figure 2C, D).
Figure 2. Influence of zone effect and serum on the IgG standards.

(A) is the fluorescent image of mouse IgG standards at different locations of the slide; (B) is the comparison of fluorescent signal intensity of four IgG standards; (C) and (D) are the comparisons of the signal intensity and calibration curve of guinea pig IgG standard after incubation with the serum of ten guinea pigs individually. The detection was performed with DyLight549 conjugated rabbit anti-mouse IgG antibody and rabbit anti-guinea pig IgG secondary antibody, respectively.
To evaluate the quantitative performance, we chose the protein p53 and mouse anti-p53 antibody as a model. Figure 1B exhibits an increase in the fluorescent signals of both the IgG standards at the left and expressed p53 proteins at the right side of each array as antibody increased in concentration. The signal intensity at eight anti-p53 antibody concentrations were measured against DNA plasmid encoding p53 at concentrations of 711, 1067 and 1600 ng/μl (Figure 3 A–B, Figure S1), which covers the typical range of DNA plasmids printed. The graphs show that the raw signal intensity (black) increased with increasing anti-p53 antibody concentration in a nonlinear fashion. Although the dynamic ranges of fluorescent-based antibody assays typically cover 3 orders of magnitude, the linear dynamic range of the raw signals, within which changes in antibody concentration can be accurately measured, was only about 1 order of magnitude. Thus, changes in antibody concentration outside of this range were not readily measured by raw fluorescent intensity. However, after estimating the amount of bound antibody (red color) by calibrating with a four-parameter power curve, f(x) = axb + cxd, we found a linear relationship over 2.5–3 orders of magnitude of the assay (red) with R2 of 0.99.
Figure 3. Comparison of the performance of antibody assays without and with MiNC.

(A) and (B) are the detection of anti-p53 antibody using p53 DNA plasmid concentrations of 1067 and 1600 ng/μl used to produce p53 protein locally. The value of y-axis at both sides of x-axis is the signal intensity (black) and the fmol (red) from the blank controls, respectively. (C) and (D) are the comparison of intra-CV and inter-CV using raw signal intensity (black) and MiNC-calibrated intensity (red), respectively. Each boxplot represents the distribution of CV values across three p53 plasmids concentrations (711, 1067, and 1600 ng/μl) in which the bottom edge, top edge, and middle line correspond to the minimum, maximum and median values, respectively. (E) and (F) are the multiplex detection of antibodies in human serum without and with MiNC. The graphs were drawn using raw signal intensity (E) and MiNC-calibrated intensity (F). The error bars represent the standard deviations. The R2 was calculated to show the linear relationship of antibody concentration to calibrated antibody levels using MiNC.
We also compared the signal variation for raw intensity (Figure 3C–D, black) and calibrated intensity (Figure 3C–D, red) within a single experiment (intra-CV) and between different experiments on different days (inter-CV). The results showed that the MiNC method improved both the intra-CV (Figure 3C) and inter-CV (Figure 3D) at all concentrations of anti-p53 antibody from 0 ng/ml to 2000ng/ml. With MiNC, the average intra-CV decreased from 9% to 4%, and the average inter-CV decreased from 18% to 8% (Table 1). We also calculated the lowest concentration of detection limit (LOD) for the anti-p53 antibody based on the mean value of negative controls plus three standard deviations. The results showed that the LOD with MiNC ranged from 0.14 to 0.30ng/ml, which was almost no difference to the assay without MiNC.
Table 1.
Comparison of the performance of anti-p53 antibody assay without and with MiNC
| p53 DNA Plasmids (ng/μl) | LOD (ng/ml) | Dynamic range (ng/ml) | Intra-CV(%)* | Inter-CV(%)* | ||||||
|---|---|---|---|---|---|---|---|---|---|---|
| MiNC | MiNC | MiNC | MiNC | |||||||
| − | + | − | + | − | + | p-value | − | + | p-value | |
| 711 | 0.41 | 0.30 | 0.41 – 667 | 0.30 – 667 | 10 | 4 | <0.001 | 18 | 9 | 0.191 |
| 1064 | 0.15 | 0.14 | 0.15 – 667 | 0.14 – 667 | 10 | 5 | <0.001 | 22 | 9 | 0.055 |
| 1600 | 0.21 | 0.14 | 0.21 – 2000 | 0.14 – 2000 | 7 | 4 | 0.001 | 12 | 6 | 0.230 |
| AV | 9 | 4 | 18 | 8 | ||||||
The intra-CV and inter-CV were calculated as the average CV across eight anti-p53 antibody concentrations.
To further expand these results and to test whether the presence of serum affected the outcome, we spiked eight different concentrations of mouse anti c-jun, anti-CYRAB and anti-PRDX4-3 antibodies in 1:300 diluted human serum(22). Using the same method, we found the predicted antibody binding was proportional to the change of antibody levels with R2 values of 0.99 for all three antibodies (Figure 3E, F). The average intra-CV decreased from 10% to 4% and the inter-CV had no change with 10% before and after calibration with MiNC, respectively (Table 2). The LOD was also not changed. From the equation of antibody-antigen interaction, [AgAb] = ([Ag]/KD) [Ab], we know that the amount of antibody-antigen complexes formed on the microarray spots is proportional to the antibody concentrations because the reaction volume and number of antigens are fixed and the KD is dependent on the affinity of antibodies. This is consistent with our results and shows the feasibility of antibody quantification with MiNC on protein microarrays. Different than previously developed methods which can improve the assay performance of protein microarrays and antibody microarrays, such as two-color Fab labeling method or internally controlled system (23–24), MiNC can not only significantly improved linear dynamic range, but also reduced assay variations. More importantly, it has the ability to quantify hundreds of antibodies binding to the protein microarrays simultaneously.
Table 2.
Comparison of the performance of multiplexed antibody assay without and with MiNC
| Name | LOD (ng/ml) | Dynamic range (ng/ml) | Intra-CV(%)* | Inter-CV(%)* | ||||||
|---|---|---|---|---|---|---|---|---|---|---|
| MiNC | MiNC | MiNC | MiNC | |||||||
| − | + | − | + | − | + | p-value | − | + | p-value | |
| CYRAB | 0.4 | 0.4 | 0.4 – 2000 | 0.4 – 2000 | 9 | 3 | <0.001 | 15 | 10 | 0.278 |
| c-Jun | 57.2 | 22.2 | 57.2 – 40000 | 22.2 – 40000 | 9 | 3 | <0.001 | 6 | 10 | 0.235 |
| PRDX4-3 | 5.6 | 3.4 | 5.6 – 20000 | 3.4 – 20000 | 12 | 4 | <0.001 | 10 | 10 | 0.944 |
| AV | 10 | 4 | 10 | 10 | ||||||
The intra-CV and inter-CV were calculated as the average CV across eight antibody concentrations.
To demonstrate the feasibility of using the MiNC method with high-density protein microarrays for the discovery of antibody based biomarkers, we fabricated the protein microarrays consisting of 849 TB proteins (Figure 4). We analyzed the immunological response to these proteins using pooled sera from Mtb challenged guinea pigs without (n=6) and with rBCG (n=7), a recombinant mycobacterial vaccine, immunization. The experiment was repeated three times. The raw data was normalized by subtracting the background, estimated by the first quartile of nonspot controls (features with the same chemistry but not producing protein), and dividing by the median excess intensity of non-control spots. Calibrated data were calculated using a three parameter logistic curve, f(x) = a(1 − e−bx)c and normalized similarly. We applied SAM (11) to both the raw and calibrated log-transformed normalized data to identify the antibodies elevated in rBCG vaccinated guinea pig group compared to the non-vaccinated group. With a SAM delta value of 1.9 and an estimated false discovery rate of 0, the raw intensity enabled the identification of 16 antibody candidates (Figure 5A). Using the calibrated data, 35 candidates were identified (Figure 5B and Table S1). Of note, 10 candidates identified from the raw intensity data were also identified from the MiNC calibrated data. Similar results were found using Welch’s t-test in place of SAM analysis. (Figure S2 and Table S2). Although it is unknown whether the set of candidates from MiNC is actually better than the set without MiNC, the identification of a larger number of candidates with MiNC is consistent with the improved performance of antibody assay with MiNC (Figure 5C). These results reveal that our MiNC method can be used with protein microarrays and has the potential to identify more antibody biomarkers candidates.
Figure 4. Quality control of NAPPA microarrays with 849 TB genes.

Expression clones encoding the target proteins fused to a C-terminal GST tag were printed along with a polyclonal anti-GST antibody in duplicate on the array surface. DNA capture was confirmed by PicoGreen (PG) staining (DNA, left), in situ protein expression and capture were assessed by GST detection using a monoclonal antibody (protein, middle). The correlation of duplicate spots in one slide (upper right) and between two different slides (lower right) is 0.96 and 0.81, respectively (GST color code: red>orange>yellow>green>blue).
Figure 5. Identification of antibodies with significantly elevation in rBCG vaccinated guinea pig group using Significant Analysis for Microarray algorithm.

(A) and (B) are the identified antibodies with significant increased levels in rBCG vaccinated than non-vaccinated guinea pig group using the data without and with MiNC, respectively. The serological analysis was performed using protein microarrays displaying 849 TB proteins and probed with serum from M. tuberculosis challenged guinea pig TB models without (NON) and with rBCG immunization. The experiment was repeated three times and the statistical analysis was performed using Significant Analysis for Microarray algorithm with the delta value of 1.9 and an estimated false discovery rate of 0. The color from blue to black to yellow corresponds to the normalized value from low to median to high. The gray is the signal below the first quartile of nonspot controls. (C)The graphs of 100% stacked column show the percentage of signal noise contributed by duplicate spots in high-density TB protein microarrays. The x-axis represents all genes in the array, and y-axis represents the variations of signal intensity between the duplicate of each gene.
The ideal antibody assay must be sensitive, reliable and detect signals across a large dynamic range. In this work, we addressed these issues using the developed MiNC method and showed its advantages for antibody assays with protein microarrays. First, in traditional sandwich ELISA or multiplexed sandwich immunoassays, non-linear fitting curves from protein standards are routinely used as a quantification method. However, the issue of non-specific bindings between capture and secondary detection antibodies limit the number of targets that can be accurately quantified to less than 30–50 (25–26). This limitation can be overcome with protein microarrays, in which the use of high-quality fluorescein labeled detection antibody can specifically recognize all antibodies that are captured by their corresponding antigens on microarray spots (27). The binding of antibodies to their targets is clearly non-linear. Linear curve fitting will provide accurate prediction in the mid-range of the binding curves, where it is most linear, but predictions will fail at the high and low end of the curve. Thus, utilizing a nonlinear curve to resolve the linear limit of the assay enables the accurate interpolation of signal intensities for quantifying binding antibody at the extreme ends of the curve, effectively expanding the range of accurate predictions. So with MiNC we are not only able to answer the question of whether an antibody biomarker increased or not with a p-value but also to provide detailed information regarding the change of biomarker abundance during the development of diseases. This information is especially valuable for the early detection and therapeutic treatment of the diseases.
Second, calibration increased the linear portion of the dynamic range of the antibody assay, which facilitated better comparison of data across different serum samples(28). Linearity is limited without MiNC because the slope of the standard curve changes with the increase of signals using raw fluorescent intensity.
Third, the multiplex antibody assay using MiNC has better reproducibility due to its smaller variations within arrays. The decreased variations also improve the subsequent statistical analysis and can lead to the identification of potential antibody biomarkers that are missed because of background noise in the discovery stage. These putative targets could increase the opportunity to be validated with independent sera samples and confirmed as real biomarkers (29).
And finally, we found that the influences of printed slide position and different serum on the IgG standard were minimal, indicating that the IgG standard is robust, independent of the assay and that the standard curve can be reliably reproduced. The low-cost, easy-availability and good quality of IgG molecules make it an ideal standard to be used to predict the number binding antibodies and compare data between different experiments or even from different labs.
The MiNC method helps to correct for many of the variations that might be introduced during processing of the arrays. These include decreasing the variations in reagents preparation, array processing and detection. However, it cannot prevent variation from array fabrication and performance will always depend on the quality of the fabricated protein microarrays. The printing of IgG standards in parallel with the samples and calibration process will slightly increase the time and number of steps needed for array preparation and data processing and if primary antibodies are from more than one isotype, such as the multiple detection of IgG, IgM and IgA antibodies simultaneously(30).
Altogether, we expect that our cumulative results will provide scientists with a new appreciation of antibody assays with protein microarrays. Our MiNC method has potential to be widely employed in the biomedical research with multiplexed antibody assays which has the quantitation need, such as the discovery of antibody or autoantibody biomarkers, clinical diagnostics with multi-antibody signatures and construction of immune mathematical models with system biology.
Supplementary Material
Acknowledgments
We thank Mike Gaskin, Jason Steel and other members of our laboratory for helpful discussion and technical assistance. We thank David N. McMurray and Christine Tetzlaff of Texas A&M Health Science Center, College Station Tx, for providing the guinea pig serum. This project was supported by National Institutes of Health/National Institute of Allergy and Infectious Diseases R01AI096213 and Early Detection Research Network 5U01CA117374. This paper is subject to the NIH Public Access Policy.
Footnotes
Competing interests
The authors declare no competing financial interests.
Two supplementary figures and two supplementary tables.
References
- 1.Michaud GA, Salcius M, Zhou F, Bangham R, Bonin J, Guo H, Snyder M, Predki PF, Schweitzer BI. Analyzing antibody specificity with whole proteome microarrays. Nat Biotechnol. 2003;21:1509–1512. doi: 10.1038/nbt910. [DOI] [PubMed] [Google Scholar]
- 2.Zhu H, Hu S, Jona G, Zhu X, Kreiswirth N, Willey BM, Mazzulli T, Liu G, et al. Severe acute respiratory syndrome diagnostics using a coronavirus protein microarray. Proc Natl Acad Sci U S A. 2006;103:4011–4016. doi: 10.1073/pnas.0510921103. [DOI] [PMC free article] [PubMed] [Google Scholar]
- 3.Prechl J, Papp K, Erdei A. Antigen microarrays: descriptive chemistry or functional immunomics? Trends Immunol. 2010;31:133–137. doi: 10.1016/j.it.2010.01.004. [DOI] [PubMed] [Google Scholar]
- 4.Brennan DJ, O’Connor DP, Rexhepaj E, Ponten F, Gallagher WM. Antibody-based proteomics: fast-tracking molecular diagnostics in oncology. Nat Rev Cancer. 2010;10:605–617. doi: 10.1038/nrc2902. [DOI] [PubMed] [Google Scholar]
- 5.Kunnath-Velayudhan S, Salamon H, Wang HY, Davidow AL, Molina DM, Huynh VT, Cirillo DM, Michel G, et al. Dynamic antibody responses to the Mycobacterium tuberculosis proteome. Proc Natl Acad Sci U S A. 2010;107:14703–14708. doi: 10.1073/pnas.1009080107. [DOI] [PMC free article] [PubMed] [Google Scholar]
- 6.Hanash SM, Pitteri SJ, Faca VM. Mining the plasma proteome for cancer biomarkers. Nature. 2008;452:571–579. doi: 10.1038/nature06916. [DOI] [PubMed] [Google Scholar]
- 7.Sharp V, Utz PJ. Technology insight: can autoantibody profiling improve clinical practice? Nat Clin Pract Rheumatol. 2007;3:96–103. doi: 10.1038/ncprheum0404. [DOI] [PubMed] [Google Scholar]
- 8.Yu X, Schneiderhan-Marra N, Joos TO. Protein microarrays for personalized medicine. Clin Chem. 2010;56:376–387. doi: 10.1373/clinchem.2009.137158. [DOI] [PMC free article] [PubMed] [Google Scholar]
- 9.Ramachandran N, Raphael JV, Hainsworth E, Demirkan G, Fuentes MG, Rolfs A, Hu Y, LaBaer J. Next-generation high-density self-assembling functional protein arrays. Nat Methods. 2008;5:535–538. doi: 10.1038/nmeth.1210. [DOI] [PMC free article] [PubMed] [Google Scholar]
- 10.Ramachandran N, Hainsworth E, Bhullar B, Eisenstein S, Rosen B, Lau AY, Walter JC, LaBaer J. Self-assembling protein microarrays. Science. 2004;305:86–90. doi: 10.1126/science.1097639. [DOI] [PubMed] [Google Scholar]
- 11.Tusher VG, Tibshirani R, Chu G. Significance analysis of microarrays applied to the ionizing radiation response. Proc Natl Acad Sci U S A. 2001;98:5116–5121. doi: 10.1073/pnas.091062498. [DOI] [PMC free article] [PubMed] [Google Scholar]
- 12.Yu Z, Liu L, Yu X, Chi J, Han H, Liu Y, He W, Sun Q, et al. High-throughput antibody generation using multiplexed immunization and immunogen array analysis. J Biomol Screen. 2010;15:1260–1267. doi: 10.1177/1087057110380045. [DOI] [PubMed] [Google Scholar]
- 13.Saeed AI, Sharov V, White J, Li J, Liang W, Bhagabati N, Braisted J, Klapa M, et al. TM4: a free, open-source system for microarray data management and analysis. Biotechniques. 2003;34:374–378. doi: 10.2144/03342mt01. [DOI] [PubMed] [Google Scholar]
- 14.Mezzasoma L, Bacarese-Hamilton T, Di Cristina M, Rossi R, Bistoni F, Crisanti A. Antigen microarrays for serodiagnosis of infectious diseases. Clin Chem. 2002;48:121–130. [PubMed] [Google Scholar]
- 15.Monroe MR, Reddington AP, Collins AD, LaBoda C, Cretich M, Chiari M, Little FF, Unlu MS. Multiplexed method to calibrate and quantitate fluorescence signal for allergen-specific IgE. Anal Chem. 2011;83:9485–9491. doi: 10.1021/ac202212k. [DOI] [PMC free article] [PubMed] [Google Scholar]
- 16.Bombaci M, Grifantini R, Mora M, Reguzzi V, Petracca R, Meoni E, Balloni S, Zingaretti C, et al. Protein array profiling of tic patient sera reveals a broad range and enhanced immune response against Group A Streptococcus antigens. PLoS One. 2009;4:e6332. doi: 10.1371/journal.pone.0006332. [DOI] [PMC free article] [PubMed] [Google Scholar]
- 17.Findlay JW, Dillard RF. Appropriate calibration curve fitting in ligand binding assays. AAPS J. 2007;9:E260–267. doi: 10.1208/aapsj0902029. [DOI] [PMC free article] [PubMed] [Google Scholar]
- 18.Gottschalk PG, Dunn JR. The five-parameter logistic: a characterization and comparison with the four-parameter logistic. Anal Biochem. 2005;343:54–65. doi: 10.1016/j.ab.2005.04.035. [DOI] [PubMed] [Google Scholar]
- 19.Plikaytis BD, Turner SH, Gheesling LL, Carlone GM. Comparisons of standard curve-fitting methods to quantitate Neisseria meningitidis group A polysaccharide antibody levels by enzyme-linked immunosorbent assay. J Clin Microbiol. 1991;29:1439–1446. doi: 10.1128/jcm.29.7.1439-1446.1991. [DOI] [PMC free article] [PubMed] [Google Scholar]
- 20.Fong Y, Wakefield J, De Rosa S, Frahm N. A Robust Bayesian Random Effects Model for Nonlinear Calibration Problems. Biometrics. 2012 doi: 10.1111/j.1541-0420.2012.01762.x. [DOI] [PMC free article] [PubMed] [Google Scholar]
- 21.Jones G, Kawabata E. A restricted b-spline basis for S-shaped calibration curves. Chemometrics. 2012;26:416–422. [Google Scholar]
- 22.Ramachandran N, Anderson KS, Raphael JV, Hainsworth E, Sibani S, Montor WR, Pacek M, Wong J, et al. Tracking humoral responses using self assembling protein microarrays. Proteomics Clin Appl. 2008;2:1518–1527. doi: 10.1002/prca.200800034. [DOI] [PMC free article] [PubMed] [Google Scholar]
- 23.Kattah MG, Alemi GR, Thibault DL, Balboni I, Utz PJ. A new two-color Fab labeling method for autoantigen protein microarrays. Nat Methods. 2006;3:745–751. doi: 10.1038/nmeth910. [DOI] [PubMed] [Google Scholar]
- 24.Olle EW, Sreekumar A, Warner RL, McClintock SD, Chinnaiyan AM, Bleavins MR, Anderson TD, Johnson KJ. Development of an internally controlled antibody microarray. Mol Cell Proteomics. 2005;4:1664–1672. doi: 10.1074/mcp.M500052-MCP200. [DOI] [PubMed] [Google Scholar]
- 25.Haab BB, Geierstanger BH, Michailidis G, Vitzthum F, Forrester S, Okon R, Saviranta P, Brinker A, et al. Immunoassay and antibody microarray analysis of the HUPO Plasma Proteome Project reference specimens: systematic variation between sample types and calibration of mass spectrometry data. Proteomics. 2005;5:3278–3291. doi: 10.1002/pmic.200401276. [DOI] [PubMed] [Google Scholar]
- 26.Ellington AA, I, Kullo J, Bailey KR, Klee GG. Antibody-based protein multiplex platforms: technical and operational challenges. Clin Chem. 2010;56:186–193. doi: 10.1373/clinchem.2009.127514. [DOI] [PMC free article] [PubMed] [Google Scholar]
- 27.Jeong JS, Jiang L, Albino E, Marrero J, Rho HS, Hu J, Hu S, Vera C, et al. Rapid identification of monospecific monoclonal antibodies using a human proteome microarray. Mol Cell Proteomics. 2012;11:O111 016253. doi: 10.1074/mcp.O111.016253. [DOI] [PMC free article] [PubMed] [Google Scholar]
- 28.Rifai N, Gillette MA, Carr SA. Protein biomarker discovery and validation: the long and uncertain path to clinical utility. Nat Biotechnol. 2006;24:971–983. doi: 10.1038/nbt1235. [DOI] [PubMed] [Google Scholar]
- 29.Mischak H, Apweiler R, Banks RE, Conaway M, Coon J, Dominiczak A, Ehrich JH, Fliser D, et al. Clinical proteomics: A need to define the field and to begin to set adequate standards. Proteomics Clin Appl. 2007;1:148–156. doi: 10.1002/prca.200600771. [DOI] [PubMed] [Google Scholar]
- 30.Renault NK, Gaddipati SR, Wulfert F, Falcone FH, Mirotti L, Tighe PJ, Wright V, Alcocer MJ. Multiple protein extract microarray for profiling human food-specific immunoglobulins A, M, G and E. J Immunol Methods. 2011;364:21–32. doi: 10.1016/j.jim.2010.10.004. [DOI] [PubMed] [Google Scholar]
Associated Data
This section collects any data citations, data availability statements, or supplementary materials included in this article.