Abstract
Dithiocarbamates (dtcs) have been implicated as important gold-binding groups in molecular electronics. Dtcs have two alkane branches connected at a single anchoring point that has a bidentate resonance structure. Forming readily in situ by the combination of secondary amines and CS2, dtcs adsorb quickly onto gold surfaces. Electroactive self-assembled monolayers (eSAMs) were prepared by the coadsorption of ferrocene dialkyldithiocarbamates (Fc dtcs) with diluent dtcs on gold electrodes. Short and long alkane chains were used (11 and 16 methylene groups, respectively), and a polar ester group was incorporated. Cyclic voltammetry (CV) shows that the electrochemistry is quasi-reversible. At high surface coverage, the peak separations and full widths at half-maximum for Fc dtcs deviate from theoretical values and are analogous to that of ferrocene alkane thiols on gold at high surface coverage. Importantly, these features do not change at low Fc dtc surface coverage as observed for ferrocene alkane thiols. Ferrocene dtcs were used to label monolayer defect sites and to demonstrate the exchange of surface-bound dtcs with solution dtcs. Finally, the rate of electron transfer was analyzed using Tafel plots and ac voltammetric methods. The results for both techniques are consistent with a kinetically disperse population of redox sites. The length of the diluent alkane chain appears to have an effect on the distribution of electron-transfer rates, likely because of the eSAM structure. This work indicates that structurally, Fc dtc eSAMs are fundamentally different from alkane thiol SAMs on gold.
Introduction
Since the discovery of electroactive self-assembled monolayers (eSAMs) of alkane thiols on gold, these materials have been used in the investigation of electron transfer. Specific areas of research include long-range electron transfer (ET) kinetics,1–4 photosynthetic models,5,6 electrochemical biosensors7–12 and the development of molecular wires.13–17 eSAMs are currently employed in the electronic detection of single nucleotide polymorphisms (Osmetech, Pasadena, CA).18,19 Typically, the redox species in an eSAM is tethered to a gold electrode via an organic linker and is anchored by a gold-thiolate bond. The redox species are often laterally separated from one another by diluent alkane thiols.
According to Marcus theory, the rate of electron transfer (ET) between a donor (D) and an acceptor (A) is dependent on the driving force, the electronic coupling, the reorganization energy, and the temperature.20 Structurally well-defined eSAMs are constructs that allow the positioning of a redox species such as ferrocene at a fixed distance from the gold surface. The electron-transfer distance and pathway can be controlled, allowing eSAMs to be used to probe electron-transfer kinetics as a function of distance, electronic coupling, and temperature. For thiol systems, the electron-transfer rate is directly affected by the number of atoms in the alkane chain linker.3 The effects of changing the length and nature of the organic linker or the diluent alkane thiols on the ET kinetics have been established.1–3,15,17,21,22
Since the earliest report by Chidsey, a number of researchers have used electrochemistry to investigate the electron-transfer kinetics of many types of eSAMs. Electrochemical methods including chronoamperometry (CA) and cyclic voltammetry (CV) can be used to generate Tafel plots (ln kapp vs overpotential). Experimentally, using CV or CA, an overpotential (η) is applied, resulting in an apparent rate constant, kapp, which is used to generate the Tafel plot. Apparent cathodic and anodic rate constants are calculated as a function of overpotential for electron transfer between a redox-active molecule and a metal electrode using Marcus density-of-states theory (1). The ET rate at a given overpotential is calculated via numerical integration of donor and acceptor levels over a range of energies ε, which is the energy level relative to the Fermi energy level of a metal (1).1 The experimental data are fit to 1 to determine the standard rate constant (the rate at zero overpotential, k0), the electronic coupling, and the reorganization energy.
In 1, the Fermi function f (ε) of the metal gives the probability that a given available electron energy state will be occupied at a given temperature.23 The density of states of the metal, ρ(ε), is assumed to be constant over the range of energies used to evaluate the integral because the density of states varies slowly near the Fermi level.24 The distribution of electron acceptor levels of the redox center is represented by a Gaussian function Dox(ε), the width of which is defined by the reorganization energy. The preintegral factor, A, includes factors such as electronic coupling, the probability of tunneling through an electronic barrier, and the surface coverage of redox-active sites.
| (1) |
To investigate outer-sphere effects on ET, the molecular environment of the redox species must be carefully controlled because the molecular environment of the redox species has a significant effect on the kinetics of ET.25–30 Mixed monolayers incorporating a wide variety of functionalities have been used to study the effects on ET kinetics. For example, an odd-even effect has been reported, linking the structure of the eSAM to the rate of ET.3,31,32 Terminal hydrogen-bonding groups can provide an alternate pathway for ET. Controlling the structure of mixed monolayers is not straightforward. Alkane thiols have the ability to migrate on the gold surface, contributing to phase segregation when mixing alkane thiols of different lengths or terminal functionality.33–38 Asymmetric disulfides have been investigated as a route to mixed monolayers; the S-S bond is broken at the gold surface, and the two halves act as separate entities.39–41
SAM defects complicate electrochemical studies of ET and are caused by a variety of factors. Pinholes and collapsed sites in SAMs are related to atomic features on the gold surface (crystalline domains, terraces, holes, and steps) or to the alkane thiol chain length and headgroup size.42 Defects can be addressed by using long adsorption times,4,32,43 long-chain alkane thiols,1,44 and thermal annealing procedures.27,28 Surface characterization techniques such as ellipsometry, contact angle goniometry, polarization modulation infrared reflection-absorption spectroscopy (PM-IRRAS), scanning microscopy, and atomic force microscopy (AFM) are traditionally used to describe the macroscopic character of the monolayer.42
Defects on the nanometer scale are difficult to discern using scanning techniques whereas electrochemical techniques are very sensitive to the smallest monolayer defects.45,46 Ferrocene alkane thiols have been used to electrochemically label labile, or “fast exchange”, sites.46 Lennox et al. have shown that cyclic voltammetry can be used to distinguish collapsed sites electrochemically from pinhole defects using a ferrocene label.47,48
Cyclic voltammetry of eSAMs is very sensitive to the structure and dynamics of the SAM. Ideal, reversible behavior can be identified by symmetric peaks, zero peak splitting (ΔEp) at low scan rates, and a linear relationship between the peak current and scan rate. The charging current is sensitive to the overall order of the eSAM (e.g., a disordered SAM allows electrolyte penetration, increasing the capacitive current). The peak shape, described by the fwhm, is defined as 3.53RT/nF (90.6 mV at 25 °C). If the population of redox sites is disordered such that the distance between the population of redox sites and the electrode can be described by a distribution of values, then the peak shape deviates from the theoretical description. A mathematical model of this spatial inhomogeneity indicates that broad and asymmetric peak shapes would be observed in the CV.49
Loosely packed SAMs have advantages in a variety of electrochemical applications. Reversible electrochemical switching has been reported for a system based on loosely packed monolayers. In this case, large dynamic changes in interfacial properties are observed in response to the application of an electric potential.50 The molecular conformation of PEG-terminated monolayers in the PEG correlates with the ability of these films to resist protein adsorption; the less ordered PEG monolayers are more protein-resistant.51–53 Kraatz and co-workers have reported electrochemical biosensor constructs based on short alkane and peptide-based thiol monolayers.11,12,54–56
The surface chemistry of dialkyldithiocarbamates (dtcs) has recently attracted significant interest. dtcs are sulfur-containing functional groups that bind tightly to transition metals, including gold surfaces.57 dtcs have two alkane branches connected at a single anchoring point that has a bidentate resonance structure. The versatility of in situ dtc formation by a combination of amines and CS2 has been illustrated.58,59 Using lithium dialkyldithiocarbamate salts, Weinstein and co-workers have shown that monolayers of lithium dioctadecyldithiocarbamate have very similar thickness, crystallinity, wettability, and capacitance to octadecanethiol.60 The dtc-gold bond is stable over a wide range of pH and is not disrupted in the presence of alkane thiols.58
Early work by Frisbie et al. showed that electroactive dtcs can be attached to electrodes, but the electron-transfer kinetics were not studied.61 Recently, theoretical and experimental work has indicated that dtcs may be valuable tools in the burgeoning field of molecular electronics.62–64 Morf and co-workers have used XPS, cyclic voltammetry, and scanning tunneling microscopy to show that the chemisorption of dtcs results in compact monolayers that are characteristically different from thiol analogs.65 Three-dimensional materials consisting of dtc-linked nanoparticles have intriguing optical and electronic properties in comparison to their thiol analogs, which is evidence that the molecular junction has a significant influence on the bulk properties.63,64 The bidentate dtc appears to form a resonant system that may include the direct overlap of molecular and metal states.
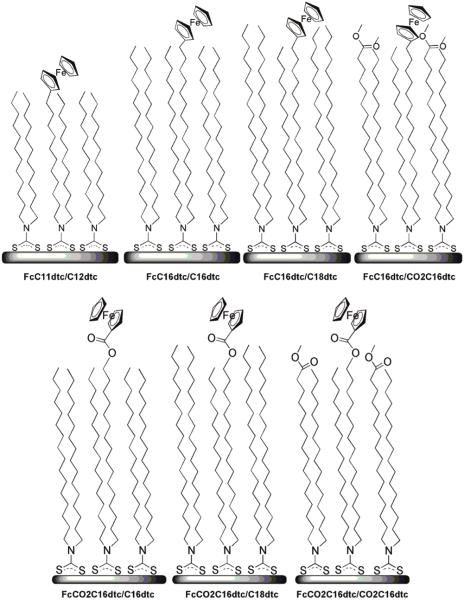
Our investigation of dtc eSAMs is prompted by our interest in the effects of the molecular environment on ET kinetics10 as well as the relevance of dtcs to single-molecule electronics. We have chosen to use the electrochemistry of ferrocene-terminated dithiocarbamate self-assembled monolayers (Fc dtc eSAMs) (Figure 1). As shown in Figure 1, the Fc dtc compounds used here were designed as analogs to published ferrocene-terminated alkane thiols and are studied in the absence and presence of diluent dtcs.66 The Fc dtcs form in situ and assemble on gold by the addition of CS2 to amines. The dtcs studied have 11 and 16 methylene groups to probe the effect of alkyl chain length on ET kinetics. We have investigated the effect of headgroups (polar vs nonpolar) on the electrochemistry and exchange with solution dtcs. The electron-transfer kinetics were studied using CV and ac voltammetric methods.
Figure 1.
Ideal configuration of ferrocene dithiocarbamate eSAMs on a gold surface. Top (Left to Right): FcC11dtc/C12dtc, FcC16dtc/C16dtc, FcC16dtc/C18dtc, and FcC16dtc/CO2C16dtc. Bottom (Left to Right): FcCO2C16dtc/C16dtc, FcCO2C16dtc/C18dtc, and FcCO2C16dtc/CO2C16dtc.
Experimental Section
General Procedure for Secondary Amines
Synthesis of C16, CO2C16, FcC11, FcC16, and FcCO2C16
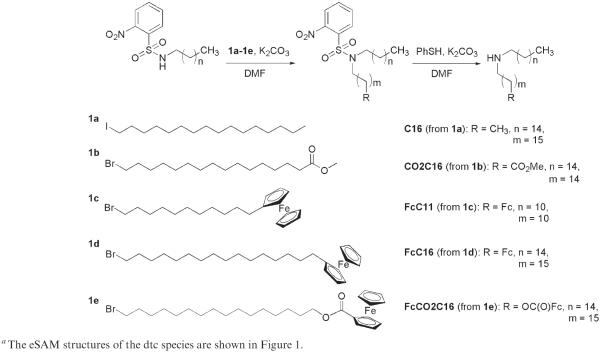
The secondary amines were synthesized and purified according to the following general procedure.67 Nosyl chloride was added to a solution of the alkyl amine (1.1 equiv) and NEt3 (1 equiv) in CH2Cl2 at 0 °C and stirred for 1 h at 0 °C and 1 h at RT. The solution was concentrated and washed through a pad of silica using CH2Cl2. Equimolar amounts of the Ns-protected amine and the alkyl halide (1a–1e in Scheme 1)66,68 and 3.5 equiv of K2CO3 were combined. DMF was added, and the reaction was allowed to stir at RT overnight. The product was purified by silica gel column chromatography (10:1 hexanes/EtOAc). The typical yield was 70%. The Ns-protected secondary amine, DMF, and 2 equiv of K2CO3 were combined in a Schlenk flask under argon. Thiophenol (3 equiv) was added, and the reaction was followed by TLC. Typically, the reaction was complete in 3 h. The solvent was removed under vacuum, and the product was purified by silica gel column chromatography (10:1 CH2Cl2/MeOH). All compounds gave satisfactory ESI mass spectra and NMR spectra.
Scheme 1.
Synthesis of secondary amines C16, CO2C16, FcC11, FcC16, and FcCO2C16a
Preparation of Electrodes
Electrode-Modification Procedure
A 7 cm length of gold wire (0.127 mm diameter, 99.99% metals basis, Alfa Aesar Premion) was cut. Two centimeters of this wire was melted into a sphere with a 5 cm stem using a Bunsen burner flame. The diameter of the sphere was measured using digital microcalipers. The electrode was electrochemically cleaned in 1 M H2SO4 by scanning at 0.5 V/s from 0 to 1.6 V until the trace was constant (~200–300 scans). The electrode was immediately washed with water and ethanol and immediately immersed in the amine/CS2 solution. (CAUTION! CS2 is volatile and flammable and may be harmful if inhaled or absorbed through the skin. CS2 should be handled only in a fume hood.) The electrodes were rinsed with ethanol and water before being placed in a 1 M HClO4/0.1 M NaCl electrolyte solution for electrochemical measurements. Whereas part of the electrode stem was immersed in the monolayer solution, only the spherical part of the electrode was immersed in the electrolyte solution for the electrochemical measurements.
Mixed versus Resoak Preparation
The terms “mixed” and “resoak” refer to two different approaches to forming Fc dtc eSAMs. For the mixed case, stock solutions of ferrocenyl amines and diluent amines were prepared and mixed in specific ratios (1:1, 1:3, 1:9; total concentration 1 mM 10% CS2 v/v). Electrodes were soaked in these solutions for 24–48 h.
For the resoak case, a stock solution of the diluent amine was prepared and diluted to 1 mM 10% CS2. The electrodes were soaked in this solution for 16–24 h. A stock solution of the ferrocenyl amine was prepared and diluted to the desired concentration of 0.5 mM 10% CS2. The electrodes were taken out of the diluent dtc solution, rinsed with ethanol, and then placed in the ferrocene dtc solution for 16–24 h.
Electrochemistry
Cyclic voltammograms and ac voltammograms were recorded on a CHI660a electrochemical analyzer with a Ag/AgCl (1 M HClO4/0.1 M NaCl) reference and platinum wire counter electrode in aqueous 1 M HClO4/0.1 M NaCl. Water used for preparation of aqueous solutions was purified with a Milli-Q ion-exchange system.
CV Analysis
Cyclic voltammograms (CVs) were measured at 0.1, 1, 10, 50, 100, 250, 500, 715, 1000, 1250, 1667, 2500, 5000, 10 000, and 20 000 V/s. The Ep values were calculated with the CHI660a software. E1/2 was calculated as the sum of the cathodic and anodic peak potentials divided by 2, (Epc + Epa)/2. The fwhm was determined manually from the 100 mV/s CV. The coverage was calculated from Q, the amount of charge passed (integrated peak area divided by the scan rate). The capacitance was calculated from the charging current in a region of the CV with no ferrocene redox activity.
ACV Analysis. ac voltammograms were recorded at 1, 2, 5, 10, 20, 50, 100, 200, 303, 500, 1000, 2000, 3333, 5000, and 10 000 Hz. The sample period was 1.1 s. The potential increment was 0.004 V, and the amplitude was 0.025 V. The peak height and background were determined using the CHI660a software. The ratio of the peak current to the background current (ip/ib) was plotted versus the log of ACV frequency (Hz) and was fit to the equivalent circuit model according to the literature.69 The capacitance, solution resistance, coverage, and electrode surface area were measured and used as inputs in the spreadsheet.
Results and Discussion
System Design and Synthesis
Ferrocene is widely used because of its reversible electrochemistry and synthetic convenience.70 Ferrocene alkyl secondary amines (FcC11, FcC16, and FcCO2C16) and diluent amines (C12, C16, C18, and CO2C16) were designed as analogs to the ferrocene alkyl thiols studied by Chidsey in his seminal work of 1990.66 The ferrocene-containing amines, C16 and CO2C16, were synthesized as shown in Scheme 1. Commercially available amines such as CH3(CH2)10NH2 were first protected using NsCl, and ferrocenyl alkyl bromides were prepared according to literature procedures.67,68 Alkylation of the sulfonamide and deprotection of the amine were accomplished according to literature procedures.67 These secondary amines are readily converted to dithiocarbamates in situ by the addition of CS2.
Two lengths (FcC11 and FcC16) were chosen to compare the effect of chain length on the rate of ET. It has been suggested that a polar group stabilizes the Fc at the monolayer—aqueous interface, so FcCO2C16 was designed to examine the effects of including a polar group.66
C12 and C18 amines are comparable in length to alkane thiols that are commonly used for eSAM electron-transfer studies. C12dtc and C16dtc match the lengths of FcC11dtc and FcC16dtc, respectively, such that Fc is exposed in both cases. C18dtc is two atoms longer than FcC16dtc but matches FcCO2C16dtc. CO2C16dtc was designed to incorporate a polar group into the diluent.
Assembly on Gold
Diluents C12, C18, and CO2C16
To test the in situ formation of dtcs on gold, electrodes were exposed to 1 mM solutions (EtOH, 10% CS2 v/v) of C12, C18, or CO2C16. The monolayers were allowed to form for 16–24 h, after which the charging current was measured using cyclic voltammetry and normalized to the electrode surface area (Table 1). The charging current was estimated from voltammetric charging currents at potentials more negative than the ferrocene wave in order to compare to ferrocene-containing eSAMs.
Table 1.
Capacitance of dtc Monolayers Obtained from Charging Current Dataa
| C12dtc | C18dtc | CO2C16dtc | C11SH | C18SH |
|---|---|---|---|---|
| 7.0 | 2.0 | 2.8 | 4.2 | 1.4 |
The values are reported in 10−6 F/cm2.
The double-layer charging current for C12dtc, C18dtc, and CO2dtc is larger than expected on the basis of thickness. For alkane thiol monolayers on Au(111) in aqueous media, the double-layer capacitance follows simple Helmholtz behavior. For example, the CH3(CH2)10SH monolayer exhibits a double-layer capacitance of 4.2 μF/cm2, whereas the double-layer capacitance for the C12dtc monolayer is 7 μF/cm2. Weinstein and co-workers have presented evidence that the C18dtc SAM is more permeable than the analogous octadecanethiol SAM to penetration by ions. The basis of this disorder may be the bidentate footprint of dtcs and the stronger binding to the gold surface. Due to the strong interaction with gold, the mobility of dtcs on the surface is probably low compared to that of alkane thiols, resulting in less compact packing that in turn allows increased flexibility of the alkane chains. Therefore, we conclude that the capacitance of the dtc monolayers is dominated by ionic permeability rather than the absolute thickness of the layer.
FcC11dtc, FcC16dtc, and FcCO2C16dtc
Bare gold electrodes were exposed to 0.5 mM solutions of FcC11dtc, FcC16dtc, and FcCO2C16dtc for 24 h. The ΔEp (mV), fwhm (mV), and coverage (Γ, mol/cm2) obtained from CVs recorded at 0.1 V/s are summarized in Table S1. In all three cases, the peak separation at 0.1 V/s is >0, ranging from 9 to 26 mV. The peak shapes are not ideal. Shoulders are visible in some cases, although overall the fwhm ranges from 83 to 114 mV, which is near the ideal value of 90.6 mV. Values less than this theoretical number indicate the possibility of lateral electrostatic interactions (either attractive or repulsive) with neighboring charged species or lateral electron transfer. Given the high surface coverage, this is a likely possibility. The coverage ranges from 1.6×10⁻¹⁰ to 2.5×10⁻¹⁰ mol/cm2. The theoretical maximum for alkane thiols (one ferrocene per binding site, assuming spherical ferrocene with a diameter of 6.6 Å and hexagonal close-packed gold atoms) is 4.5×10⁻¹⁰ mol/cm2.71 Fc dtcs presumably occupy two binding sites and have two alkane branches—one with a ferrocene and one built-in diluent alkane—so the theoretical maximum coverage would be half of that expected for ferrocene alkane thiols, or 2.25×10⁻¹⁰ mol/cm2. The coverages obtained are in reasonable agreement with this prediction.
Chain Length and Polar versus Nonpolar Headgroups
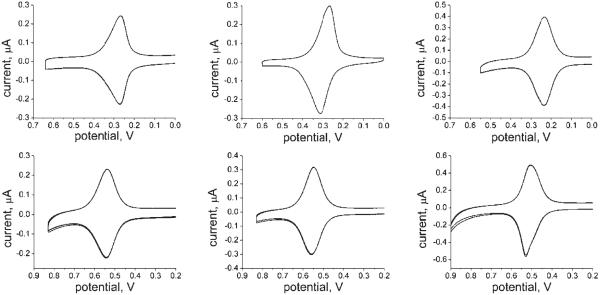
The following seven systems were studied using cyclic voltammetry: FcC11dtc/C12dtc, FcC16dtc/C16dtc, FcC16dtc/C18dtc, FcC16dtc/CO2C16dtc, FcCO2C16dtc/C16dtc, FcCO2C16dtc/C18dtc, and FcCO2C16dtc/CO2C16dtc (Figure 1). Three ratios of Fc dtc/diluent dtc were studied (1:1, 1:3, and 1:9) for each case. The E1/2 values are summarized in Table 2. The diluent dtc has a small effect on E1/2. Literature values (1 M HClO4 vs Ag/AgCl) for Fc(CH2)11SH (225 mV), Fc(CH2)16SH (~200 mV), FcCO2(CH2)16SH (~500 m V) are comparable.4,46,66 The ΔEp, fwhm, and Γ obtained from CVs recorded at 0.1 V/s (Figures 2 and 3) are summarized in Table 3.
Table 2.
Summary of E1/2 Values for Combinations of Fc dtc and Diluent dtca
| diluent dtc |
|||
|---|---|---|---|
| C16dtc | C18dtc | CO2C16dtc | |
| FcC16dtc | 264 | 274 | 247 |
| FcCO2C16dtc | 525 | 530 | 511 |
Values are in mV versus Ag/AgCl. Dtc monolayers were grown from solutions containing 1:9 Fc dtc:diluent dtc, 1 mM total dtc.
Figure 2.
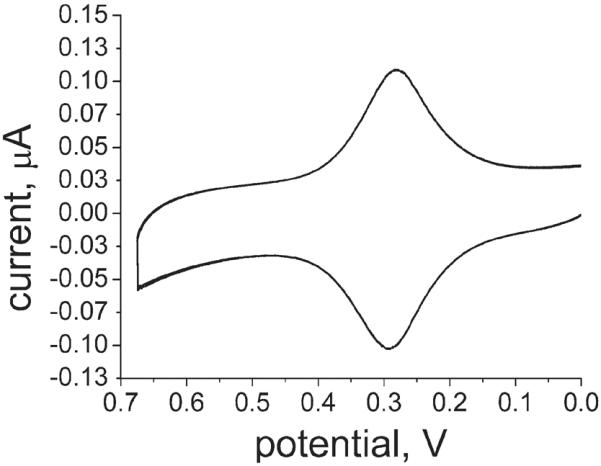
CV at 0.1 V/s for FcC11dtc/C12dtc shows reversible behavior. E1/2 for FcC11dtc/C12dtc was found to be 270 mV vs Ag/AgCl.
Figure 3.
Representative CVs for the six long-chain systems at 0.1 V/s and 1:1 Fc dtc/ diluent dtc. Top (Left to Right): FcC16dtc/C16dtc, FcC16dtc/C18dtc, and FcC16dtc/CO2C16dtc. Bottom (Left to Right): FcCO2C16dtc/C16dtc, FcCO2C16dtc/C18dtc, and FcCO2C16dtc/CO2C16dtc. The FcC16dtc/C18dtc and FcCO2C16dtc/C18dtc cases show the largest peak separation at this scan rate. A narrow fwhm is observed in some cases.
Table 3.
Summary of ΔEp fwhm, and Coverage for All Combinations of Fc dtc and Diluent dtca
| ΔEp (mV) |
fwhm (mV) |
coverage (10 −10 mol/cm2) |
|||||||
|---|---|---|---|---|---|---|---|---|---|
| 1:1 | 1:3 | 1:9 | 1:1 | 1:3 | 1:9 | 1:1 | 1:3 | 1:9 | |
| FcC11dtc/C12dtc | 24 | 25 | 13 | 135 | 140–160 | 160 | 0.6 | 0.2 | 0.06 |
| FcC16dtc/C16dtc | 10 | 10 | 9 | 100–130 | 110–120 | 130–135 | 1.3 | 0.6 | 0.4 |
| FcCO2C16dtc/C16dtc | 8 | 8 | 13 | 97–100 | 100–115 | 95–140 | 1.2 | 0.5 | 0.2 |
| FcC16dtc/C18dtc | 19 | 25 | 26 | 130–160 | 105–130 | 120–150 | 1.2 | 0.6 | 0.3 |
| FcCO2C16dtc/C18dtc | 10 | 24 | 20 | 90–110 | 120–140 | broad | 1.3 | 0.6 | 0.3 |
| FcC16dtc/CO2C16dtc | 4 | 11 | 9 | 93–98 | 135–155 | 130–140 | 2.2 | 0.8 | 0.3 |
| FcCO2C16dtc/CO2C16dtc | 23 | 8 | 13 | 75–110 | 110–140 | 100–120 | 2.0 | 0.7 | 0.2 |
The ratios of Fc dtc/diluent dtc in the deposition solution were 1:1, 1:3, and 1:9. In the case of FcCO2C16dtc/C18dtc (1:9), the CV peaks were too broad to measure accurately.
Coverage
The surface coverage of electroactive species (mol/cm2) is measured by integrating the CV peak area to determine the amount of charge passed. This charge is then normalized to the electrode surface area to give the coverage in mol/cm2. This value is often reported to give an idea of how much of the surface is occupied, which gives an indication of the monolayer packing density. The coverage is correlated to the deposition solution concentration. The theoretical maximum for a ferrocene alkane thiol on Au(111) is 4.5 × 10⁻¹⁰ mol/cm2.
Given that each dtc has two branches and is bidentate on the surface, the predicted coverage for a 1:1 ratio of Fc dtc/diluent dtc should be approximately 25% of a full monolayer, or 1.1 × 10⁻¹⁰ mol/cm2. The combinations with C16dtc and C18dtc diluents are as expected. For 1:3 and 1:9 Fc dtc/diluent dtc, the coverages are on average 0.7 × 10⁻¹⁰ and 0.3 × 10⁻¹⁰ mol/cm2, respectively, similar to the predicted 1/8 and 1/20 (0.6 × 10⁻¹⁰ and 0.2 × 10⁻¹⁰ mol/cm2) of a full monolayer as expected. The FcC16dtc/CO2C16dtc and FcCO2C16dtc/CO2C16dtc coverages are approximately twice the expected value or 50% of a full monolayer. The FcC11dtc/C12dtc case is measurably lower than expected, presumably because of the increased solubilty in ethanol over FcCO2C16dtc and FcC16dtc. The coverage is approximately half the expected value for 1:1, one-third the expected value for 1:3, and one-fifth the expected value for 1:9.
Peak Separation (ΔEp)
For an ideal system where both the oxidized and reduced species are strongly adsorbed to the electrode and the electrochemical reaction is nernstian, the CV peak separation (ΔEp) is theoretically 0 V. ΔEp is related to the electron-transfer rate and increases with scan rate.72 Values greater than 0 V, however, have been observed for long-chain eSAMs even at low scan rates.1 For FcCO2(CH2)16SH, Chidsey reports a ΔEp of 27 mV at 0.1 V/s, corresponding to a low electron-transfer rate as expected for the long C16 chain.66 Notably, the results for the longest-chain systems studied here, FcC16dtc/C18dtc and FcCO2C16dtc/C18dtc, are similar to this value. However, the FcC11dtc/C12dtc system exhibits similar ΔEp values, indicating that the nonzero ΔEp is due to SAM disorder. Combinations including C16dtc and CO2dtc typically exhibited smaller ΔEp values ranging from 4 to 13 mV. At 0.01 V/s, the ΔEp values decrease slightly but do not reach 0 mV, indicating that the redox centers may not be thermodynamically homogeneous. No trend in ΔEp with respect to surface coverage is observed, indicating that the proximity of the ferrocenes to one another does not affect the ΔEp.
Peak Shape
The ideal value of the fwhm, based on theory, is 90.6 mV. The measured fwhm of the CV peak can be used to assess the order of the system. For example, mixed monolayers of ferrocene alkane thiol and unsubstituted alkane thiols show double peaks when the ferrocene coverage is high.73–75 Using diluent alkane thiols with charged termini, the double peaks have been assigned to ferrocene species in two different environments—one in which there are numerous ferrocenes clustered together and one in which the ferrocenes are isolated from one another.47,48 Furthermore, spatial inhomogeneity has been treated using mean-field analysis. This model shows that spreading the redox centers in three dimensions results in broad, asymmetric peak shapes, reflecting a layer-by-layer redox conversion.49
Broad peaks are indicative of thermodynamic/kinetic inhomogeneity whereas narrow peaks are associated with lateral electron transfer as a result of high coverage.48 Both cases have been observed for ferrocene alkane thiols. Both narrow and broad peaks can be caused by electrostatic interactions (attractive or repulsive) among redox sites.76,77 However, no correlation between the Fc dtc/diluent dtc ratio and the peak shape is observed, indicating that the peak shape is not correlated to the proximity of other ferrocene groups. The FcC11dtc/C12dtc system shows fairly large fwhm values ranging from 135 to 160 mV, indicating disorder. FcC16dtc/C16dtc and FcCO2C16dtc/C16dtc fwhm values are typically close to ideal (100–130 mV). The FcC16dtc/C18dtc and FcCO2C16dtc/C18dtc systems exhibited a wide range of fwhm values (100–160 mV), with one case at the lowest coverage too broad to be measured accurately. The FcC16dtc/CO2C16dtc and FcCO2C16dtc/CO2C16dtc systems showed a wide range centered near the ideal value (75–140 mV). Cases of fwhm < 90 mV are attributed to lateral electron transfer or electrostatic interactions between redox groups due to the high surface coverage. In general, systems with the CO2 group have lower fwhm values than those without. This trend is attributed to the polar groups that facilitate the interaction between the otherwise hydrophobic monolayer with the aqueous electrolyte solution, resulting in a more ordered interface.
Importantly, the coverage does not appear to have an effect on the fwhm. The low-coverage cases (1:9) do not have lower fwhm values than the high-coverage cases (1:1), indicating that the proximity of the ferrocenes to one another does not affect the fwhm. The ferrocene terminus is able to “dissolve” in the hydrophobic environment of the dtc SAM, resulting in multiple conformations and variable interactions with the electrolyte solution, leading to the observed broad fwhm values. Alternatively, the dtcs form islands of ferrocene groups upon binding to the gold surface, regardless of the Fc dtc/diluent dtc ratio in the deposition solution.
Exchange
Chidsey found that annealing steps were necessary to obtain ideal electrochemical behavior. He proposed that there are fast-exchange and slow-exchange sites within the eSAM.1 Electroactive species bound in the fast-exchange sites can be easily exchanged with nonelectroactive species such that the electrochemical experiment addresses only redox centers in relatively homogeneous environments. Collard and co-workers further explored this idea using ferrocene alkane thiols with different electrochemical signatures to label exchange sites.46 dtcs are purported to have much stronger binding than thiols on gold. X-ray photoelectron spectroscopy showed no change in the ratio of nitrogen to sulfur on a dtc-modified gold surface upon exposure to thiols.52 This method does not lend itself to the investigation of the exchange of surface-bound dtcs with solution dtcs because the nitrogen/sulfur ratio would not change. Electroactive labeling is the ideal way to investigate whether dtc SAMs have labile sites.
SAMs of diluent dtcs (1 mM C12dtc, C16dtc, or C18dtc) were deposited on freshly prepared gold electrodes for 24 h. The electrode was then scanned electrochemically to provide a background scan. The electrode was exposed to a solution of Fc dtc (0.5 mM FcC11dtc or FcC16dtc) for 24 h and remeasured. In all cases, a significant electrochemical response was observed. Resoaking in diluent dtc overnight (1 mM, 16–20 h) resulted in an average decrease in the coverage of 35% (Figure 4).
Figure 4.
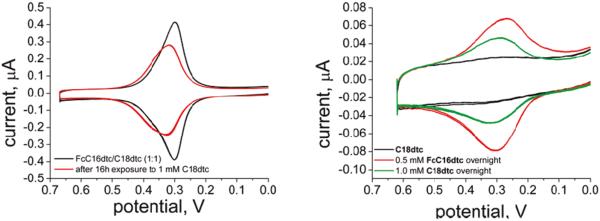
Examples of exchange experiment CVs. (Left) A mixed monolayer of FcC16dtc/C18dtc (black) was exposed to 1 mM C18dtc, resulting in a decrease in coverage (red). (Right) A C18dtc monolayer was formed (black) and exposed to 0.5 mM FcC16dtc, resulting in an electrochemical response (red). This electrode was resoaked in a fresh solution of C18dtc, which resulted in a decrease in coverage (green).
The fact that dtc SAMs incorporate Fc dtcs indicates that the SAM is not fully formed and contains significant defects even after a 24 h period. Alternatively, this result indicates that there is exchange between surface dtcs and solution dtcs. When the diluent-only SAM is exposed to Fc dtc, the Fc dtc fills in the fast-exchange sites that are exchanging readily. Subsequently, these sites exchange with diluent dtc in the second step.
Mixed eSAMs (1:1 FcC11dtc/C12dtc, FcC16dtc/C16dtc, or FcC16dtc/C18dtc) were deposited on freshly prepared gold electrodes for 24 h and measured. The electrode was exposed to a solution of diluent dtc (1 mM C12dtc, C16dtc, or C18dtc) for 24 h and remeasured. The coverage decreases on average 13% (Figure 4). This result is definitive for the exchange of electroactive surface species with solution species. When mixed Fc dtc/diluent eSAMs are exposed to diluent dtc solutions, the decrease in coverage is small because the Fc dtcs are distributed over all sites and are not just bound to the fast-exchange sites.
Electron-Transfer Kinetics
Tafel Plots from Cyclic Voltammetry
Tafel plots can be fit to the Marcus density of states model to determine the electron-transfer rate, reorganization energy, and electronic coupling, with the latter two parameters being of particular interest in our system. Figure 5 shows a Tafel plot for 1:3 FcC16dtc/C16dtc generated from CV data. (Data and fits for the other systems are shown in the Supporting Information.) FcC16dtc has 18 atoms between the ferrocene terminus and the surface-binding sulfur atom. This Fc dtc is directly comparable to Chidsey's FcCO2(CH2)16SH, which also has 18 atoms. The k0 for FcC16dtc is therefore expected to be very similar to that for FcCO2(CH2)16SH (1.25 s−1). The theoretical and experimentally confirmed reorganization energy for ferrocene is approximately 0.8 eV.1
Figure 5.
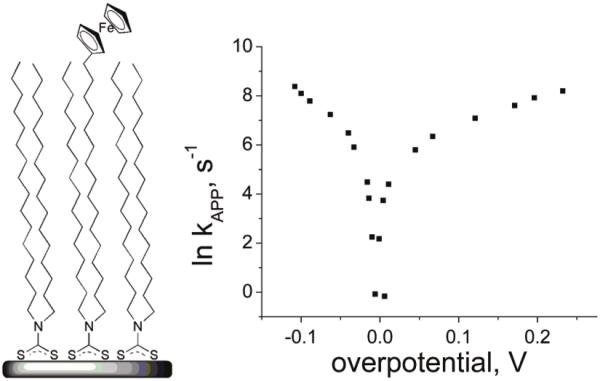
Tafel plot for FcC16dtc/C16dtc. The asymmetry is typical for all dtc cases that were studied.
In general, CVs of the Fc dtc systems resulted in asymmetric Tafel plots, indicating that the barriers to electron transfer for the oxidation and reduction of the ferrocene species are different. This behavior has been observed for osmium and ferrocene complexes attached to electrodes.29,30,78 Asymmetry in the Tafel plots has been attributed to the molecular movement of the redox species on the monolayer surface or penetration of the monolayer by the supporting electrolyte or solvent.78 These phenomena have been observed for monolayers with a high surface coverage of redox species and poorly ordered systems.79
A model describing the effects of disordered systems on Tafel plots was developed by Murray and co-workers.71 A kinetic dispersion can arise from a spread in the formal potentials E0′ of surface ferrocene sites, a spread in the reorganization energies, or a spread in the tunneling distance. In Murray's work, Tafel plots were derived from calculations incorporating either a Gaussian distribution of E0′ or λ as a model of kinetic dispersion. Marcus theory fits of these Tafel plots gave erroneously low values of λ and high values of k0 as compared to the values calculated for a homogeneous population of kinetic sites (single value of E0′ or λ).
The FcC16dtc/C16dtc Tafel plot was fit using the Marcus density of states model. The anodic and cathodic branches were fit separately to give unexpectedly high apparent rate constants of 350 and 100 s−1 for the anodic and cathodic branches, respectively. These values are 2 orders of magnitude higher than for FcCO2(CH2)16SH. Furthermore, the apparent reorganization energies of 0.7 and 0.6 eV are significantly lower than the expected 0.8–0.9 eV. These anomalously high apparent rate constants and low λ values appear to be a manifestation of Murray's predictions. The distributions of E0′ and λ can arise from ion pairing, Fc–Fc interactions, or a distribution of monolayer structures and varying solvation. If the Fc dtc system is disordered as indicated by the nonideal ΔEp, fwhm and capacitance measurements, then these interactions and conditions may be present in the Fc dtc environment. The apparent rate constants and λ values obtained by fitting the Tafel plot almost certainly do not accurately represent the kinetics of electron transfer through the dtc molecule but rather represent the kinetics for a disordered SAM.
ACV Analysis
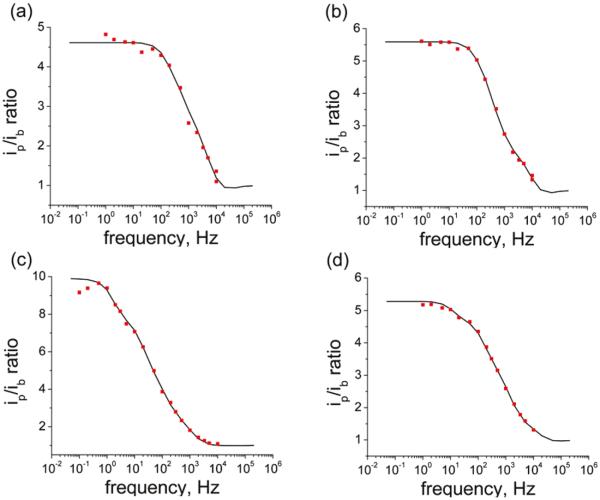
A method of using ac voltammetry to investigate kinetically heterogeneous electron transfer in eSAMs has been described by Creager and co-workers.63,74 A significant advantage of this approach is that the kinetic heterogeneity can be easily identified.69 This method has been used to investigate ferrocene- and ruthenium-based systems.16,80,81 The relationship of the ip/ib to the applied ACV frequency describes the distribution of rates. Creager has developed a method of fitting this ACV data using up to 11 weighted rates.69 A distribution of rates can result in shoulders or shallow slopes for the part of the plot that covers the intermediate frequencies. Simulations are shown in the Supporting Information to illustrate the differences between data for a kinetically homogeneous system and a kinetically disperse system.
We chose to use this method to investigate possible kinetic dispersion in the dtc eSAMs as indicated by the Tafel plot analysis. Representative sets of data for 1:1 FcC11dtc/C12dtc, FcC16dtc/C16dtc, FcC16dtc/C18dtc, and FcC16dtc/CO2C16dtc are shown in Figure 6. The shape of the plots indicates that the results for the Fc dtcs are due to a combination of fast and slow rates. Table 4 and Figure 7 show the distribution of rates for these four cases.
Figure 6.
Representative ACV data plots (red points) and fits (black lines) for (a) 1:1 FcC11dtc/C12dtc, (b) 1:1 FcC16dtc/C16dtc, (c) 1:1 FcC16dtc/C18dtc, and (d) 1:1 FcC16dtc/CO2dtc.
Table 4.
Rate Data Obtained Using the ACV Methoda
| rate (s−1) | FcC11dtc/C12dtc | FcC16dtc/C16dtc | FcC16dtc/C18dtc | FcC16dtc/CO2dtc |
|---|---|---|---|---|
| 0–10 | 0.00 | 0.00 | 0.36 | 0.00 |
| 11–100 | 0.00 | 0.06 | 0.18 | 0.08 |
| 101–1000 | 0.19 | 0.53 | 0.33 | 0.41 |
| 1001–10000 | 0.38 | 0.15 | 0.13 | 0.39 |
| > 10001 | 0.43 | 0.26 | 0.00 | 0.12 |
The slowest components for FcC11dtc/C12dtc and FcC16dtc/C18dtc are similar to literature values for analogous ferrocene alkane thiols. The fast components are due to disordered populations of redox centers (fast kinetic sites).
Figure 7.
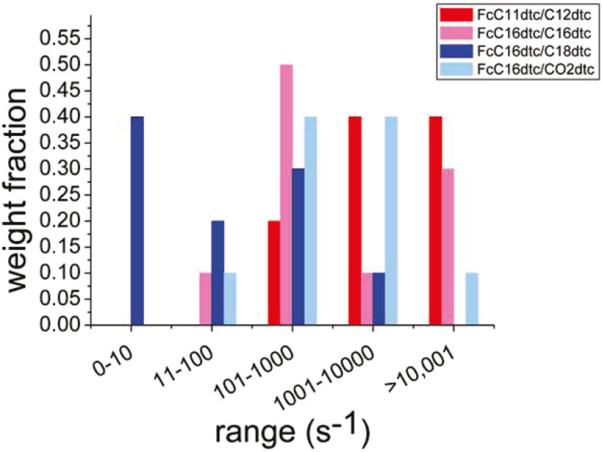
Histogram comparing the average distributions of rates for the four systems as determined using the ACV method. The distribution for the short-chain FcC11dtc/C12dtc (red) is clearly weighted toward higher rates than the distribution for the long-chain FcC16dtc/C18dtc (blue) as expected on the basis of the alkane chain length.
FcC11 and FcC16 were designed to compare the effect of chain length on the rate of electron transfer in Fc dtc eSAMs. Solely on the basis of the length, the short-chain system is expected to have a faster rate than the long-chain system. The closest Fc alkane thiol analog to FcC11dtc (13 atoms) in the literature, FcCONH-(CH2)10SH (12 atoms), has a reported rate of 1200 s−1.29 The rates for FcC11dtc/C12dtc are distributed in a high range, between 1000 and 10 000 s−1. The population of kinetic sites (~20%) behaves as expected, with slow electron transfer (~1000 s−1) through the dtc molecule. There is a significant population (~80%) exhibiting fast electron-transfer kinetics, likely as a result of disordered sites in the eSAM.
The FcC16dtc/C18dtc system shows the slowest rate components (~36% < 10 s−1) of all four systems studied. (Table 4, Figure 7) This rate component is comparable to the rates obtained for analogous ferrocene alkane thiols (1–9 s−1 for 17 to 18 atoms).1,29,74 The FcC16dtc/C16dtc and FcC16dtc/CO2C16dtc systems exhibit distributions of rates with slow components similar to those in the FcC16dtc/18dtc system but contain faster components than found in the FcC16dtc/C18dtc system. This result indicates that the C16dtc and CO2C16dtc diluents result in a more disordered eSAM than C18dtc, consistent with capacitance measurements.
No correlation between the rate distribution and the Fc dtc/diluent dtc ratio could be discerned. In most cases, the data could be fit to the same distribution of rates by adjusting only the surface coverage (Supporting Information). For ferrocene alkane thiols, ideal behavior is typically observed at low surface coverage, when the ferrocene centers are isolated from one another. This difference in behavior between the Fc dtcs and ferrocene alkane thiols demonstrates a fundamental difference in the eSAM structure that affects the electron-transfer kinetics. The alkane thiol eSAMs possess a higher degree of order than does the dtc eSAMs.
For direct comparison of alkane thiol eSAMs to Fc dtc eSAMs, 1:9 FcCONH(CH2)15SH/HO(CH2)16SH was investigated using the ACV method. In our hands, the results were very similar to literature reports of a single electron-transfer rate of 6.6 s−1.32 The ACV ip/ib plot could be fit to this value, although a fit with two rates (85% 6.6 s−1, 15% 40 s−1) was slightly better (Supporting Information).
The observed distributions for the Fc dtcs cover 5 orders of magnitude. The data for the Fc dtcs are clearly due to a distribution of rates and are significantly different from ferrocene alkane thiol data. The fits to the data presented here are generated manually and are not unique solutions. There appear to be significant populations of disordered and ordered redox centers that exhibit fast and slow rates, respectively.
Conclusions
Short- and long-chain ferrocene dithiocarbamates have been synthesized and assembled on gold surfaces. The capacitances (obtained from the charging current) for the dtc monolayers are higher than expected when compared to alkane thiols of similar lengths. The coverage of ferrocene is similar in the dtc system to that of analogous thiol SAMs formed under similar conditions. The electrochemistry is quasi-reversible at low scan rates based on the peak separation and peak shape. Importantly, these features do not improve at low ferrocene surface coverage, as observed for ferrocene alkane thiols. This result indicates that structurally, Fc dtc SAMs are fundamentally different from alkane thiol SAMs on gold.
CV and ACV methods were used to investigate the electron-transfer rate in dtc monolayers. Results from the seven dtc cases show that electron transfer in these systems is best described by a distribution of rates. Monolayers grown with the C18dtc diluent had the slowest rates, indicative of electron transfer through the alkane chain rather than faster, lateral mechanisms across the surface. It has been reported that C18dtc forms crystalline monolayers,60 and our observations are consistent with this report. Of the four diluent dtcs examined, C18dtc and CO2dtc have the lowest capacitances and the slowest components in the observed distributions of electron-transfer rates.
Theory has suggested that the electronic coupling for dtcs is greater than for thiols; therefore, our long-term goal is to determine values for this variable experimentally.56 Furthermore, reorganization energy can be used to evaluate the molecular environment of the ferrocene groups and thereby give information regarding the SAM structure. However, because of the SAM disorder and consequent kinetic dispersion, an accurate determination of electronic coupling and reorganizational energy is precluded for this system.
The exchange of solution dtcs with surface-bound dtcs was investigated. When a neat diluent dtc monolayer is exposed to an Fc dtc solution, an electrochemical signal is observed, indicating either that exchange occurs or SAM defects are filled. When mixed monolayers of Fc dtc/diluent dtc are exposed to solutions of diluent dtc, the ferrocene coverage decreases, indicating that surface dtcs have exchanged with dtcs in solution. These observations are similar to reports of alkane thiol exchange.
In general, the structure of dtc SAMs on the molecular scale appears to be more disordered than for thiol SAMs on the basis of the larger than ideal peak separations and fwhm values. The basis of this disorder may be the bidentate footprint of dtcs and the stronger binding to the gold surface. The resulting fluidity of the monolayer may allow the hydrophobic ferrocene groups to adopt assorted conformations in the nonpolar alkane environment and to have varied interactions with the solvent shell and electrolyte. Kinetic dispersion in the dtc eSAMs likely arises from a distribution of E0′ and/or λ because of disorder in the monolayer packing. Through the choice of diluent dtcs and the noncovalent interactions that they impose, the observed distribution of electron-transfer rates for Fc dtcs can be shifted. We are currently investigating alternative diluent molecules to control the degree of order in the monolayer. The results from this electrochemical study suggest that dtcs may have applications in nanoscience and interfacial technology.
Supplementary Material
Scheme 2.
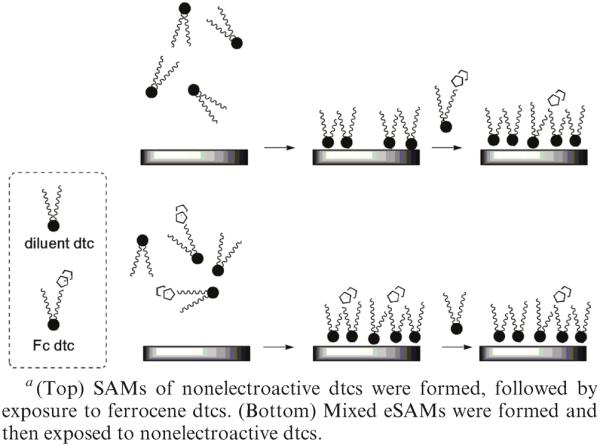
Exchange of Solution dtcs and Surface dtcs Using Ferrocene-Labeled dtcsa
Acknowledgment
We thank Dr. Dimitra Georganopoulou and Professors Mark A. Ratner and Richard P. Van Duyne for helpful discussions. We thank Professor Stephen E. Creager for helpful discussions, the generous gift of FcCONH(CH2)15SH, and the ACV peak ratio fitting spreadsheet. This research was supported by Nanomaterials for Cancer Diagnostics and Therapeutics under 5 U54 CA1193 41-02 and Ohmx Corporation.
Footnotes
Supporting Information Available: CV parameters for the neat monolayer cases (FcC11dtc, FcC16dtc, and FcCO2C16dtc). Comparison of simulated ACV peak ratio plots for a single rate and for a distribution of rates. Tafel plots and fit data for FcC16dtc/C18dtc, FcC16dtc/CO2C16dtc, FcCO2C16dtc/C16dtc, FcCO2C16dtc/C18dtc, and FcCO2C16dtc/CO2C16dtc. 1H NMR and ESI-MS data. Details of Marcus density-of-states theory equations used for Tafel plot fitting. This material is available free of charge via the Internet at http://pubs.acs.org.
References
- (1).Chidsey CED. Science. 1991;251:919–22. doi: 10.1126/science.251.4996.919. [DOI] [PubMed] [Google Scholar]
- (2).Finklea HO, Hanshew DDJ. Am. Chem. Soc. 1992;114:3173–81. [Google Scholar]
- (3).Smalley JF, Feldberg SW, Chidsey CED, Linford MR, Newton MD, Liu Y-PJ. Phys. Chem. 1995;99:13141–9. [Google Scholar]
- (4).Smalley JF, Finklea HO, Chidsey CED, Linford MR, Creager SE, Ferraris JP, Chalfant K, Zawodzinsk T, Feldberg SW, Newton MDJ. Am. Chem. Soc. 2003;125:2004–2013. doi: 10.1021/ja028458j. [DOI] [PubMed] [Google Scholar]
- (5).Fukuzumi S. Eur. J. Inorg. Chem. 2008;9:1351–1362. [Google Scholar]
- (6).Umeyama T, Imahori H. Photosynth. Res. 2006;87:63–71. doi: 10.1007/s11120-005-4632-z. [DOI] [PubMed] [Google Scholar]
- (7).Meade TJ, Kayyem JF, Fraser SE. U.S. Patent 6,528,266. 1994 Dec 5;
- (8).Willner I, Katz E. Angew. Chem., Int. Ed. 2000;39:1181–1218. doi: 10.1002/(sici)1521-3773(20000403)39:7<1180::aid-anie1180>3.0.co;2-e. [DOI] [PubMed] [Google Scholar]
- (9).Yu CJ, Wan Y, Yowanto H, Li J, Tao C, James MD, Tan CL, Blackburn GF, Meade TJ. J. Am. Chem. Soc. 2001;123:11155–11161. doi: 10.1021/ja010045f. [DOI] [PubMed] [Google Scholar]
- (10).Eckermann AL, Barker KD, Hartings MR, Ratner MA, Meade TJ. J. Am. Chem. Soc. 2005;127:11880–11881. doi: 10.1021/ja042922y. [DOI] [PubMed] [Google Scholar]
- (11).Kerman K, Song H, Duncan JS, Litchfield DW, Kraatz H-B. Anal. Chem. 2008;80:9395–9401. doi: 10.1021/ac801208e. [DOI] [PubMed] [Google Scholar]
- (12).Mahmoud KA, Kraatz H-B. Chem.—Eur. J. 2007;13:5885–5895. doi: 10.1002/chem.200601878. [DOI] [PubMed] [Google Scholar]
- (13).Bertin PA, Georganopoulou D, Liang T, Eckermann AL, Wunder M, Ahrens MJ, Blackburn GF, Meade TJ. Langmuir. 2008;24:9096–9101. doi: 10.1021/la801165b. [DOI] [PubMed] [Google Scholar]
- (14).Creager S, Yu CJ, Bamdad C, O'Connor S, MacLean T, Lam E, Chong Y, Olsen GT, Luo J, Gozin M, Kayyem JF. J. Am. Chem. Soc. 1999;121:1059–1064. [Google Scholar]
- (15).Dudek SP, Sikes HD, Chidsey CED. J. Am. Chem. Soc. 2001;123:8033–8038. doi: 10.1021/ja0043340. [DOI] [PubMed] [Google Scholar]
- (16).Hortholary C, Minc F, Coudret C, Bonvoisin J, Launay J-P. Chem. Commun. 2002;17:1932–1933. doi: 10.1039/b205073k. [DOI] [PubMed] [Google Scholar]
- (17).Sachs SB, Dudek SP, Hsung RP, Sita LR, Smalley JF, Newton MD, Feldberg SW, Chidsey CED. J. Am. Chem. Soc. 1997;119:10563–10564. [Google Scholar]
- (18). http://www.osmetech.com/news/n20060124.htm.
- (19). http://www.osmetech.com/news/n20080721.htm.
- (20).Marcus RA. J. Chem. Phys. 1956;24:966–78. [Google Scholar]
- (21).Sikes HD, Sun Y, Dudek SP, Chidsey CED, Pianetta PJ. Phys. Chem. B. 2003;107:1170–1173. [Google Scholar]
- (22).Smalley JF, Sachs SB, Chidsey CED, Dudek SP, Sikes HD, Creager SE, Yu CJ, Feldberg SW, Newton MD. J. Am. Chem. Soc. 2004;126:14620–14630. doi: 10.1021/ja047458b. [DOI] [PubMed] [Google Scholar]
- (23).Kittel C. Introduction to Solid State Physics. 4th ed John Wiley & Sons; New York: 1971. [Google Scholar]
- (24).Schmickler W. Interfacial Electrochemistry. Oxford University Press; New York: 1996. [Google Scholar]
- (25).Finklea HO, Ravenscroft MS, Snider DA. Langmuir 1993. 9:223–227. [Google Scholar]
- (26).Rowe GK, Creager SE. J. Phys. Chem. 1994;98:5500–5507. [Google Scholar]
- (27).Finklea HO, Liu L, Ravenscroft MS, Punturi SJ. Phys. Chem. 1996;100:18852–18858. [Google Scholar]
- (28).Sumner JJ, Creager SE. J. Phys. Chem. B. 2001;105:8739–8745. [Google Scholar]
- (29).Haddox RM, Finklea HO. J. Phys. Chem. B. 2004;108:1694–1700. [Google Scholar]
- (30).Madhiri N, Finklea HO. Langmuir. 2006;22:10643–10651. doi: 10.1021/la061103j. [DOI] [PubMed] [Google Scholar]
- (31).Sumner JJ, Weber KS, Hockett LA, Creager SE. J. Phys. Chem. B. 2000;104:7449–7454. [Google Scholar]
- (32).Weber K, Hockett L, Creager S. J. Phys. Chem. B. 1997;101:8286–8291. [Google Scholar]
- (33).Bain CD, Whitesides GM. Science. 1988;240:62–63. doi: 10.1126/science.240.4848.62. [DOI] [PubMed] [Google Scholar]
- (34).Bain CD, Whitesides GM. J. Am. Chem. Soc. 1989;111:7164–7175. [Google Scholar]
- (35).Folkers JP, Laibinis PE, Whitesides GM. Langmuir. 1992;8:1330–1341. [Google Scholar]
- (36).Tamada K, Hara M, Sasabe H, Knoll W. Langmuir. 1997;13:1558–1566. [Google Scholar]
- (37).Xu S, Cruchon-Dupeyrat SJN, Garno JC, Liu G-Y, Kane Jennings G, Yong T-H, Laibinis PE. J. Chem. Phys. 1998;108:5002–5012. [Google Scholar]
- (38).Auletta T, Van Veggel FCJM, Reinhoudt DN. Langmuir. 2002;18:1288–1293. [Google Scholar]
- (39).Bain CD, Evall J, Whitesides GM. J. Am. Chem. Soc. 1989;111:7155–7164. [Google Scholar]
- (40).Biebuyck HA, Whitesides GM. Langmuir. 1993;9:1766–1770. [Google Scholar]
- (41).Schoenherr H, Ringsdorf H. Langmuir. 1996;12:3891–3897. [Google Scholar]
- (42).Love JC, Estroff LA, Kriebel JK, Nuzzo RG, Whitesides GM. Chem. Rev. 2005;105:1103–1169. doi: 10.1021/cr0300789. [DOI] [PubMed] [Google Scholar]
- (43).Robinson DB, Chidsey CED. J. Phys. Chem. B. 2002;106:10706–10713. [Google Scholar]
- (44).Bain CD, Troughton EB, Tao YT, Evall J, Whitesides GM, Nuzzo RG. J. Am. Chem. Soc. 1989;111:321–335. [Google Scholar]
- (45).Chambers RC, Inman CE, Hutchison JE. Langmuir. 2005;21:4615–4621. doi: 10.1021/la050104t. [DOI] [PubMed] [Google Scholar]
- (46).Collard DM, Fox MA. Langmuir. 1991;7:1192–1197. [Google Scholar]
- (47).Lee LYS, Lennox RB. Phys. Chem. Chem. Phys. 2007;9:1013–1020. doi: 10.1039/b613598f. [DOI] [PubMed] [Google Scholar]
- (48).Lee LYS, Sutherland TC, Rucareanu S, Lennox RB. Langmuir. 2006;22:4438–4444. doi: 10.1021/la053317r. [DOI] [PubMed] [Google Scholar]
- (49).Calvente JJ, Andreu R, Molero M, Lopez-Perez G, Dominguez MJ. Phys. Chem. B. 2001;105:9557–9568. [Google Scholar]
- (50).Lahann J, Mitragotri S, Tran T-N, Kaido H, Sundaram J, Choi IS, Hoffer S, Somorjai GA, Langer R. Science. 2003;299:371–374. doi: 10.1126/science.1078933. [DOI] [PubMed] [Google Scholar]
- (51).DiMilla PA, Folkers JP, Biebuyck HA, Haerter R, Lopez GP, Whitesides GM. J. Am. Chem. Soc. 1994;116:2225–2226. [Google Scholar]
- (52).Harder P, Grunze M, Dahint R, Whitesides GM, Laibinis PE. J. Phys. Chem. B. 1998;102:426–436. [Google Scholar]
- (53).Prime KL, Whitesides GM. Science. 1991;252:1164–1167. doi: 10.1126/science.252.5009.1164. [DOI] [PubMed] [Google Scholar]
- (54).Bediako-Amoa I, Sutherland TC, Li C-Z, Silerova R, Kraatz H-B. J. Phys. Chem. B. 2004;108:704–714. [Google Scholar]
- (55).Kerman K, Kraatz H-B. Chem. Commun. 2007;47:5019–5021. doi: 10.1039/b713048a. [DOI] [PubMed] [Google Scholar]
- (56).Kerman K, Mahmoud KA, Kraatz H-B. Chem. Commun. 2007;37:3829–3831. doi: 10.1039/b707140j. [DOI] [PubMed] [Google Scholar]
- (57).Arndt T, Schupp H, Schrepp W. Thin Solid Films. 1989;178:319–26. [Google Scholar]
- (58).Zhao Y, Perez-Segarra W, Shi Q, Wei A. J. Am. Chem. Soc. 2005;127:7328–7329. doi: 10.1021/ja050432f. [DOI] [PMC free article] [PubMed] [Google Scholar]
- (59).Vickers MS, Cookson J, Beer PD, Bishop PT, Thiebaut B. J. Mater. Chem. 2006;16:209–215. [Google Scholar]
- (60).Weinstein RD, Richards J, Thai SD, Omiatek DM, Bessel CA, Faulkner CJ, Othman S, Jennings GK. Langmuir. 2007;23:2887–2891. doi: 10.1021/la062905h. [DOI] [PubMed] [Google Scholar]
- (61).Frisbie CD, Fritsch-Faules I, Wollman EW, Wrighton MS. Thin Solid Films. 1992;210–211:341–347. [Google Scholar]
- (62).Li Z, Kosov DS. J. Phys. Chem. B. 2006;110:9893–9898. doi: 10.1021/jp0610665. [DOI] [PubMed] [Google Scholar]
- (63).Long DP, Troisi A. J. Am. Chem. Soc. 2007;129:15303–15310. doi: 10.1021/ja074970z. [DOI] [PubMed] [Google Scholar]
- (64).Wessels JM, Nothofer H-G, Ford WE, von Wrochem F, Scholz F, Vossmeyer T, Schroedter A, Weller H, Yasuda A. J. Am. Chem. Soc. 2004;126:3349–3356. doi: 10.1021/ja0377605. [DOI] [PubMed] [Google Scholar]
- (65).Morf P, Raimondi F, Nothofer H-G, Schnyder B, Yasuda A, Wessels JM, Jung TA. Langmuir. 2006;22:658–663. doi: 10.1021/la052952u. [DOI] [PubMed] [Google Scholar]
- (66).Chidsey CED, Bertozzi CR, Putvinski TM, Mujsce AM. J. Am. Chem. Soc. 1990;112:4301–6. [Google Scholar]
- (67).Kurosawa W, Kan T, Fukuyama T. Org. Synth. 2002;79 [Google Scholar]
- (68).Han Y, Cheng K, Simon KA, Lan Y, Sejwal P, Luk Y-Y. J. Am. Chem. Soc. 2006;128:13913–13920. doi: 10.1021/ja064591q. [DOI] [PubMed] [Google Scholar]
- (69).Li J, Schuler K, Creager SE. J. Electrochem. Soc. 2000;147:4584–4588. [Google Scholar]
- (70).Bertin PA, Meade TJ. Tetrahedron Lett. 2009;50:5409–5412. [Google Scholar]
- (71).Rowe GK, Carter MT, Richardson JN, Murray RW. Langmuir. 1995;11:1797–1806. [Google Scholar]
- (72).Laviron E. J. Electroanal. Chem. Interfacial Electrochem. 1979;101:19–28. [Google Scholar]
- (73).Seo K, Jeon IC, Yoo DJ. Langmuir. 2004;20:4147–4154. doi: 10.1021/la0208068. [DOI] [PubMed] [Google Scholar]
- (74).Uosaki K, Sato Y, Kita H. Langmuir. 1991;7:1510–1514. [Google Scholar]
- (75).Voicu R, Ellis TH, Ju H, Leech D. Langmuir. 1999;15:8170–8177. [Google Scholar]
- (76).Brown AP, Anson FC. Anal. Chem. 1977;49:1589–1595. [Google Scholar]
- (77).Laviron E. J. Electroanal. Chem. Interfacial Electrochem. 1979;100:263–270. doi: 10.1016/0302-4598(87)85005-5. [DOI] [PMC free article] [PubMed] [Google Scholar]
- (78).Orlowski GA, Kraatz H-B. Electrochim. Acta. 2006;51:2934–2937. [Google Scholar]
- (79).Viana AS, Kalaji M, Abrantes LM. Langmuir. 2003;19:9542–9544. [Google Scholar]
- (80).Creager SE, Wooster TT. Anal. Chem. 1998;70:4257–4263. [Google Scholar]
- (81).Eggers PK, Zareie HM, Paddon-Row MN, Gooding JJ. Langmuir. 2009;25:11090–11096. doi: 10.1021/la9012558. [DOI] [PubMed] [Google Scholar]
Associated Data
This section collects any data citations, data availability statements, or supplementary materials included in this article.


