Abstract
BACKGROUND & AIMS
Most cholestatic disorders are caused by defects in cholangiocytes. The type 3 isoform of the inositol 1,4,5-trisphosphate receptor (ITPR3) is the intracellular calcium release channel detected most frequently in cholangiocytes. ITPR3 is required for bicarbonate secretion by bile ducts, and its expression is reduced in intrahepatic bile ducts of patients with cholestatic disorders. We investigated whether the nuclear factor, erythroid 2-like 2 (NFE2L2 or NRF2), which is sensitive to oxidative stress, regulates expression of ITPR3.
METHODS
The activity of the ITPR3 promoter was measured in normal human cholangiocyte (NHC) cells and primary mouse cholangiocytes. Levels of ITPR3 protein and mRNA were examined by immunoblot and PCR analyses, respectively. ITPR3 activity was determined by measuring calcium signaling in normal human cholangiocyte cells and secretion in isolated bile duct units. Levels of NRF2 were measured in liver tissues from rats with cholestasis (induced by administration of alpha-napthylisothiocyanate) and from patients with biliary diseases.
RESULTS
We identified a musculo-aponeurotic fibrosarcoma recognition element (MARE) in the promoter of ITPR3 that bound NRF2 directly in NHC cells and mouse cholangiocytes. Increasing binding of NRF2 at this site resulted in chromatin remodeling that reduced promoter activity. Mutant forms of the MARE did not bind NRF2. Activation of NRF2 with quercetin or by oxidative stress reduced expression of ITPR3 and calcium signaling in NHC cells; quercetin also reduced secretion by bile duct units isolated from rats. Knockdown of NRF2 with small interfering RNAs restored expression and function of ITPR3 in NHC cells incubated with quercetin. Bile ducts from rats with cholestasis and patients with cholangiopathic disorders expressed higher levels of NRF2 and lower levels of ITPR3 than ducts from control rats or patients with other liver disorders.
CONCLUSIONS
The transcription factor NRF2 binds to the promoter of ITPR3 to inhibit its expression in cholangiocytes, leading to reduced calcium signaling and bile duct secretion. This could be a mechanism by which oxidative stress inhibits these processes and contributes to cholangiopathies.
Keywords: gene regulation, signal transduction, primary biliary cirrhosis
INTRODUCTION
Cholangiopathies are a group of disorders with various etiologies but that commonly culminate in bile duct damage and impaired ductular secretion.1 Despite the heterogeneous nature of this group of diseases, several lines of evidence collectively suggest that loss of the type 3 inositol 1,4,5-trisphosphate receptor (ITPR3) from cholangiocytes is part of a final common pathway responsible for the cholestasis that characterizes these disorders. First, the ITPR3 is the predominant intracellular calcium-release channel in cholangiocytes, where it accounts for approximately 80% of ITPRs in these cells and is the only isoform in the apical region, where secretion occurs.2 Second, ITPR3 is lost from cholangiocytes in patients with primary biliary cirrhosis, sclerosing cholangitis, biliary atresia, and biliary obstruction, and is also lost from cholangiocytes in a variety of animal models of ductular cholestasis.3 Third, selective knockdown of ITPR3 in cholangiocytes specifically impairs bicarbonate secretion.4 Despite the central importance of ITPR3 for cholangiocyte function in health and disease, nothing is known about the factors that regulate its expression.
Cholestasis has been associated with oxidative stress.5 Nuclear factor erythroid 2-like 2 (NRF2) is a transcription factor that plays an important role in the cellular defense response and regulates the adaptive response to counteract endogenous and exogenous oxidative stresses.6 NRF2 is ubiquitously expressed in human organs at low basal levels. Activation of NRF2 signaling is controlled by KEAP1, a substrate adaptor protein for a Cullin3-based E3 ubiquitin ligase that facilitates NRF2 degradation by an ubiquitin-proteosome pathway. Under basal condition, NRF2 is bound to KEAP1 in the cytoplasm and subjected to proteasomal degradation. Under oxidative stress, the KEAP1-NRF2 complex is disrupted, allowing NRF2 to translocate into the nucleus, where it binds to the antioxidant response elements (AREs) of promoters to regulate gene transcription. Because of the possible links between cholestasis, oxidative stress, NRF2, and ITPR3, we tested whether oxidative stress, via NRF2, decreases ITPR3 in order to induce cholestasis.
MATERIALS AND METHODS
Reporters and Plasmids
A 2.1 kb DNA fragment containing the human ITPR3 proximal promoter region was amplified by PCR using a BAC Clone CH230-6B20, accession no. AL139044 obtained from Childrens Hospital of Oakland Research Institute (BacPac Resources, Oakland, CA) as a template. The 2120 bp DNA fragment containing the human ITPR3 proximal promoter region was cloned into a pGL4.17 luciferase vector (Promega, Madison, WI). MatInspector (www.genomatix.de) was used to analyze the promoter sequence, and a putative MARE was identified. The MARE reporter construct was mutated using the PCR-based QuikChange™ site-directed mutagenesis kit (Stratagene; Cedar creek, TX). All reporter constructs were verified by sequence analysis. Additional details are in Supplementary Materials and Methods.
NRF2 Silencing
NRF2 was suppressed by specific NRF2-short hairpin RNA (NRF2-shRNA). NRF2-shRNA expression plasmids were synthesized and cloned into the pRFP-C-RS-Retroviral vector by OriGene (OriGene Technologies, Inc., Rockville, MD). A non-targeting shRNA (scrambled shRNA) was used in control transfections. Overnight-seeded NHC cells were transfected with 1 μg NRF2-shRNA or scrambled-shRNA with XTremeFugene (Roche). Additional details are in the Supplement.
Electrophoretic Mobility Shift Assay
Nuclear protein extract from NHC cells was isolated by NE-PER Nuclear and Cytoplasmic Extraction kit (Thermo Scientific, Rockford, IL). The DNA oligonucleotide end-labeled with IRDye700 or IRdye800 for EMSA reactions were synthesized by Li-COR (Licor Biosciences, Lincoln, NK). EMSA was performed using Odyssey Infrared EMSA kit (Li-COR). The binding specificity determination was detected using Odyssey two-color infrared imaging system (Li-COR). Additional details are in the Supplement.
Calcium Imaging
Transfected or treated NHC cells were placed in serum-free media, then loaded with 6 μM Fluo-4/AM (Molecular Probes, Grand Island, NY) and perfused with a HEPES buffer while stimulated with 10 μM ATP. This ATP concentration was used because no Ca2+ signals were elicited using lower concentrations in this cell type. Ca2+ signaling was monitored with a Zeiss 710 confocal microscope. Regions of interest (ROIs) were analyzed using ImageJ as described previously.7
Intrahepatic Rat Bile Duct Units (IBDUs) and Assessment of Ductular Secretion
IBDUs were isolated, purified, and cultured onto the Matrigel-coated coverslips. Twenty-four hours after isolation, IBDUs were treated with DMSO or quercetin for 24 hours. Expansion of IBDU lumens over time was quantified by video-optical planimetry as a measure of the ductular secretion rate as previously described.8 Briefly, sealed fragments of IBDUs with retained polarity grown on the coverslip were transferred to a thermostated chamber on the stage of an inverted microscope. After a 5-minute baseline period, IBDUs were perfused with 10 μM forskolin. The luminal area was measured every 5 minutes for 30 minutes, and serial images of the perfused IBDUs were captured. Each luminal area was normalized by its initial value, and data are presented as percent of expansion relative to baseline.
Ethics Statement
All protocols for animal used and euthanasia were reviewed and approved by Mahidol University Animal Care and Use Committee. The animal protocol number is MUSC54-027-273. Human liver tissue biopsies were obtained under the auspices of protocols approved by the Institutional Review Board on the Protection of the Rights of Human Subjects (Yale University). The Human Investigation Committee protocol number is HIC-1208010665.
Statistical Analysis
Experiments were conducted in triplicate and data are presented as mean ± standard deviation (SD). Statistical analysis was performed with GraphPad Prism 6 (GraphPad Software Inc., La Jolla, CA). Unpaired Student’s t tests were used to compare means. Differences with p< 0.05 were considered to be statistically significant.
See the Supplementary information for additional methods.
RESULTS
NRF2 Binds to MARE to Inhibit Human ITPR3 Promoter Activity
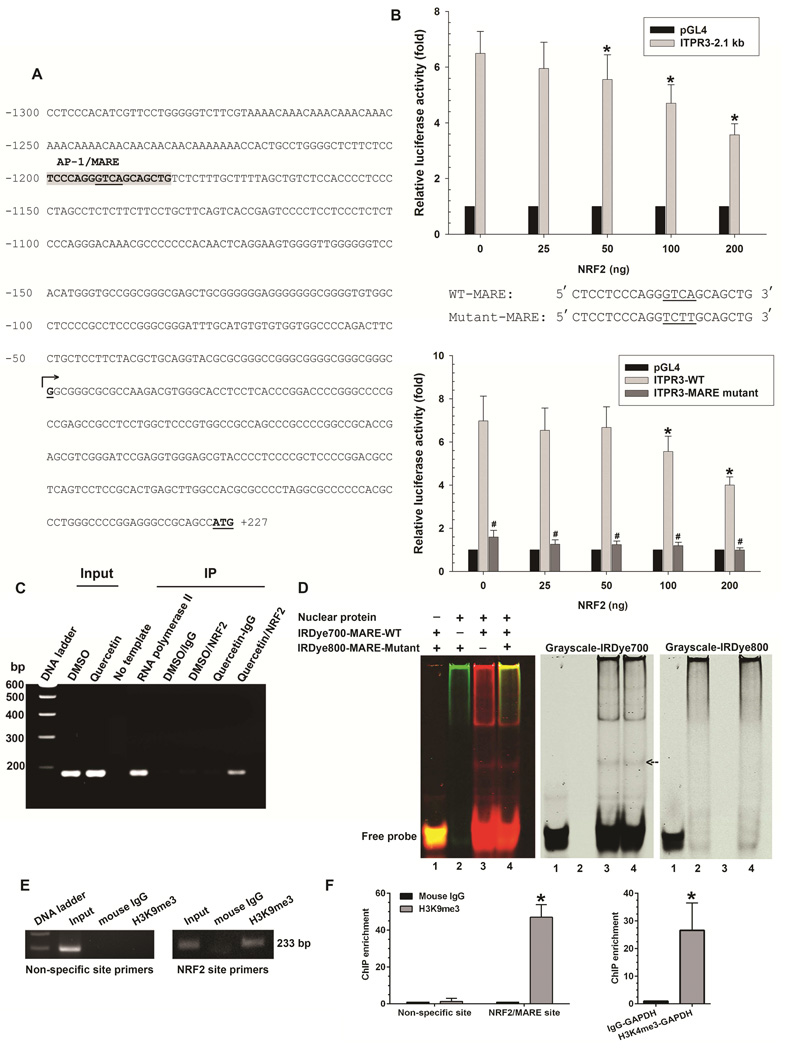
Analysis of the human ITPR3 promoter revealed a single musculo-aponeurotic fibrosarcoma (Maf) recognition element (MARE) where NRF2 could bind, located from −1180 to −1200 bp upstream of the transcription starting sites (Figure 1A). To determine if this MARE represses human ITPR3 transcription in cholangiocytes, reporter gene assays were performed in NHC cells co-transfected with a human ITPR3 luciferase construct (2.1 kb) and a NRF2 expression plasmid. The type 3 isoform comprises approximately 80% of ITPRs in cholangiocytes2, and well over 90% of ITPRs in NHC cells (Supplementary Figure S1). Moreover, ITPR3 is the predominant isoform in both small and large cholangiocytes (data not shown) and is concentrated in the apical region of each (Supplementary Figure S2). NRF2 co-transfection with the ITPR3 promoter led to significant down-regulation of reporter gene activity in a dose-dependent manner (Figure 1B), providing evidence that NRF2 mediates suppression of ITPR3 promoter activity.
Figure 1. NRF2 binds to MARE on the human ITPR3 promoter and suppresses promoter activity.
(A) DNA sequence of the proximal (2.1 kb) region of the human ITPR3 promoter. Potential transcriptional binding sites for NRF2/MARE are shaded in gray, and underlined nucleotides are the core sequence of the NRF2/MARE. Numbered positions refer to the transcription starting sites (nucleotide, +1, arrow). (B) NRF2 inhibits ITPR3 promoter activity in a dose- and MARE-dependent fashion. Upper panel shows gene reporter assays. The ITPR3 promoter construct (p-1812/+326-Luc) was co-transfected with the NRF2 expression plasmid in NHC cells. Lower panel shows luciferase activity of the MARE mutant. NHC cells were co-transfected with mutated core region of MARE in p-1812/+326-Luc and its corresponding wild-type constructs with different amounts of NRF2. Results are presented as fold changes relative to empty luciferase vector (pGL4) from the same dual luciferase assay experiment. *p<0.05 relative to empty vector (n=4 separate transfection experiments). (C) ChIP assay. Chromatin prepared from NHC cells treated with DMSO or quercetin (Input) was immunoprecipitated with NRF2 antibody. Precipitated chromatin DNA was detected by a primer set covering the MARE region using PCR. RNA polymerase II was used as a positive control. Normal rabbit IgG was used as a negative control. (D) Electrophoretic mobility shift assay. Nuclear extract isolated from NHC cells was incubated with either IRDye700-labeled oligonucleotides corresponding to the wild-type MARE motif (IRDye700-MARE-WT) or IRDye800-labeled oligonucleotides corresponding to the mutated MARE motif (IRDye800-MARE-Mutant). Analysis of direct binding was conducted as indicated. Black arrow indicates positions of the DNA–protein complexes. (E) Representative image showed H3K9 methylation of histone H3 surrounding the NRF2/MARE site. Chromatin was prepared from NHC cells transfected with NRF2 plasmid. Chromatin was immunoprecipitated with anti-trimethyl H3K9 antibody or normal mouse IgG. Precipitated chromatin DNA with H3K9me3 or normal mouse IgG was detected by a primer set covering the specific NRF2/MARE and non-specific regions using PCR. (F) Quantification of ChIP enrichment of H3K9 methylation. Normal mouse IgG served as a control. Negative control consisted of amplification of a non-specific site (3'-UTR region of ITPR3 gene) distant from the promoter region. NHC cells transfected with NRF2 plasmid were assayed for H3K9 methylation by ChIP with primers specific for the MARE region on the ITPR3 promoter. Enrichment was quantified by qPCR. Positive controls were immunoprecipitated with anti-trimethyl H3K4 antibody. Precipitated chromatin DNA with H3K4me3 was detected using primers for GAPDH promoter. Increased H3K4me3 signal was consistent with constitutive activation of the GAPDH gene. Results are expressed as the fold-increase of the ratio to the normal mouse IgG control. Values are mean ± SD, n=6 (*p<0.005).
To examine the functional importance of the MARE site in the ITPR3 promoter, a quadruple-site mutation of the core MARE sequences in the ITPR3 promoter was constructed. Mutations of the NRF2 binding site in an ITPR3 luciferase construct (2.1 kb) co-transfected with NRF2 expression plasmids completely eliminated NRF2-repressed ITPR3 luciferase promoter activity (Figure 1B), providing further evidence that NRF2 inhibits ITPR3 promoter activity by targeting to MARE. To determine whether NRF2 binds to this MARE in the human ITPR3 promoter, a ChIP assay was performed and probed with oligonucleotides flanking the MARE motif from −1057 to −1242 bp. Forty-eight hours after treatment with either DMSO or the NRF2 activator quercetin9, chromatin was extracted, immunoprecipitated with NRF2 antibody, and analyzed by PCR. Cells treated with quercetin and immunoprecipitated with a NRF2 antibody showed a positive band as was seen in the positive control immunoprecipitated with RNA polymerase II antibody (Figure 1C). These findings demonstrate that NRF2 is recruited and binds to the MARE site in the ITPR3 promoter.
To verify that repression of ITPR3 by NRF2 is attributable to the direct binding of NRF2 to a predicted MARE in the human ITPR3 promoter, EMSA was performed using synthesized fluorescence labeled oligonucleotides corresponding to the MARE at −1180 to −1200 bp upstream of the transcription starting sites and nuclear protein extracted from NHC cells (Figure 1D). No band was seen either in the absence of the nuclear protein (lane 1) or in the presence of nuclear protein with labeled (IRDye800) mutated MARE oligonucleotides (lane 2). In contrast, a band was observed when the nuclear protein was incubated with labeled (IRDye700) MARE-wild type sequences (lane 3). A band was also seen in the case of adding both labeled (IRDye700) MARE-wild type and labeled (IRDye800) mutated MARE sequences (lane 4). To investigate how NRF2 down-regulates ITPR3 expression, a ChIP assay was used to examine promoter histone modifications in NHC cells overexpressing NRF2. We focused on histone H3 methylation at lysines 9 and 27 (H3K9 and H3K27) because both H3K9 and H3K27 methylation are indicative of gene repression.10, 11 The ChIP assay used oligonucleotides flanking the MARE motif from −1057 to −1242 bp and specific antibodies to histone H3Lys9me3 (trimethylation) and H3K27me2/3 (di- and trimethylation), and indicated that transfection of the NRF2 construct significantly increased H3K9 methylation (Figure 1E-F). H3K27 methylation also was significantly increased relative to control (p<0.05 by the Mann–Whitney U test, n = 6). Collectively, these results confirm the specificity and direct binding of NRF2 to a predicted MARE in the human ITPR3 promoter and provide evidence that NRF2 suppresses ITPR3 gene expression by H3K27 and H3K9 hypermethylation.
NRF2 Activation Inhibits ITPR3 Expression in Cholangiocytes
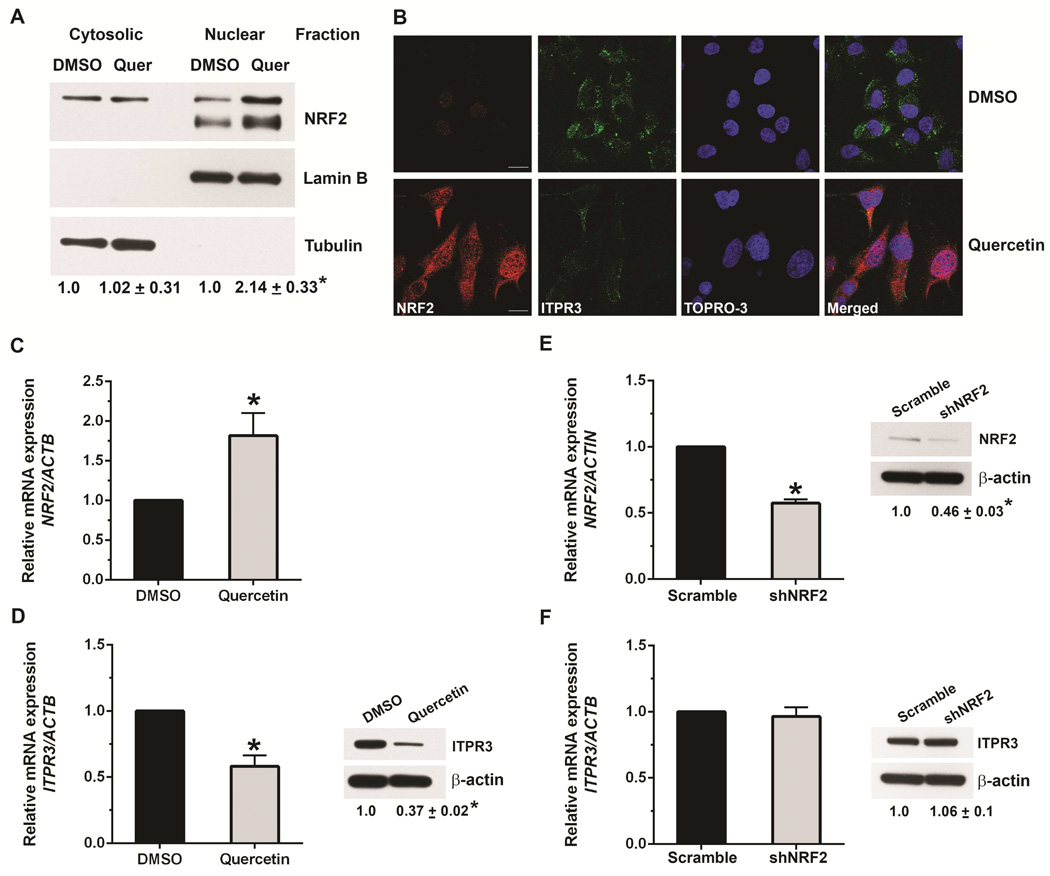
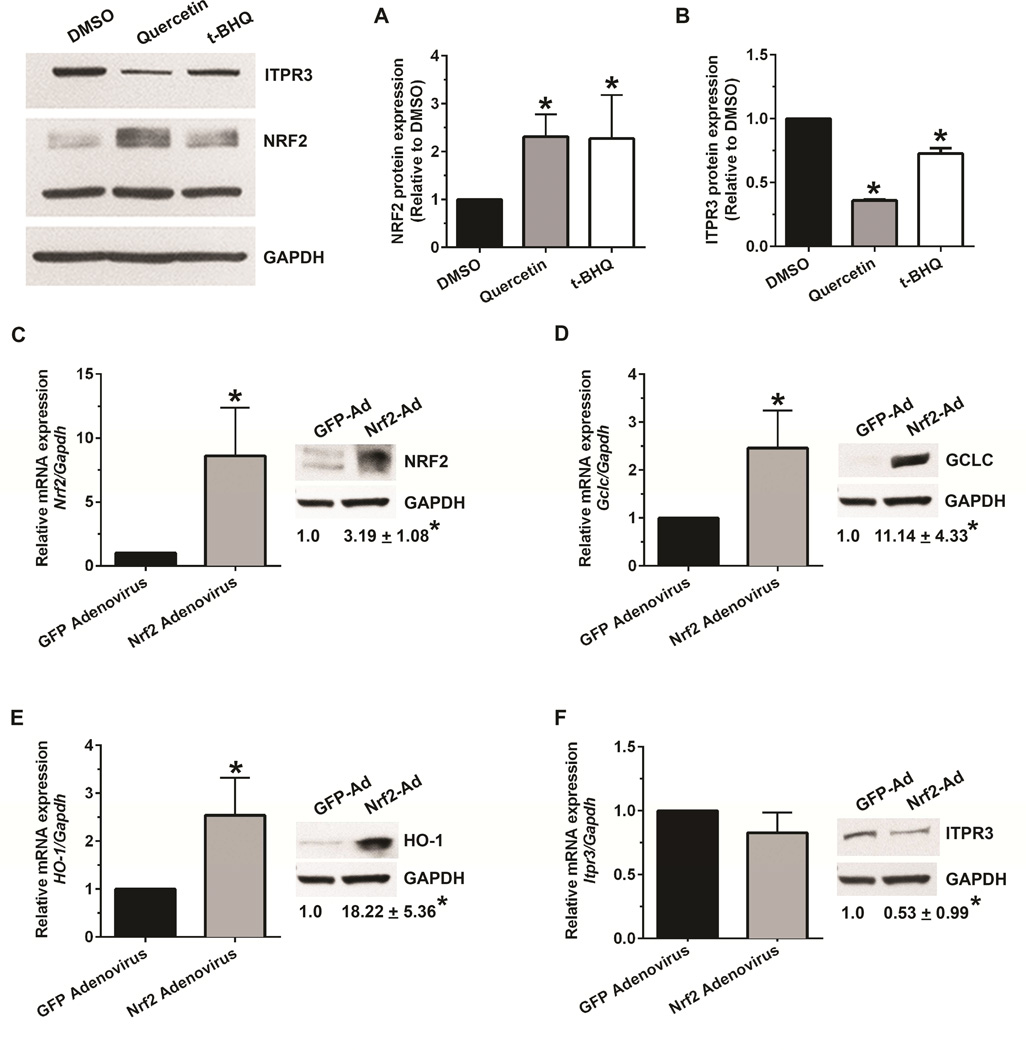
NRF2 undergoes nuclear translocation during activation. Nuclear accumulation is then essential for activation of MARE-dependent gene expression.12, 13 To determine whether NRF2 is involved in ITPR3 expression in cholangiocytes, NHC cells were treated with the NRF2 activator quercetin (25 μM). This concentration was used because higher concentrations have been linked to off-target effects including cell death14 and activation of Wnt/beta-catenin signaling.15 Quercetin markedly increased nuclear NRF2 accumulation, as measured by both immunoblot (Figure 2A) and confocal immunofluorescence (Figure 2B), and strongly increased NRF2 mRNA expression (Figure 2C). Quercetin also inhibited ITPR3 mRNA expression approximately two-fold (Figure 2D) and reduced protein expression of ITPR3 by 65% (Figure 2D); this reduction was also evident by immunofluorescence (Figure 2B). Together, these data demonstrate that quercetin down-regulates ITPR3 mRNA and protein expression in cholangiocytes. Quercetin furthermore increased mRNA levels of NAD(P)H quinone oxidoreductase (NQO1), the prototype NRF2 target gene, in NHC cells (not shown). Treatment of these cells with tert-butyl hydroquinone (t-BHQ), another known NRF2 activator, similarly down-regulated ITPR3 protein expression and up-regulated NRF2 in NHC cells (Figure 3A-B). We also confirmed the effect of NRF2 on ITPR3 in primary mouse cholangiocytes. Treatment of mouse cholangiocytes with t-BHQ significantly up-regulated the NRF2 target genes, glutamate cysteine ligase catalytic subunit (GCLC) and heme oxygenase (HO-1), and down-regulated ITPR3 expression (Supplementary Figure S3). Collectively, these findings illustrate that NRF2 negatively regulates ITPR3 gene transcription in cholangiocytes. Finally, NHC cells were transfected with scrambled-shRNA or NRF2-shRNA inserted into a pRFP-C-RS shRNA vector. NRF2-shRNA reduced the mRNA and protein expression of NRF2 in NHC cells by 50%, relative to scrambled-shRNA (Figure 2E). Knocking down NRF2 did not alter either mRNA or protein expression of human ITPR3 (Figure 2F). Similar results were observed in mouse cholangiocytes treated with Nrf2-siRNA (Supplementary Figure S4). This lack of effect may reflect the relatively low endogenous levels of NRF2. In contrast, overexpression of NRF2 in mouse cholangiocytes with an adenovirus-Nrf2 construct significantly up-regulated NRF2, GCLC and HO-1 mRNA and protein levels (Figure 3C-E), and down-regulated the expression of endogenous ITPR3 at the protein level (Figure 3F).
Figure 2. NRF2 activation inhibits expression of ITPR3.
(A) Immunoblots of cytosolic and nuclear fractions from NHC cells treated with DMSO or quercetin (25 μM) demonstrate that quercetin increases NRF2 expression, predominantly in the nucleus. Tubulin was used as a non-nuclear marker and lamin B was used as a nuclear marker to confirm purity of the cytosolic and nuclear fractions, respectively. (B) Confocal immunofluorescent staining of NHC cells demonstrates that treatment with quercetin increases NRF2 (red) and decreases ITPR3 expression (green). Nuclei were labeled with the nuclear marker TOPRO-3 (blue). Scale bar, 10 μm. (C) Relative mRNA expression of NRF2 is increased in NHC cells treated with quercetin. Values here and in subsequent panels are mean ± SD of results from triplicate experiments; *p<0.05. (D) mRNA (left) and protein (right) expression of ITPR3 are decreased by quercetin treatment. mRNA levels were normalized to β-actin. Results are presented as fold changes relative to DMSO-treated controls. Relative mRNA (left) and protein (right) expressions of (E) NRF2 and (F) ITPR3 in NHC cells transfected with scrambled or NRF2-shRNA shows that knockdown of NRF2 does not alter ITPR3 expression.
Figure 3. The NRF2 activator, tert-butyl hydroquinone (t-BHQ), and NRF2 overexpression also decrease ITPR3 expression.
Relative protein expression of (A) NRF2 and (B) ITPR3 in NHC cells treated with t-BHQ (75 μM) in parallel with treatment of quercetin (25 μM) for 48 hours. Quantified protein expression was normalized to GAPDH. Results are expressed as fold change relative to solvent control (DMSO). *p<0.05; significantly different between indicated groups (n=4 independent experiments). Relative mRNA and protein expression of (C) NRF2, and targets of Nrf2 (D) GCLC, (E) HO-1, and (F) ITPR3 in mouse cholangiocytes transduced with either empty control GFP-adenovirus or adenovirus expressing NRF2. Data are mean ± SD compared to controls (n=3), *p<0.05. Ad, adenovirus.
To verify the specificity of NRF2 pharmacological activation, mouse cholangiocytes were transfected with a scrambled-siRNA or with Nrf2-siRNA and treated with t-BHQ. t-BHQ treatment up-regulated GCLC and HO-1 protein expression and down-regulated ITPR3 protein expression, but failed to do so in NRF2 knockdown cells (Supplementary Figure S5). These findings provide supporting evidence that effects of t-BHQ are specifically and directly mediated by NRF2.
Next, we investigated whether NRF2-mediated inhibition effects are also observed in other isoforms of the ITPR in the liver. We analyzed the expression of ITPR2 in primary mouse hepatocytes, which predominantly express this isoform, upon treatment with either quercetin or t-BHQ. Mouse hepatocytes expressed higher levels of NRF2 than mouse cholangiocytes (Supplementary Figure S6A), similar to what is found in human liver. TaqMan analysis of mRNA expression of NRF2 in primary normal human hepatocytes and normal human cholangiocytes (NHC) showed that the NRF2 mRNA level in human hepatocytes was higher than that of NHC cells (Supplementary Figure S6B). Treatment of mouse hepatocytes with quercetin or t-BHQ up-regulated NRF2 and Nrf2 target genes (GCLC and HO-1) but did not alter ITPR2 expression (Supplementary Figure S7), suggesting that negative regulation of ITPR expression by NRF2 is specific to cholangiocytes and ITPR3.
NRF2 Regulates Calcium Signaling and Secretion
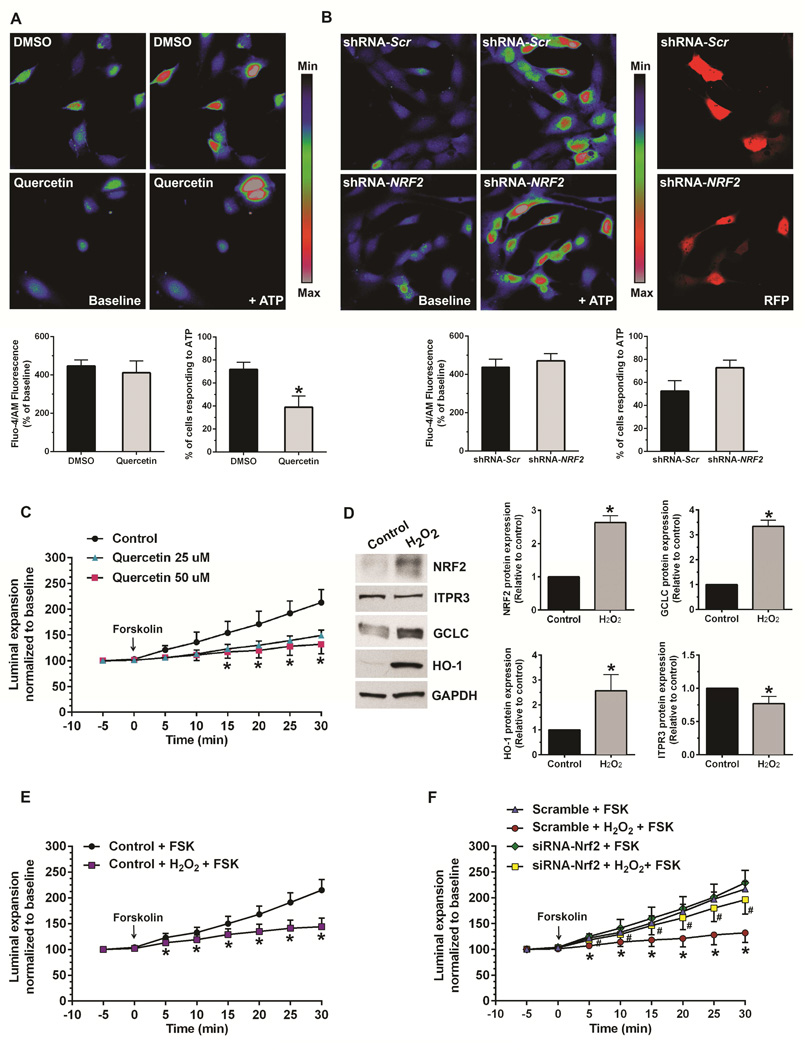
To determine the physiological significance of NRF2 regulation of cholangiocyte ITPR3 expression, functional studies were performed in isolated rat and mouse bile duct units (IBDUs)2 and in NHC cells. ATP-induced calcium signals were examined in NHC cells, because cholangiocytes and biliary cell lines express P2Y receptors that link to IP3-mediated calcium signaling. 16–18 NHC cells were loaded with a fluorescent Ca2+ dye, and monitored using time-lapse confocal microscopy. 19 To examine the effects of increased NRF2, Ca2+ signaling was measured in quercetin-treated NHC cells (Figure 4A) treated for 48 hours under conditions that increase NRF2 and decrease ITPR3 (Figure 2C-D). Quercetin did not affect the amplitude of ATP-stimulated Ca2+ signals, but resulted in a 50% reduction in the number of cells responding to ATP relative to controls. The finding that quercetin- and NRF2-induced reduction in the number of ITPR3 receptors results in decreased sensitivity to ATP but without a change in the amplitude of calcium signals in responding cells is consistent with several previous observations: First, knockdown of the type 1 or 2 isoform of ITPR in cells expressing those isoforms results in decreased responsiveness to calcium agonists at most agonist concentrations, with little effect on the signal amplitude.20 Second, calcium release from ITPR3 tends to be all-or-none, consistent with the observation that every response, when it occurs, would be a maximal one.19, 21 To complement these pharmacologic studies, we examined the effect of NRF2 overexpression on Ca2+ signaling. Ectopic NRF2 expression also suppressed the number of cells responding to ATP relative to pcDNA3.1-transfected cells (Supplementary Video S1A, S1B.), providing further evidence that regulation of ITPR3 expression by NRF2 affects cholangiocyte Ca2+ signaling. To examine the effect of decreased NRF2, NHC cells were transfected with either scrambled-shRNA or NRF2-shRNA (Figure 4B). In contrast to the effect of increasing NRF2, knockdown of NRF2 had no effect on either the peak amplitude of ATP-induced Ca2+ signals or the number of cells responding to ATP (Figure 4B). This is consistent with the observation that knockdown of NRF2 does not increase expression of ITPR3 (Figure 2F). Collectively, these findings illustrate that the inhibitory effect of NRF2 on ITPR3 expression in cholangiocytes results in decreased sensitivity of cells to calcium agonists. To examine a second, downstream physiological effect of ITPR3 activation, fluid secretion was measured in rat IBDUs. Forskolin induced progressive luminal expansion under control conditions, as shown previously. 22 This is mediated by activation of CFTR in cholangiocytes, which results in luminal release of ATP and then autocrine stimulation of apical P2Y receptors, followed by ITPR3- and Ca2+-mediated fluid and electrolyte secretion.4 However, the effect of forskolin was almost completely abolished by pre-treatment for 24 hours with either 25 or 50 μM quercetin (Figure 4C). Because up-regulation of NRF2 often results from oxidative stress, we investigated whether oxidative stress mediates NRF2-dependent down-regulation of ITPR3 expression and function. Mouse cholangiocytes were treated with hydrogen peroxide (H2O2) for 16 hours to induce oxidative stress, and this up-regulated NRF2, GCLC and HO-1 expression but down-regulated ITPR3 expression (Figure 4D). In secretion studies, H2O2 almost completely eliminated forskolin-induced luminal expansion in mouse IBDUs (Figure 4E), but this inhibition was blocked by Nrf2 siRNA (Figure 4F). Collectively, these findings provide evidence that the inhibitory effect of NRF2 on ITPR3 expression in cholangiocytes can be induced by oxidative stress and results in decreased Ca2+ signaling and Ca2+-mediated fluid and electrolyte secretion.
Figure 4. NRF2 inhibits Ca2+ signaling and impairs fluid secretion in cholangiocytes.
Ca2+ signaling was monitored in NHC cells loaded with Fluo-4. Ca2+ signaling in response to ATP (10 μM) was measured using confocal microscopy. (A) Increased NRF2 expression impairs calcium signaling. Upper panels show representative images of Ca2+ signaling in NHC cells treated with DMSO or quercetin. Lower panels show magnitude of ATP-stimulated Ca2+ signals (left) and number of cells responding to ATP (right). The number of responding cells is reduced by half, although the magnitude of the response is unchanged in responding cells. Values here and in the next panel are mean ± SD (n=4 experiments under each condition, with at least 15-30 cells per group per experiment); *p<0.05. (B) Decreased NRF2 expression does not affect calcium signaling. Upper panels (left) show representative images of Ca2+ signaling in NHC cells transfected with non-targeted (scrambled) shRNA or NRF2-shRNA in pRFP-C-RS vector, and upper panels (right) show the particular cells that were transfected with scrambled- or NRF2-shRNA as reflected by detection of RFP. Lower panels show the quantified magnitude of ATP-stimulated Ca2+ signals (left) and the number of cells responding to ATP (right) in shRNA transfected NHC cells. (C) The NRF2 activator quercetin impairs fluid secretion in rat IBDUs. IBDUs were treated with or without quercetin (25 or 50 μM) for 24 hours, then perfused with forskolin (10 μM) and luminal expansion rates were measured over 30 min. Values represent mean ± SD of 8-18 IBDUs per group. *p<0.05; quercetin versus control. (D) H2O2-induced oxidative stress increases NRF2 and Nrf2 target genes (GCLC, HO-1) but decreases ITPR3 protein expression in mouse cholangiocytes. (E) H2O2 impairs fluid secretion in mouse IBDUs. *p<0.05; H2O2 versus control. (F) Forskolin-induced luminal expansion was inhibited by H2O2 in scrambled IBDUs. NRF2 knockdown prevented this inhibition. Values represent mean ± SD of 10-18 IBDUs per group. *p<0.05; compared to scrambled-FSK. #p<0.05; scrambled-H2O2 versus Nrf2-silenced-H2O2. Values represent mean ± SD of 10-14 IBDUs per group.
NRF2 Expression Is Increased in Cholestatic Liver Diseases
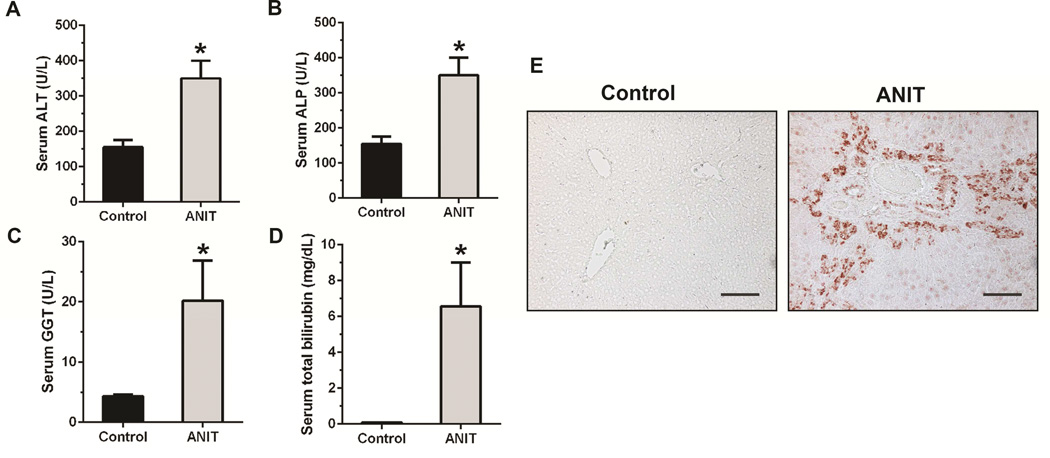
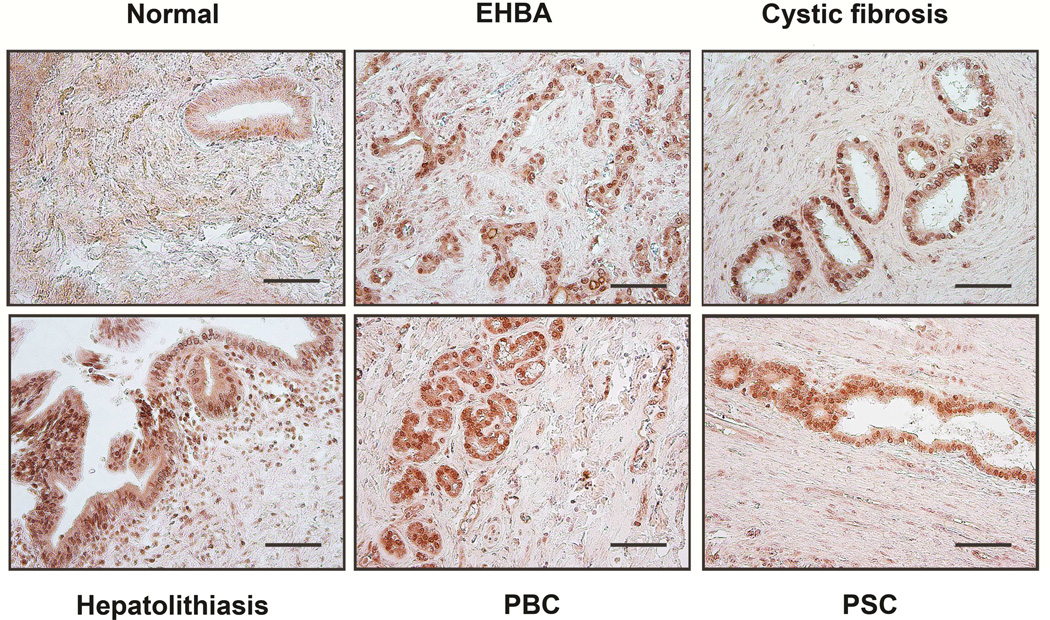
ITPR3 expression is lost from cholangiocytes in animal models of cholestasis, including treatment with alpha-napthylisothiocyanate (ANIT), common bile duct ligation, and treatment with endotoxin, as well as in patients with a range of cholangiopathies, including primary biliary cirrhosis, sclerosing cholangitis, biliary atresia, and biliary obstruction.3 Work in animal models has furthermore established that Ca2+ signaling is impaired or absent in cholangiocytes under these circumstances as well, while specific knockdown of ITPR3 is sufficient to impair ductular secretion of bicarbonate4, the principal secretory product of bile ducts.23 To understand the relevance of NRF2 in these disease states, NRF2 expression was examined in the ANIT model of bile duct injury (Figure 5), as well as in patients with a range of biliary diseases (Figure 6). Treatment of rats with ANIT resulted in increased serum levels of several liver enzymes plus bilirubin, indicative of liver damage and cholestasis (Figure 5A-D). Immunochemistry of liver sections demonstrated that NRF2 expression in bile ducts is normally low, but is markedly increased after ANIT (Figure 5E). Similarly, NRF2 expression was low in bile ducts from patients with normal liver, but was markedly increased in patients with biliary atresia, cystic fibrosis, bile duct obstruction due to stone disease, primary biliary cirrhosis, and sclerosing cholangitis (Figure 6). These findings demonstrate that clinical conditions associated with loss of ITPR3 from cholangiocytes also result in increased biliary expression of NRF2. This in turn provides evidence that NRF2 is a negative regulator of ITPR3 in cholangiocytes in vivo and suggests that one of the mechanisms by which ITPR3 levels are down-regulated in cholestatic liver diseases involves the NRF2-mediated pathway.
Figure 5. NRF2 expression is increased in cholangiocytes from cholestatic rat livers.
Rats were treated with ANIT to induce bile duct disease, resulting in loss of ITPR3 expression and impaired secretion. (A) Serum alanine aminotransferase (ALT), (B) Serum alkaline phosphatase (ALP), (C) Serum gamma-glutamyltransferase (GGT), and (D) Serum total bilirubin levels were significantly higher in ANIT-treated rats compared to control rats. Bars represent mean ± SD, n=3. *p<0.05. (E) NRF2 immunohistochemical staining of liver sections from control and ANIT-treated rats demonstrates a dramatic increase in NRF2 expression in bile ducts after ANIT treatment. Images are representative of those obtained in 3 control and 3 ANIT-treated animals (Scale bar, 200 μm).
Figure 6. NRF2 expression is increased in cholangiocytes from cholestatic human livers.
NRF2 staining of human liver biopsies shows minimal NRF2 expression in normal liver but a dramatic increase in NRF2 in a variety of cholangiopathies: extrahepatic biliary atresia (EHBA), cystic fibrosis, hepatolithiasis, primary biliary cirrhosis (PBC), and primary sclerosing cholangitis (PSC). Images are representative of what was observed in 2-4 patients under each condition (Scale bar, 200 μm).
DISCUSSION
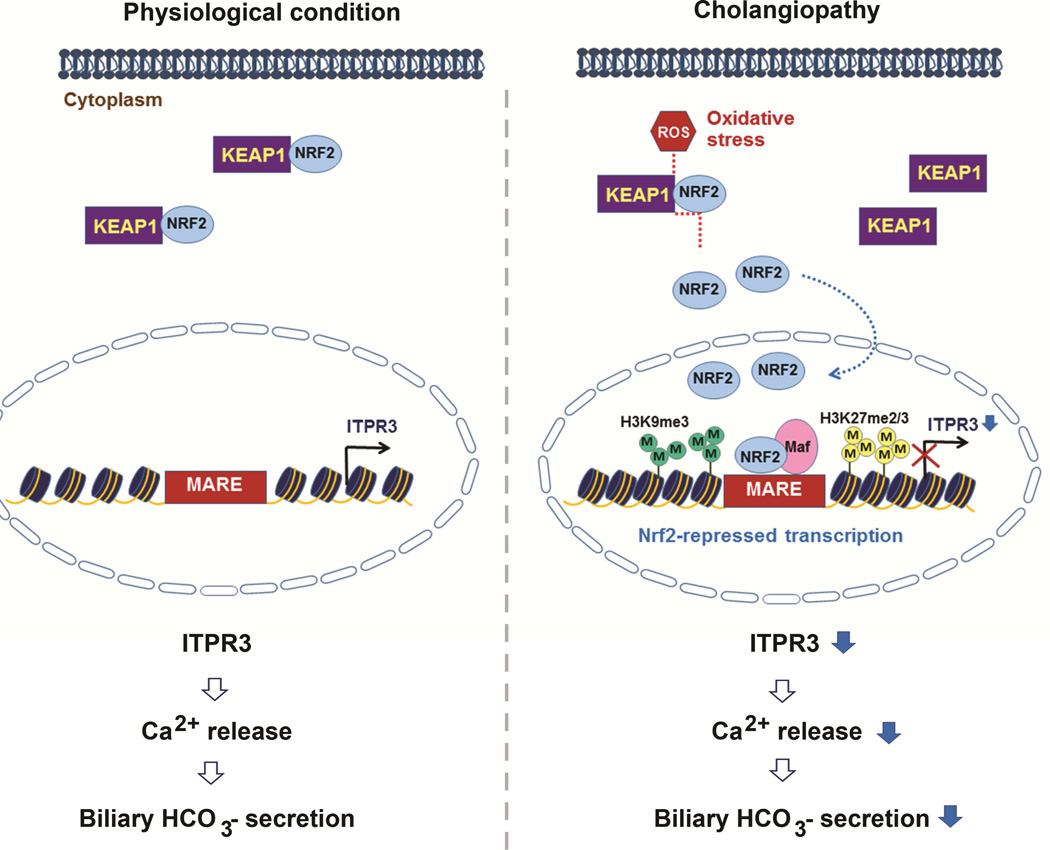
The ITPR is the principal intracellular calcium release channel in most types of cells24, including cholangiocytes, in which ITPR3 is the principal isoform expressed.2 ITPR3 is concentrated in the apical region of both small and large cholangiocytes (Supplementary Figure S2), and this subcellular localization is thought to be important for permitting Ca2+-mediated secretion to occur.16–18, 25 Loss of ITPR3 occurs in a variety of human cholangiopathies and related animal models3, and results in impaired ductular bicarbonate secretion.4 Little is known about the transcriptional regulation of ITPR3, beyond a recent report that ITPR3 expression is inhibited by micro-RNA 506.26 Here we provide evidence that the transcription factor NRF2 negatively regulates ITPR3 expression in cholangiocytes. NRF2 generally is regarded as a sensor of oxidative stress, which is known to occur in cholestasis5, 27, and we indeed found that NRF2 and its downstream effects in cholangiocytes can be induced by increasing oxidative stress through administration of H2O2 (Figure 4). We furthermore found that NRF2 binds directly to the ITPR3 promoter to inhibit ITPR3 transcription, and that the mechanism responsible for this involves repressive chromatin remodeling by histone H3K9/K27 methylation at that site (Figure 1). Moreover, NRF2 expression was increased in cholangiocytes under the same conditions in which ITPR3 expression is decreased, including biliary atresia, obstruction, primary biliary cirrhosis and sclerosing cholangitis (Figure 6). Collectively, these findings suggest a model for regulation of transcription of ITPR3 by NRF2 that provides a potential unifying mechanism for the pathogenesis of cholestasis in a variety of cholangiopathies (Figure 7).
Figure 7. Proposed model of negative regulation of ITPR3 expression and function by NRF2.
Under normal conditions, KEAP1 binds to NRF2 and sequesters it in the cytoplasm, where it is not able to affect ITPR3 gene transcription. Cholestasis results in increased production of reactive oxygen species (ROS) and oxidative stress, which enables NRF2 to dissociate from KEAP1 and translocate to the nucleus to heterodimerize with the small musculo-aponeurotic fibrosacroma (Maf) protein. This complex binds to MARE in the promoter of the ITPR3 gene, which increases H3K9 and H3K27 methylation and silences expression of ITPR3. Loss of ITPR3 expression then leads to loss of Ca2+-mediated bicarbonate secretion.
Activation of NRF2 reduced ITPR3 expression, regardless of whether NRF2 was activated by H2O2, pharmacological means, or over-expression. Yet, knocking down NRF2 did not alter either mRNA or protein expression of ITPR3. The reason for this is not entirely clear, but may relate to the fact that NRF2 expression in cholangiocytes appears to be quite low under baseline conditions. This low level of NRF2 expression in cholangiocytes is not only relative to NRF2 expression in cholangiocytes in disease states (Figures 5 and 6), but also relative to hepatocytes under baseline conditions (Supplementary Figure S6). If the expression of NRF2 in cholangiocytes under basal conditions is so low that its inhibitory effect on ITPR3 expression is minimal, then a further decrease in NRF2 would not be expected to lead to increased ITPR3. Consistent with this explanation is the observation that NRF2 knockdown in cholangiocytes does not decrease expression of either HO-1 or GCLC (Supplementary Figure S4), each of which are known to be sensitively regulated by NRF2.28, 29
There are several possible sources for the ROS that cholangiocytes may encounter to activate NRF2 during cholestasis. One possible source relates to the retention of bile acids that occurs in cholestasis. The impaired secretion of bile that characterizes cholestasis results in intrahepatic accumulation of bile acids such as lithocholic acid and chenodeoxycholic acid, which have been shown to activate NRF2.30 This activation then provokes adaptive defense responses to enhance cell survival and protect the cells against bile acid toxicity.30 Accumulating evidence links bile acid toxicity to oxidative stress; this may occur principally via production of ROS from mitochondrial stress.31 Alternatively, when cholestatic liver injury occurs, hepatocytes and Kupffer cells both secrete high levels of ROS. In response to this, KEAP1 in nearby cholangiocytes may release NRF2 to allow it to translocate to the nucleus. NRF2 then binds to antioxidant response elements in the promoter regions of cytoprotective/antioxidant genes to induce the transcription of ARE-regulated genes.6 NRF2 protects against oxidative stress-induced apoptosis by stimulating transcription of a battery of cytoprotective/defensive genes that protect cells against oxidative stress and promote cell survival.32, 33
The current work suggests that NRF2 inhibition of ITPR3 expression also may help explain the molecular basis for ductular cholestasis, which suggests new molecular targets that could have clinical value in the treatment of patients with cholangiopathies. However, future work will be needed to understand whether loss of Ca2+- and ITPR3- mediated secretion is an important part of the response to oxidative stress or merely an innocent bystander.
Supplementary Material
ACKNOWLEDGMENTS
We thank Mateus Guerra and Emma Kruglov for support with calcium signaling experiments, and Albert Mennone and Tanaporn Khamphaya for assistance with animal work. We thank Kathy Harry for hepatocyte isolation, and Roberto Scirpo and Ambra Villani for cholangiocyte isolation. We thank Gianfranco Alpini (Texas A&M) for providing small and large mouse cholangiocytes, Mario Strazzabosco (Yale) for providing primary mouse cholangiocytes, and Jeffrey Johnson (University of Wisconsin) for providing adenoviral vectors encoding GFP and Nrf2.
Grant Support: This study was supported by National Institutes of Health Grants DK45710, DK61747, DK57751 (to M.H.N) and DK34989 (the Yale Liver Center).
Abbreviations
- ANIT
alpha-napthylisothiocyanate
- EHBA
extrahepatic biliary atresia
- EMSA
electrophoretic mobility shift assay
- GST
glutathione S-transferase
- GCS
gamma-glutamate-cysteine synthetase
- GCLC
glutamate cysteine ligase catalytic subunit
- HO-1
heme oxygenase
- H3K9
histone H3 lysine 9
- H3K27
histone H3 lysine 27
- ITPR
inositol 1,4,5-trisphosphate receptor
- IBDU
intrahepatic rat bile duct unit
- KEAP1
the actin-associated kelch-domain protein 1
- MARE
musculo-aponeurotic fibrosarcoma (Maf) recognition element
- NRF2
nuclear factor-erythroid 2-like 2
- NQO1
NAD(P)H:quinone oxidoreductase 1
- PBC
primary biliary cirrhosis
- PSC
primary sclerosing cholangitis
- ROS
reactive oxygen species
- t-BHQ
tert-butyl hydroquinone
Footnotes
Publisher's Disclaimer: This is a PDF file of an unedited manuscript that has been accepted for publication. As a service to our customers we are providing this early version of the manuscript. The manuscript will undergo copyediting, typesetting, and review of the resulting proof before it is published in its final citable form. Please note that during the production process errors may be discovered which could affect the content, and all legal disclaimers that apply to the journal pertain.
Disclosures: The authors who have taken part in this study declare that they do not have anything to disclose regarding funding or conflict of interest with respect to this manuscript.
Author Contributions:
J Weerachayaphorn and MH Nathanson designed research.
J Weerachayaphorn, C Spirli, MJ Amaya, and P Chansela performed research.
KA Mitchell contributed human liver tissue biopsies.
M Ananthanarayanan contributed the ITPR3 promoter construct, and performed DNA methylation assays.
J Weerachayaphorn and C Spirli analyzed data.
J Weerachayaphorn and MH Nathanson wrote the paper.
REFERENCES
- 1.O'Hara SP, Tabibian JH, Splinter PL, et al. The dynamic biliary epithelia: molecules, pathways, and disease. J Hepatol. 2013;58:575–582. doi: 10.1016/j.jhep.2012.10.011. [DOI] [PMC free article] [PubMed] [Google Scholar]
- 2.Hirata K, Dufour JF, Shibao K, et al. Regulation of Ca(2+) signaling in rat bile duct epithelia by inositol 1,4,5-trisphosphate receptor isoforms. Hepatology. 2002;36:284–296. doi: 10.1053/jhep.2002.34432. [DOI] [PMC free article] [PubMed] [Google Scholar]
- 3.Shibao K, Hirata K, Robert ME, et al. Loss of inositol 1,4,5-trisphosphate receptors from bile duct epithelia is a common event in cholestasis. Gastroenterology. 2003;125:1175–1187. doi: 10.1016/s0016-5085(03)01201-0. [DOI] [PMC free article] [PubMed] [Google Scholar]
- 4.Minagawa N, Nagata J, Shibao K, et al. Cyclic AMP regulates bicarbonate secretion in cholangiocytes through release of ATP into bile. Gastroenterology. 2007;133:1592–1602. doi: 10.1053/j.gastro.2007.08.020. [DOI] [PMC free article] [PubMed] [Google Scholar]
- 5.Roma MG, Sanchez Pozzi EJ. Oxidative stress: a radical way to stop making bile. Ann Hepatol. 2008;7:16–33. [PubMed] [Google Scholar]
- 6.Kensler TW, Wakabayashi N, Biswal S. Cell survival responses to environmental stresses via the Keap1-Nrf2-ARE pathway. Annu Rev Pharmacol Toxicol. 2007;47:89–116. doi: 10.1146/annurev.pharmtox.46.120604.141046. [DOI] [PubMed] [Google Scholar]
- 7.Fiedler MJ, Nathanson MH. The type I inositol 1,4,5-trisphosphate receptor interacts with protein 4.1N to mediate neurite formation through intracellular Ca waves. Neurosignals. 2011;19:75–85. doi: 10.1159/000324507. [DOI] [PMC free article] [PubMed] [Google Scholar]
- 8.Spirli C, Nathanson MH, Fiorotto R, et al. Proinflammatory cytokines inhibit secretion in rat bile duct epithelium. Gastroenterology. 2001;121:156–169. doi: 10.1053/gast.2001.25516. [DOI] [PubMed] [Google Scholar]
- 9.Tanigawa S, Fujii M, Hou DX. Action of Nrf2 and Keap1 in ARE-mediated NQO1 expression by quercetin. Free Radic Biol Med. 2007;42:1690–1703. doi: 10.1016/j.freeradbiomed.2007.02.017. [DOI] [PubMed] [Google Scholar]
- 10.Arrowsmith CH, Bountra C, Fish PV, et al. Epigenetic protein families: a new frontier for drug discovery. Nat Rev Drug Discov. 2012;11:384–400. doi: 10.1038/nrd3674. [DOI] [PubMed] [Google Scholar]
- 11.Kouzarides T. Chromatin modifications and their function. Cell. 2007;128:693–705. doi: 10.1016/j.cell.2007.02.005. [DOI] [PubMed] [Google Scholar]
- 12.Moi P, Chan K, Asunis I, et al. Isolation of NF-E2-related factor 2 (Nrf2), a NF-E2-like basic leucine zipper transcriptional activator that binds to the tandem NF-E2/AP1 repeat of the beta-globin locus control region. Proc Natl Acad Sci U S A. 1994;91:9926–9930. doi: 10.1073/pnas.91.21.9926. [DOI] [PMC free article] [PubMed] [Google Scholar]
- 13.Motohashi H, O'Connor T, Katsuoka F, et al. Integration and diversity of the regulatory network composed of Maf and CNC families of transcription factors. Gene. 2002;294:1–12. doi: 10.1016/s0378-1119(02)00788-6. [DOI] [PubMed] [Google Scholar]
- 14.Samuel T, Fadlalla K, Turner T, et al. The flavonoid quercetin transiently inhibits the activity of taxol and nocodazole through interference with the cell cycle. Nutr Cancer. 2010;62:1025–1035. doi: 10.1080/01635581.2010.492087. [DOI] [PMC free article] [PubMed] [Google Scholar]
- 15.Shan BE, Wang MX, Li RQ. Quercetin inhibit human SW480 colon cancer growth in association with inhibition of cyclin D1 and survivin expression through Wnt/beta-catenin signaling pathway. Cancer Invest. 2009;27:604–612. doi: 10.1080/07357900802337191. [DOI] [PubMed] [Google Scholar]
- 16.Doctor RB, Matzakos T, McWilliams R, et al. Purinergic regulation of cholangiocyte secretion: identification of a novel role for P2X receptors. Am J Physiol Gastrointest Liver Physiol. 2005;288:G779–G786. doi: 10.1152/ajpgi.00325.2004. [DOI] [PubMed] [Google Scholar]
- 17.Dranoff JA, Masyuk AI, Kruglov EA, et al. Polarized expression and function of P2Y ATP receptors in rat bile duct epithelia. Am J Physiol Gastrointest Liver Physiol. 2001;281:G1059–G1067. doi: 10.1152/ajpgi.2001.281.4.G1059. [DOI] [PubMed] [Google Scholar]
- 18.Nathanson MH, Burgstahler AD, Mennone A, et al. Characterization of cytosolic Ca2+ signaling in rat bile duct epithelia. Am J Physiol. 1996;271:G86–G96. doi: 10.1152/ajpgi.1996.271.1.G86. [DOI] [PubMed] [Google Scholar]
- 19.Hagar RE, Burgstahler AD, Nathanson MH, et al. Type III InsP3 receptor channel stays open in the presence of increased calcium. Nature. 1998;396:81–84. doi: 10.1038/23954. [DOI] [PMC free article] [PubMed] [Google Scholar]
- 20.Hernandez E, Leite MF, Guerra MT, et al. The spatial distribution of inositol 1,4,5-trisphosphate receptor isoforms shapes Ca2+ waves. J Biol Chem. 2007;282:10057–10067. doi: 10.1074/jbc.M700746200. [DOI] [PMC free article] [PubMed] [Google Scholar]
- 21.Sugawara H, Kurosaki M, Takata M, et al. Genetic evidence for involvement of type 1, type 2 and type 3 inositol 1,4,5-trisphosphate receptors in signal transduction through the B-cell antigen receptor. EMBO J. 1997;16:3078–3088. doi: 10.1093/emboj/16.11.3078. [DOI] [PMC free article] [PubMed] [Google Scholar]
- 22.Mennone A, Alvaro D, Cho W, et al. Isolation of small polarized bile duct units. Proc Natl Acad Sci U S A. 1995;92:6527–6531. doi: 10.1073/pnas.92.14.6527. [DOI] [PMC free article] [PubMed] [Google Scholar]
- 23.Hirata K, Nathanson MH. Bile duct epithelia regulate biliary bicarbonate excretion in normal rat liver. Gastroenterology. 2001;121:396–406. doi: 10.1053/gast.2001.26280. [DOI] [PubMed] [Google Scholar]
- 24.Berridge MJ, Lipp P, Bootman MD. The versatility and universality of calcium signalling. Nat Rev Mol Cell Biol. 2000;1:11–21. doi: 10.1038/35036035. [DOI] [PubMed] [Google Scholar]
- 25.Woo K, Sathe M, Kresge C, et al. Adenosine triphosphate release and purinergic (P2) receptor-mediated secretion in small and large mouse cholangiocytes. Hepatology. 2010;52:1819–1828. doi: 10.1002/hep.23883. [DOI] [PMC free article] [PubMed] [Google Scholar]
- 26.Ananthanarayanan M, Banales JM, Guerra MT, et al. Post-translational Regulation of the Type III Inositol 1,4,5-Trisphosphate Receptor by miRNA-506. J Biol Chem. 2015;290:184–196. doi: 10.1074/jbc.M114.587030. [DOI] [PMC free article] [PubMed] [Google Scholar]
- 27.Garber K. Biochemistry: A radical treatment. Nature. 2012;489:S4–S6. doi: 10.1038/489S4a. [DOI] [PubMed] [Google Scholar]
- 28.Sun J, Brand M, Zenke Y, et al. Heme regulates the dynamic exchange of Bach1 and NF-E2-related factors in the Maf transcription factor network. Proc Natl Acad Sci U S A. 2004;101:1461–1466. doi: 10.1073/pnas.0308083100. [DOI] [PMC free article] [PubMed] [Google Scholar]
- 29.Wild AC, Moinova HR, Mulcahy RT. Regulation of gamma-glutamylcysteine synthetase subunit gene expression by the transcription factor Nrf2. J Biol Chem. 1999;274:33627–33636. doi: 10.1074/jbc.274.47.33627. [DOI] [PubMed] [Google Scholar]
- 30.Tan KP, Yang M, Ito S. Activation of nuclear factor (erythroid-2 like) factor 2 by toxic bile acids provokes adaptive defense responses to enhance cell survival at the emergence of oxidative stress. Mol Pharmacol. 2007;72:1380–1390. doi: 10.1124/mol.107.039370. [DOI] [PubMed] [Google Scholar]
- 31.Palmeira CM, Rolo AP. Mitochondrially-mediated toxicity of bile acids. Toxicology. 2004;203:1–15. doi: 10.1016/j.tox.2004.06.001. [DOI] [PubMed] [Google Scholar]
- 32.Dinkova-Kostova AT, Holtzclaw WD, Cole RN, et al. Direct evidence that sulfhydryl groups of Keap1 are the sensors regulating induction of phase 2 enzymes that protect against carcinogens and oxidants. Proc Natl Acad Sci U S A. 2002;99:11908–11913. doi: 10.1073/pnas.172398899. [DOI] [PMC free article] [PubMed] [Google Scholar]
- 33.Wakabayashi N, Dinkova-Kostova AT, Holtzclaw WD, et al. Protection against electrophile and oxidant stress by induction of the phase 2 response: fate of cysteines of the Keap1 sensor modified by inducers. Proc Natl Acad Sci U S A. 2004;101:2040–2045. doi: 10.1073/pnas.0307301101. [DOI] [PMC free article] [PubMed] [Google Scholar]
Associated Data
This section collects any data citations, data availability statements, or supplementary materials included in this article.


