Abstract
Advances in modern X-ray sources and detector technology have made it possible for crystallographers to collect usable data on crystals of only a few micrometers or less in size. Despite these developments, sample handling techniques have significantly lagged behind and often prevent the full realization of current beamline capabilities. In order to address this shortcoming we have developed a surface acoustic wave-based method for manipulating and patterning crystals. This method, which does not damage the fragile protein crystals, can precisely manipulate and pattern micrometer and sub-micrometer sized crystals for data collection and screening. The technique is robust, inexpensive, and easy to implement. This method not only promises to significantly increase efficiency and throughput of both conventional and serial crystallography experiments, but also will make it possible to collect data on samples that were previously intractable.
Keywords: Serial Crystallography, Surface Acoustic Waves, Microfluidics, Acoustic Tweezers
X-ray crystallography is one of the most powerful techniques used to characterize the atomic-level details of molecules and complex structures at several size scales. The structural data provided by this technique have enabled significant advances in virtually all fields of chemistry, biology, and biomedicine. Macromolecular crystallography has been used to understand the fundamental processes of life, such as photosynthesis,[1] how the ribosome functions,[2] how transcription occurs,[3] or how transporters[4] or receptors[5] function. It is also used for structure-guided drug design to facilitate the identification and optimization of novel treatments for myriad diseases.[6] Moreover, crystallography helps to drive commercial development of many products, including improvements in crop yields,[7] the production of biofuels using micro-organisms,[8] and the engineering of enzymes as biocatalysts[9] for many industrial processes.
Typical crystallography experiments require three essential components: an X-ray source, diffraction-quality crystals, and a detector. Over the last several decades, significant advances have been made in X-ray sources. Modern synchrotron and free electron laser (FEL) sources are now capable of delivering greater than 1012 photons in short pulses in a coherent beam of 1 µm or less in size.[10] In addition, the latest generation of hybrid pixel array detectors allows for data collection rates above 100 Hz, noise-free readout, and shutterless data acquisition.[11] For data collection, the crystalline samples must be precisely oriented in the X-ray beam. Despite the advances in source and detector technology, the manipulation and harvesting of crystals is still carried out in much the same way as it has been for decades. While this is a reasonable method for large crystals in well-behaved solutions, this approach is extremely challenging or impossible for crystals of a few micrometers in size or less. Considering that many of the highly sought after targets in crystallography, including membrane proteins, viruses, and protein complexes, are inherently difficult to crystallize, the manipulation of micro- or nanometer sized crystals represents a significant bottleneck in the pathway from purified biomolecule to structure.[10d] While many beamlines at modern synchrotron and FEL sources can extract usable data from crystals as small as 2 – 5 µm or less in size, moving these crystals from the crystallization experiment to the beam remains a largely unresolved challenge in the field.
Attempts have been made to automate the manipulation of protein crystals using robotic devices,[12] optical tweezers,[13] or photoablation of thin films containing crystals.[14] All of these methods require expensive, highly sophisticated equipment and generate forces or heat that is detrimental to the fragile crystals. In addition, these methods suffer from low throughput. The most successfully implemented method for manipulating crystals uses acoustic droplet ejection.[15] This method ejects small droplets containing crystals onto a surface. It requires an expensive, complex setup. In addition, individual crystals are randomly positioned within the drops and must be individually located. This requires scanning through the drop with the X-ray beam, which exposes the crystal to unnecessary radiation damage and significantly hampers the throughput.
Herein, we describe a device that makes use of surface acoustic waves (SAWs) to manipulate and pattern protein crystals. SAWs are sound waves that are generated and propagate along the surface of elastic materials. During propagation of the waves, most of the energy is confined within one or two wavelengths perpendicular to the surface of the substrate.[16] The precise control of the phase front at the micrometer level makes SAWs well suited to control subjects at the micro/nanometer scale (SI, Movie 1). The use of SAW-based methods to manipulate plastic beads, cells, and even living organisms has recently been successfully implemented.[17] These SAW devices are compact and inexpensive. They use similar power intensities and frequencies as those used in ultrasonic imaging, which has proven to be extremely safe and biocompatible. With its biocompatibility, versatility, simplicity, and cost-effectiveness, this ‘acoustic tweezers’ technology is particularly suitable for precise and gentle control of the spatial organization of biological specimens.
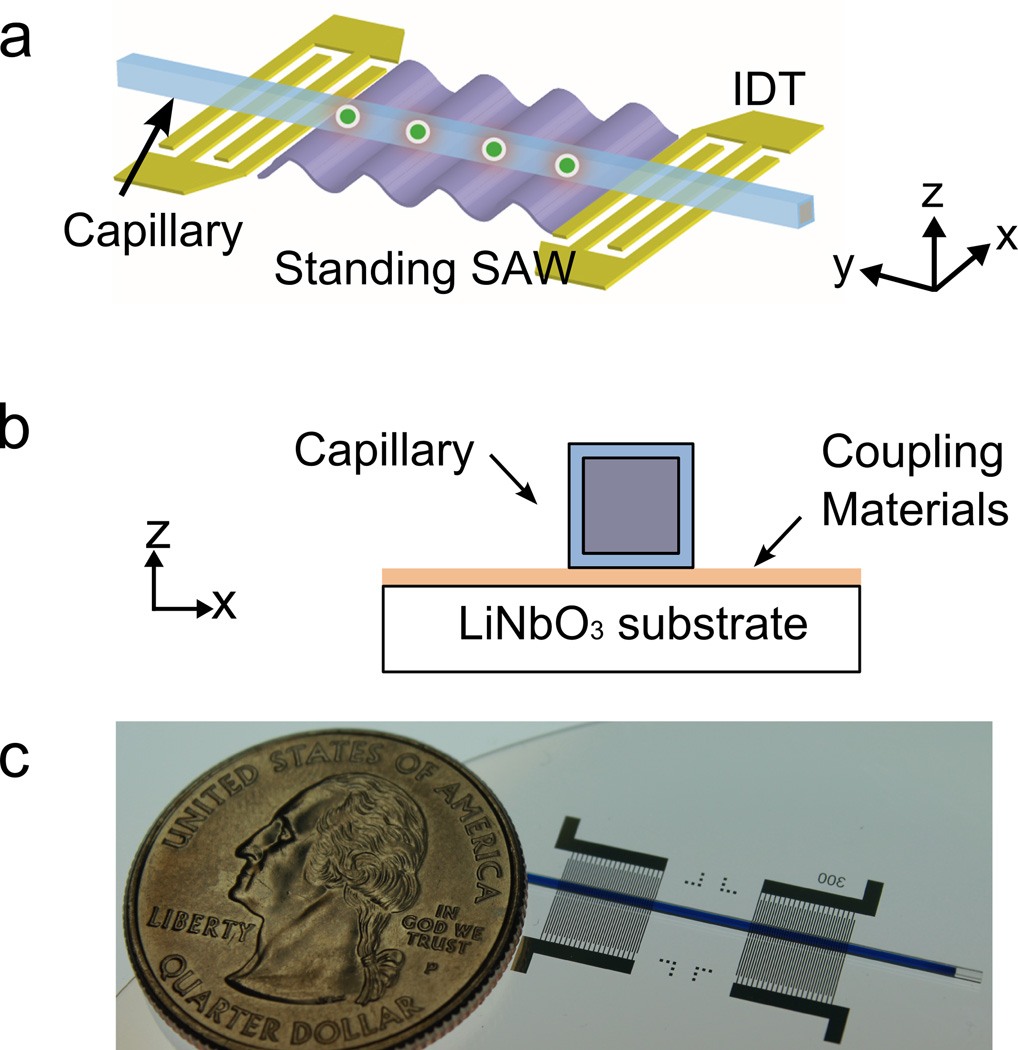
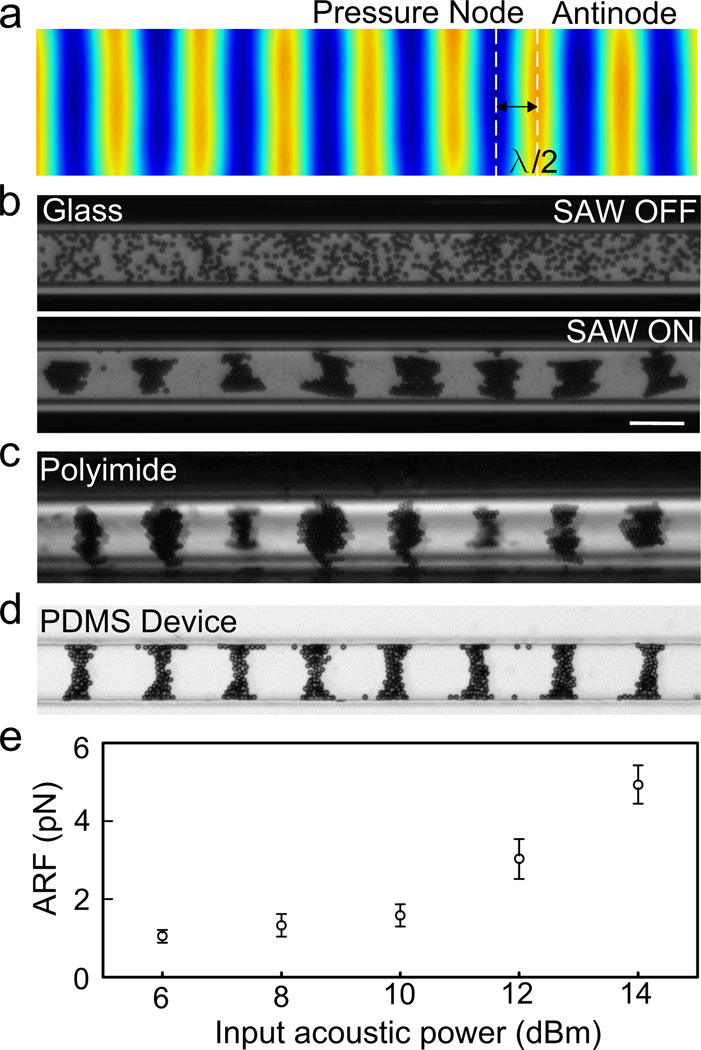
In order to demonstrate that protein crystals can be effectively and precisely manipulated using SAW technology, we fabricated a device by depositing interdigital transducers (IDTs) on a lithium niobate piezoelectric substrate (Fig. 1). For this device, each IDT had 40 pairs of electrodes with a period of 300 µm (for more detailed Materials and Methods, please see the Supporting Information). A capillary tube was then coupled to the substrate (Figs. 1b and c). We first tested the ability of this device to effectively generate standing SAWs using 10 µm polystyrene beads in various materials (such as glass, polyimide, and polydimethylsiloxane (PDMS)) employed by crystallographers. The predicted linear SAW pattern (Fig. 2a) was observed in glass capillaries, polyimide capillaries, and PDMS channels on glass substrates (Figs. 2b – 2d). The polyimide seems to be an excellent material for further optimization due to the low absorption of X-rays and reasonable acoustic properties.
Figure 1.
A SAW device used to manipulate crystals. Schematics showing (a) a top view and (b) a side view as well as (c) a photograph of the device are shown. The capillary tube, which can be square, round, or rectangular in cross-section, is coupled to the lithium niobate substrate using coupling gel or water.
Figure 2.
The SAW technology can be applied using various crystallography-compatible materials and generates low levels of force. Polystyrene beads are patterned using the SAW device and move as predicted (a) to pressure nodes in (b) glass capillaries (top: before patterning with SAW device; b: bottom, after patterning), (c) polyimide capillaries, or (d) PDMS device. The distance between the nodes is equal to ½ wavelength. (e) The acoustic radiation force (ARF) acting on a 10 µm bead during SAW manipulation is less than 10 pN. Scale bar = 100 µm.
One of the advantages of using SAW technology for fragile crystalline samples is the biocompatibility and low force used to pattern objects. The crystals or particles in the capillary under the coupled acoustic field are mainly subjected to acoustic radiation force and Stokes drag force. The Stokes drag force is a passive force, which is proportional to the velocity of the particle and opposite in direction of the particle migration.[18] The maximum force is located between a pressure node and a pressure antinode. When the standing SAWs propagate through the coupling materials and capillary wall (or glass substrate of a PDMS device), the acoustic radiation force pushes the suspended crystals or particles into the pressure nodes. The induced Stokes drag force then counters the acoustic radiation force. The velocity of the particles will thus reveal the acoustic radiation force acting on the particles. We recorded the movement of 10 µm polystyrene particles in a coupled PDMS device under the acoustic field with input acoustic power from 6 dBm to 14 dBm at a frequency of 13.4 MHz. The maximum velocities of 20 particles under different acoustic powers were used for force analysis. The dependence of acoustic radiation forces on input acoustic power for 10 µm polystyrene beads is shown in Fig. 2e. This demonstrates the low level of input power required to move small particles and the low levels of force driving these movements.
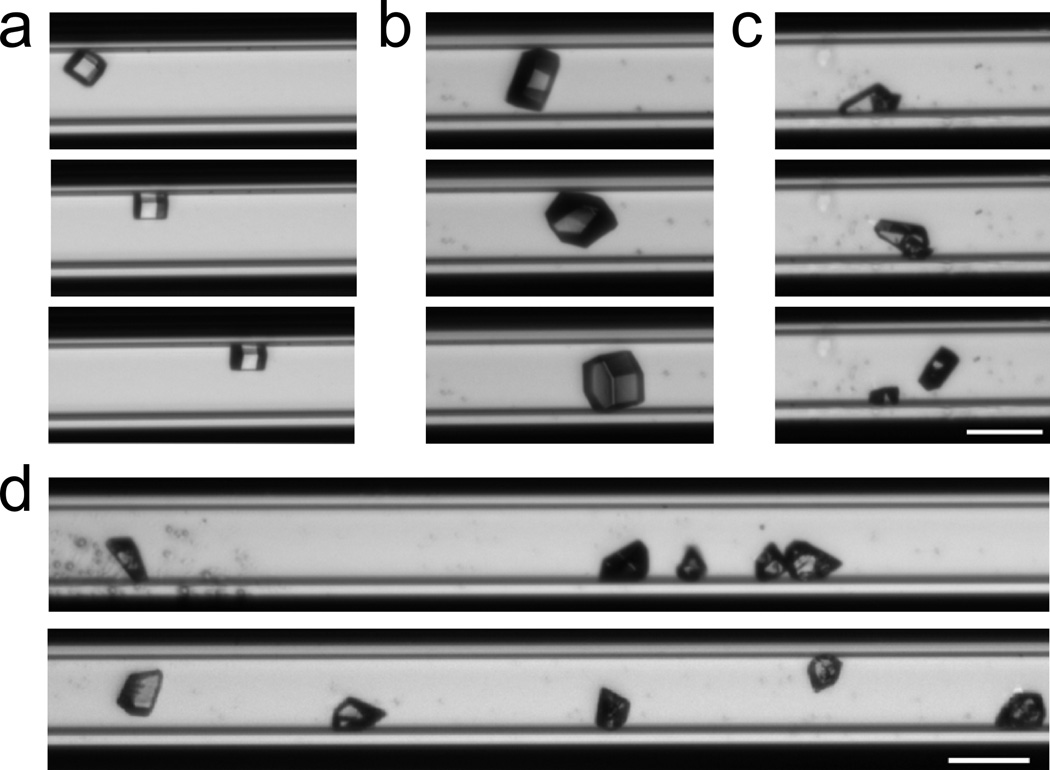
To demonstrate the ability of this device to move protein crystals, we loaded crystals of hen egg white lysozyme into a glass capillary and initiated SAWs while maintaining the two input radio frequency signals in the power range of 6 to 12 dBm. The protein crystals were observed to move in the capillary. Time lapsed images of this movement are given in Fig. 3 (see also Supporting Information: Movies 2 – 5). By modulating the phase angle between the two input signals or by tuning the input frequency around the resonance frequency, the position of the pressure nodes and thus the crystals could be continuously altered (SI, Movies 2 and 3). In addition, we observed that we could separate (SI, Movie 4) and align (SI, Movie 5) a cluster of crystals into a regular linear array (Fig. 3d). The inter-crystal spacing was consistent along the SAW field and equal to one half of the input wavelength, as expected. Importantly, no visible damage was observed during or after patterning the crystals using this method.
Figure 3.
The SAW device can effectively manipulate and pattern protein crystals. Time lapse images of crystals of various sizes and morphologies moved by the SAW device are shown in (a), (b), and (c). Clusters of crystals (d, top) can also be separated and patterned (d, bottom). The inter-crystal distance is equal to ½ wavelength of the input acoustic waves. Scale bar = 100 µm.
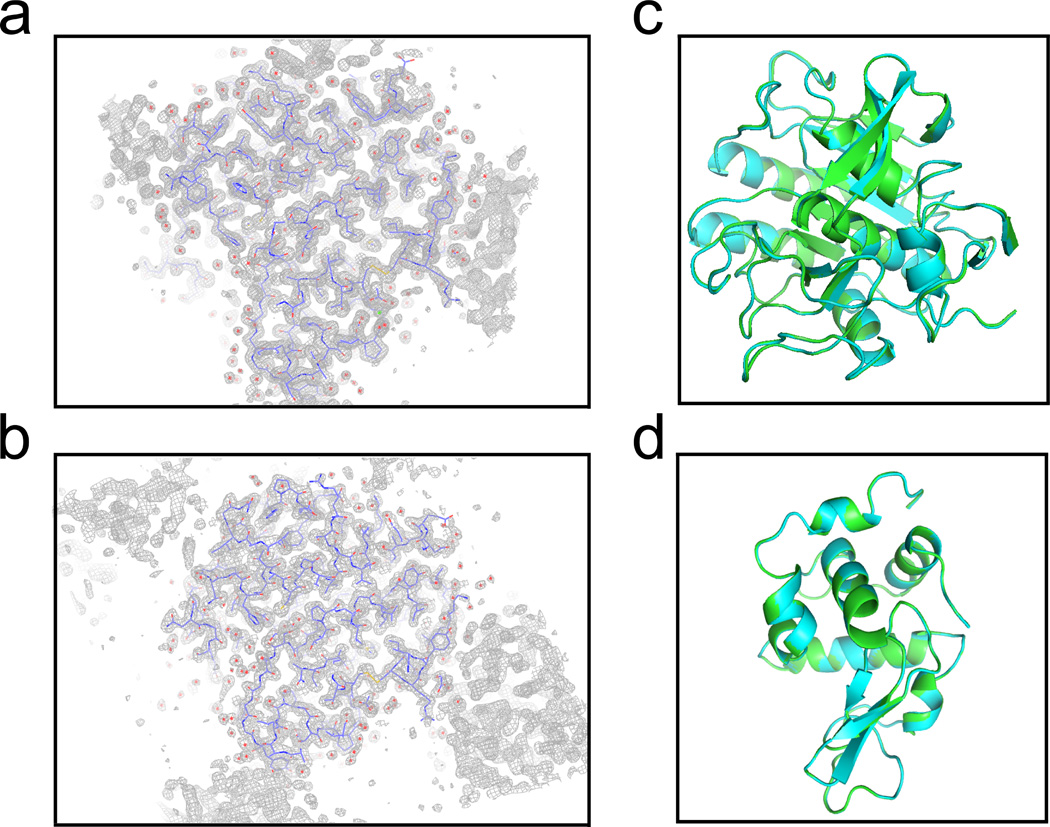
Any method that manipulates crystals for X-ray crystallography must be non-destructive and non-damaging of the samples. Crystals of proteins or other biomolecules generally contain approximately 50% water and thus tend to be very fragile and are also very sensitive to changes in environment, such as changing temperature. This necessitates the use of a technique that does not generate heat and uses gentle forces to move and pattern the crystals. The SAW technology is ideally suited for this purpose, as the acoustic radiation force required to move the objects in solution is very low (< 10 pN, Fig. 2e). To further assess the effect of SAW on protein crystals, we collected complete data sets for protein crystals (Lysozyme and Proteinase K) that had been subjected to SAWs for an extended period of time (30 seconds) and compared these to data collected from crystals not placed in the SAW device. For both cases where data was collected using a Cu-K-α home source (Proteinase K) or a synchrotron source (MacCHESS A1, Lysozyme), we did not observe a difference in any of the data-collection statistics (Table 1). High-quality electron density maps were generated for the crystals that had been subjected to SAWs and the resulting models were equivalent to those generated in the absence of SAWs (Fig. 4, RMSD = 0.15 Å for Proteinase K and = 0.08 Å for Lysozyme). To demonstrate the application of this technology for data collection on multiple crystals we first patterned a slurry of small (< 20 µm) crystals in a polyimide capillary tube and then collected 5 – 10 diffraction images in series from multiple crystals. We were able to assemble a high-quality, complete data set from these images with no noticeable effect from the SAW patterning (Table 1, Mult. Xtals). As shown in Table 1, the data collection parameters, including the resolution, the R-factor, and the size of the unit cell, were unaffected by the SAW treatment.
Table 1.
Comparison of Data Collection Statistics
| Prot. K Pre-SAW |
Prot. K Post-SAW |
Lysozyme Pre-SAW |
Lysozyme Post-SAW |
Lyozyme Mult. Xtals |
|
|---|---|---|---|---|---|
| Source | MicroMax-007 | MicroMax-007 | MacChess A1 | MacChess A1 | NSLS X25 |
| Wavelength (Å) | 1.54 | 1.54 | 0.978 | 0.978 | 1.10 |
| Resolution (Å) | 1.9 | 1.6 | 2.0 | 2.0 | 1.80 |
| Rmerge (%) | 10.8 (29.3)a | 8.8 (48.2) | 10.2 (47.1) | 7.4 (35.2) | 10.0 (29.6) |
| I/σ | 13.1 (3.2) | 10.9 (2.0) | 16.8 (3.1) | 21.5 (4.7) | 21.2 (5.1) |
| Completeness (%) | 91 (79) | 97 (93) | 100 (100) | 97 (99) | 98 (100) |
| Redundancy | 6.6 (4.2) | 3.7 (2.8) | 7.5 (7.8) | 7.2 (7.1) | 5.3 (4.8) |
| Space Group | P43212 | P43212 | P43212 | P43212 | P43212 |
| Unit Cell | a=b=67.84 | a=b=67.69 | a=b=79.35 | a=b=79.21 | a=b=77.90 |
| No. of reflections | 18,606 | 31,109 | 64,483 | 59,994 | 58,646 |
highest resolution shell provided in parentheses
Figure 4.
SAWs do not affect the diffraction quality of crystals. Protein crystals of proteinase K that had either been subjected to SAWs for an extended period of time or not subjected to a SAW field both yielded high-quality data that was used to derive the electron density map shown in (a) SAW-treated and (b) untreated. A model of proteinase K (blue backbone atoms) and the corresponding 2FO – FC map (gray) from which this model is derived is shown. The data collection statistics are given in Table 1. No noticeable difference is observed in models derived from data before patterning (cyan) or after patterning (green) for either (c) proteinase K or (d) lysozyme.
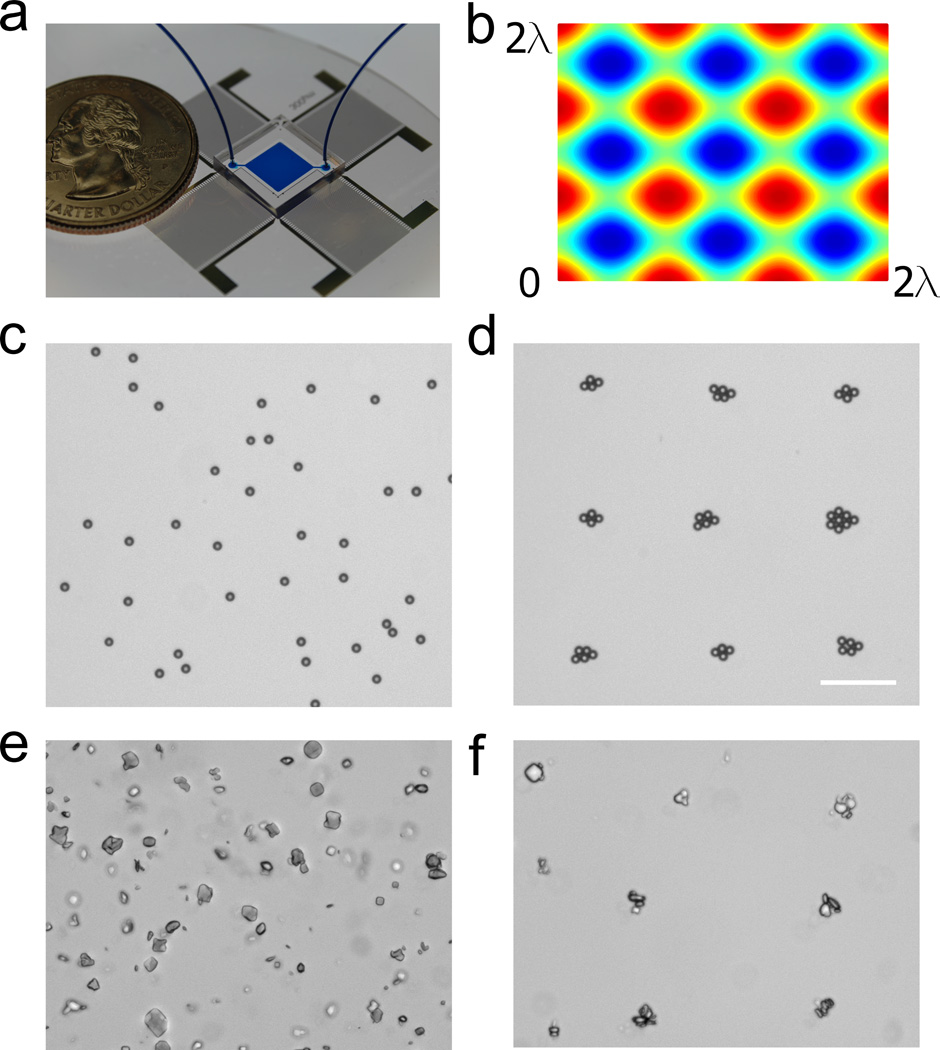
Having established that the SAW forces do not damage crystals, we proceeded to improve the throughput of this method. Since SAW devices are capable of patterning objects in two dimensions (2D) using orthogonal waves, we surmised that 2D arrays of crystals could be generated with this method. We fabricated a device with a PDMS chamber and two orthogonal pairs of IDT’s with a wavelength of 300 µm (Fig. 5a). By superimposing two orthogonal standing SAWs with different input frequencies (13.38 MHz and 13.44 MHz), a 2D array of pressure nodes can be created. Simulations show the predicted pattern of pressure nodes (Fig. 5b, blue). To test the efficacy of this device we patterned 10 µm polystyrene beads. The randomly positioned beads (Fig. 5c) moved into the acoustic wells (Fig. 5d) in the presence of the SAWs. Note that the starting concentration of beads in the suspension determines the bead density in the wells (i.e., number of beads per well). Similarly, when a suspension of protein microcrystals (Fig. 5e) is driven by SAWs, a similar array of protein crystals emerges (Fig. 5f). With the beads in suspension, the starting concentration of crystals determines the number of crystals per well. A large number of crystals is shown here to demonstrate the ability of the device to separate the crystals into the wells. With optimization of the starting concentration, an array of single crystals can be obtained. It is important to note that, despite the wide variation in size and shape of these crystals, they were all successfully patterned into the acoustic wells and resultant 2D array.
Figure 5.
The SAW method can be used to pattern objects in 2D arrays. (a) The device can pattern (c) a suspension of 10 µm beads into (d) a 2D array of defined dimensions as predicted by (b) the simulation. (e, f) A slurry of protein crystals can similarly be patterned. Note that the crystals in (e) and (f) do not have sharp edges due to the method in which they were grown (see detailed Materials and Methods in the Supporting Information). Scale bar = 100 µm.
As crystallographers move towards targets of higher molecular weight and complexity, it will be extremely important to maximize the quality and quantity of data collected from available crystalline samples. The recent advent of femtosecond serial crystallography has demonstrated the capability of collecting complete, high-quality data sets from samples of micrometer or sub-micrometer sized crystals.[10a,19] This approach, however, often requires vast quantities of sample owing to the low efficiency (hit-rate) of the sample delivery system. Acoustic methods, such as those detailed herein, promise to significantly increase the efficiency and throughput of serial crystallography methods as well as more conventional screening and data collection approaches. This technology offers high precision and high biocompatibility. It is easy and inexpensive to implement, using low-cost materials that are amenable to diffraction studies. It also has the advantage of aligning crystals with defined spacing and geometry. This eliminates the need to locate individual crystals, thus minimizing unwanted radiation damage and increasing throughput. We expect that the implementation of this method will significantly increase the efficiency and data quality of current crystallographic studies and provide opportunities to collect data in cases that would otherwise be problematic or impossible.
Supplementary Material
Acknowledgements
This work was supported by National Institutes of Health (1 R01 GM112048-01A1, 1R33EB019785-01, and 1DP2OD007209-01), National Science Foundation (CBET-1438126 and IIP-1346440), and the Penn State Center for Nanoscale Science (MRSEC) under grant DMR-0820404. Components of this work were conducted at the Penn State node of the NSF-funded National Nanotechnology Infrastructure Network.
Footnotes
Supporting Information
Supporting Information is available from the Wiley Online Library.
References
- 1.a) Deisenhofer J, Epp O, Miki K, Huber R, Michel H. Nature. 1985;318:618–624. doi: 10.1038/318618a0. [DOI] [PubMed] [Google Scholar]; b) Deisenhofer J, Michel H. Science. 1989;245:1463–1473. doi: 10.1126/science.245.4925.1463. [DOI] [PubMed] [Google Scholar]
- 2.a) Durniak KJ, Bailey S, Steitz TA. Science. 2008;322:553–557. doi: 10.1126/science.1163433. [DOI] [PMC free article] [PubMed] [Google Scholar]; b) Selmer M, Dunham CM, Murphy FVt, Weixlbaumer A, Petry S, Kelley AC, Weir JR, Ramakrishnan V. Science. 2006;313:1935–1942. doi: 10.1126/science.1131127. [DOI] [PubMed] [Google Scholar]
- 3.a) Bushnell DA, Westover KD, Davis RE, Kornberg RD. Science. 2004;303:983–988. doi: 10.1126/science.1090838. [DOI] [PubMed] [Google Scholar]; b) Westover KD, Bushnell DA, Kornberg RD. Science. 2004;303:1014–1016. doi: 10.1126/science.1090839. [DOI] [PubMed] [Google Scholar]
- 4.a) Dutzler R, Campbell EB, Cadene M, Chait BT, MacKinnon R. Nature. 2002;415:287–294. doi: 10.1038/415287a. [DOI] [PubMed] [Google Scholar]; b) Jiang Y, Lee A, Chen J, Ruta V, Cadene M, Chait BT, MacKinnon R. Nature. 2003;423:33–41. doi: 10.1038/nature01580. [DOI] [PubMed] [Google Scholar]
- 5.a) Haga K, Kruse AC, Asada H, Yurugi-Kobayashi T, Shiroishi M, Zhang C, Weis WI, Okada T, Kobilka BK, Haga T, Kobayashi T. Nature. 2011;477:549–555. doi: 10.1038/nature10753. [DOI] [PMC free article] [PubMed] [Google Scholar]; b) Rasmussen SG, et al. Nature. 2011;477:549–555. doi: 10.1038/nature10361. [DOI] [PMC free article] [PubMed] [Google Scholar]; c) Zhang C, Srinivasan Y, Arlow DH, Fung JJ, Palmer D, Zheng Y, Green HF, Pandey A, Dror RO, Shaw DE, Weis WI, Coughlin SR, Kobilka BK. Nature. 2012;492:387–392. doi: 10.1038/nature11701. [DOI] [PMC free article] [PubMed] [Google Scholar]
- 6.a) Williams SP, Kuyper LF, Pearce KH. Current opinion in chemical biology. 2005;9:371–380. doi: 10.1016/j.cbpa.2005.06.007. [DOI] [PubMed] [Google Scholar]; b) Wlodawer A, Vondrasek J. Annual review of biophysics and biomolecular structure. 1998;27:249–284. doi: 10.1146/annurev.biophys.27.1.249. [DOI] [PubMed] [Google Scholar]
- 7.Zhu XG, Long SP, Ort DR. Annual review of plant biology. 2010;61:235–261. doi: 10.1146/annurev-arplant-042809-112206. [DOI] [PubMed] [Google Scholar]
- 8.a) Eijsink VG, Vaaje-Kolstad G, Varum KM, Horn SJ. Trends in biotechnology. 2008;26:228–235. doi: 10.1016/j.tibtech.2008.02.004. [DOI] [PubMed] [Google Scholar]; b) Wilson DB. Current opinion in biotechnology. 2009;20:295–299. doi: 10.1016/j.copbio.2009.05.007. [DOI] [PubMed] [Google Scholar]
- 9.a) Burton SG, Cowan DA, Woodley JM. Nature biotechnology. 2002;20:37–45. doi: 10.1038/nbt0102-37. [DOI] [PubMed] [Google Scholar]; b) Zhao H, Chockalingam K, Chen Z. Current opinion in biotechnology. 2002;13:104–110. doi: 10.1016/s0958-1669(02)00291-4. [DOI] [PubMed] [Google Scholar]
- 10.a) Fromme P, Spence JC. Current opinion in structural biology. 2011;21:509–516. doi: 10.1016/j.sbi.2011.06.001. [DOI] [PMC free article] [PubMed] [Google Scholar]; b) Fuchs MR, Sweet RM, Berman LE, Hendrickson WA, Chubar O, Canestrari N, Idir M, Yang L, Schneider DK. J. Phys. Conf. Ser. 2014;493:012021. [Google Scholar]; c) Shneider DK, Berman LE, Chubar O, Hendrickson WA, Hulbert SL, Lucas M, Sweet RM, Yang L. J. Phys. Conf. Ser. 2013;425:012003. [Google Scholar]
- 11.a) Broennimann C, et al. Journal of synchrotron radiation. 2006;13:120–130. doi: 10.1107/S0909049505038665. [DOI] [PubMed] [Google Scholar]; b) Heroux A, et al. Journal of synchrotron radiation. 2014;21:627–632. doi: 10.1107/S1600577514003415. [DOI] [PMC free article] [PubMed] [Google Scholar]; c) Kraft P, et al. Journal of synchrotron radiation. 2009;16:368–375. doi: 10.1107/S0909049509009911. [DOI] [PMC free article] [PubMed] [Google Scholar]
- 12.a) Deller MC, Rupp B. Acta crystallographica. Section F, structural biology communications. 2014;70:133–155. doi: 10.1107/S2053230X14000387. [DOI] [PMC free article] [PubMed] [Google Scholar]; b) Juárez-Martínez G, Steinmann P, Roszak AW, Isaacs NW, Cooper JM. Analytical Chemistry. 2002;74:3505–3510. doi: 10.1021/ac0112519. [DOI] [PubMed] [Google Scholar]
- 13.Wagner A, Duman R, Stevens B, Ward A. Acta crystallographica. Section D, Biological crystallography. 2013;69:1297–1302. doi: 10.1107/S090744491300958X. [DOI] [PMC free article] [PubMed] [Google Scholar]
- 14.Cipriani F, Rower M, Landret C, Zander U, Felisaz F, Marquez JA. Acta crystallographica. Section D, Biological crystallography. 2013;68:1393–1399. doi: 10.1107/S0907444912031459. [DOI] [PubMed] [Google Scholar]
- 15.a) Soares AS, Engel MA, Stearns R, Datwani S, Olechno J, Ellson R, Skinner JM, Allaire M, Orville AM. Biochemistry. 2011;50:4399–4401. doi: 10.1021/bi200549x. [DOI] [PMC free article] [PubMed] [Google Scholar]; b) Roessler CG, Kuczewski A, Stearns R, Ellson R, Olechno J, Orville AM, Allaire M, Soares AS, Heroux A. Journal of Synchrotron Radiation. 2013;20:805–808. doi: 10.1107/S0909049513020372. [DOI] [PMC free article] [PubMed] [Google Scholar]
- 16.Cambell C, Burgess JC. J. Acoust. Soc. Am. 1991;89:1479–1480. [Google Scholar]
- 17.a) Ding X, Lin SC, Kiraly B, Yue H, Li S, Chiang IK, Shi J, Benkovic SJ, Huang TJ. Proceedings of the National Academy of Sciences of the United States of America. 2012;109:11105–11109. doi: 10.1073/pnas.1209288109. [DOI] [PMC free article] [PubMed] [Google Scholar]; b) Bourquin Y, Syed A, Reboud J, Ranford-Cartwright LC, Barrett MP, Cooper JM. Angew. Chem. Int. Ed. 2014;53:5587–5590. doi: 10.1002/anie.201310401. [DOI] [PMC free article] [PubMed] [Google Scholar]; c) Friend J, Yeo LY. Rev. Mod. Phys. 2011;83:647–704. [Google Scholar]; d) Franke T, Braunmüller S, Schmid L, Wixforth A, Weitz DA. Lab on a Chip. 2010;10:789–794. doi: 10.1039/b915522h. [DOI] [PubMed] [Google Scholar]; e) Sesen M, Alan T, Neild A. Lab on a Chip. 2014;14:3325–3333. doi: 10.1039/c4lc00456f. [DOI] [PubMed] [Google Scholar]; f) Li S, Guo F, Chen Y, Ding X, Li P, Wang L, Cameron CE, Huang TJ. Analytical Chemistry. 2014;86:9853–9859. doi: 10.1021/ac502453z. [DOI] [PMC free article] [PubMed] [Google Scholar]; g) Ding X, Peng Z, Lin SC, Geri M, Li S, Li P, Chen Y, Dao M, Suresh S, Huang TJ. Proceedings of the National Academy of Sciences of the United States of America. 2014;111:12992–12997. doi: 10.1073/pnas.1413325111. [DOI] [PMC free article] [PubMed] [Google Scholar]; h) Guo F, Li P, French JB, Mao Z, Zhao H, Li S, Nama N, Fick JR, Benkovic SJ, Huang TJ. Proceedings of the National Academy of Sciences of the United States of America. 2014 doi: 10.1073/pnas.1422068112. accept. [DOI] [PMC free article] [PubMed] [Google Scholar]
- 18.a) Ding X, Li P, Lin SC, Stratton ZS, Nama N, Guo F, Slotcavage D, Mao X, Shi J, Costanzo F, Huang TJ. Lab on a Chip. 2013;13:3626–3649. doi: 10.1039/c3lc50361e. [DOI] [PMC free article] [PubMed] [Google Scholar]; b) Shi J, Yazdi S, Lin SC, Ding X, Chiang IK, Sharp K, Huang TJ. Lab on a chip. 2011;11:2319–2324. doi: 10.1039/c1lc20042a. [DOI] [PMC free article] [PubMed] [Google Scholar]; c) Bruus H. Lab on a Chip. 2012;12:1014. doi: 10.1039/c2lc21068a. [DOI] [PubMed] [Google Scholar]; d) Chen Y, Nawaz A, Zhao Y, Huang P, McCoy JP, Levine S, Wang L, Huang TJ. Lab on a Chip. 2014;14:916–923. doi: 10.1039/c3lc51139a. [DOI] [PMC free article] [PubMed] [Google Scholar]
- 19.a) Hunter MS, DePonte DP, Shapiro DA, Kirian RA, Wang X, Starodub D, Marchesini S, Weierstall U, Doak RB, Spence JC, Fromme P. Biophysical journal. 2011;100:198–206. doi: 10.1016/j.bpj.2010.10.049. [DOI] [PMC free article] [PubMed] [Google Scholar]; b) Spence JC, Chapman HN. Philosophical transactions of the Royal Society of London. Series B, Biological sciences. 2014;369:2013–0309. doi: 10.1098/rstb.2013.0309. [DOI] [PMC free article] [PubMed] [Google Scholar]; c) Chapman HN, et al. Nature. 2011;470:73–77. doi: 10.1038/nature09750. [DOI] [PMC free article] [PubMed] [Google Scholar]
Associated Data
This section collects any data citations, data availability statements, or supplementary materials included in this article.


