

Abstract
Currently, the stage of embryo development has been proposed as one of many criteria for identifying healthy embryos in infertility clinics with the fastest embryos being highlighted as the healthiest. However the validity of this as an accurate criterion with respect to genomic imprinting is unknown. Given that embryo development in culture generally requires an extra day compared to in vivo development, we hypothesized that loss of imprinting correlates with slower rates of embryonic development. To evaluate this, embryos were recovered at the 2-cell stage, separated into four groups based on morphological stage at two predetermined time points, and cultured to blastocysts. We examined cell number, embryo volume, embryo sex, imprinted Snrpn and H19 methylation, imprinted Snrpn, H19, and Cdkn1c expression, and expression of genes involved in embryo metabolism—Atp1a1, Slc2a1, and Mapk14—all within the same individual embryo. Contrary to our hypothesis, we observed that faster developing embryos exhibited greater cell numbers and embryo volumes as well as greater perturbations in genomic imprinting and metabolic marker expression. Embryos with slower rates of preimplantation development were most similar to in vivo derived embryos, displaying similar cell numbers, embryo volumes, Snrpn and H19 imprinted methylation, H19 imprinted expression, and Atp1a1 and Slc2a1 expression. We conclude that faster development rates in vitro are correlated with loss of genomic imprinting and aberrant metabolic marker expression. Importantly, we identified a subset of in vitro cultured embryos that, according to the parameters evaluated, are very similar to in vivo derived embryos and thus are likely most suitable for embryo transfer.
Keywords: DNA methylation, genomic imprinting, in vitro culture, metabolic genes, mouse embryo, preimplantation development
Cultured embryos with fast developmental rates exhibit greater cell numbers and embryo volumes, as well as greater perturbations in genomic imprinting and metabolic marker expression, than do their slow-developing counterparts.
INTRODUCTION
One of the first observations of the deleterious effects of embryo culture is the 18- to 24-h lag in the development of mouse embryos in vitro in reaching the blastocyst stage [1, 2]. Since then, while culture conditions for preimplantation embryos have steadily improved, even the best media currently available are suboptimal for embryo development [3, 4]. Cultured embryos from all mammalian species have reduced viability and reduced pregnancy rates following embryo transfer, display aberrant patterns and levels of gene expression, developmental abnormalities, and deviations in behavior, and are prone to metabolic and growth disorders [5–14]. Preimplantation embryos survive in vitro culture by adapting to the culture environment and stresses imposed by this environment [15].
Our group and others have demonstrated that preimplantation embryo culture disrupts genomic imprinting [5, 9, 16, 17]. Genomic imprinting is an epigenetic phenomenon where expression is dictated by parental origin. The allele from one parent is expressed while the other parental allele is silenced. This occurs though DNA methylation, where a methyl group is covalently linked to cytosines within CpG dinucleotides, as well as other epigenetic modifications [18, 19]. Imprinted methylation is acquired differentially during gametogenesis and is maintained during preimplantation embryo development when the maternal and paternal genomes are globally demethylated. These critical stages of imprint regulation coincide with the use of assisted reproduction technologies (ARTs), with preimplantation maintenance of genomic imprinting susceptible to disruption. In vitro culture of mouse preimplantation embryos results in loss of imprinted gene regulation with biallelic expression of the H19 gene and loss of H19, Snrpn, and Peg3 imprinted methylation [5, 9, 16, 17]. Our recent comparison of six embryo culture media showed that while all are suboptimal in their ability to maintain imprinting, some media systems perform better while others were decidedly worse, such as Whitten medium, human tubal fluid medium, and growth media G1.5 and G2.5 [17].
In humans, while the absolute risks remain low, ARTs have been linked to imprinting perturbations that lead to the development of Angelman syndrome (AS) and Beckwith-Wiedemann syndrome (BWS) [20–28]. AS is a neurological disorder that is caused by loss-of-function of maternally transcribed genes within the 15q11-13 imprinting domain. In AS patients conceived by assisted reproduction, imprinting defects at the maternal small nuclear ribonucleoprotein N (SNRPN) imprinting control region (ICR) result in loss of maternal-specific SNRPN methylation, and the entire maternal imprinted domain acquires a paternal epigenetic identity [20, 24, 27, 28].
BWS is an overgrowth disorder whose etiology has been linked to two specific imprinted domains at 11p15.5: H19 and KCNQ1OT1. Assisted reproduction is associated with perturbations in genomic imprinting at these imprinted domains. Imprinting defects at the maternal H19 ICR (2%–7% of patients) result in a gain of maternal-specific H19 methylation and overexpression of the paternally-transcribed insulin-like growth factor 2 gene, while imprinting defects at the KCNQ1OT1 (KCNQ1 overlapping transcript 1) ICR (50% of patients) result in loss of maternal-specific methylation at the KCNQ1OT1 ICR and biallelic repression of maternally expressed genes across the imprinting domain, including cyclin-dependent kinase inhibitor 1 (CDKN1C) [21, 22, 25, 26]. Importantly, these imprinted domains are regulated by similar molecular mechanisms in humans and mice.
It is clear that the earliest stages of embryonic development are among the most critical for embryo viability and growth. Imprinting marks acquired during gametogenesis must be maintained during the preimplantation epigenetic reprogramming period. However, very little is known about the mechanisms that maintain genomic imprinting in the preimplantation embryo and how dysregulation of genomic imprinting during this period may lead to aberrant embryonic growth and development. In the mouse, cell divisions from the 2-cell to blastocyst stage occur approximately every 10–18 h in vivo, with development from fertilization to blastocyst stage spanning approximately 3.5 days [1]. In contrast, embryos cultured in vitro to the blastocyst stage generally require an extra day of development. This has led us to hypothesize that loss of imprinting during early mouse development in culture will correlate with slower rates of embryonic development. To test our hypothesis, we separated embryos based on rates of development and examined cell number, embryo volume, and embryo sex, together with imprinted methylation and expression at two key loci, H19 and Snrpn, that are involved in the development of imprinting disorders observed in the ART population. Expression of a gene in the Kcnq1ot1 domain, Cdkn1c, was also examined. Given the variable response of individual embryos to in vitro culture, these analyses were performed in the same individual embryo. As slower rates of development may be linked with metabolic changes, we evaluated the expression of three markers of embryonic metabolism: the alpha subunit of the Na+/K+ ATPase (Atp1a1), which is critical for blastocoel formation [29], solute carrier 2a1 (Slc2a1/Glut1), a glucose transporter expressed throughout preimplantation development [30, 31], and mitogen-activated protein kinase 14 (Mapk14/p38 alpha), which is a signaling molecule involved in embryo response to suboptimal environments [32–34] and in trophoblast differentiation [35, 36].
MATERIALS AND METHODS
Embryo Collection
Embryos were obtained from naturally mated C57BL6 (CAST7partial6) (B6[CAST7p6]) females crossed with C57BL6 (B6) males (Charles River Laboratories). These mice contain two Mus musculus castaneus chromosome 7 on a B6 background [17, 37]. Polymorphisms between B6(CAST7p6) and C57BL/6 (B6) mice allow for subsequent identification of maternal and paternal alleles. In this study, natural matings were employed as we previously determined that superovulation results in imprinting perturbations [37]. Briefly, B6(CAST7p6) females were checked for estrus and mated with B6 males. Pregnancy was determined (vaginal plug) the morning following mating (0.5 days postcoitum [dpc]). The time of ovulation was considered the midpoint of the light:dark cycle at 100 h. Embryos were flushed from isolated oviducts at 1.5 dpc to recover 2-cell embryos. To match control and cultured embryos, we turned to the early work by Anne McLaren who obtained in vivo derived embryos in the absence of superovulation and compared them to embryos cultured from the 2-cell to blastocyst stage, as performed here. Her group recovered 32-cell embryos at 82–83 h after ovulation for in vivo derived embryos and 94–113 h after ovulation for embryos cultured from the 2-cell stage [1, 38]. Note that at these times, embryos were morphologically at the morula and blastocyst stages [38]. When only blastocysts were analyzed, mean cell counts of 32 cells was obtained by 80 h after ovulation. We collected cultured blastocysts at 107–108 h after ovulation and in vivo derived blastocysts at 80 h after ovulation (Day 3.3). In vivo controls recovered at 83–84 h were hatched or implanted. Experiments were performed in compliance with guidelines set by the Canadian Council for Animal Care, and the policies and procedures were approved by the University of Western Ontario Council on Animal Care.
Embryo Culture
Embryos were flushed at the 2-cell stage, washed twice, and cultured in Whitten medium (made in-house) [39] at a density of 1 embryo/μl of medium in either 10, 15, or 20 μl drops with filter-sterilized mineral oil overlay (Sigma). Embryos were cultured in 37°C and 5% CO2 in air for 3 days to the blastocyst stage, and were then separated into four groups during the culture period. Culture drops were prepared prior to 900 h on the morning of separation and allowed to equilibrate. The first separation was performed between 1400 and 1600 h on Day 1 of culture (Fig. 1A). Embryos in the fast group contained ≥8 cells and were transferred to new culture drops, while embryos in the slow group contained <8 cells and were transferred to separate culture drops. On Day 2 of culture, embryos were again separated between 1400 and 1600 h. Embryos in the fast/fast (FF) group had begun cavitation, while those in the fast/slow (FS) group had not. Embryos in the slow/fast (SF) group had reached the compacted morula stage, while those in the slow/slow (SS) group had not yet compacted. All the embryo groups were transferred to new preequilibrated culture drops. At noon on Day 3 of culture, embryos were subjected to image analysis and then placed in individual tubes in approximately 1 μl culture medium, snap frozen on dry ice, and stored at −80°C. Embryo culture was performed 12 times, and embryos were analyzed from greater than 24 litters.
FIG. 1. .

A) Graphical representation of the embryo separation scheme. At the first separation, embryos were divided into fast and slow groups based on whether they reached the 8-cell stage or not. At the second separation, the original fast group was split into fast/fast (FF) and fast/slow (FS) groups based on whether they had a cavity or not, and the original slow group was divided into slow/fast (SF) and slow/slow (SS) based on whether they were compacted or not. B) Individual blastocyst assay for multiple data sets. Top left: merge of bright field and Hoechst 33342 staining used to count cell numbers. Top right: Sry expression analysis used for embryo sex determination. L, ladder; F, female control; M, male control; Bl, blastocyst; -ve, negative control. Bottom left: paternal H19 methylation analysis. Filled circles, methylated CpG dinucleotides; unfilled circles, unmethylated CpGs. Each row represents one DNA strand. Bottom right: LightCycler H19 imprinted expression analysis that allows for quantitation of allelic expression. Blastocyst FS23 had 48 cells and a volume of 3.5 × 105 μm3, was male, and displayed 70% hypermethylation on the H19 paternal allele and biallelic H19 expression with 19% activation from the normal silent paternal allele.
Imaging and Cell Counting
On Day 3 of embryo culture prior to freezing, embryos were transferred to culture drops containing Hoechst 33342. This dye was chosen because it binds in the minor groove of DNA and does not intercalate between the base pairs. Prior to experimental analysis, we determined that Hoechst 33342 staining had no effect on downstream methylation analyses of embryonic DNA (data not shown). Embryos were incubated in Hoechst 33342 for 7–10 min and transferred to fresh drops of Whitten medium for imaging. Images were obtained using Fluoview 1000 laser scanning confocal microscope (Olympus Corp.), using the 20× objective (Olympus superapochromat 0.75), with a band pass of 425–475 nm for Hoechst. Z-stacks were taken for each embryo with a distance of 4 μm between each slice. Bright field images were also taken of each embryo to facilitate downstream cell counting. Cell counting was performed in duplicate from the top and from the bottom of each Z-stack using Fluoview V10-ASW 2.1 software. Embryo volume was calculated from two measurements of embryo length (μm) taken in perpendicular planes using the Image Pro Analyzer 6.2. software. These lengths were averaged and then divided by 2 to generate an average radius for each embryo. The volume of a sphere was used to calculate embryo volumes.
Analysis of Imprinted Methylation and Expression
Bisulfite mutagenesis and imprinted expression analysis was performed as described previously [17, 37] with modifications to allow the concurrent analysis of imprinted methylation and expression (Fig. 1B). Briefly, individually stored embryos were quickly thawed on ice, and 10 μl of Dynabead lysis buffer (Invitrogen) was added to each tube. The lysate was transferred to a new tube with preequilibrated oligo-dT Dynabeads (Invitrogen). RNA-oligo-dT hybridization was conducted for 5 min at room temperature with shaking. Samples were then placed in the magnet, and the supernatant containing DNA was transferred back to the original tube for bisulfite mutagenesis as previously described [37]. Messenger RNA-Dynabead complexes were processed, and a cDNA library was generated as previously described [17]. Analysis of imprinted expression of H19 and Snrpn was performed using the LightCycler Real Time PCR system (Roche Molecular Biochemicals) as previously described [17].
Following bisulfite mutagenesis, nested PCR, cloning, and sequencing was performed for H19 and Snrpn ICR as previously described [17]. Forty to 50 clones per embryo were sequenced. Each sequence was analyzed for location and the number of converted and unconverted non-CpG-associated cytosines to obtain conversion rates (number of converted non-CpG cytosines/total number of non-CpG cytosines) as well as total number and location of CpG-associated cytosines. Sequences with less than 85% conversion rates were not included to ensure that unconverted Cs were due to methylation and not simply a deficiency in bisulfite conversion. Identical clones (identical location and number of unconverted CpG-associated cytosines and identical location and number of unconverted non-CpG-associated cytosines) were included only once. Multiple polymorphisms present between B6 and CAST sequences at each region analyzed allowed discrimination between parental alleles. Hypermethylation of a DNA strand was defined as >50% methylated CpGs on a given strand.
Cdkn1c Imprinted Expression Analysis
The analysis of imprinted Cdkn1c expression was performed using the cDNA library generated for each embryo. PCR primers and parameters can be found in Table 1.
TABLE 1. .
Primers and conditions for PCR analyses.

Amplification was tested using SYBR green to allow determination of the range of cycles located in log-phase amplification. PCR on subsequent embryos was performed to ensure that amplification was log-phase upon completion of the PCR program. Following amplification, the embryos were digested with the TaqaI restriction enzyme to determine allelic identity [9]. The B6 allele is cleaved into 306- and 58-bp fragments, while the CAST allele is cut into 257-, 58-, and 49-bp fragments. Densitometry was performed using the Opticon Monitor software (BioRad).
Sex Determination in Individual Embryos
The cDNA library generated for each embryo was used for the analysis of embryo sex. Two PCR reactions were performed for each embryo. The first was a nested PCR for the Sry gene that is located on the Y chromosome, and second was amplification of Xist, a gene located on the X chromosome (Table 1). Samples were visualized with gel electrophoresis on a 12% acrylamide gel. The presence of Sry and Xist amplicons indicated a male embryo, while amplification of Xist alone indicated a female embryo (Fig. 1B). Nested PCR for Sry was performed in duplicate.
Expression Analysis of Atp1a1, Slc2a1, and Mapk14
The evaluation of Atp1a1, Slc2a1, and Mapk14 expression was performed using the cDNA library generated for each embryo, with mitochondrial ribosomal protein L1 (Mrpl1) serving as the internal control. Primers and PCR parameters can be found in Table 1. Second strand synthesis was performed using the forward primers of both Mrpl1 and the gene of interest, and amplification products were then split into separate reactions for RT-PCR for Mrpl1 and the gene of interest. Amplification was performed on biological replicates with SYBR green using the BioRad Opticon Monitor Real Time PCR machine and software. Analysis of RT-PCR was performed using the ΔΔCt method with GeneEx (BioRad) software.
Statistical Analysis
To compare between culture groups and between cultured and in vivo derived embryos, a nested two-factor ANOVA was performed using R [40]. The five groups of embryos were compared with respect to embryo volume; cell number; embryo sex; H19 and Snrpn methylation levels; Snrpn, H19, and Cdkn1c imprinted expression; and Atp1a1, Slc2a1, and Mapk14 expression using the aov (analysis of variance) command. The effect size of each comparison that generated a significant P value was estimated using the lm (linear model) function, setting the intercept of the model at zero. This was used to determine which groups were most similar to in vivo derived embryos. A P value less than 0.05 was taken to be statistically significant.
RESULTS
Effects of Embryo Culture on Blastocyst Cell Number and Volume
The aim of our study was to determine whether any correlation existed between rates of preimplantation embryo development and loss of genomic imprinting. To best evaluate these effects, experiments were done at the individual embryo level because we previously reported significant interembryo variability in response to ARTs [17, 37] and because this is the level of importance in the human ART clinic. As such, we have developed a novel method to evaluate both imprinted methylation and expression of multiple loci in the same individual blastocyst as well as obtain data about cell numbers, embryo volume, and embryo sex. This is the first study of its kind to evaluate multiple parameters to correlate morphological changes with epigenetic changes at the individual embryo level.
On the premise that individual embryos develop at different rates in culture, embryos were separated into four groups based on their stage of development at two predetermined time points during the culture time course (Fig. 1A). These time points were chosen based on the ability to reproducibly distinguish between fast and slow at each separation. Whitten culture medium was used as we previously determined that culture in Whitten medium as well as HTF and G1.5/G2.5, two media systems used in the human clinic, produced significant perturbations in imprinted methylation [17]; Whitten medium was thus used as a representative of these media types. It also resulted in a frequency of imprinting defects that would allow us to determine whether a relationship between developmental rates and imprint maintenance existed. Multiple culture time courses were completed and a total of 68 embryos were collected for analysis, 24 FF, 10 FS, 19 SF, and 15 SS. Of these embryos, 47 (16 FF, 9 FS, 10 SF, and 12 SS) were analyzed for each of the following parameters: cell counts, embryo volume, embryo sex, and Snrpn, H19, and Cdkn1c imprinted expression (Fig. 1B). For the imprinted methylation analysis, 21 embryos were analyzed with 5–6 embryos per culture group. For the SS group, 40% of the embryos were developmentally compromised and arrested before the blastocyst stage (data not shown). For all the groups, only embryos that developed to the blastocyst stage were analyzed.
To determine whether differences existed in the total cell numbers present in each of the four culture groups, embryos were stained with Hoechst 33342, Z-stacks were taken using confocal microscopy, and cells were counted (Figs. 1B and 2A). We observed that on average the FF group contained 74.3 cells, the FS group contained 46.8 cells, the SF group contained 33.9 cells, the SS group contained 25.0, and the in vivo derived group contained 28.3 cells, which was similar to the results in previous studies [1, 38]. To evaluate whether differences in cell number were statistically different between groups, we used a nested two-factor ANOVA to compare the in vivo derived group with the fast (FF and FS) group, the in vivo derived group with the slow (SF and SS) group, and the fast group with the slow group at the first separation, as well as the FF group with the FS group and the SF group with the SS group in the second separation. With respect to the first separation, we observed that in vivo derived embryos contained significantly fewer cells than the fast group but failed to show a difference when compared to the slow group (Fig. 2B and Table 2), and that cell numbers present in the fast group was significantly greater than those in the slow group (Fig. 2B and Table 2). Therefore, not only was the fast group morphologically more advanced than the slow groups as determined by embryo stage at the time of separation, but the cell cycle progressed more quickly in embryos in the fast group compared to those in the slow group as determined by cell numbers. A statistically significant difference was also observed at the second separation with embryos clustering into three distinct groups (Fig. 2B and Table 2). The FF group contained the most cells. The FS group contained fewer than the FF group. The SF, SS, and in vivo derived groups contained fewer cells than the FS group but were indistinguishable from one another. Thus, the SF and SS groups most closely resembled the in vivo derived group.
FIG. 2. .

Cell numbers and embryo volumes of the four groups of cultured embryos and in vivo derived embryos. A) Representative embryos showing closest cell number and volume to mean of the group. Bar = 10 μm. B) Left: mean cell numbers in fast and slow groups based on the first separation. The fast group had significantly more cells than the in vivo derived group (*) and the slow group (**). Right: cell numbers separated by culture group. Each diamond represents one embryo, and black bars indicate mean cell number of each group. C) Left: mean embryo volume in fast and slow groups based on the first separation. Fast embryos had significantly larger volumes than in vivo derived (*) and slow embryos (**). Slow embryos displayed significantly fewer cells than in vivo derived embryos (*). Right: embryo volumes separated by culture group. Black bars indicate mean embryo volume of each group. Error bars represent standard errors of the mean.
TABLE 2. .
Significant differences amongst developmental groups for various parameters.*
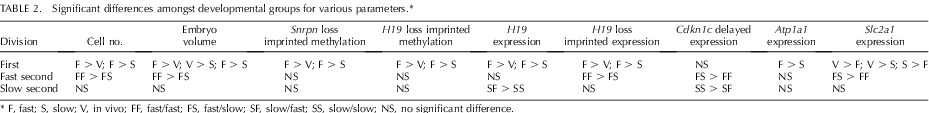
F, fast; S, slow; V, in vivo; FF, fast/fast; FS, fast/slow; SF, slow/fast; SS, slow/slow; NS, no significant difference.
The total volume of each embryo was also calculated. Mean volumes for the FF group were 6.7 × 105 μm3; the FS group, 3.8 × 105 μm3; the SF group, 3.3 × 105 μm3; the SS group, 3.5 × 105 μm3; and in vivo derived group, 4.9 × 105 μm3 (Fig. 2, A and C). As before, a nested two-factor ANOVA was performed to test for differences between embryos in the first and second separations. In vivo derived embryos displayed significantly smaller embryo volumes than the fast group, but significantly larger embryo volumes than the slow group (Fig. 2C). Fast embryos (FF and FS) also possessed significantly larger volumes than the slow (SF and SS) group. The second (FF versus FS) separation also displayed a significant difference in cell volume with embryo volumes clustering into three separate groups (Fig. 2C and Table 2). The FF embryos displayed the largest embryo volume, followed by in vivo derived embryos, with the three remaining groups displaying smaller embryo volumes (FS, SF, and SS were not significantly different from one another).
Effects of Embryo Culture on Embryo Sex Ratios
It has been suggested that male embryos develop faster than their female counterparts. For human embryos, some studies suggested that male embryos contain a greater number of cells than their female counterparts after in vitro fertilization (IVF) [41], while others report that this increase in cell number occurs with intracytoplasmic sperm injection and not with IVF alone [42] or vice versa [43]. In the mouse, some studies reported male to female sex ratio differences [44, 45], while another study reported no difference in embryo sex ratios [46]. In light of the above studies, the possibility existed that rates of development were unrelated to adverse affects of culture but instead were the result of embryo sex. To address this potential bias, a nested PCR was performed for Sry, which is only present in male embryos, while Xist, located on the X chromosome, was used as a PCR control and was detected in both male and female embryos (Fig. 1B). We observed more male embryos in the fast group (14 males, 11 females) than the slow group (10 males, 12 females) and more males in the FF group (10 males, 6 females) and more female embryos the SS groups (4 males, 8 females) compared to the FS (4 males, 5 females) and SF (6 males, 4 females) groups. These results were not statistically significant. A larger number of embryos will need to be analyzed to confirm these results. At this point, different developmental rates appeared to be unrelated to embryo sex. Furthermore, no correlation was found between embryo sex and the other parameters examined in this study.
Effects of Embryo Culture on Snrpn and H19 Imprinting
To test our hypothesis that slower developing embryos possess greater imprinting defects, we evaluated the ability of embryos to maintain genomic imprinting by examining two key loci, Snrpn and H19, in the four groups of cultured embryos. From our previous study [37], we showed that mean imprinted hypermethylation on the Snrpn maternal ICR in in vivo derived embryos was around 89%, with a threshold of methylation on the Snrpn maternal ICR of 70% hypermethylation. Embryos with hypermethylation levels below 70% were therefore considered to exhibit loss of methylation. For cultured embryos, 8 out of 11 fast embryos (FF and FS, 80%, 75%, 75%, 67%, 63%, 47%, 47%, 45%, 43%, 42%, and 36%) had a loss of maternal Snrpn methylation with a mean hypermethylation level of 56%, and 3 out of 10 slow embryos (SF and SS, 100%, 100%, 100%, 90%, 88%, 78%, 70%, 65%, 62%, and 50%) had lost maternal Snrpn methylation with a mean hypermethylation of 80% (Fig. 3). At the second division, the FF group displayed loss of methylation in five of six embryos (75%, 63%, 47%, 45%, 42%, and 36%) with a mean hypermethylation of 51%, and the FS group displayed a loss of methylation in three of five embryos (80%, 75%, 67%, 47%, and 43%) with a mean hypermethylation of 62% (Fig. 3). The SF group displayed loss of methylation in zero of the five embryos tested (100%, 90%, 88%, 78%, and 70%) with a mean hypermethylation of 85%, while the SS group displayed a loss of methylation at three of the five embryos (100%, 100%, 65%, 62%, and 50%) with a mean hypermethylation of 75% (Fig. 3). Overall, in vivo derived embryos [37] displayed higher levels of methylation than fast (FF and FS) embryos, while no difference was observed between in vivo derived controls and the slow (SF and SS) group. The slow group also had significantly higher levels of methylation than the fast group (Fig. 4 and Table 2). No difference was observed at the second separation. Thus, the slow group was best able to maintain imprinted methylation.
FIG. 3. .

Imprinted methylation analysis of the maternal Snrpn allele in fast, slow, fast/fast, fast/slow, slow/fast, and slow/slow groups. Mean hypermethylation levels are shown in brackets. Each group of circles represents one embryo, with the embryo name indicated in the top left. Percent hypermethylation is indicated in the top middle. Each row represents one DNA strand. Filled circles represent methylated CpG dinucleotides while unfilled circles represent unmethylated CpGs. Only data for the maternal allele are shown because no difference in the methylation status of the unmethylated paternal Snrpn allele was observed.
FIG. 4. .

Graphical representation of Snrpn and H19 hypermethylation levels in culture groups. Top: maternal Snrpn hypermethylation levels. Bottom: paternal H19 hypermethylation levels. Each diamond represents one embryo, and black bars represent mean hypermethylation levels in fast, slow, fast/fast (FF), fast/slow (FS), slow/fast (SF), and slow/slow (SS) groups. The asterisk (*) in diamonds indicates two to three embryos within the group with the same hypermethylation level.
A similar result was observed at the H19 ICR. In our previous study [37], we showed that mean imprinted hypermethylation on the H19 paternal ICR in in vivo derived embryos was around 90%, with a threshold of methylation on the H19 paternal ICR of 80% hypermethylation. Embryos with hypermethylation levels below 80% were considered to exhibit loss of methylation. For cultured embryos, 5 out of 10 fast embryos (FF and FS, 100%, 93%, 90%, 81%, 80%, 70%, 67%, 53%, 36%, and 33%) had lost paternal H19 methylation with a mean hypermethylation of 70%, and 4 out of 11 slow embryos (SF and SS, 100%, 100%, 100%, 94%, 91%, 88%, 83%, 78%, 75%, 75%, and 75%) had loss of paternal H19 methylation with a mean hypermethylation of 87% (Fig. 5). At the second division, the FF group displayed a loss of methylation in three of five embryos (100%, 90%, 67%, 36%, and 33%) with a mean methylation of 65%, while the FS group displayed loss of methylation at only two of five embryos (93%, 81%, 80%, 70%, and 53%) with a mean hypermethylation of 75% (Fig. 5). Two of six embryos in the SF group displayed loss of methylation (100%, 94%, 91%, 88%, 75%, and 75%), and two of five embryos in the SS group displayed loss of methylation (100%, 100%, 83%, 78%, and 75%) with a mean hypermethylation for both the SF and SS group of 87% (Fig. 5). Overall, in vivo derived controls displayed higher levels of methylation than the fast embryos, while no difference was observed between in vivo derived embryos and the slow group. The slow groups also possessed significantly higher mean levels of methylation than the fast group (Fig. 4 and Table 2). No difference was observed at the second separation. This indicates that the slower developing embryos were better able to maintain H19 imprinted methylation than their fast developing counterparts.
FIG. 5. .

Imprinted methylation analysis of the paternal H19 allele in fast, slow, fast/fast, fast/slow, slow/fast, and slow/slow groups. Mean hypermethylation levels shown in brackets. Each group of circles represents one embryo, with the embryo name indicated in the top left. Percent hypermethylation is indicated in the top middle. Each row represents one DNA strand. Filled circles represent methylated CpG dinucleotides while unfilled circles represent unmethylated CpGs. Only the data for the paternal allele are shown because no difference in the methylation status of the unmethylated maternal H19 allele was observed.
Next, we analyzed Snrpn and H19 imprinted expression in in vitro-cultured and in vivo derived embryos. Similar to previous experiments [16, 17], no effect on Snrpn imprinted expression was observed; all the embryos displayed paternal-specific Snrpn expression (data not shown). From our previous study, we have shown that in our mouse model H19 is expressed from only a small number of in vivo derived blastocysts (approximately one in nine) [17]. This expression was solely from the maternal allele. Analysis of imprinted H19 expression in the culture groups revealed that 19 out of 25 fast embryos expressed H19 with only nine of these embryos possessing maternal-specific expression, while 7 out of 24 slow embryos expressed H19 with all seven showing exclusive maternal expression (Fig. 6A). Thus, at the first separation, significantly fewer in vivo derived embryos and significantly fewer slow embryos expressed H19 compared with fast embryos (Table 2). No significant difference was observed in the number of embryos with H19 expression between in vivo derived and slow groups. With respect to imprinted expression, fast embryos showed a significantly greater loss of imprinted H19 expression than in vivo derived embryos and slow embryos. By comparison, slow embryos were more similar to in vivo derived controls at maintaining imprinted H19 expression. At the second separation, 12 out of 16 embryos exhibited H19 expression in the FF group with only 4 of these embryos maintaining monoallelic H19 expression from the maternal CAST allele (Fig. 6A). In addition, a significant number of embryos in the FF group displayed a switched expression pattern, where monoallelic expression occurred erroneously from the paternal allele but had not yet been activated from the maternal allele. This was improved in the FS group, where seven of nine embryos exhibited H19 expression with five maintaining imprinted expression, and was further improved in the SF group, where all the embryos displaying H19 expression (6 of 10) did so exclusively from the maternal allele. H19 expression in the SS group was most similar to in vivo derived controls, with 1 of 14 embryos displaying H19 expression, with the sole embryo expressing H19 exclusively from the maternal CAST allele. At the second separation, no significant difference in the number of embryos with H19 expression was observed for FF versus FS groups. However, within the slow group, more embryos in the SF group expressed H19 than the SS group. With respect to imprinted H19 expression, FF embryos showed significantly greater loss of imprinted H19 expression compared with the other groups.
FIG. 6. .

H19 and Cdkn1c imprinted expression analysis in the four groups of cultured embryos. Red bars indicate percent expression from the maternal allele, and blue bars indicate percent expression from the paternal allele. A) H19 imprinted expression analysis. B) Cdkn1c imprinted expression analysis. Embryo names are indicated on the X axis. C) Developmental Cdkn1c imprinted expression in in vivo derived embryos. Embryo stage indicated on the X axis: 4-cell, n = 2, 12 pooled embryos each; 8-cell, n = 2, 6 pooled embryos each; Early M, early morula, n = 2, 3 pooled embryos each; Late M, late morula, n = 2, 1 embryo each; Mid-BL, midblastocyst; n = 7, 1 embryo each; Late BL, late blastocyst; n = 3, 1 embryo each.
Effects of Embryo Culture on Cdkn1c Imprinted Expression
We also analyzed imprinted expression of a Kcnq1ot1 imprinted domain gene, Cdkn1c, in the four groups of cultured embryos (Fig. 6B) as well as in in vivo derived controls. All the embryos in the FF group showed monoallelic expression, except one embryo, which lacked Cdkn1c expression. Two embryos in the FS group expressed Cdkn1c from both parental alleles, while no embryos exhibited biallelic expression in the SF group. Two embryos in the SS group displayed biallelic expression, and three embryos showed Cdkn1c expression exclusively from the normally silent paternal allele. Overall, no significant difference in imprinted expression was observed at the first separation between the in vivo derived, fast, and slow groups. However, a significantly greater number of slow embryos from the second separation, FS and SS, displayed biallelic Cdkn1c expression compared with the fast FF and SF groups, which were not statistically different from in vivo derived controls (Table 2). This result appeared contradictory to the H19 imprinted expression pattern, leading us to question whether the observed data were related to developmental regulation of imprinted Cdkn1c expression rather than misregulation of Cdkn1c imprinting. Because the time course of Cdkn1c imprinted expression had not been fully elucidated in preimplantation embryo stages, we evaluated imprinted Cdkn1c expression in pools of in vivo derived 4-cell, 8-cell, and early morula as well as individual late morula and blastocyst stage embryos (Fig. 6C). Over this developmental time course, we observed an overall decrease in B6 expression, with 4- and 8-cell embryos displaying nearly equal levels of maternal and paternal expression, and late blastocysts displaying expression exclusively from the maternal allele. These data indicate that cultured embryos in the FS and SS groups displaying biallelic Cdkn1c expression were developmentally delayed compared with embryos in the FF and SF groups.
Effects of Embryo Culture on Metabolic Marker Expression
According to Leese's quiet embryo theory [47], embryos that are more affected by an in vitro culture environment will compensate by increasing their metabolic activity. We hypothesized that cultured embryos that develop faster and display a more frequent loss of imprinting will also show an increase in metabolic activity. To evaluate this hypothesis, we examined expression of three genes involved in early embryo metabolism: Atp1a1, Slc2a1, and Mapk14. Transcript abundance was examined in 11 FF, 9 FS, 10 SF, and 11 SS blastocysts as well as 5 in vivo derived controls, and the data were analyzed both before and after normalization for cell numbers. This was done to obtain additional information about whether changes in expression were attributed to an overall change in expression or a change in levels of expression per cell, respectively. For Atp1a1, in vivo derived embryos displayed expression levels intermediate to that of fast and slow cultured embryos, with the fast group having significantly higher Atp1a1 expression than the slow group at the first separation (Fig. 7A and Table 2). No significant difference was observed in mean levels of expression at the second separation. Normalization to cell numbers did not reveal any significant differences in expression between groups.
FIG. 7. .

Relative expression of genes involved in embryo metabolism in cultured and in vivo derived embryos. A) Left panel: mean relative Atp1a1 expression in fast and slow groups based on the first separation. Fast embryos displayed significantly higher Atp1a1 expression levels than slow embryos (**). Right panel: relative Atp1a1 expression in the four groups of cultured embryos and in vivo derived embryos. B) Left panel: mean relative Slc2a1 expression, corrected for cell numbers, in fast and slow groups based on the first separation. Fast and slow embryos displayed significantly lower Slc2a1 expression levels than in vivo derived embryos (*). Fast embryos displayed significantly lower Slc2a1 expression levels than slow embryos (**). Right panel: relative Slc2a1 expression corrected for cell numbers in the four groups of cultured embryos and in vivo derived embryos. C) Left panel: mean relative Mapk14 expression in fast and slow groups based on the first separation. No difference in mean relative Mapk14 expression was observed between in vivo derived, fast, and slow embryos. Right panel: relative Mapk14 expression in the four groups of cultured embryos and in vivo derived embryos. Embryo group is indicated on the X axis, each diamond represents one embryo, and black bars represent the mean relative expression in each group. Error bars represent standard errors of the mean.
Slc2a1 and Mapk14 expression were also evaluated in these same embryos. At the first separation, in vivo derived embryos displayed significantly higher Slc2a1 expression levels than the fast and slow groups, both before and after correction for cell numbers (Table 2). The slow group displayed significantly higher levels of Slc2a1 expression than the fast group (Fig. 7B) following normalization for cell numbers. At the second separation, the Slc2a1 expression analysis revealed three significantly distinct groups: the FF group with the lowest expression, the FS, SF, and SS groups with midlevel expression that was indistinguishable from one another, and in vivo derived embryos with the highest Slc2a1 expression. For Mapk14, while expression levels were higher in the FF group compared with in the other culture groups and in vivo controls, this difference was not statistically significant (Fig. 7C). As well, no difference between groups after cell number correction was observed.
DISCUSSION
In this study, we set out to determine whether embryos with different developmental rates differed in their ability to maintain genomic imprinting. Contrary to our expectation, we observed that embryos with faster developmental rates possessed greater cell numbers and embryo volumes as well as greater perturbations in genomic imprinting and metabolic marker expression, while slower developing embryos displayed more similar cell numbers and embryo volumes to in vivo derived controls and were better able to maintain genomic imprinting. However, a proportion of the slowest developing embryos were developmentally delayed as determined by Cdkn1c imprinted expression, and 40% were developmentally compromised, arresting prior to the blastocyst stage. Instead, embryos with slow to moderate development rates (SF embryo group) were most similar to in vivo derived embryos, displaying similar cell numbers, embryo volumes, H19 and Snrpn methylation, H19 imprinted expression, Cdkn1c developmentally appropriate imprinted expression, and Atp1a1 and Slc2a1 expression. Importantly, we identified a subset of in vitro cultured embryos that, according to the parameters evaluated in this study, are very similar to in vivo derived embryos.
Our group and others have previously reported that the response of preimplantation embryos to in vitro culture with respect to genomic imprinting is stochastic [9, 16, 17, 48, 49]. Here, we show that this can partly be attributed to a differential response of embryos to culture. Fast developing embryos acquired the greatest perturbations in imprinted gene regulation, linking developmental rates with genomic imprinting errors.
Relationship Between Development Rates, Genomic Imprinting, and Metabolism
In this study, we evaluated maintenance of genomic imprinting at two imprinted loci, Snrpn and H19, which are involved in the development of the imprinting disorders AS and BWS, and correlated loss of imprinting at these genes with rates of preimplantation embryo development. Our data suggests that embryos that develop faster do so at the expense of maintaining epigenetic regulation. It is currently unclear how embryo culture can lead to alterations in imprinting. One possibility is that culture conditions interfere with epigenetic maintenance mechanisms, and this in turn deregulates the embryo's growth kinetics. We observed that faster developing embryos were more advanced morphologically but had a shorter cell division cycle given the greater number of cells. On the other hand, slow embryos maintained rates of cell division similar to in vivo derived embryos, given similar cell numbers. Alternatively, developmental rates and epigenetic gene regulation may be intimately linked. We postulated that both may be perturbed by changes in the metabolism of the early embryo.
To further investigate this, we examined Slc2a1 expression. SLC2A1 is one of the primary glucose transporters in the preimplantation embryo. Prior to compaction, SLC2A1 is primarily localized to the nucleoli and nuclear membranes. Postcompaction, Slc2a1 mRNA and protein levels increase dramatically [50, 51]. SLC2A1 translocates to the basolateral membrane of trophectoderm (TE) cells and the plasma membrane of inner cell mass (ICM) cells [52], permitting shuttling of glucose from the blastocoel cavity to ICM cells. This differential localization of SLC2A1 coincides with the switch of energy preferences in the developing embryo from precompaction utilization of pyruvate to postcompaction utilization of glucose. Previous analyses have shown that in comparison to in vivo derived embryos, Slc2a1 mRNA expression and protein levels are significantly lower in in vitro cultured embryos [50, 51, 53, 54]. In our study, we also found lower levels of Slc2a1 expression in culture embryos compared to in vivo derived controls. Interestingly, fast embryos, for the most part, failed to upregulate Slc2a1 expression, displaying significantly lower Slc2a1 expression levels than their slow counterparts when corrected for cell numbers. In the fast embryos, an inadequate increase in Slc2a1 expression may result in decreased availability of glucose. These embryos would then be required to switch their metabolism to utilize alternate means of ATP generation such as amino acid catabolism (for gluconeogenesis) and beta oxidation of fatty acids [55]. Inadequate ATP generation could lead to compromised cellular functions, including epigenetic regulation of genomic imprinting [56]. Perhaps this is not surprising as all known chromatin-remodeling complexes are powered by an ATPase subunit [56].
Changes in Slc2a1 expression in the faster developing embryos suggest that the metabolism of these embryos is altered compared to in vivo derived controls. We observed that FF embryos had significantly larger embryo volumes than in vivo controls and the other three culture groups. During preimplantation development, the total volume of the embryo remains relatively constant, while the number of cells increases as development proceeds [57]. This change in embryo volume raises the question as to what metabolic mechanisms could lead to a difference in embryo volume for the FF group. Two possible explanations are an increase in cell volume or an increase in blastocoel cavity volume. An increase in cell volume may occur in response to cell stress and its effect on intracellular osmotic pressure [58]. One mediator of environmental stress is MAPK14, which regulates embryonic adaptations to culture, including culture medium osmolarity [32, 33, 59, 60]. As FF embryos may respond to environmental stress via MAPK14 with the end result of producing larger cells, we investigated Mapk14 expression in the five embryo groups. Our analysis showed no difference in Mapk14 expression between the four culture groups and in vivo controls, indicating that variations in cell volume do not likely account for the differences in blastocyst volume that we observed. MAPK14 levels and its posttranslationally modified forms need to be investigated to confirm this observation.
Alternatively, larger embryo volumes in the FF group may be a result of larger cavity volumes. Trophectoderm cells produce a blastocoel cavity through the use of the Na+/K+ ATPase, which generates an ionic gradient across the TE, facilitating movement of water from the outside environment to the inside of the embryo [61, 62]. Embryos that contain more TE cells will have greater Na+/K+ ATPase levels and greater influx of water into the blastocoel cavity, producing a larger cavity. Our results favor this latter hypothesis because we observed higher Atp1a1 expression levels in the fast group when compared to the slow group. In addition, this increase in Atp1a1 expression was a function of cell number because no difference in expression was observed when corrected for the number of cells. Since a large proportion of ATP generated in the developing blastocyst is utilized by Na+/K+ ATPase [63], increased Na+/K+ ATPase activity in FF embryos may reduce the ATP pool available for other cellular activities in these embryos, thereby compromising epigenetic gene regulation.
Taken together, the metabolic activity of slow embryos is more similar to in vivo derived embryos, while fast embryos adapt as demonstrated by increased cell number, larger embryo volumes, increased Atp1a1 expression, and decreased Slc2a1 expression. Thus, altered epigenetic reprogramming in fast embryos with greater imprinting defects may be the result of metabolic compensation to the in vitro culture environment. Thus, our data lend support to the quiet embryo hypothesis espoused by Leese and colleagues. This hypothesis suggests that the most viable embryos are quiet, exhibiting lower levels of metabolic activity, expending less energy repairing damage caused by the suboptimal culture environment, and possessing slower cell division cycles [47, 63–66]. In contrast, embryos that actively adapt to culture will possess higher metabolic levels and faster cell cycle divisions. Our study is the first to demonstrate a link between metabolism, developmental rates/cell division cycles, and genomic imprinting. To explore this link further, future studies should be directed toward the analysis of ATP-driven metabolic factors and epigenetic regulators in fast and slow developing embryos.
The Best Embryos for Transfer
The term ARTs encompasses many techniques used to treat human infertility. However, all involve the manipulation of human gametes and preimplantation embryos, and many involve embryo culture during preimplantation development. While the optimal time and number of embryos to transfer after in vitro fertilization and culture has been a source of debate, all are in agreement that, given a choice, only the best or healthiest embryos should be transferred [67–71]. Many algorithms have attempted to determine the parameters that most accurately predict successful embryo transfer resulting in implantation and pregnancy [72, 73]. Currently, morphological characteristics and stage of embryo development at a given time point are the most commonly used criteria for identifying healthy embryos for transfer to patients in IVF clinics [74, 75]. Multiple studies have suggested that those embryos attaining the 4-cell stage (cleavage-stage transfer) or the blastocyst stage (blastocyst transfer) the fastest are most suitable for embryo transfer [67–71, 76–78]. However, other studies have suggested that embryos progressing at a moderate pace are those that should be used and have cautioned against the use of embryos with very fast or very slow development [79–81]. Previously, the relevance of these criteria to the maintenance of genomic imprinting was unknown. The results from this study also argue against transfer of the fast-developing embryos because the fast group was most different from in vivo controls in all the tested parameters, except possibly embryo sex (Table 2). We propose that embryos that undergo reprogramming to counter the stresses of suboptimal culture are the least healthy for embryo transfer. Given that embryos in the fast group differed significantly from slow embryos in their ability to maintain genomic imprinting, the response to culture stress must occur prior to the first separation at the 8-cell stage. Recently, time-lapse analysis of human preimplantation embryos revealed that optimal development to the blastocyst stage is determined within the first three mitoses as an embryo proceeds from the 1-cell to 4-cell stage, indicating that success in part is due to maternally stored transcripts [82]. This suggests that the length of time taken for a 2-cell embryo to become a 4-cell embryo may have significant bearing on subsequent developmental rates and imprint maintenance. Embryos transiting rapidly through the 3-cell stage may have inadequate time for maternal derived factors to ensure faithful inheritance of epigenetic information, while those embryos that stall during early cleavage division may be developmentally delayed and compromised. Overall, our results support the transfer of embryos displaying slow rates of development as one step toward choosing a healthier embryo. Having said this, we argue against the slowest (SS) developing embryos (i.e., containing less than stage-appropriate cell numbers) for cleavage-stage transfers because 40% of embryos in this group failed to develop to the blastocyst stage after 3 days in culture. For blastocyst transfers, embryos in the SF group are most suitable for embryo transfer, being most similar to in vivo derived controls. Developing noninvasive methods to more easily identify SF-developing embryos in the human clinic will be critical to choosing the best or healthiest embryos for transfer.
ACKNOWLEDGMENT
We thank Andrew Fernandes for invaluable help with the statistical analysis, Charles Long for aid in the development of the embryo-staining protocol, and Andrew Watson and Gerald Kidder for helpful discussions and critical review of the manuscript.
Footnotes
Supported by the Department of Obstetrics and Gynaecology at the University of Western Ontario and the Children's Health Research Institute; and a grant ER06-02-188 from the Ministry of Research and Innovation, Early Researcher Award to M.R.W.M. M.R.W.M. was supported by the Ontario Women's Health Council/ CIHR Institute of Gender and Health New Investigator Award, B.A.M.V. was supported by a NSERC Canada Graduate Scholarship, and M.M.D. was supported by a CIHR Training Program in Reproduction, Early Development and the Impact on Health (REDIH) Graduate Scholarship and an Obstetrics and Gynaecology Graduate Research Scholarship.
REFERENCES
- Bowman P, McLaren A. Viability and growth of mouse embryos after in vitro culture and fusion. J Embryol Exp Morphol 1970; 23: 693 704. [PubMed] [Google Scholar]
- Harlow GM, Quinn P. Development of preimplantation mouse embryos in vivo and in vitro. Aust J Biol Sci 1982; 35: 187 193. [DOI] [PubMed] [Google Scholar]
- Biggers JD, Summers MC. Choosing a culture medium: making informed choices. Fertil Steril 2008; 90: 473 483. [DOI] [PubMed] [Google Scholar]
- Gardner DK. Dissection of culture media for embryos: the most important and less important components and characteristics. Reprod Fertil Dev 2008; 20: 9 18. [DOI] [PubMed] [Google Scholar]
- Sasaki H, Ferguson-Smith AC, Shum AS, Barton SC, Surani MA. Temporal and spatial regulation of H19 imprinting in normal and uniparental mouse embryos. Development 1995; 121: 4195 4202. [DOI] [PubMed] [Google Scholar]
- Sinclair KD, McEvoy TG, Maxfield EK, Maltin CA, Young LE, Wilmut I, Broadbent PJ, Robinson JJ. Aberrant fetal growth and development after in vitro culture of sheep zygotes. J Reprod Fertil 1999; 116: 177 186. [DOI] [PubMed] [Google Scholar]
- Barker DJ. In utero programming of cardiovascular disease. Theriogenology 2000; 53: 555 574. [DOI] [PubMed] [Google Scholar]
- Boerjan ML, den Daas JH, Dieleman SJ. Embryonic origins of health: long-term effects of IVF in human and livestock. Theriogenology 2000; 53: 537 547. [DOI] [PubMed] [Google Scholar]
- Doherty AS, Mann MR, Tremblay KD, Bartolomei MS, Schultz RM. Differential effects of culture on imprinted H19 expression in the preimplantation mouse embryo. Biol Reprod 2000; 62: 1526 1535. [DOI] [PubMed] [Google Scholar]
- Khosla S, Dean W, Brown D, Reik W, Feil R. Culture of preimplantation mouse embryos affects fetal development and the expression of imprinted genes. Biol Reprod 2001; 64: 918 926. [DOI] [PubMed] [Google Scholar]
- Summers MC, Biggers JD. Chemically defined media and the culture of mammalian preimplantation embryos: historical perspective and current issues. Hum Reprod Update 2003; 9: 557 582. [DOI] [PubMed] [Google Scholar]
- Ecker DJ, Stein P, Xu Z, Williams CJ, Kopf GS, Bilker WB, Abel T, Schultz RM. Long-term effects of culture of preimplantation mouse embryos on behavior. Proc Natl Acad Sci U S A 2004; 101: 1595 1600. [DOI] [PMC free article] [PubMed] [Google Scholar]
- Fernandez-Gonzalez R, Moreira P, Bilbao A, Jimenez A, Perez-Crespo M, Ramirez MA, Rodriguez De Fonseca F, Pintado B, Gutierrez-Adan A. Long-term effect of in vitro culture of mouse embryos with serum on mRNA expression of imprinting genes, development, and behavior. Proc Natl Acad Sci U S A 2004; 101: 5880 5885. [DOI] [PMC free article] [PubMed] [Google Scholar]
- Rinaudo P, Schultz RM. Effects of embryo culture on global pattern of gene expression in preimplantation mouse embryos. Reproduction 2004; 128: 301 311. [DOI] [PubMed] [Google Scholar]
- Niemann H, Wrenzycki C. Alterations of expression of developmentally important genes in preimplantation bovine embryos by in vitro culture conditions: implications for subsequent development. Theriogenology 2000; 53: 21 34. [DOI] [PubMed] [Google Scholar]
- Mann MR, Lee SS, Doherty AS, Verona RI, Nolen LD, Schultz RM, Bartolomei MS. Selective loss of imprinting in the placenta following preimplantation development in culture. Development 2004; 131: 3727 3735. [DOI] [PubMed] [Google Scholar]
- Market-Velker BA, Fernandes AD, Mann MR. Side-by-side comparison of five commercial media systems in a mouse model: suboptimal in vitro culture interferes with imprint maintenance. Biol Reprod 2010; 83: 938 950. [DOI] [PubMed] [Google Scholar]
- Verona RI, Mann MRW, Bartolomei MS. Genomic imprinting: intricacies of epigenetic regulation in clusters. Annu Rev Cell Dev Biol 2003; 19: 237 259. [DOI] [PubMed] [Google Scholar]
- Rodenhiser D, Mann M. Epigenetics and human disease: translating basic biology into clinical applications. CMAJ 2006; 174: 341 348. [DOI] [PMC free article] [PubMed] [Google Scholar]
- Cox GF, Burger J, Lip V, Mau UA, Sperling K, Wu BL, Horsthemke B. Intracytoplasmic sperm injection may increase the risk of imprinting defects. Am J Hum Genet 2002; 71: 162 164. [DOI] [PMC free article] [PubMed] [Google Scholar]
- DeBaun MR, Niemitz EL, Feinberg AP. Association of in vitro fertilization with Beckwith-Wiedemann syndrome and epigenetic alterations of LIT1 and H19. Am J Hum Genet 2003; 72: 156 160. [DOI] [PMC free article] [PubMed] [Google Scholar]
- Maher ER, Brueton LA, Bowdin SC, Luharia A, Cooper W, Cole TR, Macdonald F, Sampson JR, Barratt CL, Reik W, Hawkins MM. Beckwith-Wiedemann syndrome and assisted reproduction technology (ART). J Med Genet 2003; 40: 62 64. [DOI] [PMC free article] [PubMed] [Google Scholar]
- Gicquel C, Gaston V, Mandelbaum J, Siffroi JP, Flahault A, Le Bouc Y. In vitro fertilization may increase the risk of Beckwith-Wiedemann syndrome related to the abnormal imprinting of the KCN1OT gene. Am J Hum Genet 2003; 72: 1338 1341. [DOI] [PMC free article] [PubMed] [Google Scholar]
- Orstavik KH, Eiklid K, van der Hagen CB, Spetalen S, Kierulf K, Skjeldal O, Buiting K. Another case of imprinting defect in a girl with Angelman syndrome who was conceived by intracytoplasmic semen injection. Am J Hum Genet 2003; 72: 218 219. [DOI] [PMC free article] [PubMed] [Google Scholar]
- Halliday J, Oke K, Breheny S, Algar E, Amor DJ. Beckwith-Wiedemann syndrome and IVF: a case-control study. Am J Hum Genet 2004; 75: 526 528. [DOI] [PMC free article] [PubMed] [Google Scholar]
- Chang AS, Moley KH, Wangler M, Feinberg AP, Debaun MR. Association between Beckwith-Wiedemann syndrome and assisted reproductive technology: a case series of 19 patients. Fertil Steril 2005; 83: 349 354. [DOI] [PMC free article] [PubMed] [Google Scholar]
- Ludwig M, Katalinic A, Gross S, Sutcliffe A, Varon R, Horsthemke B. Increased prevalence of imprinting defects in patients with Angelman syndrome born to subfertile couples. J Med Genet 2005; 42: 289 291. [DOI] [PMC free article] [PubMed] [Google Scholar]
- Sutcliffe AG, Peters CJ, Bowdin S, Temple K, Reardon W, Wilson L, Clayton-Smith J, Brueton LA, Bannister W, Maher ER. Assisted reproductive therapies and imprinting disorders—a preliminary British survey. Hum Reprod 2006; 21: 1009 1011. [DOI] [PubMed] [Google Scholar]
- Kidder GM, Watson AJ. Roles of Na, K-ATPase in early development and trophectoderm differentiation. Semin Nephrol 2005; 25: 352 355. [DOI] [PubMed] [Google Scholar]
- Pantaleon M, Kaye PL. Glucose transporters in preimplantation development. Rev Reprod 1998; 3: 77 81. [DOI] [PubMed] [Google Scholar]
- Augustin R, Pocar P, Navarrete-Santos A, Wrenzycki C, Gandolfi F, Niemann H, Fischer B. Glucose transporter expression is developmentally regulated in in vitro derived bovine preimplantation embryos. Mol Reprod Dev 2001; 60: 370 376. [DOI] [PubMed] [Google Scholar]
- Natale DR, Paliga AJ, Beier F, D'Souza SJ, Watson AJ. p38 MAPK signaling during murine preimplantation development. Dev Biol 2004; 268: 76 88. [DOI] [PubMed] [Google Scholar]
- Paliga AJ, Natale DR, Watson AJ. p38 mitogen-activated protein kinase (MAPK) first regulates filamentous actin at the 8-16-cell stage during preimplantation development. Biol Cell 2005; 97: 629 640. [DOI] [PubMed] [Google Scholar]
- Fong B, Watson PH, Watson AJ. Mouse preimplantation embryo responses to culture medium osmolarity include increased expression of CCM2 and p38 MAPK activation. BMC Dev Biol 2007; 7: 2. [DOI] [PMC free article] [PubMed] [Google Scholar]
- Johnstone ED, Sibley CP, Lowen B, Guilbert LJ. Epidermal growth factor stimulation of trophoblast differentiation requires MAPK11/14 (p38 MAP kinase) activation. Biol Reprod 2005; 73: 1282 1288. [DOI] [PubMed] [Google Scholar]
- Winger QA, Guttormsen J, Gavin H, Bhushan F. Heat shock protein 1 and the mitogen-activated protein kinase 14 pathway are important for mouse trophoblast stem cell differentiation. Biol Reprod 2007; 76: 884 891. [DOI] [PubMed] [Google Scholar]
- Market-Velker BA, Zhang L, Magri LS, Bonvissuto AC, Mann MR. Dual effects of superovulation: loss of maternal and paternal imprinted methylation in a dose-dependent manner. Hum Mol Genet 2010; 19: 36 51. [DOI] [PubMed] [Google Scholar]
- Smith R, McLaren A. Factors affecting the time of formation of the mouse blastocoele. J Embryol Exp Morphol 1977; 41: 79 92. [PubMed] [Google Scholar]
- Whitten WK. Nutrient requirements for the culture of preimplantation mouse embryo in vitro. Adv Biosci 1971; 6: 129 139. [Google Scholar]
- R Development Core Team. R: A Language and Environment for Statistical Computing. R Foundation for Statistical Computing, Vienna, Austria; 2011. [Google Scholar]
- Ray J, Raymon HK, Gage FH. Generation and culturing of precursor cells and neuroblasts from embryonic and adult central nervous system. Methods Enzymol 1995; 254: 20 37. [DOI] [PubMed] [Google Scholar]
- Dumoulin JC, Derhaag JG, Bras M, Van Montfoort AP, Kester AD, Evers JL, Geraedts JP, Coonen E. Growth rate of human preimplantation embryos is sex dependent after ICSI but not after IVF. Hum Reprod 2005; 20: 484 491. [DOI] [PubMed] [Google Scholar]
- Dean JH, Chapman MG, Sullivan EA. The effect on human sex ratio at birth by assisted reproductive technology (ART) procedures—an assessment of babies born following single embryo transfers, Australia and New Zealand, 2002–2006. BJOG 2010; 117: 1628 1634. [DOI] [PubMed] [Google Scholar]
- Valdivia RP, Kunieda T, Azuma S, Toyoda Y. PCR sexing and developmental rate differences in preimplantation mouse embryos fertilized and cultured in vitro. Mol Reprod Dev 1993; 35: 121 126. [DOI] [PubMed] [Google Scholar]
- Peippo J, Bredbacka P. Sex-related growth rate differences in mouse preimplantation embryos in vivo and in vitro. Mol Reprod Dev 1995; 40: 56 61. [DOI] [PubMed] [Google Scholar]
- Byrne MJ, Newmark JA, Warner CM. Analysis of the sex ratio in preimplantation embryos from B6.K1 and B6.K2 Ped gene congenic mice. J Assist Reprod Genet 2006; 23: 321 328. [DOI] [PMC free article] [PubMed] [Google Scholar]
- Leese HJ. Quiet please, do not disturb: a hypothesis of embryo metabolism and viability. Bioessays 2002; 24: 845 849. [DOI] [PubMed] [Google Scholar]
- Lim D, Bowdin SC, Tee L, Kirby GA, Blair E, Fryer A, Lam W, Oley C, Cole T, Brueton LA, Reik W, Macdonald F, Maher ER. Clinical and molecular genetic features of Beckwith-Wiedemann syndrome associated with assisted reproductive technologies. Hum Reprod 2009; 24: 741 747. [DOI] [PubMed] [Google Scholar]
- Rossignol S, Steunou V, Chalas C, Kerjean A, Rigolet M, Viegas-Pequignot E, Jouannet P, Le Bouc Y, Gicquel C. The epigenetic imprinting defect of patients with Beckwith-Wiedemann syndrome born after assisted reproductive technology is not restricted to the 11p15 region. J Med Genet 2006; 43: 902 907. [DOI] [PMC free article] [PubMed] [Google Scholar]
- Morita Y, Tsutsumi O, Oka Y, Taketani Y. Glucose transporter GLUT1 mRNA expression in the ontogeny of glucose incorporation in mouse preimplantation embryos. Biochem Biophys Res Commun 1994; 199: 1525 1531. [DOI] [PubMed] [Google Scholar]
- Uechi H, Tsutsumi O, Morita Y, Taketani Y. Cryopreservation of mouse embryos affects later embryonic development possibly through reduced expression of the glucose transporter GLUT1. Mol Reprod Dev 1997; 48: 496 500. [DOI] [PubMed] [Google Scholar]
- Pantaleon M, Ryan JP, Gil M, Kaye PL. An unusual subcellular localization of GLUT1 and link with metabolism in oocytes and preimplantation mouse embryos. Biol Reprod 2001; 64: 1247 1254. [DOI] [PubMed] [Google Scholar]
- Leppens-Luisier G, Urner F, Sakkas D. Facilitated glucose transporters play a crucial role throughout mouse preimplantation embryo development. Hum Reprod 2001; 16: 1229 1236. [DOI] [PubMed] [Google Scholar]
- Balasubramanian S, Son WJ, Kumar BM, Ock SA, Yoo JG, Im GS, Choe SY, Rho GJ. Expression pattern of oxygen and stress-responsive gene transcripts at various developmental stages of in vitro and in vivo preimplantation bovine embryos. Theriogenology 2007; 68: 265 275. [DOI] [PubMed] [Google Scholar]
- Sturmey RG, Reis A, Leese HJ, McEvoy TG. Role of fatty acids in energy provision during oocyte maturation and early embryo development. Reprod Domest Anim 2009; 44: 50 58. [DOI] [PubMed] [Google Scholar]
- Hargreaves DC, Crabtree GR. ATP-dependent chromatin remodeling: genetics, genomics and mechanisms. Cell Res 2011; 21: 396 420. [DOI] [PMC free article] [PubMed] [Google Scholar]
- Aiken CE, Swoboda PP, Skepper JN, Johnson MH. The direct measurement of embryogenic volume and nucleo-cytoplasmic ratio during mouse pre-implantation development. Reproduction 2004; 128: 527 535. [DOI] [PubMed] [Google Scholar]
- Baltz JM, Tartia AP. Cell volume regulation in oocytes and early embryos: connecting physiology to successful culture media. Hum Reprod Update 2010; 16: 166 167. [DOI] [PubMed] [Google Scholar]
- Bradham C, McClay DR. p38 MAPK in development and cancer. Cell Cycle 2006; 5: 824 828. [DOI] [PubMed] [Google Scholar]
- Bell CE, Lariviere NM, Watson PH, Watson AJ. Mitogen-activated protein kinase (MAPK) pathways mediate embryonic responses to culture medium osmolarity by regulating Aquaporin 3 and 9 expression and localization, as well as embryonic apoptosis. Hum Reprod 2009; 24: 1373 1386. [DOI] [PubMed] [Google Scholar]
- Watson AJ, Barcroft LC. Regulation of blastocyst formation. Front Biosci 2001; 6: D708 D730. [DOI] [PubMed] [Google Scholar]
- Barcroft LC, Offenberg H, Thomsen P, Watson AJ. Aquaporin proteins in murine trophectoderm mediate transepithelial water movements during cavitation. Dev Biol 2003; 256: 342 354. [DOI] [PubMed] [Google Scholar]
- Leese HJ, Sturmey RG, Baumann CG, McEvoy TG. Embryo viability and metabolism: obeying the quiet rules. Hum Reprod 2007; 22: 3047 3050. [DOI] [PubMed] [Google Scholar]
- Leese HJ. Metabolism of the preimplantation mammalian embryo. Oxf Rev Reprod Biol 1991; 13: 35 72. [PubMed] [Google Scholar]
- Baumann CG, Morris DG, Sreenan JM, Leese HJ. The quiet embryo hypothesis: molecular characteristics favoring viability. Mol Reprod Dev 2007; 74: 1345 1353. [DOI] [PubMed] [Google Scholar]
- Sturmey RG, Hawkhead JA, Barker EA, Leese HJ. DNA damage and metabolic activity in the preimplantation embryo. Hum Reprod 2009; 24: 81 91. [DOI] [PubMed] [Google Scholar]
- Kallen B, Finnstrom O, Lindam A, Nilsson E, Nygren KG, Olausson PO. Blastocyst versus cleavage stage transfer in in vitro fertilization: differences in neonatal outcome? Fertil Steril 2010; 94: 1680 1683. [DOI] [PubMed] [Google Scholar]
- Min JK, Hughes E, Young D, Gysler M, Hemmings R, Cheung AP, Goodrow GJ, Senikas V, Wong BC, Sierra S, Carranza-Mamane B, Chase A, et al. Elective single embryo transfer following in vitro fertilization. J Obstet Gynaecol Can 2010; 32: 363 377. [DOI] [PubMed] [Google Scholar]
- Porat N, Boehnlein LM, Barker MA, Kovacs P, Lindheim SR. Blastocyst embryo transfer is the primary determinant for improved outcomes in oocyte donation cycles. J Obstet Gynaecol Res 2010; 36: 357 363. [DOI] [PubMed] [Google Scholar]
- Sills ES, Palermo GD. Human blastocyst culture in IVF: current laboratory applications in reproductive medicine practice. Rom J Morphol Embryol 2010; 51: 441 445. [PubMed] [Google Scholar]
- Wang YA, Kovacs G, Sullivan EA. Transfer of a selected single blastocyst optimizes the chance of a healthy term baby: a retrospective population based study in Australia 2004–2007. Hum Reprod 2010; 25: 1996 2005. [DOI] [PubMed] [Google Scholar]
- Elizur SE, Lerner-Geva L, Levron J, Shulman A, Bider D, Dor J. Factors predicting IVF treatment outcome: a multivariate analysis of 5310 cycles. Reprod Biomed Online 2005; 10: 645 649. [DOI] [PubMed] [Google Scholar]
- Lesourd F, Parant O, Clouet-Delannoy M, Parinaud J. Clinical and biological parameters influencing implantation: score to determine number of embryos to transfer. Reprod Biomed Online 2006; 12: 453 459. [DOI] [PubMed] [Google Scholar]
- Shoukir Y, Campana A, Farley T, Sakkas D. Early cleavage of in-vitro fertilized human embryos to the 2-cell stage: a novel indicator of embryo quality and viability. Hum Reprod 1997; 12: 1531 1536. [DOI] [PubMed] [Google Scholar]
- Van Montfoort AP, Dumoulin JC, Kester AD, Evers JL. Early cleavage is a valuable addition to existing embryo selection parameters: a study using single embryo transfers. Hum Reprod 2004; 19: 2103 2108. [DOI] [PubMed] [Google Scholar]
- Claman P, Armant DR, Seibel MM, Wang TA, Oskowitz SP, Taymor ML. The impact of embryo quality and quantity on implantation and the establishment of viable pregnancies. J In Vitro Fert Embryo Transf 1987; 4: 218 222. [DOI] [PubMed] [Google Scholar]
- Windt ML, Kruger TF, Coetzee K, Lombard CJ. Comparative analysis of pregnancy rates after the transfer of early dividing embryos versus slower dividing embryos. Hum Reprod 2004; 19: 1155 1162. [DOI] [PubMed] [Google Scholar]
- Biezinova J, Svobodova M, Oborna I, Fingerova H, Dosta J, Krskova M. Embryo quality evaluation according to the speed of the first cleavage after conventional IVF [in Czech]. Ceska Gynekol 2006; 71: 105 110. [PubMed] [Google Scholar]
- Cummins JM, Breen TM, Harrison KL, Shaw JM, Wilson LM, Hennessey JF. A formula for scoring human embryo growth rates in in vitro fertilization: its value in predicting pregnancy and in comparison with visual estimates of embryo quality. J In Vitro Fert Embryo Transf 1986; 3: 284 295. [DOI] [PubMed] [Google Scholar]
- Alikani M, Calderon G, Tomkin G, Garrisi J, Kokot M, Cohen J. Cleavage anomalies in early human embryos and survival after prolonged culture in-vitro. Hum Reprod 2000; 15: 2634 2643. [DOI] [PubMed] [Google Scholar]
- Weitzman VN, Schnee-Riesz J, Benadiva C, Nulsen J, Siano L, Maier D. Predictive value of embryo grading for embryos with known outcomes. Fertil Steril 2010; 93: 658 662. [DOI] [PubMed] [Google Scholar]
- Wong CC, Loewke KE, Bossert NL, Behr B, De Jonge CJ, Baer TM. Reijo Pera RA. Non-invasive imaging of human embryos before embryonic genome activation predicts development to the blastocyst stage. Nat Biotechnol 2010; 28: 1115 1121. [DOI] [PubMed] [Google Scholar]