

Abstract
Species differ greatly in their rates of aging. Among mammalian species life span ranges from 2 to over 60 years. Here, we test the hypothesis that skin-derived fibroblasts from long-lived species of animals differ from those of short-lived animals in their defenses against protein damage. In parallel studies of rodents, nonhuman primates, birds, and species from the Laurasiatheria superorder (bats, carnivores, shrews, and ungulates), we find associations between species longevity and resistance of proteins to oxidative stress after exposure to H2O2 or paraquat. In addition, baseline levels of protein carbonyl appear to be higher in cells from shorter-lived mammals compared with longer-lived mammals. Thus, resistance to protein oxidation is associated with species maximal life span in independent clades of mammals, suggesting that this cellular property may be required for evolution of longevity. Evaluation of the properties of primary fibroblast cell lines can provide insights into the factors that regulate the pace of aging across species of mammals.
Keywords: Key Words: , Comparative biology, Aging, Oxidative stress.
There is substantial evidence that cellular resistance to oxidative stress may help to regulate aging rate and life span. Many of the mutations, diets, and drugs that can extend life span in mice, flies, and worms increase oxidative stress resistance (1–3). In addition, some experiments in which protein oxidation was reduced by genetic manipulations, such as engineered increases in catalase or proteasome function, have led to increases in life span in worms, flies, mice, and yeast (4–7). In contrast, most experiments in which oxidant defenses have been modulated in mice have shown little or no effect on life span, as reviewed in (8–12). Mutations that increase life span in Caenorhabditis elegans and Drosophila melanogaster often increase defenses against both oxidative and nonoxidative stresses (13–16). Additionally, reduced levels of oxidative protein damage have been observed in rodents that have been subjected to caloric restriction (17) These findings have led some to posit that the ‘free radical theory of aging’ should be replaced by a more comprehensive view that aging rates and life span are regulated by the capacity of a body to keep oxidative and other forms of damage in check (12,18).
The implications for antioxidant defenses as factors in the evolution of long-lived species are also uncertain. Characterizations of exceptionally long-lived species such as the naked mole rat or extremely long lived clams can be of great interest (19–21), and have contributed much to our understanding of the aging process, but the processes that lead to longevity in such atypical species may or may not resemble those which are typical of evolutionary transitions in mammals more generally. In addition, many of the previous studies that involved comparisons between short-lived and long-lived species were quite limited in scope, typically involving only two or three species, in which idiosyncratic species differences may obscure the broad generalizations that are the aim of the study (22,23). In particular, comparisons involving only two or three species can be confounded by physiological differences that are independent of aging rate and life span. For these reasons, some groups have now begun to evaluate cellular traits across much larger sets of related species, exhibiting broad differences in life span, to seek general principles that apply in multiple clades in which longevity differences have evolved independently (24–30).
Comparative analysis of cell lines from species that differ in aging rate could potentially be used to test ideas about factors that modulate the rate of aging, but only if the properties of cultured cells reflect in some way those of the intact animals from which they are derived. There is now a growing list of studies showing associations between the characteristics of primary skin-derived fibroblasts, or their transformed derivatives, and the life span of donor species. Fibroblasts are used in such studies not on the (unlikely) assumption that changes in fibroblast properties would significantly affect organismal life span, but because of the idea that evolutionary changes that produce slow aging might affect multiple cell types, including those which do contribute to long-lasting resistance to diseases and disabilities, and also those (like fibroblasts) which are easy to cultivate and expand under standardized conditions. Such an approach has been used in studies of telomere length (25), cellular resistance to lethal injuries (26–29), kinetics of activation of stress-sensitive kinases (31), and permeability to extracellular cadmium (32). In other cases, inter species differences in cellular properties, such as telomerase activity, were found to be more strongly associated with species body mass than with longevity per se (24,30).
In this article we used primary skin-derived fibroblast cell lines derived from more than 50 species of mammals, representing multiple orders, to see if cells from longer-lived species show more resistance to oxidative modification and unfolding of intracellular protein.
Methods
Cell Culture
Cells were cultured in complete media made of Dulbecco’s modified Eagle medium (high-glucose variant, Gibco-Invitrogen, Carlsbad, CA) supplemented with 10% heat-inactivated fetal bovine serum and antibiotics (100 U/mL penicillin, 100 µg/mL streptomycin, and 0.25 µg/mL of amphotericin B; Gibco-Invitrogen). Cells were incubated at 3% O2, hypoxic with respect to atmospheric O2 concentration, to mimic their normal physiological environment; the incubators were also maintained at 5% CO2, and 37°C. Media was replaced every 3–4 days.
Protein Carbonyl Assay
Cells were lysed through resuspension in 20 μL of Ripa buffer (Cat# 89900, Thermo Scientific, Rockford, IL) supplemented with a protease inhibitor cocktail (Cat# 78410, Thermo Scientific). Cells were subjected to 3× 5-minute incubations on ice interspersed by 5-second vigorous vortex cycles. Twenty microlitres of 12% sodium dodecyl sulfate (SDS) was added to samples, and samples were vortexed, and then centrifuged at 20,000g for 5 minutes at 24°C. The supernatant was then used for protein carbonyl assays. Protein carbonyl assays were performed using reagents provided by Millipore (Oxyblot kit, Cat# S7150, Millipore, Temecula, CA). Briefly 10 μL of cell lysate was mixed with 10 μL of Ripa buffer supplemented with 6% SDS. Twenty microlitres of 2,4-dinitrophenol was added to samples. Samples were then vortexed and incubated for 15 minutes at room temperature, after which 15 μL of neutralization buffer was added to stop the derivatization reaction.
Samples were separated by electrophoresis on a 10% SDS–polyacrylamide gel at 80 V for 1.5–2 hours. A Western blot transfer was performed and membranes were screened with an antibody reared against 2,4-dinitrophenol (Cat# 90451, Millipore). Protein loading was quantified using an India Ink stain of total protein (33) instead of quantification based on a housekeeping gene (eg, actin or β-tubulin) due to variable antibody specificity among species.
Detergent-Insoluble Protein Assay
Cell pellets were resuspended in 50 µL of ice cold phosphate-buffered saline (PBS) supplemented with 1% Triton X-100. Cells were subjected to 3× 5-minute incubations on ice interspersed by 5-second vigorous vortex cycles. Samples were centrifuged at 20,000g for 10 minutes at 4°C. The supernatant was removed and labeled as the “soluble fraction.” The pellet was resuspended in 500 μL of ice cold PBS supplemented with 1% Triton X-100. Samples were centrifuged at 20,000g for 10 minutes at 4°C. The pellet was removed and labeled as the insoluble fraction. The soluble fraction was denatured through addition of 1× lithium dodecyl sulfate (LDS) buffer and incubation at 95°C for 5 minutes. The insoluble fraction was denatured through addition of 4× LDS buffer and incubation at 95°C for 5 minutes. Samples were then separated by electrophoresis using a 10% SDS–polyacrylamide gel at 80V for 1.5–2 hours. Gels were then analyzed by a Coomassie stain.
Disulphide Bond Formation Assay
Cell pellets were resuspended in 450 μL of PBS supplemented with 0.5mM MgCl2, 1mM ethylenediaminetetraacetic acid, 150mM iodoacetamide (used to bind to modify any exposed unbound sulphide groups), and protease inhibitor (Cat# 78410, Thermo Scientific). Cells were then fractionated through 3× 5-minute incubations on dry ice interspersed by 5-minute incubation in a room temperature water bath and 5-second vigorous vortex cycles. Protein was then precipitated by addition of 50 μL of trichloroacetic acid. Samples were centrifuged at 20,000g for 30 minutes at 4°C. The pellet was resuspended in 1 mL of 100% ethanol, and then centrifuged at 20,000g for 30 minutes at 4°C. The pellet was then resuspended in 8 M Urea supplemented with 1mM dithiothreitol (DTT) used to break existing disulphide bonds. Samples were incubated at 37°C for 10 minutes. Fluorescein-6-iodoacetamide was added to a final concentration of 1mM, to bind to newly exposed sulfide groups. Samples were incubated at 37°C for 1 hour. Samples were then separated by electrophoresis using a 10% SDS–polyacrylamide gel at 80V for 1.5–2 hours. Fluorescence was measured under 494nm excitation and 521nm emission. Total protein was subsequently determined using a Coomassie stain.
Additional methods on generation and culturing of cell lines as well as statistical analysis are presented in the Supplementary Methods section.
Results
Oxidation of lysine, arginine, proline, or threonine residues leads to formation of protein carbonyl groups, which increase with age in several tissues and species, including house flies, rat hepatocytes, human lens cells, as well as the brains of gerbils and humans. (34,35). We speculated that fibroblasts from short-lived species might show a greater degree of protein carbonyl accumulation, when exposed to H2O2 as an oxidant stress, compared with cells from longer-lived animals. Figure 1A shows results of one such experiment, comparing cells from six species of mammals, varying in maximum life span (MLS) from 3.9 to 23.4 years, for carbonyl content before and after 1 hour exposure to 100 µM of H2O2. Large increases in protein carbonyl levels were observed in cells from short lived species such as the golden hamster, house mouse, and Nile kusu, but fibroblasts from longer-lived species such as the North American porcupine, common raccoon, or American beaver were relatively resistant.
Figure 1.
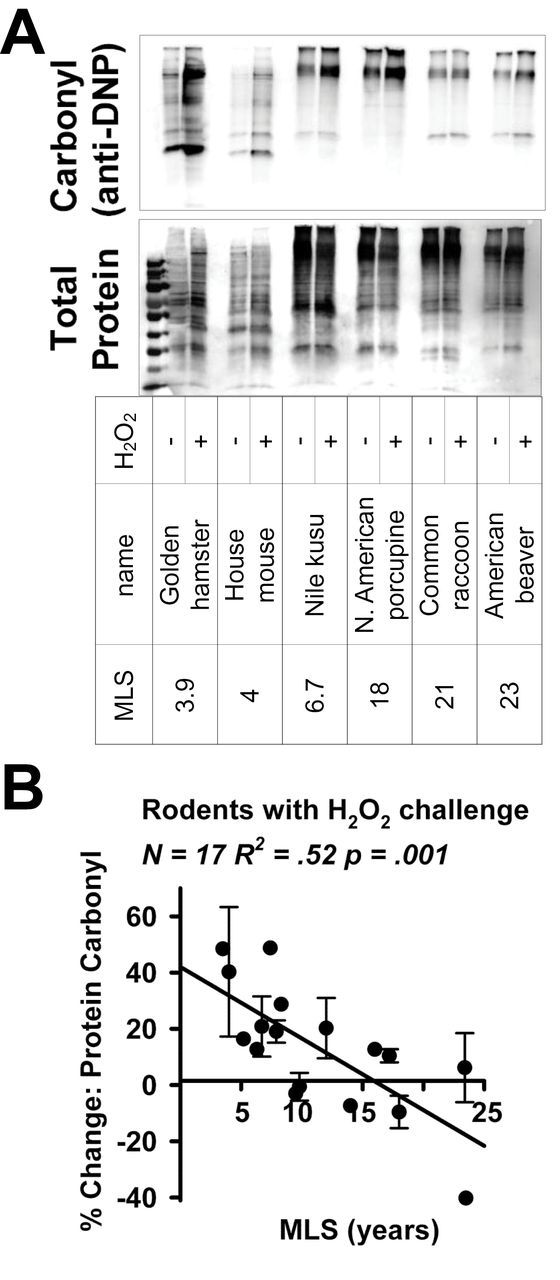
(A) Representative immunoblot showing protein carbonyl content before and after exposure to 100 μM H2O2 in six mammalian species with a maximum life span (MLS) range of 3.9–23.4 years. Protein carbonyls are labeled with 2,4-dinitrophenol, and protein carbonyl content is measured using an antibody against 2,4-dinitrophenol (anti-DNP). Total protein is measured using an India Ink stain. (B) Scatterplot of % change in protein carbonyl content following exposure to 100 μM H2O2 in 17 species of rodents.
Figure 1B shows quantification of the change in protein carbonyl content for all 17 rodent species tested. These species are listed, including information on Latin name, life span, body mass, and number of independent cell lines used per species, in Supplementary Table 1. The data shows a clear trend: cells from shorter-lived species typically show 40%–50% increases in protein carbonyl groups following H2O2 treatment, but there is little or no increase in protein carbonyl groups in cells from longer-lived species. The correlation between change in protein carbonyl content and species MLS was significant at p = .001 and R 2 = .52. Interestingly, cells from some of the longer-lived species consistently had lower levels of protein carbonyl content following treatment with H2O2, shown in Figure 1B as negative values. This decline in carbonyl content was noted as a consistent feature when independent cell lines from different donors of the same species were studied, for example, in assays using cell lines from three different porcupines. The decline in protein carbonyl after exposure to H2O2 suggests a possible hormetic effect in cells from these long-lived rodent species.
As a second measure of resistance to protein damage, we measured how H2O2 affects the proportion of detergent insoluble protein, as an index of aggregation of denatured and unfolded protein molecules (36,37). Detergent-insoluble protein has been shown previously to increase with age in nematode worms (38), in the vertebral disc and lens of humans (39) and in late passage mouse fibroblasts (40). Supplementary Figure 1 shows results of a typical experiment, in this case comparing cells from mice (MLS 4 years) to those from chinchilla (MLS 17.2 years), and Figure 2A shows the results for all 17 tested rodent species. Cells from shorter-lived rodent species tended to accumulate higher levels of detergent insoluble proteins than those from longer-lived animals (R 2 = .24, p = .04) after exposure to H2O2.
Figure 2.
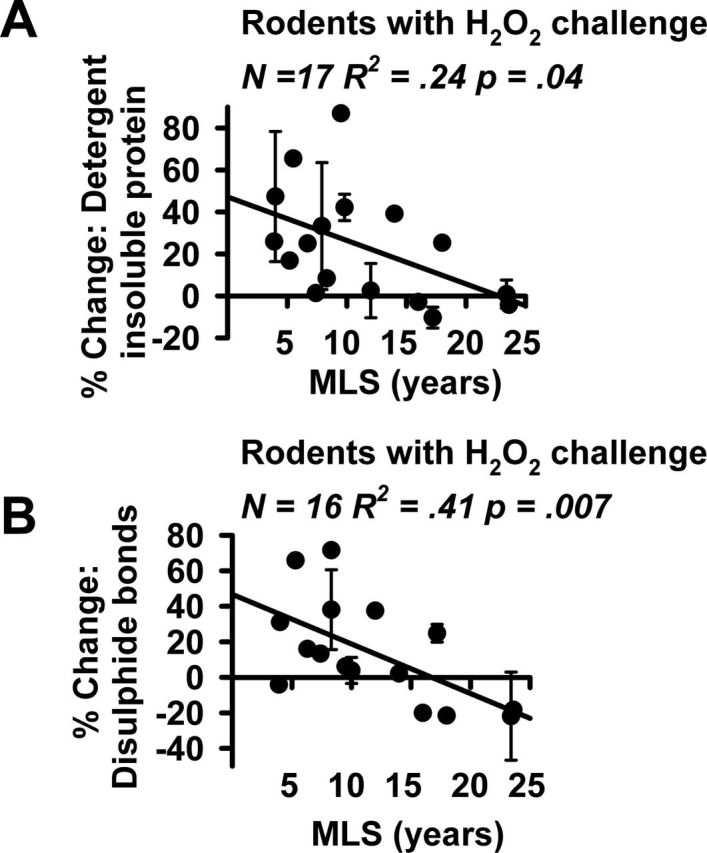
(A) Scatterplot of % change in insoluble protein content following exposure to 200 μM H2O2 in 17 species of rodents. A list of the species tested, with counts of the number of cell lines tested for each species, is provided in Supplementary Table 1. Values are adjusted by soluble protein content in each sample. (B) Scatterplot of % change in disulfide bond formation following exposure to 100 μM H2O2 in 16 species of rodents. A list of the species and number of tested cell lines is in Supplementary Table 1. Values are adjusted by soluble total protein in each sample. Error bars if present represent SEM of 2–3 cell lines derived from independent animals.
As a third measure of resistance to protein damage, we measured formation of disulphide bonds after exposure to H2O2. This served as a third index of protein damage that can be induced by oxidative stress (41). As with other measures of protein damage, disulphide bond levels have been reported to increase with age in a range of animals and tissues including rat and human lens cells (42), as well liver samples from mice and the naked mole rat (21). Supplementary Figure 2 shows results of a typical experiment comparing cells from shrews (MLS 2.2), gerbils (MLS 6.3), fox squirrels (MLS 16), and chinchilla (MLS 17.2). Figure 2B shows the compiled results for the 16 rodent species tested. The Nile kusu was not included in this experiment due to insufficient protein. Cells from shorter-lived rodent species tended to develop higher levels of disulphide bond formation following H2O2 than those from longer-lived animals (R 2 = .41, p = .007).
To see if similar differences in resistance to oxidant damage could be observed in fibroblasts from nonhuman primates, we evaluated increases in protein carbonyl in fibroblasts from 21 primate species ranging in MLS from 16.5 to 59.4 years (see Supplementary Table 2 for details), after 1 hour of exposure to 100 μM of H2O2. As shown in Figure 3A and B, cells from short-lived nonhuman primate species show higher levels of increase in carbonyls than cells from longer-lived primates (R 2 = .46, p = .01). Cells from the longer-lived nonhuman primate species, like cells from longer-lived rodents (Figure 1), frequently show reduced levels of protein carbonyl after exposure to H2O2. Cells from two human cell lines were tested in parallel (see “H” symbol in Figure 3B), and were found to be resistant to H2O2-induced carbonyl formation. The association between MLS and carbonyl formation remained significant (R 2 = .19, p = .04) when all primates, ie, both human and nonhuman species, were considered together.
Figure 3.
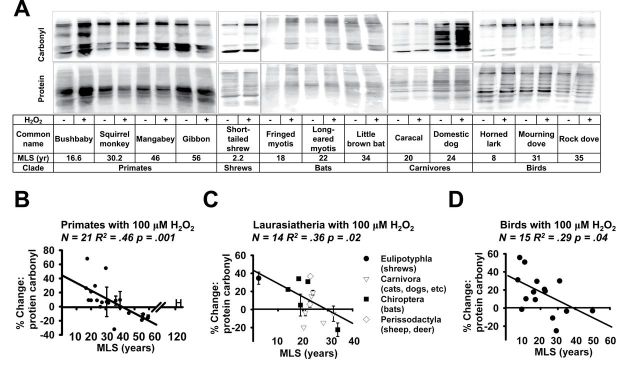
(A) Representative immunoblot showing protein carbonyl content following exposure to 100 μM H2O2 in three species of primate, one species of shrew, three species of bat, two species of carnivore, and three species of bird (in which 200 μM H2O2 was used instead of 100 μM H2O2). (B) Scatterplot of % change in protein carbonyl content following exposure to 100 μM H2O2 in 22 species of primate. A complete list of the species is provided in Supplementary Table 2. Humans (“H” symbol) were included in the scatterplot but not in the statistical analysis. (C) Scatterplot of % change in protein carbonyl content following exposure to 100 μM H2O2 in 14 species of Laurasiatheria. A list of the species is provided in Supplementary Table 3. (D) Scatterplot of % change in protein carbonyl content following exposure to 200 μM H2O2 in 15 species of birds. A complete list of the species is provided in Supplementary Table 4. In all animal clades values are adjusted by total protein content in each sample. Error bars, if present, represent SEM of 2–3 cell lines derived from independent animals. The regression line and statistical analysis represent the trend within the clade.
To test our hypothesis in a third, independent clade, we evaluated fibroblasts from 14 species of Laurasiatheria, a mammalian superorder that includes shrews, bats, ungulates, and carnivores (43) (see Supplementary Table 3 for details). As shown in Figure 3A and C, we found a significant negative correlation between protein carbonyl induction and MLS (R 2 = .36, p = .02) for this group of species. Additionally we noted that cells from some longer-lived species showed a decline in peroxide-induced protein carbonyl accumulation after peroxide exposure, similar to examples seen for some long-lived species of rodents and nonhuman primates.
As a test of whether a correlation between resistance to oxidative damage and life span is unique to mammals, a similar analysis was performed on bird species. An initial set of pilot experiments used a dose of 100 μM H2O2, that is, the dose used for the study of mammalian cell lines, but bird cells proved to be highly resistant to this dose: seven of the 11 species tested had no increase in protein carbonyl content, and many of the species showed a decrease in protein carbonyl content at this peroxide concentration. This observation is consistent to previous reports showing resistance of bird cell lines to peroxide-induced cell death (29). We, therefore, used a higher dose, 200 μM, to survey bird cell lines for resistance to protein carbonyl damage, with results for the 15 species tested shown in Figure 3A and D, and with details given in Supplementary Table 4. Using 200 μM H2O2, we noted a negative correlation between increase in protein carbonyl content and life span among bird species, significant at R 2 = .29 and p = .04.
We used analysis of covariance to explore associations between H2O2-induced carbonyl formation and MLS, using the data for the three mammalian groups in combination. For the set of all 52 species of mammals (Figure 4A), the association between carbonyl formation and MLS was significant at R 2 = .31 and p < .0001. The three slopes are significantly different (F 2,48 = 4.07, p = .02): steeper in rodents than in primates or Laurasiatheria. When individual groups were compared, a significant difference was noted between the rodents and the primates (F 1,35 = 8.02, p = .007) and between the rodents and Laurasiatheria (F 1,34 = 4.12, p = .05), but the contrast between primates and the Laurasiatheria did not achieve statistical significance on its own (F 1,32 = 2.78, p = .11). Bird species were not included in this comparison due to the higher dose of H2O2 required for the assay.
Figure 4.
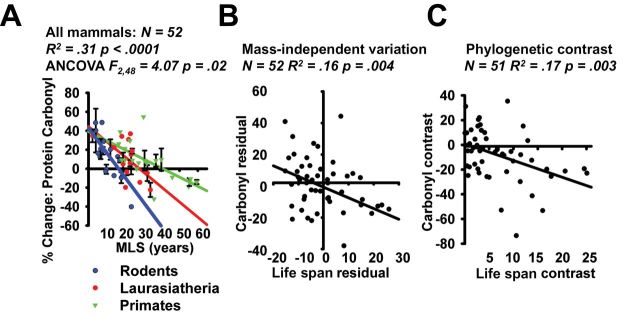
(A) Scatterplot of % change in protein carbonyl content following exposure to 100 μM H2O2 in 52 species of mammals. Values are pooled from Figures 1 and 3. Regression lines represent trends within individual clades, and the statistics represent comparisons within the group as a whole. (B) Scatterplot of mass-adjusted changes in protein carbonyl content following exposure to 100 μM H2O2 in 52 species of mammals. Values represent the residual from Supplementary Figure 3A (x-axis) & Supplementary Figure 3B (y-axis). (C) Scatterplot showing standardized contrast analysis for protein carbonyl content following exposure to 100 μM H2O2 in 52 species of mammal. Values are calculated as described in Ref. (22) and are based on the phylogeny in Supplementary Figure 4 and reference list in Supplementary Figure 5. Note: N = 51 instead of 52 due to the pairwise comparisons involved in the phylogenetic contrast.
In general, larger species of mammals tend to have longer life spans than smaller ones, perhaps reflecting both relaxed predator pressure and longer postnatal development times among the larger species. Larger species also have lower metabolic rates (per unit lean body mass), so that cellular changes associated with adaptation to higher metabolic rate might show an association with life span, across species, even if there were no causal linkage (44). On the other hand, adjustment for body mass is likely to obscure associations that do indeed reflect causal associations, because diluting statistical trends by adjustment for a common covariate (mass) will increase type II errors (45–47). To evaluate this issue, we calculated the regression between two residuals: (a) the residual of life span regressed against log10(mass) and (b) the residual of the % increase in protein carbonyl following H2O2 exposure regressed against log10(mass); Supplementary Figure 3 shows the regression plots for each of these two sets of data. Figure 4B shows the plot of the two residuals against one another, showing a significant correlation between mass-adjusted life span and mass-adjusted carbonyl accumulation (R 2 = .16, p = .004) among species of mammals. Thus, the association of species life span with resistance to carbonyl accumulation is not merely an artifact of a shared association with body mass.
A second potential complication comes from variation in phylogenetic distances among species. Closely related species would be expected to have similar life spans and protein damage resistance, even if there were no causal relationship. A standard regression makes the assumption that all species are independent, in this case equally distant from one another in evolutionary divergence, and this incorrect assumption can lead to misleading conclusions, particularly in analyses using clusters of closely related species (23). To evaluate this issue we conducted a standardized phylogenetic-independent contrast analysis (22), based on a phylogeny constructed through a literature review and weighted by the separation of species in millions of years using phylogenies shown in Supplementary Figures 4 and 5. We found a significant correlation between life span and susceptibility to protein damage following exposure to H2O2, significant at R 2 = .17 and p = .003, using this standardized contrast analysis (Figure 4C). Thus, the association noted by linear regression is not merely an artifact of clustered evolutionary groupings.
We also compared rodent, nonhuman primate, and Laurasiatheria cell lines for change in protein carbonyl level after exposure to paraquat, which produces free radical damage through a reaction with oxygen to form superoxide radicals (48). We evaluated fibroblasts from 16 species of rodent after 1 hour of exposure to 5mM paraquat. As shown in Supplementary Figure 6A, cells from short-lived rodent species show higher levels of increase in carbonyls than longer lived rodents (R 2 = .29, p = .03). The Nile kusu was not included in this experiment due to insufficient recovery of protein. In contrast, we saw no such pattern among the 20 species of nonhuman primates examined (see Supplementary Figure 6B). The Laurasiatheria species, like the rodents, showed a negative trend between carbonyl accumulation and MLS, but the association did not achieve statistical significance (Supplementary Figure 6C: R 2 = .12, p = .22). When the species were combined (16 species of rodents, 20 of nonhuman primates, and 14 Laurasiatheria species, as shown in Figure 5A), we found a significant association (R 2 = .09, p = .03), with higher protein carbonyl changes seen in the shorter-lived species. After adjustment for mass, however, no significant trend was observed (Figure 5B and Supplementary Figure 7: R 2 = .02, p = .36), and adjustment for phylogenetic relationships revealed a trend that did not reach statistical significance (Figure 5C: R 2 = .06, p = .08).
Figure 5.
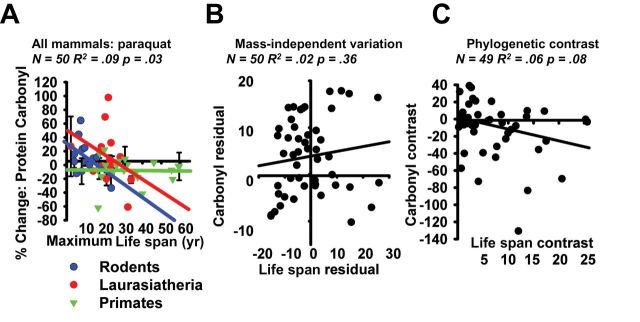
(A) Scatterplot of % change in protein carbonyl content following exposure to 5mM paraquat in 50 species of mammal. Values are pooled from Supplementary Figure 6. Regression lines represent trends within individual clades, and statistics represent comparisons within the entire group of species. (B) Scatterplot of mass-adjusted changes in protein carbonyl content following exposure to 5mM paraquat in 50 species of mammal. Values represent the residual from Supplementary Figure 3A (x-axis) & Supplementary Figure 6 (y-axis). (C) Scatterplot of phylogenetic-standardized protein carbonyl content following exposure to 5mM paraquat in 50 species of mammals. Values are calculated as described in Ref. (22) and are based on the phylogeny in Supplementary Figures 4 and material cited in Supplementary Figure 5. Note: N = 49 instead of 50 due to the pairwise comparisons involved in the phylogenetic contrast.
We also evaluated protein carbonyl content in cells in their standard growth condition, ie, without previous exposure to H2O2 or paraquat, in part to see whether there were differences which might affect interpretation of the change scores shown in Figures 1 and 3, and in part to see if species variation affected protein status prior to imposed oxidative stress. When samples from all mammalian species were compared together, a significant negative trend was observed in which shorter-lived mammals were found to have a much higher level of protein carbonyls than longer-lived mammals (R 2 = .19, p = .001) (see Figure 6A). This trend survived adjustments for phylogenetic relatedness (R 2 = .08, p = .04) but did not survive adjustment for mass (R 2 = .0001, p = .94). In contrast when mammalian clades were individually examined we saw trends which were weaker and did not reach statistical significance (see Figure 6, Supplementary Figures 8 and 9). We did observe that levels of oxidative damage in species of bats were on average 70% higher than in other species of Laurasiatheria (see Supplementary Figure 8), and noted that this difference was significant at p = .008 (using a Student’s t test).
Figure 6.

Scatterplot of baseline protein carbonyl content in (A) 52 species of mammal. (B) 17 species of rodent, (C) 21 species of primate, (D) 14 species of Laurasiatheria. Humans (“H”) are shown in the plot but were excluded from the statistical analyses.
Discussion
Long life span, and the slower rate of aging that leads to long life span, has evolved independently many times in diverse clades of mammals to provide improved reproductive fitness in ecological niches that reward postponement of the diseases and disabilities of aging. Each evolutionary event that creates a long-lived species, or group of related species, presents new opportunities for learning about the biological factors that control aging rate. Diets (49), drugs (50,51), and mutations (52) that extend life span in experimental mammals have, so far, been able to increase maximal life span by a factor of 25%–60% at most, but the differences between the shortest-lived mammals, including shrews and mice (53), and longer-lived species such as chimpanzees, whales, and humans (53) are roughly 20- to 40-fold. It is an open question whether the changes that lead to slower aging in one clade of mammals are identical, different, or overlapping with respect to those which slow aging in other independent groups of species.
We have tackled this problem using a strategy with two main features: (a) we have evaluated fibroblast cell lines derived from the skin of adults; and (b) we have used dozens of species, thus allowing independent assessment of hypotheses in nonoverlapping clades.
Our use of a large battery of species also provides important advantages. Comparisons that involve only a handful of species are difficult to interpret, because there are likely to be many biochemical and cellular differences that are unrelated to aging and longevity, in addition to changes that could, in principle, modulate aging rate (22,23). Studies of exceptionally long-lived species, such as the naked mole rat (20,54) or long lived clams (19), can provide valuable ideas about factors related to the exceptional longevity in individual species, and can help call into question over hasty generalizations about antiaging defenses (54), but the idiosyncratic biology of these unusual species may render them less useful as tests of general hypotheses that might modulate aging among more typical sets of species. Comparative analyses of wider sets of species has documented systematic correlations between life span and/or body size with multiple cellular and physiological endpoints, including fatty acid balance (45), mitochondrial use of cysteine and methionine codons (55), and IGF-1 levels (56), in addition to the work on fibroblast cell lines presented earlier (25,26,28,30). Evaluation of large sets of species provides greater statistical power, opportunities to test ideas in nonoverlapping clades, and the chance to identify exceptions to general trends, exceptions that may reward more detailed scrutiny.
Previous reports from this laboratory have shown that fibroblasts from long-lived species of rodents (28) and long-lived species of birds (29) resist cell death after exposure to H2O2. Our current data provide new information about protection of intracellular proteins against carbonyl formation, aggregation or misfolding of proteins into insoluble forms, and resistance to inappropriate disulfide bond formation after brief exposure to H2O2 or to paraquat. Our results provide support for the hypothesis that resistance of proteins to oxidative damage frequently accompanies evolved species longevity and is thus consistent with the idea that oxidation resistance might be a component of a multiplex set of defense mechanisms that contributes to slow aging across species. We see similar correlations in three independent mammalian clades, ie, in rodents, nonhuman primates, and Laurasiatheria, hinting that the association of oxidation-resistance and longevity may represent convergent evolution, perhaps through induction of pathways predating the divergence of these mammalian groups, and perhaps even predating the branch between the ancestors of nematodes and those of vertebrates. For peroxide stress, the association between resistance to carbonyl formation and MLS is strong enough to survive correction for species body mass, despite the loss of statistical power involved in adjusting for a factor so strongly correlated with life span among mammals whose body weight exceeds 1 kg (57). The standardized contrast analysis (Figure 4C) indicates that the association is not due merely to phylogenetic relationships ignored by ordinary least-squares regression methods (22,23). A similar trend was also observed amongst bird species albeit under higher levels of oxidative stress. This finding strengthens the notion that resistance to protein damage is a good predictor of species life span even outside of the mammalian clade. The finding that birds appear highly stress resistant is consistent with previous reports (29).
This work presents a clear demonstration that resistance to oxidative protein damage is highly correlated to life span among a range of animal clades. The causes of this life span–dependent difference remains unknown. Do differences among cell lines in resistance to H2O2 damage reflect removal of peroxide prior to interaction with proteins, or removal of damaged proteins, or hormetic induction of anti-oxidant defenses, or the action of chaperone proteins, or a combination of these factors? Will other systems that influence accumulation of damaged proteins, including enzymatic and proteasome-based degradation pathways, vary among species in association with longevity differences? Do cells other than fibroblasts, such as hepatocytes, lymphocytes, and vascular endothelial cells, show similar MLS-associated differences in resistance to peroxide-induced carbonyl accumulation? Are the effects we have noted in cells derived from adult skin also detectable in cells produced from embryonic or neonatal sources, or do they emerge only after events encountered in the postnatal development and adult phases of the life span? The use of large collections of fibroblasts from multiple mammalian clades is a powerful tool for understanding the biology of aging. Work with such collections of cell lines has only just begun, and poses both advantages and challenges that make the approach complementary to work with intact animals and their tissues. We think that further use of cell lines from animals with disparate life spans will help to shed light on the ways in which evolution can mold life history and delay aging. We also hope that these studies may contribute eventually to the development of drugs that can promote human health by induction of similar cellular protective systems.
Supplementary Material
Supplementary material can be found at: http://biomedgerontology.oxfordjournals.org/
Funding
National Institute of Aging, a division of the National Institutes of Health (AG013283 and AG023122 to R.A.M.).
Supplementary Material
Acknowledgments
The authors wish to thank Dr. Steven Austad for advice on phylogenetic comparisons and for the donation of skin samples used to generate some of the cell lines. The authors thank Mark Steinke of Michigan Wildlife Removal, Jonathon Reichard of the Center for Ecology and Conservation Biology at Boston University, Aimee Hart of the National Forest service, Veronika Kiklevich of University of Texas Health Science Center, Paul Faure of McMaster University, and Phil Myers of the University of Michigan for providing samples from wild-trapped animals for our analysis. The authors also thank the New England Regional Primate Research Center (NERPRC) and Southwest National Primate Research Center (SWNPRC) for donating skin biopsies from which cell lines were derived. Furthemore, the authors thank Dr. Stephen O’Brien and the Coriell cell repository for providing a number of fibroblast cell lines.
References
- 1. Larsen PL. Aging and resistance to oxidative damage in Caenorhabditis elegans . Proc Natl Acad Sci USA. 1993;90:8905–8909. [DOI] [PMC free article] [PubMed] [Google Scholar]
- 2. Salmon AB, Murakami S, Bartke A, Kopchick J, Yasumura K, Miller RA. Fibroblast cell lines from young adult mice of long-lived mutant strains are resistant to multiple forms of stress. Am J Physiol Endocrinol Metab. 2005;289:E23–E29. :10.1152/ajpendo.00575.2004 [DOI] [PubMed] [Google Scholar]
- 3. Salmon AB, Leonard S, Masamsetti V, et al. The long lifespan of two bat species is correlated with resistance to protein oxidation and enhanced protein homeostasis. FASEB J. 2009;23:2317–2326. [DOI] [PMC free article] [PubMed] [Google Scholar]
- 4. Vilchez D, Morantte I, Liu Z, et al. RPN-6 determines C. elegans longevity under proteotoxic stress conditions. Nature. 2012;489:263–268. :10.1038/nature11315 [DOI] [PubMed] [Google Scholar]
- 5. Orr WC, Sohal RS. Extension of life-span by overexpression of superoxide dismutase and catalase in Drosophila melanogaster. Science. 1994;263:1128–1130. [DOI] [PubMed] [Google Scholar]
- 6. Schriner SE, Linford NJ, Martin GM, et al. Extension of murine life span by overexpression of catalase targeted to mitochondria. Science. 2005;308:1909–1911. :10.1126/science.1106653 [DOI] [PubMed] [Google Scholar]
- 7. Chen Q, Thorpe J, Dohmen JR, Li F, Keller JN. Ump1 extends yeast lifespan and enhances viability during oxidative stress: central role for the proteasome? Free Radic Biol Med. 2006;40:120–126. :10.1016/j.freeradbiomed.2005.08.048 [DOI] [PubMed] [Google Scholar]
- 8. Pérez VI, Bokov A, Van Remmen H, et al. Is the oxidative stress theory of aging dead? Biochim Biophys Acta. 2009;1790:1005–1014. :10.1016/j.bbagen.2009.06.003 [DOI] [PMC free article] [PubMed] [Google Scholar]
- 9. Lapointe J, Hekimi S. When a theory of aging ages badly. Cell Mol Life Sci. 2010;67:1–8. :10.1007/s00018-009-0138-8 [DOI] [PMC free article] [PubMed] [Google Scholar]
- 10. Gems D, Doonan R. Antioxidant defense and aging in C. elegans: is the oxidative damage theory of aging wrong? Cell Cycle. 2009;8:1681–1687. [DOI] [PubMed] [Google Scholar]
- 11. Speakman JR, Selman C. The free-radical damage theory: accumulating evidence against a simple link of oxidative stress to ageing and lifespan. Bioessays. 2011;33:255–259. :10.1002/bies.201000132 [DOI] [PubMed] [Google Scholar]
- 12. Kirkwood TB, Kowald A. The free-radical theory of ageing–older, wiser and still alive: modelling positional effects of the primary targets of ROS reveals new support. Bioessays. 2012;34:692–700. :10.1002/bies.201200014 [DOI] [PubMed] [Google Scholar]
- 13. Miller RA. Cell stress and aging: new emphasis on multiplex resistance mechanisms. J Gerontol A Biol Sci Med Sci. 2009;64:179–182. :10.1093/gerona/gln072 [DOI] [PMC free article] [PubMed] [Google Scholar]
- 14. Harshman LG, Haberer BA. Oxidative stress resistance: a robust correlated response to selection in extended longevity lines of Drosophila melanogaster? J Gerontol A Biol Sci Med Sci. 2000;55:B415–B417. [DOI] [PubMed] [Google Scholar]
- 15. Lin YJ, Seroude L, Benzer S. Extended life-span and stress resistance in the Drosophila mutant methuselah. Science. 1998;282:943–946. [DOI] [PubMed] [Google Scholar]
- 16. Lithgow GJ, Miller RA. Determination of aging rate by coordinated resistance to multiple forms of stress. In: Guarente LP, ed. The Molecular Biology of Aging. Cold Spring Harbor, NY: Cold Spring Harbor Press; 2008:427–481. [Google Scholar]
- 17. Ayala V, Naudí A, Sanz A, et al. Dietary protein restriction decreases oxidative protein damage, peroxidizability index, and mitochondrial complex I content in rat liver. J Gerontol A Biol Sci Med Sci. 2007;62:352–360. [DOI] [PubMed] [Google Scholar]
- 18. Kirkwood TB. Understanding the odd science of aging. Cell. 2005;120:437–447. :10.1016/j.cell.2005.01.027 [DOI] [PubMed] [Google Scholar]
- 19. Ungvari Z, Ridgway I, Philipp EE, et al. Extreme longevity is associated with increased resistance to oxidative stress in Arctica islandica, the longest-living non-colonial animal. J Gerontol A Biol Sci Med Sci. 2011;66:741–750. :10.1093/gerona/glr044 [DOI] [PMC free article] [PubMed] [Google Scholar]
- 20. Andziak B, O’Connor TP, Qi W, et al. High oxidative damage levels in the longest-living rodent, the naked mole-rat. Aging Cell. 2006;5:463–471. :10.1111/j.1474-726.2006.00237.x [DOI] [PubMed] [Google Scholar]
- 21. Pérez VI, Buffenstein R, Masamsetti V, et al. Protein stability and resistance to oxidative stress are determinants of longevity in the longest-living rodent, the naked mole-rat. Proc Natl Acad Sci USA. 2009;106:3059–3064. [DOI] [PMC free article] [PubMed] [Google Scholar]
- 22. Garland T, Adolph SC. Why not to do 2-species comparative-studies - limitations on inferring adaptation. Physiol Zool. 1994;67:797–828. [Google Scholar]
- 23. Felsenstein J. Phylogenies and the comparative method. Am Nat. 1985;125:1–15. [Google Scholar]
- 24. Seluanov A, Chen Z, Hine C, et al. Telomerase activity coevolves with body mass not lifespan. Aging Cell. 2007;6:45–52. :10.1111/j.1474-9726.2006.00262.x [DOI] [PMC free article] [PubMed] [Google Scholar]
- 25. Gomes NM, Ryder OA, Houck ML, et al. Comparative biology of mammalian telomeres: hypotheses on ancestral states and the roles of telomeres in longevity determination. Aging Cell. 2011;10:761–768. :10.1111/j.1474-726.2011.00718.x [DOI] [PMC free article] [PubMed] [Google Scholar]
- 26. Kapahi P, Boulton ME, Kirkwood TB. Positive correlation between mammalian life span and cellular resistance to stress. Free Radic Biol Med. 1999;26:495–500. [DOI] [PubMed] [Google Scholar]
- 27. Kirkwood TL, Kapahi P, Shanley DP. Evolution, stress, and longevity. J Anat. 2000;197(Pt 4):587–590. [DOI] [PMC free article] [PubMed] [Google Scholar]
- 28. Harper JM, Salmon AB, Leiser SF, Galecki AT, Miller RA. Skin-derived fibroblasts from long-lived species are resistant to some, but not all, lethal stresses and to the mitochondrial inhibitor rotenone. Aging Cell. 2007;6:1–13. :10.1111/j.1474-726.2006.00255.x [DOI] [PMC free article] [PubMed] [Google Scholar]
- 29. Harper JM, Wang M, Galecki AT, Ro J, Williams JB, Miller RA. Fibroblasts from long-lived bird species are resistant to multiple forms of stress. J Exp Biol. 2011;214(Pt 11):1902–1910. :10.1242/jeb.054643 [DOI] [PMC free article] [PubMed] [Google Scholar]
- 30. Seluanov A, Hine C, Bozzella M, et al. Distinct tumor suppressor mechanisms evolve in rodent species that differ in size and lifespan. Aging Cell. 2008;7:813–823. :10.1111/j.1474-9726.2008.00431.x [DOI] [PMC free article] [PubMed] [Google Scholar]
- 31. Elbourkadi N, Austad SN, Miller RA. Fibroblasts from long-lived species of mammals and birds show delayed, but prolonged, phosphorylation of ERK. Aging Cell. 2014;13:283–291. :10.1111/acel.12172 [DOI] [PMC free article] [PubMed] [Google Scholar]
- 32. Dostál L, Kohler WM, Penner-Hahn JE, Miller RA, Fierke CA. Fibroblasts from long-lived rodent species exclude cadmium. J Gerontol A Biol Sci Med Sci. 2014. :10.1093/gerona/glu001 [DOI] [PMC free article] [PubMed] [Google Scholar]
- 33. Hancock K, Tsang VC. India ink staining of proteins on nitrocellulose paper. Anal Biochem. 1983;133:157–162. [DOI] [PubMed] [Google Scholar]
- 34. Garland D, Russell P, Zigler JS., Jr The oxidative modification of lens proteins. Basic Life Sci. 1988;49:347–352. [DOI] [PubMed] [Google Scholar]
- 35. Goto S, Nakamura A, Radak Z, et al. Carbonylated proteins in aging and exercise: immunoblot approaches. Mech Ageing Dev. 1999;107:245–253. [DOI] [PubMed] [Google Scholar]
- 36. McDuffee AT, Senisterra G, Huntley S, et al. Proteins containing non-native disulfide bonds generated by oxidative stress can act as signals for the induction of the heat shock response. J Cell Physiol. 1997;171:143–151. :10.1002/(SICI)1097-4652(199705)171:2<143::AID-JCP4>3.0.CO;2-O [DOI] [PubMed] [Google Scholar]
- 37. Demasi M, Davies KJ. Proteasome inhibitors induce intracellular protein aggregation and cell death by an oxygen-dependent mechanism. FEBS Lett. 2003;542:89–94. [DOI] [PubMed] [Google Scholar]
- 38. David DC, Ollikainen N, Trinidad JC, Cary MP, Burlingame AL, Kenyon C. Widespread protein aggregation as an inherent part of aging in C. elegans . PLoS Biol. 2010;8:e1000450. :10.1371/journal.pbio.1000450 [DOI] [PMC free article] [PubMed] [Google Scholar]
- 39. Hallén A. Accumulation of insoluble protein and aging. Biogerontol. 2002;3:307–316. [DOI] [PubMed] [Google Scholar]
- 40. Van Gansen P, Pays A, Malherbe L. Actin content and organization of microfilaments in primary cultures of mouse embryonic fibroblasts (in vitro ageing). Biol Cell. 1985;54:251–260. [DOI] [PubMed] [Google Scholar]
- 41. Cumming RC, Andon NL, Haynes PA, Park M, Fischer WH, Schubert D. Protein disulfide bond formation in the cytoplasm during oxidative stress. J Biol Chem. 2004;279:21749–21758. :10.1074/jbc.M312267200 [DOI] [PubMed] [Google Scholar]
- 42. Ozaki Y, Mizuno A, Itoh K, Iriyama K. Inter and intramolecular disulfide bond formation and related structural changes in the lens proteins. A Raman spectroscopic study in vivo of lens aging. J Biol Chem. 1987;262:15545–15551. [PubMed] [Google Scholar]
- 43. Waddell PJ, Okada N, Hasegawa M. Towards resolving the interordinal relationships of placental mammals. Syst Biol. 1999;48:1–5. [PubMed] [Google Scholar]
- 44. Speakman JR. Correlations between physiology and lifespan–two widely ignored problems with comparative studies. Aging Cell. 2005;4:167–175. :10.1111/j.1474-9726.2005.00162.x [DOI] [PubMed] [Google Scholar]
- 45. Hulbert AJ. On the importance of fatty acid composition of membranes for aging. J Theor Biol. 2005;234:277–288. :10.1016/j.jtbi.2004.11.024 [DOI] [PubMed] [Google Scholar]
- 46. Hulbert AJ, Faulks SC, Buffenstein R. Oxidation-resistant membrane phospholipids can explain longevity differences among the longest-living rodents and similarly-sized mice. J Gerontol A Biol Sci Med Sci. 2006;61:1009–1018. [DOI] [PubMed] [Google Scholar]
- 47. Barja G. Correlations with longevity and body size: to correct or not correct? J Gerontol A Biol Sci Med Sci. 2014. :10.1093/gerona/glu020 [DOI] [PubMed] [Google Scholar]
- 48. Bus JS, Gibson JE. Paraquat: model for oxidant-initiated toxicity. Environ Health Perspect. 1984;55:37–46. [DOI] [PMC free article] [PubMed] [Google Scholar]
- 49. Weindruch R, Sohal RS. Seminars in medicine of the Beth Israel Deaconess Medical Center. Caloric intake and aging. N Engl J Med. 1997;337:986–994. [DOI] [PMC free article] [PubMed] [Google Scholar]
- 50. Harrison DE, Strong R, Allison DB, et al. Acarbose, 17-alpha-estradiol, and nordihydroguaiaretic acid extend mouse lifespan preferentially in males. Aging Cell. 2014. Apr;13(2):273–282. :10.1111/acel.12170 [DOI] [PMC free article] [PubMed] [Google Scholar]
- 51. Harrison DE, Strong R, Sharp ZD, et al. Rapamycin fed late in life extends lifespan in genetically heterogeneous mice. Nature. 2009;460:392–395. [DOI] [PMC free article] [PubMed] [Google Scholar]
- 52. Ladiges W, Van Remmen H, Strong R, et al. Lifespan extension in genetically modified mice. Aging Cell. 2009;8:346–352. [DOI] [PubMed] [Google Scholar]
- 53. Jones ML. Longevity of mammals in captivity–an update. In Vivo. 1992;6:363–366. [PubMed] [Google Scholar]
- 54. Lewis KN, Andziak B, Yang T, Buffenstein R. The naked mole-rat response to oxidative stress: just deal with it. Antioxid Redox Signal. 2013;19:1388–1399. :10.1089/ars.2012.4911 [DOI] [PMC free article] [PubMed] [Google Scholar]
- 55. Aledo JC, Li Y, de Magalhães JP, Ruíz-Camacho M, Pérez-Claros JA. Mitochondrially encoded methionine is inversely related to longevity in mammals. Aging Cell. 2011;10:198–207. [DOI] [PubMed] [Google Scholar]
- 56. Stuart JA, Page MM. Plasma IGF-1 is negatively correlated with body mass in a comparison of 36 mammalian species. Mech Ageing Dev. 2010;131:591–598. :10.1016/j.mad.2010.08.005 [DOI] [PubMed] [Google Scholar]
- 57. Austad SN, Fischer KE. Mammalian aging, metabolism, and ecology: evidence from the bats and marsupials. J Gerontol. 1991;46:B47–B53. [DOI] [PubMed] [Google Scholar]
Associated Data
This section collects any data citations, data availability statements, or supplementary materials included in this article.