

Abstract
It is well known that acid/base disturbances modulate proton/bicarbonate transport in the cortical collecting duct. To study the adaptation further we measured the effect of three days of acidosis followed by the rapid recovery from this acidosis on the number and type of intercalated cells in the rabbit cortical collecting duct. Immunofluorescence was used to determine the expression of apical pendrin in β-intercalated cells and the basolateral anion exchanger (AE1) in α-intercalated cells. Acidosis resulted in decreased bicarbonate and increased proton secretion, which correlated with reduced pendrin expression and the number of pendrin-positive cells, as well as decreased pendrin mRNA and protein abundance in this nephron segment. There was a concomitant increase of basolateral AE1 and α-cell number. Intercalated cell proliferation did not seem to play a role in the adaptation to acidosis. Alkali loading for 6–20 h after acidosis doubled the bicarbonate secretory flux and reduced proton secretion. Pendrin and AE1 expression patterns returned to control levels, demonstrating that adaptive changes by intercalated cells are rapidly reversible. Thus, regulation of intercalated cell anion exchanger expression and distribution plays a key role in adaptation of the cortical collecting duct to perturbations of acid/base.
Keywords: acidosis, cell and transport physiology, collecting ducts, immunohistochemistry, mRNA
The kidney controls acid/base balance, and the ultimate fine tuning of renal acid/base transport occurs in the cortical collecting duct (CCD). Intercalated cells, which make up a third of cells of the CCD,1 are responsible for acid/base transport; α-intercalated cells secrete protons and β-intercalated cells secrete bicarbonate.2,3 Type α-intercalated cells have apical H+ -ATPases and basolateral anion exchangers (AE1), whereas β-intercalated cells express apical anion exchangers (pendrin) and basolateral H+ -ATPases. We have examined changes in the physiology of the CCD during metabolic acidosis in vivo4 and in vitro.3,5 Indeed, there is an increase in H+ secretion and a decrease in secretion in CCDs taken from acidotic rabbits,4 or after acid incubation.3,5 In addition, there is a loss of apical anion exchange in β-intercalated cells and a reduction of the apical membrane that binds peanut agglutinin.3
Recent studies suggest that the extracellular matrix (ECM) protein hensin is deposited in the fact, a third of such adapting cells not only lost apical anion exchange but established basolateral anion exchange, suggesting a reversal in functional polarity. Such an acid-induced insertion/activation of basolateral anion exchangers has also been observed by Merot et al.6 We surmised that the change in β-intercalated cell physiology was induced by the deposition of hensin in the ECM underlying these adapting cells. Anti-hensin antibodies,3 as well as inhibitors of cyclophilin PPIase (peptidylprolyl cis/trans isomerase) activity that block hensin secretion,7 inhibit acid-induced changes in intercalated cell physiology.8 Hensin is expressed in many epithelial cells and serves to induce a differentiated phenotype,9–11 suggesting that differentiation might be difficult to reverse once the matrix is laid down. It would follow that reversal of the acidosis might be associated with a significant delay in adaptive changes of intercalated cells. Accordingly, we attempted to reverse acidosis by abruptly changing the diet of the rabbits, and examined changes in cell physiology, transport, and phenotype. Would such ‘terminally differentiated’ intercalated cells respond rapidly to the correction of acidosis?
The purpose of this study was to characterize in rabbits the changes in pendrin and AE1 distribution, expression, and synthesis, and in bicarbonate transport, in response to acid loading in vivo and then to determine what occurs within 12–16 h of NaHCO3 administration, when acidosis has been rapidly reversed.
Results
Transitioning from acid to alkali loading as a model for recovery from acidosis
In the rabbit CCD the adaptation to acidosis involves compensatory changes in H+/HCO3 transport by α- and β-intercalated cells, respectively, that is regulated in part by ETB receptor signaling12 and changes in the composition of ECM hensin predominantly surrounding β-intercalated cells.3 Because it has been suggested that ECM hensin and galectin-3 mediate signals that promote acquisition of a terminally differentiated epithelial cell phenotype,9,10 it would seem that once hensin is deposited in the ECM, a cell could not rapidly de-differentiate. Accordingly, we sought to develop an in vivo model in which we could identify the parameters associated with reversible adaptive changes in intercalated cell phenotypes that define the response of α- and β-intercalated cells to perturbations in acid/base status. In this study we have compared the intercalated cell phenotypes in the CCD of normal rabbits with those from rabbits administered NH4Cl for 3 days (acidosis) versus rabbits administered NH4Cl for 3 days and abruptly transitioned to NaHCO3 for 12–18 h (recovery). As shown in Figure 1, normal rabbits fed an alkaline ash diet showed serum bicarbonate levels between 25 and 30 mmol/l (lower panel) with an alkaline urine (pH 8.1±0.1, upper panel), whereas NH4Cl loading induced marked acidosis characterized by reduction of serum bicarbonate to 15–16 mmol/l (lower panel) and acidification of urine to pH below 5 (upper panel). In rabbits transitioned from NH4Cl to NaHCO3 (recovery), the serum bicarbonate returned to essentially ‘normal’ levels (normal vs recovery; P-value = 0.092) and the urine pH values recovered to 7.8 + 0.1 (normal vs recovery; P-value = 0.0190). As acidosis reduces bicarbonate secretion in the rabbit,3–5 these data suggest that a significant amount of bicarbonate secretion had been rapidly restored in the CCD within 12–18 h after bicarbonate administration. Rabbit weights measured just before killing were not significantly different among acid/base conditions: normal = 2.53±0.08, acidotic = 2.53±0.08, and recovery = 2.33±0.05 (normal vs recovery, acidosis vs recovery; P>0.04). These data suggest that dehydration was not an important factor in the generation of acidosis.13
Figure 1. Rabbit acid/base status.
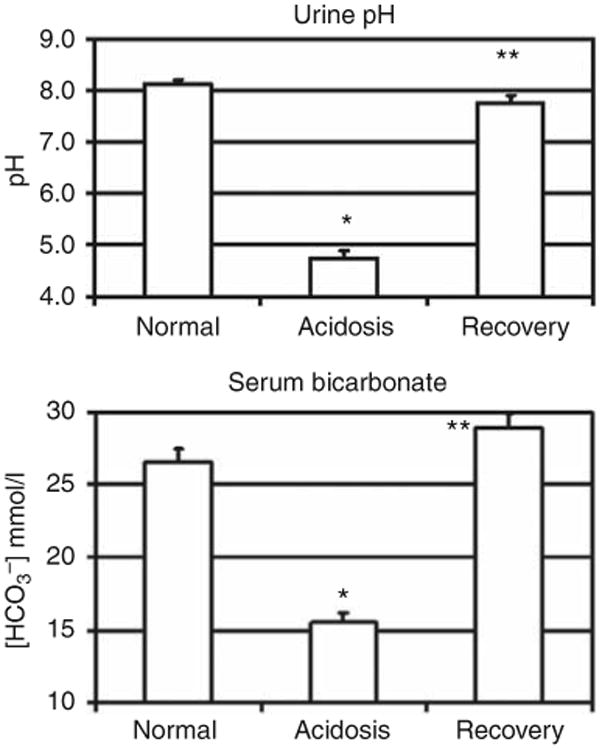
Mean±s.e. for urine pH and serum bicarbonate (mmol/l) values for control rabbits (normal), rabbits administered NH4Cl (0.1 M) for 3 days (acidosis), and rabbits administered NH4Cl (0.1 M) for 3 days followed by NaHCO3 for 12–18 h (recovery) that were used for immunofluorescence staining, quantitative real-time PCR (mRNA), and western blotting studies. Normal (n= 15), acidosis (n = 13), and recovery (n=14). Statistical significance noted as *normal vs acidotic, and **acidotic vs recovery using Bonferroni correction (P<0.001).
Regulation of pendrin expression by acid/base status
Pendrin (SLC26A4) has been identified as the apical chloride/ bicarbonate exchanger expressed by β-intercalated cells,14,15 and both pendrin expression and subcellular localization are regulated by changes in acid/base status.16–18 In the rabbit CCD, pendrin expression is observed as a brightly stained crescent shape (pendrin cap) on the apical surface of β-intercalated cells in the outer cortical region of kidney sections stained with anti-pendrin antibody (Figure 2a). In this study we compared pendrin expression in the CCDs of the outer cortex by immunostaining of kidney sections prepared from normal, acid-loaded (acidosis) rabbits, and acid followed by alkali-loaded (recovery) rabbits. Tables 1 and 2 list the numbers of rabbits and kidney sections as well as the total number CCDs and/or cells that comprise the results summarized in Figures 2 and 3. Acidosis reduced both the apparent level of pendrin expression and the size of pendrin caps. Pendrin cap staining intensity was reduced in half (Figure 2b), and pendrin cap size distribution was shifted to the left (reduced, Figure 2c), which most likely reflects apical endocytosis of the transporter. In addition, acidosis, whether extended over a 3- or 7-day period, reduced the apparent number of pendrin-positive cells in CCDs of the outer cortex by ∼ 1 cell per 100 mm length of CCD (Figure 2d).
Figure 2. Rapid recovery from acidosis restores apical pendrin expression in the cortical collecting duct (CCD).
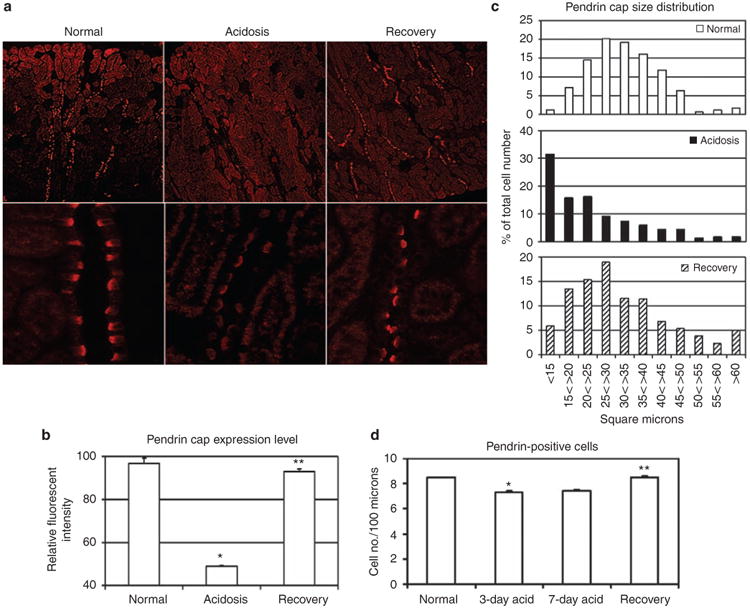
(a) Representative digital images (top row, original magnification × 100; bottom row, original magnification × 400) taken within the outer cortex of kidney sections (6–8 μm) stained for pendrin (red) from normal, acidotic, and rabbits recovering from acidosis. (b) Relative fluorescent intensity of pendrin caps measured from digital images using the ImageJ software. Each bar represents the mean relative fluorescent intensity ± s.e. of pendrin caps of 300-500 positively stained cells from 2 to 3 non-serial sections per rabbit and at least three rabbits per condition (see Table 1). *Normal vs acidotic, and **acidotic vs recovery (P< 0.001). (c) Size distribution (μm2) of pendrin caps from panel b. Pendrin cap size and fluorescent intensity were measured concomitantly using the Image J software (see Materials and Methods). Normal, open bar; acidosis, solid bar; and recovery, crosshatched bar. (d) The frequency of pendrin-positive cells per 100 μm length of CCD. CCD length was measured with the ImageJ software using kidney sections from two (7-day acidosis) to three rabbits (normal, 3-day acidosis, recovery) per condition and the corresponding number of pendrin-positive cells was recorded. Results are presented as the average ± s.e. for pendrin-positive cells per 100 μm from measurement of 131 – 213 collecting ducts and 3290 – 5646 cells counted per acid/base condition (see Table 2). *Normal vs acidotic, and **acidotic vs recovery (P<0.001).
Table 1. Summary of immunofluorescent staining analysis.
| Parameter | Acid/base status | Rabbit N= | Sections/ rabbit | Sections, total no. | Image no./ magn. | No. of CCDs | No. of cells |
|---|---|---|---|---|---|---|---|
| Pendrin cap intensity/size | Normal | 3 | 2–3 | 7 | 26/ × 400 | — | 397 |
| Acidosis | 4 | 1–3 | 7 | 27/ × 400 | — | 462 | |
| Recovery | 3 | 2–3 | 7 | 26/ × 400 | — | 526 | |
| AE1 basolateral intensity | Normal | 3 | 2 | 6 | 21/ × 400 | — | 186 |
| Acidosis | 4 | 2 | 8 | 28/ × 400 | — | 293 | |
| Recovery | 3 | 2 | 6 | 24/ × 400 | — | 182 | |
| AE1 distribution | Normal | 3 | 2–5 | 9 | 33/ × 400 | — | 194 |
| Acidosis | 4 | 2–5 | 11 | 40/ × 400 | — | 307 | |
| Recovery | 3 | 2–5 | 9 | 36/ × 400 | — | 230 | |
| Mitotic figures (Sytox) | Acidosis | 6 | 1–2 | 8 | 273/ × 100 | 2487 | — |
| Ki-67 | Acidosis | 2 | 2 | 4 | — | 232 | — |
Abbreviations: AE1, anion exchanger; CCD, cortical collecting duct; magn., magnification.
Table 2. Summary of CD cell enumeration.
| Parameter | Region | Acid/base status | Rabbit N= | Sections, total no. | Image no. | No. of CDs | No. of cells |
|---|---|---|---|---|---|---|---|
| Pendrin+ cells per 100 μm | Cortex | Normal | 3 | 4 | 23 | 168 | 4535 |
| Acidosis | 3 | 4 | 27 | 178 | 4414 | ||
| 7-day Acid. | 2 | 4 | 17 | 131 | 3290 | ||
| Recovery | 3 | 4 | 30 | 213 | 5646 | ||
| AE1+ cells per 100 μm | Cortex | Normal | 3 | 4 | 30 | 187 | 1441 |
| Acidosis | 3 | 4 | 28 | 155 | 1295 | ||
| 7-day Acid. | 2 | 4 | 52 | 373 | 5400 | ||
| Recovery | 3 | 4 | 26 | 189 | 1611 | ||
| AE1+ cells per 100 μm | Medulla | Normal | 3 | 4 | 18 | 120 | 1556 |
| Acidosis | 3 | 4 | 15 | 120 | 2080 | ||
| 7-day Acid. | 2 | 4 | 21 | 152 | 3004 | ||
| Recovery | 3 | 4 | 14 | 69 | 913 | ||
| AQP2+ cells per 100 μm | Cortex | Normal | 3 | 4 | 34 | 150 | 6478 |
| Acidosis | 3 | 4 | 23 | 97 | 5199 | ||
| 7-day Acid. | 2 | 4 | 28 | 138 | 7787 | ||
| Recovery | 3 | 4 | 26 | 88 | 3663 | ||
| AQP2+ cells per 100μm | Medulla | Normal | 3 | 4 | 23 | 172 | 8538 |
| Acidosis | 3 | 4 | 17 | 159 | 10,161 | ||
| 7-day Acid. | 2 | 4 | 17 | 139 | 139 | ||
| Recovery | 3 | 4 | 20 | 119 | 119 |
Abbreviations: Acid., acidosis; AE1, anion exchanger; AQP2, aquaporin 2; CD, collecting duct.
Figure 3. Changes in acid/base status induces redistribution of anion exchanger (AE1) expression and changes in the apparent number of α-intercalated cells.
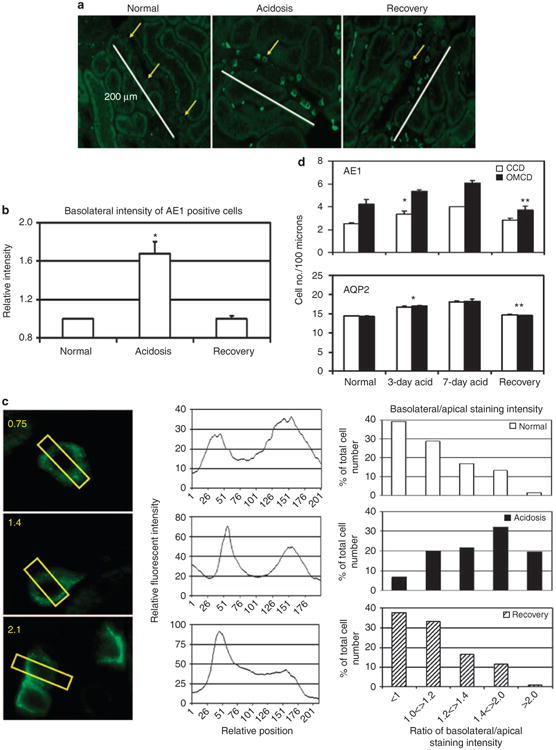
(a) Representative digital images of AE1 staining (green) within the outer cortex of kidney sections prepared from rabbits with indicated acid/base status. Arrows point to cells positively stained for AE1, whereas the white lines delineate a 200-μm calibration mark stamped onto the digital image. (b) Recovery from acidosis reverses the increase in basolateral AE1 expression induced by acidosis. Fluorescent intensity of basolateral AE1 staining was measured with ImageJ using kidney sections from at least three rabbits per condition (Table 1). Basolateral AE1 staining intensity in sections from normals was set to 1, and the mean ±s.e. intensities induced by acidosis and recovery are shown. *Acidosis vs recovery was significant (P<0.01). (c) Distribution of AE1 expression in, α-intercalated cells. Left panels illustrate how the AE1 distribution was measured using the line function of the ImageJ software (see Materials and Methods), and the middle panels show representative plots of densitometric values along lines bisecting the respective α-intercalated cells. The right panels show a plot of the percentage of the total number of AE1-expressing cells that fall into basolateral/ apical ratio bins ranging from <1 (low basolateral AE1 expression) to >2 (predominant basolateral AE1 expression). (d) Frequency of AE1 and aquaporin-2 (AQP2)-positive cells per 100 μm length of cortical collecting duct (CCD) or outer medullary collecting duct (OMCD). Length was measured with the ImageJ software using kidney sections from two (7-day acidosis) or three (all others) rabbits per condition, and the corresponding number of AE1- or AQP2-positive cells observed in 88-373 CCDs and 69-172 OMCDs per condition was recorded (see Table 2). Results are presented as the average ± s.e. for AE1-positive cells per 100 μm. *Normal vs acidotic (3 day), and **acidotic (3 day) vs recovery were significant (P<0.02).
Amelioration of acidosis by alkali loading reversed adaptive changes in pendrin expression. Pendrin staining intensity returned to near-normal levels (1.9-fold increase over acidosis staining intensity) in ‘recovery’ animals, whereas the pendrin cap size showed an intermediate distribution between that found in normal and acidotic animals (Figure 2b and c). The mean pendrin cap areas in μm2 were normal = 35±2.1, acidotic =20.7±5.2, and recovery= 32±0.6, indicating a restoration of apical pendrin expression within 12–18 h after administration of sodium bicarbonate. The apparent number of pendrin-positive cells also returned to normal upon amelioration of acidosis. These results suggest that the subcellular distribution of pendrin, as well as pendrin expression levels, continuously (and relatively rapidly) vary with changes in acid/base status.
Subcellular localization of AE1 is regulated by acid/base status
Adaptive changes in α-intercalated cells caused by fluctuation in acid/base status was also examined by immunofluorescence staining of kidney sections for AE1 (Table 1). Acidosis induced a reversible redistribution of AE1 to the basolateral membrane of α-intercalated cells located in the outer cortex (Figure 3a). As shown in Figure 3b, acidosis nearly doubled (1.7±0.1 times) the intensity of basolateral AE1 staining in the CCD, and this increase was reversed by administration of alkali to acidotic rabbits.
Redistribution of AE1 was also quantified by measuring the intensity of AE1 staining along the vertical axis of the cell with the ImageJ software (US National Institutes of Health, Bethesda, MD, USA), as illustrated in Figure 3c (left panel), and calculating the ratio of the basolateral/apical peak intensity values determined from a plot of intensity versus position (Figure 3c, middle panels), as described in the Materials and Methods. A histogram of the proportion of cells with basolateral/apical ratios ranging from <1 to >2 (Figure 3c; right panels) reveals that acidosis markedly increased the proportion of cells with predominantly basolateral distribution of AE1 (that is, ratio of >1.4) compared with normal animals in which most cells showed ratios of <1.2. The mean percentage ± s.e. with ratios >1.4 was: normal=19.7±8.8, acidotic=56.9±4.9, and recovery = 16.3±3.9. Recovery from acidosis (alkali loading) resulted in an AE1 distribution pattern similar to that observed in normal animals. The acidosis-induced basolateral AE1 redistribution most likely reflects exocytosis into the basolateral membrane of α-intercalated cells, and thus AE1 cellular trafficking is continuously regulated by fluctuations in acid/base status.
Acidosis over a 3- to 7-day period also resulted in increase in the apparent number of AE1 + and aquaporin 2 (AQP2)-positive cells in the collecting duct. The apparent frequency of AE1 + and AQP2-positive cells in the CCD increased 1–2 and 2–4 cells per 100 μm, respectively, during acidosis (Figure 3d). Similar increases in the number of AE1 + and AQP2-positive cells with acidosis were observed in the outer medullary collecting duct (OMCD), indicating that the apparent gain in AE1-positive cells does not necessarily result from conversion of β- to α-intercalated cell phenotype. Furthermore, efforts to define a pendrin/AE1 double-positive cell population in the rabbit CCD during acidosis failed to yield definitive results (not shown). Recovery from acidosis returned the apparent number of AE1 and AQP2 cells to near-normal levels, showing the rapid reversibility of these phenomena. Changes in intercalated and principal cell numbers reported in Figures 2 and 3d most likely reflect changes in transporter expression over and under a threshold for immunofluorescence detection.
Acidosis decreases steady-state levels of pendrin mRNA
To determine whether changes in AE1 and pendrin staining intensity reflect regulation of transporter gene expression by acid/base status, the steady-state levels of AE1 and pendrin mRNAs expressed in rabbit kidney cortex were determined by quantitative real-time PCR. As shown in Figure 4 (top panel), the steady-state level of pendrin mRNA in kidney cortex isolated from normal rabbits is 131-fold greater than the steady-state level of AE1 mRNA, due in part to the fact that β-intercalated cells outnumber α-intercalated cells by more than 3:1 in the normal rabbit CCD (compare Figures 2d and 3d).1,19–21
Figure 4. Pendrin mRNA expression is regulated by acid/base status.

Steady-state levels of pendrin, B1-V-ATPase, epithelial sodium channel (ENaC) β-subunit, and anion exchanger (AE1) mRNA in rabbit outer kidney cortex isolated from rabbits with the indicated acid/base status was determined by quantitative realtime PCR as described in the Materials and Methods. (Upper panel) Each bar represents the mean ± s.e. of the relative copy number for the indicated mRNA species. (Lower panel) Bars represent the mean ± s.e. of pendrin and AE1 mRNA copy number normalized to B1-V-ATPase abundance in the respective samples. Normal n = 6 rabbits, acidosis n = 4, and recovery n = 5. Statistical significance was *normal vs acidotic, and **acidotic vs recovery (P≤0.002). Normal vs recovery was not significant (P>0.5).
Pendrin mRNA expression in kidney cortex from acidotic rabbits was reduced 3.0-fold compared with normal rabbits (P<0.01), whereas neither B1-V-ATPase nor AE1 mRNA abundance was significantly altered by acidosis or recovery (P>0.5). After 3 days of acid loading, pendrin mRNA abundance was still 46-fold greater than AE1. Amelioration of acidosis by alkali loading reversed the effect of acidosis on pendrin mRNA expression; pendrin mRNA abundance returned to essentially normal levels in ‘recovery’ animals (normal vs recovery; P>0.5). In a previous study, steadystate levels of epithelial sodium channel (ENaC) β-subunit mRNA analyzed by Northern analysis did not seem to be altered by acidosis.22 Therefore, we examined ENaC β-subunit copy number as a possible control for the relative amount of distal nephron segments contained in outer cortex samples. However, ENaC β copy number was reduced 1.5-fold (P<0.05) by acidosis, and returned to near-normal levels (normal vs recovery; P>0.2) upon amelioration of acidosis. As B1-V-ATPase mRNA did not change during acidosis (Figure 4, upper panel), normalization to B1-V-ATPase copy number was used to control for the relative amount of distal nephron segments in RNA from kidney cortex. The B1-V-ATPase copy number from a normal rabbit kidney cortex sample was assigned the value of 1 (that is, division by itself), and then the pendrin and AE1 copy numbers were adjusted for the difference in the B1 mRNA abundance between the control and the respective sample. As shown in Figure 4 (lower panel), even with normalization to B1-V-ATPase, acidosis did not result in a significant change in AE1 mRNA abundance (P>0.15). The reduction in pendrin mRNA abundance by acidosis was 3.1-fold after normalization (P<0.002), and pendrin mRNA abundance returned to normal levels upon recovery (normal vs recovery; P>0.5). These results suggest that adaptive changes in pendrin expression observed in Figure 2 are due, at least in part, to regulation of pendrin gene expression by acid/base status.
Acidosis reversibly reduces pendrin protein expression
To confirm regulation of pendrin expression by acid/base status at the protein level, we prepared membrane vesicles from rabbit kidney cortex and quantified levels of pendrin, AE1, and B1-V-ATPase protein by western blotting. As intercalated cells represent only a small fraction of the total epithelial cell population in the rabbit kidney cortex, we performed Percoll density gradient fractionation of membrane vesicle preparations to enrich for vesicle fractions containing acid/base transporters. This approach enhanced detection of all transporters, but was essential for detection of AE1 protein in the kidney cortex. As shown in Figure 5a, pendrin was detected as a major band between 110 and 140 kDa as well as a purported dimeric form of ∼220–250 kDa (not shown) that distributed roughly evenly across the density gradient in vesicle preparations from normal rabbits, whereas AE1 was detected in low fractions as a major band of ∼230 kDa (presumably a glycosylated dimeric form) as well as ∼100–110 kDa species (glycosylated monomeric form); deglycosylation reduced the size to ∼90 kDa (not shown). Consistent with the results for mRNA abundance, acidosis reduced the overall level of pendrin protein in gradient fractions (that is, sum of levels in individual fractions) by approximately threefold (normal vs acidosis: P<0.035; acidosis vs recovery: P<0.02; Figure 5b, top panel), whereas B1 and AE1 protein levels in gradient fractions were not significantly changed (normal vs acidosis: P>0.5 for AE1 and B1). Occasionally, as in the experiment shown in Figure 5a, there was an apparent shift in the pendrin distribution from low-density (fraction ≥8 in normals) to high-density fractions (F4 in acidosis) that may reflect changes in pendrin trafficking into distinct vesicular compartments during acidosis.17,23 Furthermore, redistribution of pendrin to lower-density fractions upon recovery was consistently observed. Recovery from acidosis restored pendrin protein expression to essentially normal levels (normal vs recovery; P>0.5). Figure 5c illustrates the close association between urine pH and pendrin protein expression (r2 =0.827), and provides additional evidence for rapid and reversible regulation of pendrin protein expression by acid/base perturbations.
Figure 5. Pendrin protein expression is reversibly downregulated by acidosis.
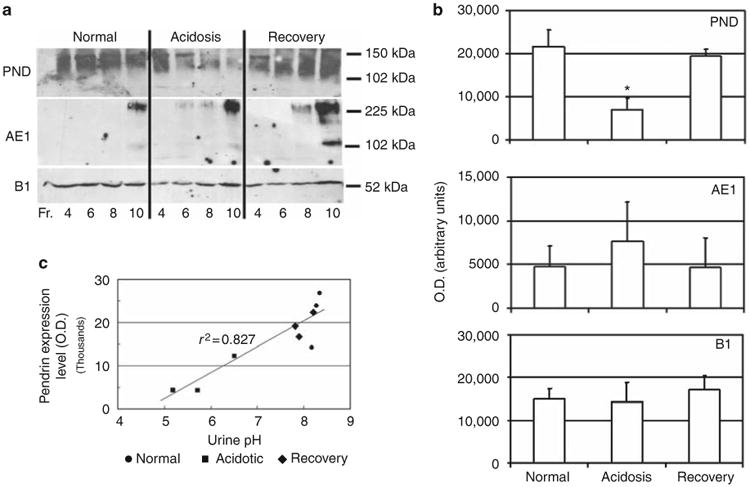
(a) Levels of pendrin (PND), anion exchanger (AE1), and B1-V-ATPase protein in membrane vesicle fractions prepared from rabbit kidney cortex were determined by western blotting of the indicated density gradient fractions (see Materials and Methods). (b) Results of densitometric scans of western blots obtained for three rabbits per acid/base condition, in which values obtained from individual gradient fractions were summed. *Acidotic vs recovery was significant (P<0.02). (c) Plot of urine pH vs relative pendrin protein expression level in kidney cortical membranes expressed as optical density (OD) for three rabbits per acid/base condition.
Adaptation to acidosis occurs in the absence of cellular proliferation in the rabbit CCD
In a recent study, Van Huyen et al.24 observed proliferation of α-intercalated cells, particularly in the OMCD that peaked 3 days after acid feeding, and resulted in an apparent lengthening of the OMCD segment. In a previous study, we found no association between adaptive changes in transport elicited by acidosis and the presence of mitotic cells in the CCD.1 In this study we have examined sections from rabbit small intestine and kidney for mitotic figures by staining DNA with Sytox green (Molecular Probes, Eugene, OR). Although mitotic figures were readily observed in crypt regions of the small intestine (data not shown), we failed to detect any mitotic figures in OMCDs or CCDs despite examining > 2400 CCDs from multiple kidney sections prepared from acidotic rabbits (Table 1). As nuclear expression of Ki-67 is a more sensitive assay for cellular proliferation,24 we also examined Ki-67 expression in sections from small intestine and kidney by immunofluorescence staining. Although Ki-67 expression was observed in nuclei of crypt cells of the small intestine (data not shown), we did not detect Ki-67-positive nuclei after examining >200 kidney sections prepared from acidotic rabbits. Thus, expansion of intercalated cell subtypes through cellular proliferation does not seem to be a principal mechanism for adaptation of the CCD to acidosis in our rabbit model.
Amelioration of acidosis restores bicarbonate secretion in the CCD
CCDs from normal rabbits secrete net bicarbonate,3,5 and this reflects a small proton secretory flux and a large bicarbonate secretory flux. CCDs taken from acidotic rabbits secreted net acid (Figure 6, open boxes), and this net flux comprised a large proton secretory flux and a relatively smaller bicarbonate secretory flux, as shown previously.4 CCDs taken from recovering rabbits secreted much less net acid (Figure 6, slashed boxes), which comprised a significantly smaller proton secretory flux and a much larger bicarbonate secretory flux. Indeed, the bicarbonate secretory flux was more than twice that observed in CCDs from acidotic rabbits.
Figure 6. Transport studies in cortical collecting ducts (CCDs) taken from acidotic (open bars) and recovering (slashed bars) rabbits and perfused in vitro.
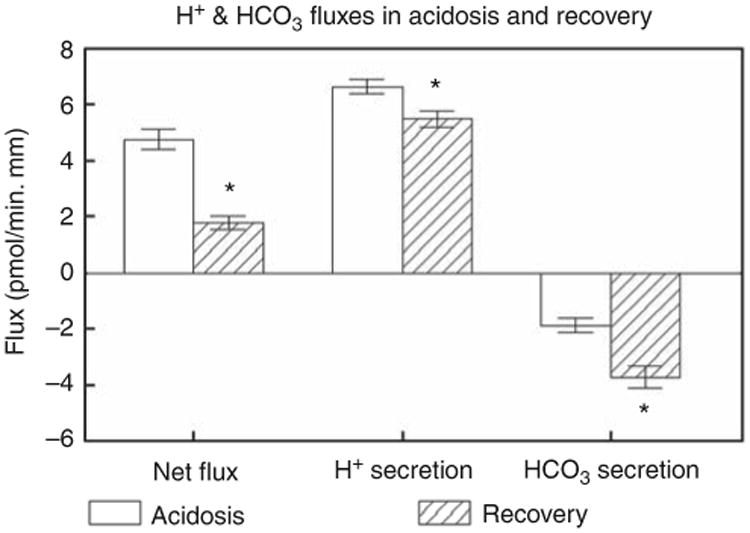
The left pair of bars depict the net fluxes, the middle pair the proton secretory fluxes, and the right pair the bicarbonate secretory fluxes. *Significant differences between CCDs from acidotic vs recovering rabbits (P<0.001).
Discussion
Adaptation to acidosis
The provision of 3 days of NH4Cl in the drinking water of rabbits caused a significant metabolic acidosis manifested by decreased serum bicarbonate and urine pH, as described previously.4 The pendrin expression level, cap size, and number of cells expressing pendrin per unit length of CCD all decreased with acidosis. We have previously shown that two other markers of the apical membranes of β-intercalated cells, peanut agglutinin and monoclonal antibody B63, are significantly reduced when CCDs are exposed to acid incubation in vitro.3,25 We presume that the acid-induced reduction in apical exchange3 is accomplished by endocytosis of a portion of the apical membrane and reduction of its area. Indeed, the induction of apical endocytosis of β-intercalated cells in the CCD can be prevented by disrupting actin filaments of the cytoskeleton.1,4,26
In addition to the reduction of apical surface area of β-intercalated cells, acidosis induced a reduction in pendrin mRNA and protein in kidneys taken from NH4Cl-treated rabbits compared with normals. These findings are in agreement with the regulated expression of pendrin synthesis in acidotic rats16,18 and mice.17 In addition, pendrin expression was shifted from the apical membrane to a presumed intracellular pool with the relative numbers of pendrin-positive cells reduced.7 Such a pendrin redistribution also attests to the role of endocytosis in the adaptation to metabolic acidosis.1
The response to metabolic acidosis of α-intercalated cells expressing AE1 is teleologically to increase H+ secretion. AE1 staining was more intense and more polarized to the basolateral membrane, so as to better facilitate exchange in parallel with apical H+ secretion. In addition, there were more AE1-positive cells in the CCDs. Despite an apparent increase in AE1 staining observed in kidney sections of acidotic rabbit kidney, no significant increase in mRNA or protein expression was observed in samples of whole kidney cortex compared with normals. A similar paradigm for basolateral polarization of AE1 can be found when comparing staining in the CCD, which normally secretes small amounts of protons,3 and normally shows basolateral and/or cytoplasmic staining of intercalated cells,20 against that in the OMCD, which secretes protons at a much higher rate27 and shows predominately heavy basolateral staining.20 Saboc et al28. showed in rats that acute metabolic acidosis (6 h) induced increased AE1 staining in CCDs. Furthermore, Fejes-Toth et al.29 showed that 16–20 h of metabolic acidosis stimulated AE1 mRNA and protein three- to fivefold in freshly isolated α-intercalated cells. Huber et al.30 showed that acidosis increased AE1 mRNA by ∼20% in rat cortex using quantitative in situ hybridization. Our quantitative reverse transcriptase-PCR and western blotting of whole kidney cortex, even when normalized to an unchanging gene/ protein, failed to show upregulation of AE1 expression. These results suggest that changes in AE1 expression observed most likely result from redistribution of AE1 and perhaps some upregulation of AE1 within the relatively small α-intercalated cell population residing in the CCD. Perhaps the lack of purity of our cortical preparation prevented us from detecting upregulation of AE1; or, the changes were too small to be detected.
In addition, we attempted to compare the changes in intercalated cell number with those of principal cells, identified as AQP2-positive cells. Compared with normal controls, there were more AQP2-positive cells in the acidotic CCD and OMCD, as observed previously.13 The increase in AQP2-positive cells was unlikely due to dehydration,13 because the acidotic rabbits had the same average weight at killing as did the normals.
Metabolic acidosis stimulated proton secretion in isolated CCDs, as is well known.1,3– 5 Compared with CCDs from normal rabbits, which secrete net bicarbonate, CCDs from acidotic rabbits secrete net protons, and this is mediated by a significant increase in H+ secretory flux and a very large decrease in secretion,3,5 as confirmed in the present experiments. Despite the increase in H+ secretion, we failed to show an increase in H+ -ATPase B1 subunit mRNA or protein with acidosis. Indeed, Bastani et al.31 found that 1 week of chronic metabolic acidosis did not significantly change the level of the 31 kDa subunit protein of the H+-ATPase, in agreement with our findings. These researchers found that the predominant adaptation was to change the steady-state distribution of H+ -ATPase, which recycles between cytoplasmic vesicles and plasma membrane through activation of apical endocytosis. Indeed, morphometric analysis of intercalated cells from acidotic rabbits showed increased apical and basolateral plasma membrane, as suggested by Verlander et al.32; redistribution of plasma membrane containing acid/base transport proteins ‘may represent an important adaptive response of intercalated cells to chronic acid loading.’
Moreover, such an adaptation was not associated with increased numbers of dividing cells in the CCD, as noted by counting mitotic figures or observing the cell proliferation-associated antigen defined by monoclonal antibody Ki-67. Previously,1 we failed to identify mitotic figures in CCDs taken from acidotic rabbits using Hoechst nuclear staining of >40,000 cells. Our inability to detect proliferating cells is unlikely due to lack of technical proficiency, as these same assays clearly showed cell proliferation in the small intestine. These findings contrast with those of Van Huyen et al.,24 who found that protonsecreting intercalated cells proliferated in the OMCD of acidotic mice. They also found evidence of proliferation in CCD, but this seemed to be at a much smaller rate.4 Although we cannot formally exclude a role for cellular proliferation in the adaptive response to chronic acidosis (that is, ≥1 to 2 weeks), our results indicate that increasing the number of intercalated cells through cell proliferation does not seem to be a component of the early adaptive response of the rabbit CCD to acidosis.
Recovery from acidosis
The recovery from acidosis was mediated by changing the drinking water from NH4Cl to NaHCO3. The response was rapid and nearly complete within 12-16 h, as manifested by the adaptive changes in serum bicarbonate and urine pH. Such a rapid response might not be anticipated had the adapting intercalated cells ‘terminally differentiated’ to proton-secreting (α-intercalated) forms9 in response to acidosis-induced hensin deposition into the ECM surrounding these cells3. In keeping with this recovery, pendrin cap expression, cap size, staining intensity, mRNA, protein, and the number of pendrin-stained cells all increased from levels observed during acidosis. Similar findings have been noted in mice exposed to 48 h17 and rats to 7 days17 of oral bicarbonate loading. However, in the latter case, there was no change in the fraction of cells expressing pendrin, nor in the subcellular localization of pendrin compared with kidneys of control rats.17
Because rabbits ingest an alkaline ash diet and their CCDs already secrete net bicarbonate,5 it was unlikely that straight alkali loading would cause changes in intercalated cell pendrin expression compared with normals. However, with the findings regarding hensin-induced terminal differentiation9 of proton-secreting intercalated cells, it seemed more logical to load acidotic rabbits with alkali to induce changes in pendrin expression. Recovery was associated with a large decrease in net proton secretion by CCDs taken from alkaliloaded rabbits that had formerly been acidotic for 3 days. Examination of the adaptation of bicarbonate transport revealed a small but significant decrease in proton secretory flux and a large significant increase in bicarbonate secretory flux, due in large part to increased pendrin synthesis along with redistribution of pendrin to the apical surface of β-intercalated cells. Indeed, pendrin expression in kidney cortex was well correlated with urine pH, indicating a tight association with the adaptation to acid/base perturbations.
Plasticity of intercalated cell polarity
In the absence of obvious cell proliferation, how does one account for an apparent decrease in number of pendrinpositive intercalated cells in acidosis and an increase during recovery? Similarly, how does one explain an increase in the number of AE1-positive intercalated cells in acidosis and a decrease in recovery? Conclusive evidence for interconversion between intercalated cell phenotypes is lacking because of our inability to track individual intercalated cell phenotypes throughout adaptation to acidosis, coupled with the lack of definite evidence for a putative transitional pendrin/AE1 double-positive phenotype. On the other hand, we3 and Merot et al.6 have shown functional changes in CCD β-intercalated cells to insert/activate basolateral exchange activity in response to acid incubation. Moreover, it is likely that intercalated cells are able to change their direction of vectorial transport in response to changes in acid/base status, as shown previously3–5,12,23 and in the present studies.
Immunocytochemical data showing increased number of pendrin-positive cells is likely to result from increased apical expression of the protein during recovery and decreased during acidosis, primarily through exocytosis and endocytosis, respectively; there is also decreased mRNA coding for pendrin during acidosis and a return to nearnormal levels with recovery. The endocytosed and newly synthesized proteins are likely to be destroyed rapidly so that pendrin staining becomes decreased, fewer cells express this protein, and bicarbonate secretion is reduced. With recovery, there is likely less degradation as synthesis of pendrin proteins is upregulated, and pendrin is exported to the apical membrane for mediating enhanced bicarbonate secretion.
AE1 shows the opposite effect, as it is normally broken down in endocytic compartments during normal (alkaline ash diet) and recovery conditions; little proton secretion ensues. During acidosis, there is less breakdown of AE1 and the protein is exported mainly to the basolateral membranes to mediate increased proton secretion. We were unable to show significant changes in kidney AE1 mRNA or protein under the different conditions, suggesting that marked changes in AE1 expression are not a major component of adaptation to acidosis in the CCD.
Materials and Methods
Animals
Female New Zealand White rabbits weighing 1.5–3.0 kg were maintained on laboratory chow and tap water.34 Acid loading was accomplished by providing 100 mmol/l NH4Cl/7.5% sucrose solution for 3 days during which time food intake was limited to 30g rabbit chow/day. For rapid amelioration of acidosis (that is, recovery), rabbits administered ammonium chloride in drinking water for 3 days were abruptly transitioned to 100 mmol/l NaHCO3/ 7.5% sucrose for 12–18 h. The pH and serum bicarbonate levels of blood samples taken from anesthetized animals as well as the pH of the urine collected directly from the bladder immediately after killing was measured with a radiometer blood gas analyzer (Copenhagen ABL5 model no. LB17493, Westlake, OH, USA).
Immunohistochemistry
Rabbit kidney slices were cut perpendicular to the long axis (1 to 2mm thickness) and immersion fixed in Prefer (Anatech, Battlecreek, MI, USA) or perfusion and/or immersion fixed with paraformaldehyde, lysine, and sodium metaperiodate (2–4% PLP) additionally supplemented with 5% sucrose during immersion fixation35 for 6–8 h at room temperature. Fixed tissues were embedded in paraffin and 4–8mm sections were baked onto positively charged glass slides by heating in an oven at 50–60 °C for 30–60 min. After deparaffinization in Propar Clearant (Anatech), slides were rehydrated by passage through a decreasing ethanol series. Antigen retrieval through heating in high pH antigen unmasking solution (H-3301; Vector Labs, Burlingame, CA, USA) to 90±51°C for 5–10 min was followed by blockade of nonspecific binding using 5% donkey serum (Jackson ImmunoResearch, Birmingham, AL, USA) in phosphate-buffered saline with (AE1) or without (pendrin) streptavidin blocking solution (SP-2002; Vector Labs) and incubated for 15–30 min at room temperature. Sections were then incubated with primary antibodies diluted in 1% donkey serum (1:50 dilutions of polyclonal goat anti-pendrin (SC-23779; Santa Cruz Biotech, Santa Cruz, CA), AQP2 (SC-9880), Ki-67, and MIB-1 antibody (SC-101861)), or IVF12, mouse monoclonal antibody to AE1 (Iowa Hybridoma Bank, Iowa City, IA, USA) and incubated in a humidified chamber for ∼ 16 h at 4 °C. Serial sections were stained individually for kAE1, pendrin, and AQP2. After washing (3 × phosphate-buffered saline for 5-10 min), slides were incubated with 1:1000 dilution of secondary antibodies (donkey anti-goat IgG rhodamine (TRITC) and biotinylated donkey anti-mouse IgG (AE1; Jackson Immunoresearch)) at room temperature in a humidified chamber for 1 to 2 h. Staining for AE1 and Ki-67 also included a tertiary incubation with 1:1000 streptavidin-Alexa Fluor 488 or 647, respectively (Molecular Probes). Slides were mounted in fluorescence mounting medium (VectaShield, H-1000; Vector Labs). DNA staining of small intestine and kidney sections was performed after deparaffinization and rehydration as described above by incubation with 1:10,000 dilution Sytox green (Molecular Probes) in TBS (Tris-buffered saline) for 30min at room temperature.
Slides were analyzed for green, red, and far-red fluorescence using a Nikon E400 fluorescent microscope (Melville, NY, USA) and photographed at × 100, × 400, and × 1000 magnification using a Spot RT Model 7.0 monochrome camera and the Spot RT software (Diagnostic Instruments, Sterling Heights, MI, USA). Three distinct outer cortical regions of each kidney section were photographed at × 100, and then three subregions containing CCDs located within each × 100 regions were photographed at × 400. Occasionally, when more cellular detail was desired, CCDs were photographed at × 1000.
Image analysis
The size (unit area) and mean fluorescent intensity of pendrin staining in digital images was measured by outlining pendrin caps with the polygon function of the ImageJ Software. ImageJ size units were converted to μm2 by determining the corresponding ImageJ unit area of 10, 33, and 100μm2 ellipses stamped onto × 400 images. The number of pendrin- or AE1-positive cells per unit CCD length was determined by measuring the CCD length with the segmented line function in ImageJ, and then counting the number of positively stained cells along the corresponding CCD. ImageJ units were converted to mm using the segmented line function in ImageJ to measure the length of 100-200 mm calibration marks stamped onto × 100 digital images.
The mean fluorescent intensity of basolateral AE1 staining was determined by outlining basolateral region of AE1-positive cells with the polygon function of ImageJ. Because of variation in the relative staining intensity in independent experiments, basolateral AE1 staining observed in kidney sections from control rabbits was set to 1, and the mean ± s.e. for the fold change in basolateral AE1 caused by acidosis and recovery was calculated. The ratio of basolateral/apical AE1 staining was determined using the plot profile in ImageJ function to measure fluorescent intensity along a straight line (width =10–15 units) placed along the apical/ basolateral axis of AE1-positive cells. The fluorescent intensity peaks corresponding to basolateral and apical staining were recorded in an Excel spreadsheet and the ratio was calculated. Summarized in Tables 1 and 2 are the number of rabbits, paraffin sections, images, and magnifications, as well as the number of CCDs and cells analyzed for each of the indicated parameters. Note that data presented in the Results section were derived from multiple images obtained from at least two sets of non-serial sections cut from different paraffin-embedded kidney slices from each rabbit with the specified acid/base condition.
Analysis of steady-state mRNA levels by quantitative real-time, reverse transcription-PCR
Total RNA was isolated from 20 to 30 mg of rabbit outer kidney cortex using the RNeasy Mini kit (Qiagen, Valencia, CA, USA) with RNA-free DNase digestion according to the protocols recommended by the manufacturer. Complementary DNA was synthesized from 2 μg of total RNA using the SuperScript first-strand synthesis system for reverse transcriptase-PCR, Superscript III reverse transcriptase (Invitrogen, Carlsbad, CA, USA), and random primers according to the manufacturer's recommended protocol. Two overlapping partial rabbit pendrin (863 and 923 bp), rabbit AE1 (580 and ∼1040bp), and rabbit B1-V-ATPase (588 and 852 bp) complementary DNA fragments were PCR amplified from rabbit kidney cortex complementary DNA, using the respective cloning primer sets listed in Table 3. PCR fragments were ligated into the pCR2.1-TOPO vector (Invitrogen) and sequenced using the M13 forward and reverse primers and the BigDye Terminator v3.1 cycle sequencing reaction (Applied Biosystems, Carlsbad, CA, USA). Consensus sequence from overlapping pendrin, B1-V-ATPase, or AE1 clones, and the rabbit ENaC β-sequence (accession no. AJ132109) enabled the design of specific primer sets and fluorogenic probes (TaqMan, fluorogenic 5′ nuclease chemistry) using algorithms provided by Integrated DNA Technologies (Coralville, IA, USA). Forward and reverse PCR primers and fluorogenic probes listed in Table 3 were synthesized by Sigma-Aldrich (St Louis, MO, USA). The relative abundance of pendrin, kAE1, B1-V-ATPase, and ENaC β-subunit mRNAs was determined by quantitative real time reverse transcriptase-PCR using appropriate primer/probe sets and the Sequence Detection Systems (SDS) 7000 instrument and software (Applied Biosystems). Serial dilutions of linearized plasmid DNA containing gene-specific sequence were used to generate a standard curve from which the relative mRNA copy number was calculated.
Table 3. PCR primers.
| Forward primers | Reverse primers | Fluorogenic probes | |
|---|---|---|---|
| Pendrin cloninga | 5′-GATTGGATTCATAGTGAGGTACTTGGC-3′ | 1: 5′-TCCAGCCCCAGATGATGGACA-3′ | |
| 2: 5′-AACTGAACTCTCAGGACCACAGTCA-3′ | |||
| AE1 cloning | 1: 5′-TGGATCGGCTTCTGGCTCATCCT-3′b | 1: 5′-CGTGGTGATCTGAGACTCAAGGAA-3′b | |
| 2: 5′-TTCTCAGGACCCCTGCTGGTGTT-3′a | 2: 5′-AGATGCGGTCAAAGAGCTGGATG-3′a | ||
| B1 cloninga | 1: 5′-GGGCTCCCCCACAATGAGATTGC-3′ | 5′-CCAGGTCCAGCGACTCGAACAC-3′c | |
| 2: 5′-TTCCTTGCCTACCAGTGTGAGAAGCA-3′ | |||
| Pendrind | 5′-ATGCAATCGCAGTGTCTGTAGGGA-3′ | 5′-ATATGATGCCAGCGACCTGTGTCT-3′ | 5′-TTCTCTGGCTGCTTCTCCTGCTTTGT-3′ |
| AE1d | 5′-GCGCAAGTTCAAGAACAGCTCCTA-3′ | 5′-TGAAGGAATCCACCAGGACCATGA-3′ | 5′-ATGCTGCGTCGGGTCATCGGAGACTTT-3′ |
| B1d | 5′-ATCAACGTGCTCCCTTCTCTGTCA-3′ | 5′-TGTGCAGGAATTCCAGGTAGAGCA-3′ | 5′-ATGGCGACGTCTCCAACCAGCTGTA-3′ |
| ENAC βd | 5′-TTCAACTACCGCACCATCGAGGAA-3′ | 5′-AAACTCGATGAGACACAGCACGGA-3′ | 5′-AACAACATCGTCTGGCTGCTCTCCAA-3′ |
Abbreviations: AE1, anion exchanger; ENAC β, epithelial sodium channel β.
Primer sequence corresponds to highly conserved regions of mouse, rat, and human complementary DNA.
Primer sequence corresponding to mouse AE1 was obtained from Fejes-Toth et al.29
Primer sequences contain several mismatched residues with mouse, rat, and human B2-V-ATPase complementary DNA.
Quantitative real-time PCR primers.
Fractionation of membrane vesicles isolated from kidney cortex
Membrane vesicles were enriched from rabbit kidney cortex by a modification of the Percoll density fractionation method as described by Grassl and Aronson.36 In brief kidney cortex (5–7 g) was initially homogenized with a Tekmar TK10 homogenizer (Tehmar, Cincinnati, Ohio, USA) in 4 × (wt/volume) ice-cold HEPES buffer with EDTA (HBE) (10 mmol/l Hepes, 250 mmol/l sucrose pH 7.6, supplemented with Complete Protease Inhibitor tablets) and then Dounce homogenized (30 strokes). Homogenates were clarified by centrifugation at 2500 × g for 15 min at 4 °C. The supernatant was collected, and pellets were resuspended in HBE and Dounce homogenized for an additional 20 strokes and centrifuged (2500 × g for 15 min at 4°C). Supernatants were combined and membrane vesicles were pelleted by centrifugation at 20,000 × g for 20 min followed by 100,000 × g for 40 min. Membrane vesicles (white fluffy layer) were gently resuspended from the pellet, and recentrifuged as above before resuspension in 1 to 2 ml of HBE. Membrane vesicles were Dounce homogenized for five strokes and 0.45 ml was layered over 13.65% Percoll (Amersham Biosciences, Piscataway NJ, USA) in HBE (8.5 ml) and centrifuged (48,000 × g) for 30 min. Fractions (0.5–1.0 ml) were collected from Percoll density gradients and washed with five volumes of HBE buffer and stored at −80 °C until use. Total protein concentration in each fraction was determined using the Bio-Rad (Hercules, CA, USA) protein assay reagent micro-method and a bovine serum albumin standard according to the recommended protocols.
Sodium dodecyl sulfate-polyacrylamide gel electrophoresis and western blotting
Membrane vesicle fractions containing equal amounts of total protein (50–150 μg) were resolved by sodium dodecyl sulfate-polyacrylamide gel electrophoresis (6–8% gels; 37.5:1 acrylamide/bis-acrylamide; in Tris-glycine), and transferred to nitrocellulose membranes (Bio-Rad) using a Panther (HEP-1) semidry electroblotter (Owl Scientific, Cambridge, MA, USA) and Towbin's buffer according to recommended protocols. Membranes were then blocked with 5% casein (EMD chemicals, Gibbstown, NJ, USA) in TBS supplemented with 0.05% Tween 20 (TBST). Incubations with primary antibodies, including 1:400 IVF12, 1:500 B1-V-ATPase (N-19, SC-31463; SantaCruz Biotech), and 1:10,000 rabbit anti-pendrin polyclonal antisera37 (kindly provided by Dr Peter Aronson, Yale University New Haven, CT, USA) diluted in 4 ml of 5% casein in TBST, were carried out in heat-sealable bags for 16h at 4°C, followed by 3 × 10-min washes with TBST. Incubations with 1:30,000 dilution horseradish peroxidase-conjugated donkey secondary antibodies (Jackson Immu-noresearch) were carried for 2–4 h at room temperature and followed by 4 × 5-min washes with TBST and one wash in TBS. Western blots were developed with SuperSignal West Pico chemiluminescent substrate (Thermo Scientific, Rockford, IL, USA) and chemiluminescence was detected by exposure to Hyperfilm (Amersham) for 5–120 min. Densitometric analysis of scanned nonsaturated images of film exposures was performed using the ImageJ software.
Microdissection and perfusion of rabbit CCDs
Mid-cortical collecting ducts were microdissected from the kidneys of acid-loaded and 16-h recovered rabbits and microperfused as described.3,5 Three tubules were perfused from each kidney and ranged in size from 0.8 to 1.3 mm. Equilibration and transport studies were performed using Burg's solution in the perfusate and bath containing (in mmol/l) 120 NaCl, 25 NaHCO3, 2.5 K2HPO4, 2 CaCl2, 1.2 MgSO4, 5.5 d-glucose, 1 trisodium citrate, 4 sodium lactate, and 6 l-alanine, 290 ± 2 mosmol/kg H2O, and gassed with 94% O2 and 6% CO2, yielding a pH 7.4 at 37 °C.3 –5 Perfusion rate ranged from 1.7 to 2.6nl/min. The bath was continually exchanged at 11 ml/h to maintain constant composition. Six CCDs from acidotic rabbits and 9 from recovering rabbits were examined.
Bicarbonate transport
Once the transepithelial voltage stabilized (20–30min), triplicate collections of 14.8 nl of tubular fluid were made under watersaturated mineral oil, and analyzed for using a continuous flow microfluorimeter (Nanoflo; WPI, Sarasota, FL, USA).3, 38 ,39, After these baseline collections and to dissect out the coexisting fluxes of H+ secretion by α-intercalated cells and secretion by β-intercalated cells, Cl− was reversibly removed from the luminal fluid,3–5 which causes secretion to cease because of inhibition of apical exchange;26,27,40,41 the uncovered flux is unopposed H+ secretion. CCDs were equilibrated for 5 min in Cl−-free perfusate before fluid was collected. The difference between net flux and H + secretory flux is the secretory flux.3,5,41 In the absence of net water absorption in this segment,1,42 the rate of transport (JHCO3) was calculated as follows: JHCO3 = (CO–CL) where CO and CL are the concentrations of total CO2 (assumed to be equal to that of ), VL is the collected tubular fluid rate determined from the time (in min) to fill the calibrated volumetric pipette, L is the tubular length (in mm), and J is in pmol/min per mm. When JHCO3 >0, there is net absorption; when JHCO3 >0, there is net secretion.
Statistics
Statistical significance of changes in acid/base transporter mRNA abundance, transporter staining, cell counts, and transport rate was assessed using Student's t-test (two tails, samples with equal variance). When three comparisons were performed, statistical significance was established as P≤0.02 using the Bonferroni correction for the 95% confidence interval.
Acknowledgments
This work was supported by the NIH grant DK-50603 (to GJS). We appreciate the technical assistance of Jessica Stolar.
Footnotes
Disclosure: All the authors declared no competing interests.
References
- 1.Schwartz GJ, Barasch J, Al-Awqati Q. Plasticity of functional epithelial polarity. Nature. 1985;318:368–371. doi: 10.1038/318368a0. [DOI] [PubMed] [Google Scholar]
- 2.Wagner CA, Devuyst O, Bourgeois S, et al. Regulated acid-base transport in the collecting duct. Pflugers Arch. 2009;458:137–156. doi: 10.1007/s00424-009-0657-z. [DOI] [PubMed] [Google Scholar]
- 3.Schwartz GJ, Tsuruoka S, Vijayakumar S, et al. Acid incubation reverses the polarity of intercalated cell transporters, an effect mediated by hensin. J Clin Invest. 2002;109:89–99. doi: 10.1172/JCI13292. [DOI] [PMC free article] [PubMed] [Google Scholar]
- 4.Satlin LM, Schwartz GJ. Cellular remodeling of -secreting cells in rabbit renal collecting duct in response to an acidic environment. J Cell Biol. 1989;109:1279–1288. doi: 10.1083/jcb.109.3.1279. [DOI] [PMC free article] [PubMed] [Google Scholar]
- 5.Tsuruoka S, Schwartz GJ. Adaptation of rabbit cortical collecting duct transport to metabolic acidosis in vitro. J Clin Invest. 1996;97:1076–1084. doi: 10.1172/JCI118500. [DOI] [PMC free article] [PubMed] [Google Scholar]
- 6.Merot J, Giebisch G, Geibel J. Intracellular acidification induces Cl/HCO3 exchange activity in the basolateral membrane of ß-intercalated cells of the rabbit cortical collecting duct. J Membrane Biol. 1997;159:253–262. doi: 10.1007/s002329900288. [DOI] [PubMed] [Google Scholar]
- 7.Peng H, Vijayakumar S, Schiene-Fischer C, et al. Secreted cyclophilin A, a peptidylprolyl cis-trans isomerase, mediates matrix assembly of hensin, a protein implicated in epithelial differentiation. J Biol Chem. 2009;284:6465–6475. doi: 10.1074/jbc.M808964200. [DOI] [PMC free article] [PubMed] [Google Scholar]
- 8.Watanabe S, Tsuruoka S, Vijayakumar S, et al. Cyclosporin A produces distal renal tubular acidosis by blocking peptidyl prolyl cis-trans isomerase activity of cyclophilin. Am J Physiol. 2005;288:F40–F47. doi: 10.1152/ajprenal.00218.2004. [DOI] [PubMed] [Google Scholar]
- 9.Vijayakumar S, Takito J, Hikita C, et al. Hensin remodels the apical cytoskeleton and induces columnarization of intercalated epithelial cells: processes that resemble terminal differentiation. J Cell Biol. 1999;144:1057–1067. doi: 10.1083/jcb.144.5.1057. [DOI] [PMC free article] [PubMed] [Google Scholar]
- 10.Hikita C, Vijayakumar S, Takito J, et al. Induction of terminal differentiation in epithelial cells requires polymerization of hensin by galectin 3. J Cell Biol. 2000;151:1235–1246. doi: 10.1083/jcb.151.6.1235. [DOI] [PMC free article] [PubMed] [Google Scholar]
- 11.Takito J, Al-Awqati Q. Conversion of ES cells to columnar epithelia by hensin and to squamous epithelia by laminin. J Cell Biol. 2004;166:1093–1102. doi: 10.1083/jcb.200405159. [DOI] [PMC free article] [PubMed] [Google Scholar]
- 12.Tsuruoka S, Watanabe S, Purkerson JM, et al. Endothelin and nitric oxide mediate adaptation of the cortical collecting duct to metabolic acidosis. Am J Physiol Renal Physiol. 2006;291:F866–F873. doi: 10.1152/ajprenal.00027.2006. [DOI] [PubMed] [Google Scholar]
- 13.Amlal H, Sheriff S, Soleimani M. Upregulation of collecting duct aquaporin-2 by metabolic acidosis: role of vasopressin. Am J Physiol Cell Physiol. 2004;286:C1019–C1030. doi: 10.1152/ajpcell.00394.2003. [DOI] [PubMed] [Google Scholar]
- 14.Royaux IE, Wall SM, Karniski LP, et al. Pendrin, encoded by the Pendred syndrome gene, resides in the apical region of renal intercalated cells and mediates bicarbonate secretion. Proc Natl Acad Sci USA. 2001;98:4221–4226. doi: 10.1073/pnas.071516798. [DOI] [PMC free article] [PubMed] [Google Scholar]
- 15.Soleimani M, Greeley T, Petrovic S, et al. Pendrin: an apical exchanger in the kidney cortex. Am J Physiol. 2001;280:F356–F364. doi: 10.1152/ajprenal.2001.280.2.F356. [DOI] [PubMed] [Google Scholar]
- 16.Petrovic S, Wang Z, Ma L, et al. Regulation of the apical exchanger pendrin in rat cortical collecting duct in metabolic acidosis. Am J Physiol. 2003;284:F103–F112. doi: 10.1152/ajprenal.00205.2002. [DOI] [PubMed] [Google Scholar]
- 17.Wagner CA, Finberg KE, Stehberger PA, et al. Regulation of the expression of the Cl−/anion exchanger pendrin in mouse kidney by acid-base status. Kidney Int. 2002;62:2109–2117. doi: 10.1046/j.1523-1755.2002.00671.x. [DOI] [PubMed] [Google Scholar]
- 18.Frische S, Kwon TH, Frokiaer J, et al. Regulated expression of pendrin in rat kidney in response to chronic NH4Cl or NaHCO3 loading. Am J Physiol. 2003;284:F584–F593. doi: 10.1152/ajprenal.00254.2002. [DOI] [PubMed] [Google Scholar]
- 19.Satlin LM, Matsumoto T, Schwartz GJ. Postnatal maturation of rabbit renal collecting duct. III. Peanut lectin-binding intercalated cells. Am J Physiol. 1992;262:F199–F208. doi: 10.1152/ajprenal.1992.262.2.F199. [DOI] [PubMed] [Google Scholar]
- 20.Matsumoto T, Fejes-Toth G, Schwartz GJ. Postnatal differentiation of rabbit collecting duct intercalated cells. Pediatr Res. 1996;39:1–12. doi: 10.1203/00006450-199601000-00001. [DOI] [PubMed] [Google Scholar]
- 21.Matsumoto T, Schwartz GJ. Novel method for performing carbonic anhydrase histochemistry and immunocytochemistry on cryosections. J Histochem Cytochem. 1992;40:1223–1227. doi: 10.1177/40.8.1377737. [DOI] [PubMed] [Google Scholar]
- 22.Faroqui S, Sheriff S, Amlal H. Metabolic acidosis has dual effects on sodium handling by rat kidney. Am J Physiol Renal Physiol. 2006;291:F322–F331. doi: 10.1152/ajprenal.00338.2005. [DOI] [PubMed] [Google Scholar]
- 23.Kim YH, Kwon TH, Frische S, et al. Immunocytochemical localization of pendrin in intercalated cell subtypes in rat and mouse kidney. Am J Physiol Renal Physiol. 2002;283:F744–F754. doi: 10.1152/ajprenal.00037.2002. [DOI] [PubMed] [Google Scholar]
- 24.Van Huyen JP, Cheval L, Bloch-Faure M, et al. GDF15 triggers homeostatic proliferation of acid-secreting collecting duct cells. J Am Soc Nephrol. 2008;19:1965–1974. doi: 10.1681/ASN.2007070781. [DOI] [PMC free article] [PubMed] [Google Scholar]
- 25.Fejes-Toth G, Naray-Fejes-Toth A, Satlin LM, et al. Inhibition of bicarbonate transport in peanut lectin-positive intercalated cells by a monoclonal antibody. Am J Physiol. 1994;266:F901–F910. doi: 10.1152/ajprenal.1994.266.6.F901. [DOI] [PubMed] [Google Scholar]
- 26.Yasoshima K, Satlin LM, Schwartz GJ. Adaptation of rabbit cortical collecting duct to in vitro acid incubation. Am J Physiol. 1992;263:F749–F756. doi: 10.1152/ajprenal.1992.263.4.F749. [DOI] [PubMed] [Google Scholar]
- 27.Tsuruoka S, Schwartz GJ. Metabolic acidosis stimulates H+ secretion in the rabbit outer medullary collecting duct (inner stripe) of the kidney. J Clin Invest. 1997;99:1420–1431. doi: 10.1172/JCI119301. [DOI] [PMC free article] [PubMed] [Google Scholar]
- 28.Sabolic I, Brown D, Gluck SL, et al. Regulation of AE1 anion exchanger and H+-ATPase in rat cortex by acute metabolic acidosis and alkalosis. Kidney Int. 1997;51:125–137. doi: 10.1038/ki.1997.16. [DOI] [PubMed] [Google Scholar]
- 29.Fejes-Toth G, Chen WR, Rusvai E, et al. Differential expression of AE1 in renal HCO3-secreting and -reabsorbing intercalated cells. J Biol Chem. 1994;269:26717–26721. [PubMed] [Google Scholar]
- 30.Huber S, Asan E, Jons T, et al. Expression of rat kidney anion exchanger 1 in type A intercalated cells in metabolic acidosis and alkalosis. Am J Physiol. 1999;277:F841–F849. doi: 10.1152/ajprenal.1999.277.6.F841. Abstract. [DOI] [PubMed] [Google Scholar]
- 31.Bastani B, Purcell H, Hemken P, et al. Expression and distribution of renal vacuolar proton-translocating adenosine triphosphatase in response to chronic acid and alkali loads in the rat. J Clin Invest. 1991;88:126–136. doi: 10.1172/JCI115268. [DOI] [PMC free article] [PubMed] [Google Scholar]
- 32.Verlander JW, Madsen KM, Cannon JK, et al. Activation of acid-secreting intercalated cells in rabbit collecting duct with ammonium chloride loading. Am J Physiol. 1994;266:F633–F645. doi: 10.1152/ajprenal.1994.266.4.F633. [DOI] [PubMed] [Google Scholar]
- 33.McKinney TD, Burg MB. Bicarbonate transport by rabbit cortical collecting tubules. J Clin Invest. 1977;60:766–768. doi: 10.1172/JCI108830. [DOI] [PMC free article] [PubMed] [Google Scholar]
- 34.Schwaderer AL, Vijayakumar S, Al-Awqati Q, et al. Galectin-3 expression is induced in renal beta-intercalated cells during metabolic acidosis. Am J Physiol Renal Physiol. 2006;290:F148–F158. doi: 10.1152/ajprenal.00244.2005. [DOI] [PubMed] [Google Scholar]
- 35.McLean IW, Nakane PK. Periodate-lysine-paraformaldehyde fixative. A new fixation for immunoelectron microscopy. J Histochem Cytochem. 1974;22:1077–1083. doi: 10.1177/22.12.1077. [DOI] [PubMed] [Google Scholar]
- 36.Grassl SM, Aronson PS. Co-transport in basolateral membrane vesicles isolated from rabbit renal cortex. J Biol Chem. 1986;261:8778–8783. [PubMed] [Google Scholar]
- 37.Knauf F, Yang CL, Thomson RB, et al. Identification of a chloride-formate exchanger expressed on the brush border membrane of renal proximal tubule cells. Proc Natl Acad Sci USA. 2001;98:9425–9430. doi: 10.1073/pnas.141241098. [DOI] [PMC free article] [PubMed] [Google Scholar]
- 38.Tsuruoka S, Swenson ER, Petrovic S, et al. Role of basolateral carbonic anhydrase in proximal tubular fluid and bicarbonate absorption. Am J Physiol. 2001;280:F146–F154. doi: 10.1152/ajprenal.2001.280.1.F146. [DOI] [PubMed] [Google Scholar]
- 39.Zhelyaskov VR, Liu SY, Broderick MP. Analysis of nanoliter samples of electrolytes using a flow-through microfluorometer. Kidney Int. 2000;57:1764–1769. doi: 10.1046/j.1523-1755.2000.00022.x. [DOI] [PubMed] [Google Scholar]
- 40.Hamm LL, Hering-Smith KS, Vehaskari VM. Control of bicarbonate transport in collecting tubules from normal and remnant kidneys. Am J Physiol. 1989;256:F680–F687. doi: 10.1152/ajprenal.1989.256.4.F680. [DOI] [PubMed] [Google Scholar]
- 41.Garcia-Austt J, Good DW, Burg MB, et al. Deoxycorticosterone-stimulated bicarbonate secretion in rabbit cortical collecting ducts: effects of luminal chloride removal and in vivo acid loading. Am J Physiol. 1985;249:F205–F212. doi: 10.1152/ajprenal.1985.249.2.F205. [DOI] [PubMed] [Google Scholar]
- 42.Star RA, Burg MB, Knepper MA. Bicarbonate secretion and chloride absorption by rabbit cortical collecting ducts. Role of chloride/ bicarbonate exchange. J Clin Invest. 1985;76:1123–1130. doi: 10.1172/JCI112067. [DOI] [PMC free article] [PubMed] [Google Scholar]