

Abstract
Background
Rice plants infected by Rice stripe virus (RSV) usually leads to chlorosis and death of newly emerged leaves. However, the mechanism of RSV-induced these symptoms was not clear.
Methods
We used an iTRAQ approach for a quantitative proteomics comparison of non-infected and infected rice leaves. RT-qPCR and Northern blot analyses were performed for assessing the transcription of candidate genes.
Results
As a whole, 681 (65.8 % downregulated, 34.2 % upregulated infected vs. non-infected) differentially accumulated proteins were identified. A bioinformatics analysis indicated that ten of these regulated proteins are involved in chlorophyll biosynthesis and three in cell death processes. Subsequent RT-qPCR results showed that downregulation of magnesium chelatase was due to reduced expression levels of the genes encoding subunits CHLI and CHLD, which resulted in chlorophyll reduction involved in leaf chlorosis. Three aspartic proteases expressed higher in RSV-infected leaves than those in the control leaves, which were also implicated in RSV-induced cell death. Northern blot analyses of CHLI and p0026h03.19 confirmed the RT-qPCR results.
Conclusions
The magnesium chelatase and aspartic proteases may be associated with RSV-induced leaf chlorosis and cell death, respectively. The findings may yield new insights into mechanisms underlying rice stripe disease symptom formation.
Electronic supplementary material
The online version of this article (doi:10.1186/s12985-015-0328-y) contains supplementary material, which is available to authorized users.
Keywords: Rice, Proteome, iTRAQ, Magnesium chelatase, Peptidase, Plant defense
Background
Rice stripe virus (RSV), a member of the genus Tenuivirus, is one of the most economically important viruses in eastern Asia including China, Korea, and Japan [1]. In 1964, RSV was reported for the first time in Zhejiang Province [2] and then spread to 18 provinces in rice-growing areas of China [3]. From 2000 to 2005, 1,700,000 ha of rice fields were affected by this virus in Jiangsu Province, including 1,000,000 ha area where incidence was so severe that yield losses exceeded 50 %, and in some places no rice was harvested [4].
RSV is transmitted predominantly in a persistent propagative manner by the small brown planthopper (SBPH; Laodelphax striatellus Fallen) [5] and can be transmitted transovarially for more than 40 generations [6]. RSV has four single-stranded RNA segments, named RNA 1, 2, 3 and 4 in order of their molecular weight. Among these, RNA 3 encodes a nucleocapsid protein (NCP) from the viral complementary RNA [7], while RNA 4 encodes a disease specific protein (SP) from the viral RNA [8]. RSV-induced symptoms of rice typically are chlorotic stripes and mottlings on the leaves. Newly emerged leaves exhibit yellow stripes or necrosis, then folding and twisting; plants are stunted and finally dead [1].
Leaf chlorosis in general is widely accepted as a sign of reduction in chlorophyll [9, 10], and leaf chlorosis upon virus infection is also related to decreased chlorophyll [11]. Subsequent studies have shown that various molecular mechanisms are involved in leaf chlorosis during virus infection. For example, during Cucumber mosaic virus (CMV) infection, the expression of the genes encoding magnesium chelatase is regulated by CMV satellite RNA, thus blocking chlorophyll biosynthesis [12, 13]. In addition, chlorotic symptoms induced by African cassava mosaic virus (ACMV) are linked to the expression level of chlorophyll-related genes encoding proteins such as chlorophyllide a and chlorophyllide b [14]. However, the chlorosis on tobacco leaves during the flavum strain of Tobacco mosaic virus (TMV) infection not resulted from the reduction of chlorophyll biosynthesis, but was reduction of the core complexes of photosystem II and the oxygen evolving complex [15]. In a recent report, RSV SP interacted with PsbP (an oxygen-evolving complex protein) resulting in the downregulation of PsbP in chloroplasts, and then modulating RSV symptoms through disruption of chloroplast structure and function [16]. Whether other chlorophyll relation proteins are modulated during RSV infection has not been known.
In addition, if the cultivar is susceptible to RSV infection, newly emerged rice leaves usually exhibit necrosis [1]. Previous report indicated that a vacuolar processing enzyme that has caspase protease activity was indispensable for the TMV-induced hypersensitive response, which involves programmed cell death in tobacco [17]. Even in an uninfected healthy plant, the expression of aspartic proteases induces programmed cell death, and then involves in senescence [18]. Nevertheless, we still need to elucidate how the expression of aspartic proteases is regulated after RSV infection. Therefore, the key rice protein(s) involved in RSV-induced disease symptom formation require(s) further exploration.
Some techniques have been shown as powerful tools for understanding plant-pathogen interactions, including yeast two-hybrid system [19–21], glutathione-S transferase pull-down assay [22, 23], immunofluorescence laser scanning confocal microscopy [24, 25], 2D gel-based technology [26, 27], and iTRAQ (isobaric tag for relative and absolute quantitation) LC-MS/MS (liquid chromatography tandem mass spectrometry) technology [28]. iTRAQ LC-MS/MS technology adopted stable isotope labeling strategies of proteins or peptides for measurement and allowed relative quantitation comparison using an internal reference, and could simultaneously label and accurately quantify proteins from multiple samples [29, 30]. In this study, by using an iTRAQ-based quantitative proteomics approach, we analyzed protein accumulation profiles of RSV-infected leaves in comparison with healthy leaves to explore symptom formation and to understand rice-RSV interactions.
Results
Symptom formation and RT-PCR confirmation of infection
There were 10 viruliferous SBPH allowed to feed on each plant of cv. Aichiasahi for 2-day inoculation access period. Newly emerged leaves on the initially inoculated plant developed pale-yellow stripes, which then collapsed in the form of blotches at 21 days post inoculation (dpi) (Fig. 1a). At 23 dpi, severe necrosis resulted in plant death (Fig. 1b). No disease symptoms were observed on mock plants. Samples of RSV-infected plants and control plants that were collected at 21 dpi to confirm infection by RT-PCR yielded an expected 969-bp fragment that was also found in a previously confirmed-positive sample (Fig. 1c). The 969-bp fragment was not present in the mock control or no-template control (NTC).
Fig. 1.
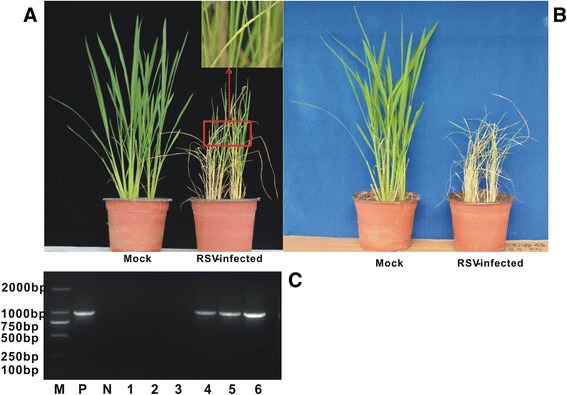
Typical chlorotic stripes and necrosis symptoms in rice plants induced by Rice stripe virus (RSV) and infection confirmation by RT-PCR detection. Both RSV-infected and mock rice plants were shown at (a) 21 days post inoculation (dpi) and (b) 23 dpi; (c) RT-PCR confirming that 969-bp fragment for RSV nucleocapsid gene (NCP) was absent in mock and present in symptomatic RSV-infected plants. Mock rice had typical healthy growth, but RSV-infected leaves showed typical chlorosis at 21 dpi (corner of panel a), and the entire plant was dead at 23 dpi (b). M, DL2000 DNA marker; P, RSV infected sample as positive control; N, healthy sample as negative control; 1-3, mock leaves; 4-6, RSV-infected leaves
Protein identification and quantification
When the iTRAQ approach was used to analyze proteins obtained from RSV-infected leaves and mock leaves which were collected at 21 dpi, 128,144 spectra were totally obtained from an ABI-5600 system and then approximately 59,824 MS spectra identified matched known spectra. Overall, 3687 different proteins were identified when a false discovery rate (FDR) <1 % was applied to the dataset (Fig. 2). A total of 681 proteins were differentially accumulated, with a fold-change >1.5 (P < 0.05); 448 were downregulated, and 223 had a fold-change <0.67 (P < 0.05) (Table 1).
Fig. 2.
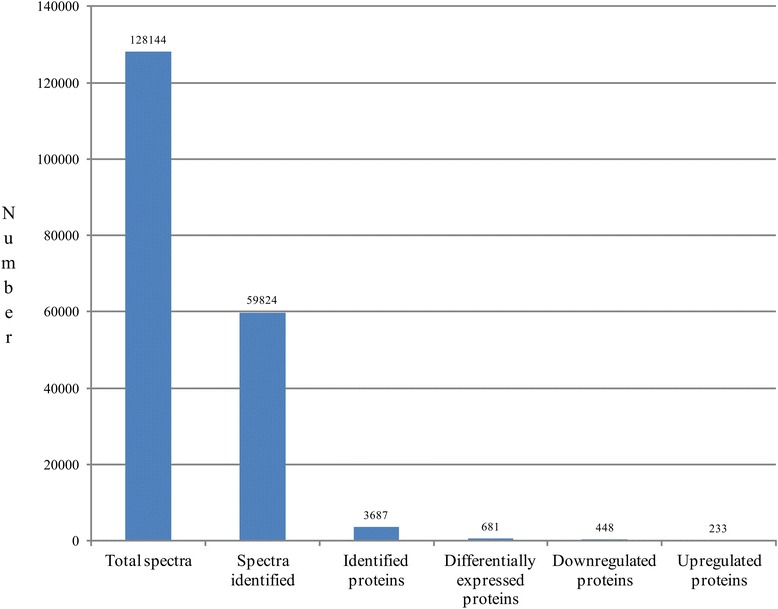
Statistics for total spectra for reversed-phase HPLC and LC-MS/MS, identified proteins and differentially accumulated proteins from iTRAQ proteomics by searching and analysis of NCBI database. Spectra scan ranged from 350 to 1800 m / z. Number refer to statistics of different parts: total spectra were generated from the iTRAQ experiment using the materials (RSV-infected and mock leaves); spectra identified matched known spectra; proteins identified analyses were determined by spectra identified upon the NCBI database; differentially accumulated proteins analysis based on the fold-change >1.5 or <0.667 (P < 0.05); downregulation proteins with fold-change >1.5 (P < 0.05); upregulation proteins with fold-change <0.667 (P < 0.05)
Table 1.
Summary of the proteins identified by iTRAQ as being differentially accumulated in RSV-inoculated plants compared with mock-inoculated rice plants at 21dpi
| Regulation | No. of proteins | David | GOa | Categoriesb | Percentagec | No. of functional groups |
|---|---|---|---|---|---|---|
| Down | 448 (65.8 %) | 332 | 317 | 203 BP | 61.1 | 53 |
| 154 CC | 46.4 | 20 | ||||
| 233 MF | 70.2 | 33 | ||||
| 129 KEGG | 38.9 | 16 | ||||
| unknown 116 | ||||||
| Up | 233 (34.2 %) | 178 | 175 | 112-BP | 62.9 | 17 |
| 64 CC | 36.0 | 13 | ||||
| 125 MF | 70.2 | 16 | ||||
| 7 -KEGG | 39.9 | 13 | ||||
| unknown 55 | ||||||
| Total | 681 |
Note: Using the David platform, 332 downregulated and 178 upregulated proteins were analyzed, and 317 and 175 proteins were annotated by GO, respectively. Annotated proteins were clustered by groups based on the BP, CC, MF and KEGG analyses
aGO annotation: BP, biological process; CC, cellular component; MF, molecular function
bCategories based on BP, CC, MF and KEGG
cPercentage of total proteins annotated
Bioinformatics analysis
The identified and quantified proteins were then analyzed for function, pathway and interaction network. In the GO analysis, 358 proteins were involved in molecular function, 233 (70.2 %, 35 functional groups) were downregulated and 125 (70.2 %, 16 functional groups) were upregulated (Table 1, Additional file 1: Table S1). The molecular function of downregulated proteins was mainly in cofactor binding (14.2 %), electron carrier activity (10.7 %), coenzyme binding (10.3 %), calcium ion binding (6.0 %), antioxidant activity (5.6 %), magnesium ion binding (4.7 %), peroxidase activity (3.9 %), vitamin B6 binding (3.4 %), FAD (flavin adenine dinucleotide) binding (3.4 %), and primary active transmembrane transporter activity (3.0 %) (Fig. 3a, Additional file 1: Table S1). Upregulated proteins were involved in cofactor binding (15.2 %), peptidase activity (13.6 %), coenzyme binding (12.0 %), electron carrier activity (12.0 %), endopeptidase activity (8.8 %), threonine-type peptidase activity (5.6 %), antioxidant activity (5.6 %), unfolded protein binding (4.8 %), FAD binding (4.8 %), and disulfide oxidoreductase activity (4.0 %) (Fig. 3b, Additional file 1: Table S1). Peptidase activity, the largest group within the catalytic activity group, comprised metallopeptidase activity, aspartic-type endopeptidase, cysteine-type peptidase activity, serine-type peptidase activity. Biological process was influenced by 315 proteins, 203 (61.1 %, 53 functional groups) downregulated proteins which mostly were involved in oxidation reduction (23.2 %), nitrogen compound biosynthesis (16.3 %), photosynthesis (12.3 %), generation of precursor metabolites and energy (11.8 %), cofactor metabolism (10.8 %), translation (9.9 %), monosaccharide metabolism (9.4 %), hexose metabolism (8.4 %), carboxylic acid biosynthesis (8.4 %), glucose metabolism (7.9 %) (Fig. 3a, Additional file 1: Table S1). The other 112 (62.9 %, 17 groups) upregulated proteins were mostly involved in oxidation reduction (25.0 %), proteolysis (17.0 %), generation of precursor metabolites and energy (12.5 %), macromolecule catabolism (11.6 %), protein catabolism (10.7 %), cellular protein catabolism (8.9 %), cofactor metabolism (8.0 %), cellular homeostasis (8.0 %), protein folding (6.3 %), and carbohydrate catabolism (6.3 %) (Fig. 3b, Additional file 1: Table S1). Cellular components that were downregulated included 154 proteins (46.4 %, 20 component groups), located in the plastid (70.8 %), chloroplast (31.8 %), thylakoid (12.3 %), photosynthetic membrane (9.1 %), organellar membrane (9.1 %), thylakoid part (7.8 %), plastid part (7.8 %), photosystem (6.5 %), chloroplast part (5.2 %), extrinsic to membrane (5.2 %), and oxygen evolving complex (4.5 %) (Fig. 3a, Additional file 1: Table S1). The 64 (36.0 %, 13 component groups) upregulated proteins were located in the cytosol (17.2 %), proteasome complex (15.6 %), organelle membrane (12.5 %), proteasome core complex (10.9 %), endoplasmic reticulum (9.4 %), Golgi apparatus (9.4 %), envelope (7.8 %), mitochondrial membrane (6.3 %), ribosomal subunit (4.7 %), membrane coat (4.7 %), and cell junction (3.1 %) (Fig. 3b, Additional file 1: Table S1).
Fig. 3.
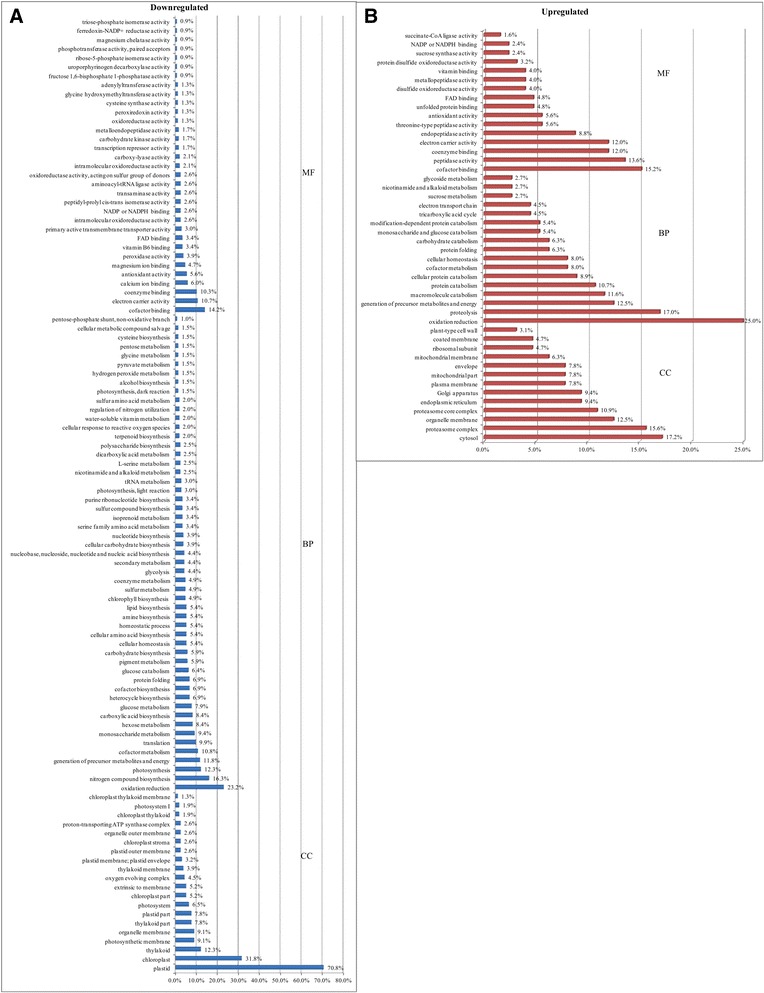
Gene Ontology enrichment analysis of differentially accumulated proteins from RSV-infected leaves compared with mock leaves. a Downregulated differentially accumulated proteins were annotated among 33 groups for molecular function (MF), 53 for biological process (BP) and 20 for cellular components (CC), respectively; b, Functional grouping of upregulated differentially accumulated proteins: 16 for MF, 17 for BP and 13 for CC
The KEGG pathway analyses indicated that among the downregulated proteins, 13 % were involved in the biosynthesis of plant hormones; 9 % in photosynthesis, carbon fixation in photosynthetic organisms, biosynthesis of terpenoids and steroid; and 4 % in porphyrin and chlorophyll metabolism (Fig. 4a). However, among the upregulated proteins, 16 % were involved in biosynthesis of plant hormones, 11 % in biosynthesis of alkaloids derived from shikimate pathway, 10 % in biosynthesis of phenylpropanoids, and 9 % in proteasome, starch and sucrose metabolism, citrate cycle, tryptophan metabolism, fatty acid metabolism, propanoate metabolism, and pentose and glucuronate interconversions (Fig. 4b). When the identified proteins were analyzed with the STRING software, the results showed that 547 proteins were interacting with each other. In the constructed interaction network (Additional file 2: Figure S1), the proteins were roughly divided into three groups: metabolism (B), chloroplast (C) and defense (D).
Fig. 4.
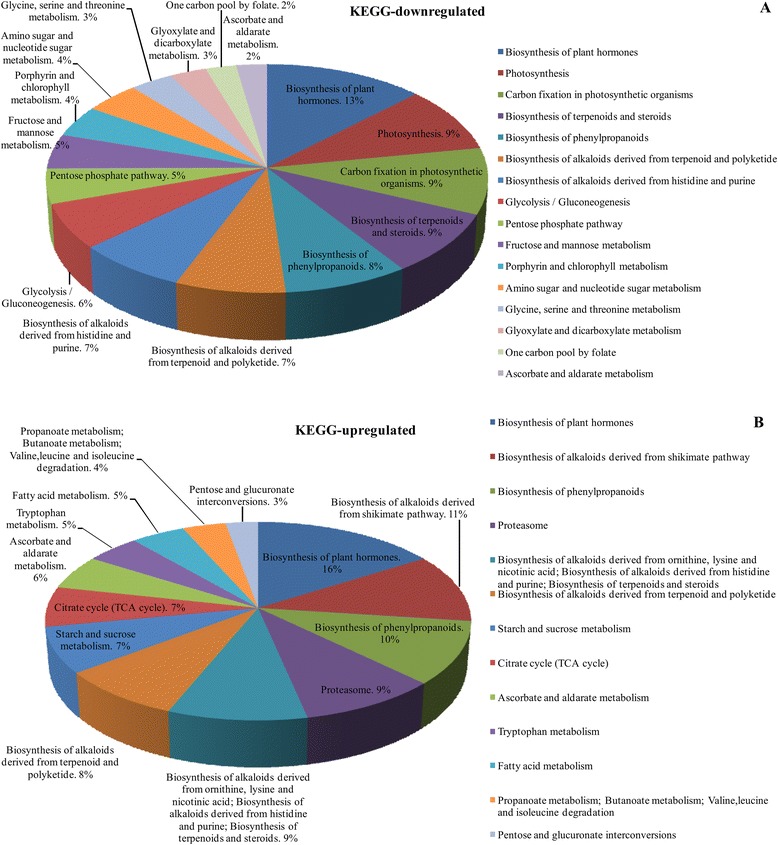
Kyoto Encyclopedia of Genes and Genomes (KEGG) pathways of differentially accumulated proteins that are identified from mock leaves and RSV-infected leaves for (a) downregulated and (b) upregulated. a downregulated proteins were annotated and participated in 16 pathways; (b) upregulated proteins were classified 13 pathways
Proteins differentially accumulated in response to RSV infection
Metabolism group
Functions of the down- and up-regulated differentially accumulated metabolism group of proteins included monosaccharide metabolism, disaccharide metabolism, polysaccharide metabolism, generation of precursor metabolites and energy, amino acid metabolism, fatty acid metabolism, phosphorus metabolism, and sulfur metabolism. Basically, carbohydrate metabolism provided more suitable source of energy and carbon for plant development. For example, glyceraldehyde-3-phosphate dehydrogenase (GAPDH; 115458768, 115450493) and fructose-bisphosphate aldolase (115484401, 115468886, 115434198) were two important metabolic enzymes in glycolysis and gluconeogenesis [31]. Notable, evidences increasingly support the nonglycolytic functions of GAPDH, including apoptosis, DNA and RNA replication, DNA repair, RNA exportation, RNA synthesis, immunity response to various pathogens [32–38]. GAPDH strong binding of negative strand Tomato bushy stunt virus (TBSV) was key regulatory step to promote asymmetric RNA synthesis, so GAPDH played a role in viral RNA replication and RNA synthesis [34]. However, GAPDH preferentially binds positive strand Bamboo mosaic virus (BaMV), and it negatively regulated the accumulation of BaMV [35]. Additionally, GAPDH negatively regulate autophagy interaction with host protein and immunity-associated cell death and defense on TMV infection [38]. GAPDH may be involved in viral replication and defense during RSV infection. Proteins that decreased in expression belonged to the vitamin, nucleotide, isoprenoid, phosphorus, sulfur and cofactor metabolism groups, suggesting that RSV infection inhibited their expression (Table 2). Thus, numerous biological processes helped rice to counteract RSV invasion.
Table 2.
Differentially accumulated proteins between mock-inoculated leaves and RSV-infected leaves
| Accession number | Protein name categorized by process | Cov (95) | Number of Matching Peptides | Ratio | P-Value |
|---|---|---|---|---|---|
| Chlorophyll biosynthetic process | |||||
| 115453785 | Magnesium-chelatase subunit ChlI, chloroplastic | 46.7 | 29 | 17.5 | 4.50 × 10⁻⁸ |
| 115438661 | Uroporphyrinogen decarboxylase 1, chloroplastic | 14.9 | 8 | 13.4 | 2.85 × 10⁻² |
| 115444475 | Porphobilinogen deaminase, chloroplastic | 51.1 | 21 | 11.7 | 4.50 × 10⁻⁴ |
| 115456135 | Magnesium-chelatase subunit ChlD, chloroplastic | 27.8 | 23 | 9.4 | 5.19 × 10⁻⁷ |
| 115477483 | Glutamate-1-semialdehyde 2,1-aminomutase, chloroplastic | 34.7 | 26 | 5.3 | 2.85 × 10⁻² |
| 115452897 | Uroporphyrinogen decarboxylase 2, chloroplastic | 36.4 | 21 | 5.0 | 1.83 × 10⁻² |
| 115436038 | Protoporphyrinogen oxidase, chloroplastic | 21.3 | 12 | 4.8 | 3.07 × 10⁻⁴ |
| 115435974 | Magnesium-protoporphyrin IX monomethyl ester [oxidative] cyclase | 42.2 | 25 | 3.7 | 1.16 × 10⁻⁵ |
| 115469822 | Delta-aminolevulinic acid dehydratase, chloroplastic | 29.1 | 16 | 3.5 | 4.11 × 10⁻⁴ |
| 115482796 | Glutamyl-tRNA reductase, chloroplastic | 16.4 | 9 | 3.4 | 1.34 × 10⁻³ |
| Photosynthesis | |||||
| 109156602 | Ribulose bisphosphate carboxylase large chain | 82.2 | 508 | 44.1 | 1.71 × 10⁻⁵ |
| 115472625 | Oxygen-evolving enhancer protein 3 | 41.5 | 57 | 31.9 | 3.46 × 10⁻⁵ |
| 115436780 | Putative 33 kDa oxygen evolving protein of photosystem II | 59.2 | 119 | 28.3 | 2.30 × 10⁻¹⁰ |
| 115470529 | Probable photosystem II oxygen-evolving complex protein 2 | 58.3 | 62 | 21.1 | 8.92 × 10⁻⁴ |
| 115488344 | Photosystem I reaction center subunit XI, chloroplast | 30.8 | 13 | 19.1 | 3.57 × 10⁻² |
| 115472753 | Chlorophyll a/b-binding protein | 49.0 | 39 | 18.7 | 8.07 × 10⁻⁴ |
| 115477831 | Chloroplast photosystem I reaction center subunit II-like protein | 59.1 | 50 | 18.4 | 3.46 × 10⁻⁷ |
| 115476576 | Putative chlorophyll a/b-binding protein | 36.5 | 27 | 14.5 | 2.05 × 10⁻² |
| 115458738 | OSJNBa0036B21.6 protein | 38.5 | 19 | 13.7 | 2.74 × 10⁻⁴ |
| 115484899 | Chlorophyll a/b-binding protein | 63.2 | 67 | 13.3 | 1.17 × 10⁻⁵ |
| 115470199 | PsbQ domain protein family, putative-like protein | 28.4 | 11 | 10.9 | 1.53 × 10⁻³ |
| 115472785 | Putative chlorophyll a/b-binding protein of LHCII type III, chloroplast | 50.4 | 20 | 10.4 | 4.90 × 10⁻³ |
| 115446893 | Putative Oxygen-evolving enhancer protein 3-2, chloroplast | 26.2 | 6 | 10.1 | 2.74 × 10⁻² |
| 115487694 | Photosystem I reaction centre subunit N, chloroplast | 28.2 | 8 | 10.0 | 2.12 × 10⁻² |
| 115450991 | Ribulose-phosphate 3-epimerase, chloroplastic | 50.0 | 28 | 7.8 | 8.74 × 10⁻⁴ |
| 115467828 | Chlorophyll a/b-binding protein | 31.1 | 27 | 7.8 | 6.31 × 10⁻³ |
| 115452127 | Fructose-1,6-bisphosphatase, chloroplastic | 38.9 | 45 | 6.8 | 5.54 × 10⁻⁶ |
| 115482366 | PsbP family protein | 18.1 | 16 | 5.6 | 1.14 × 10⁻³ |
| 115465942 | Ferredoxin--NADP reductase, leaf isozyme, chloroplastic | 49.7 | 66 | 5.4 | 5.64 × 10⁻³ |
| 115447507 | Putative ferredoxin-thioredoxin reductase | 20.1 | 4 | 2.5 | 2.91 × 10⁻² |
| Defense response | |||||
| 115458852 | Bet v I allergen family protein | 29.9 | 5 | 0.3 | 1.89 × 10⁻³ |
| 115452513 | Pathogenesis-related protein 1 | 49.4 | 7 | 0.1 | 7.92 × 10⁻⁴ |
| 115489022 | Pathogenesis-related protein | 29.8 | 5 | 0.04 | 9.16 × 10⁻⁴ |
| 115489014 | Pathogenesis-related protein PR10 | 25.6 | 4 | 0.03 | 1.88 × 10⁻² |
| Proteolysis | |||||
| 115470052 | ATP-dependent zinc metalloprotease FTSH 1, chloroplastic | 42.6 | 50 | 9.9 | 3.31 × 10⁻⁸ |
| 115453893 | Membrane-associated zinc metalloprotease family protein | 17.6 | 7 | 7.7 | 8.99 × 10⁻⁴ |
| 115489316 | Eukaryotic aspartyl protease family protein | 25.1 | 10 | 6.8 | 1.04 × 10⁻² |
| 115447609 | ATP-dependent zinc metalloprotease FTSH 7, chloroplastic | 4.3 | 4 | 6.5 | 3.77 × 10⁻² |
| 115480844 | Serine carboxypeptidase family protein | 13.3 | 8 | 5.6 | 3.69 × 10⁻² |
| 115435898 | ATP-dependent Clp protease proteolytic subunit | 18.5 | 4 | 3.5 | 2.12 × 10⁻² |
| 115450022 | Oligopeptidase A-like | 24.2 | 20 | 3.2 | 1.35 × 10⁻⁴ |
| 115452585 | Probable glutamyl endopeptidase, chloroplastic | 15.0 | 18 | 2.9 | 6.00 × 10⁻³ |
| 115488046 | Serine carboxypeptidase 1 | 11.2 | 4 | 2.7 | 4.20 × 10⁻² |
| 115444859 | Peptidase aspartic | 24.1 | 10 | 0.5 | 4.99 × 10⁻² |
| 115437452 | Ubiquitin carboxyl-terminal hydrolase | 16.2 | 7 | 0.4 | 3.60 × 10⁻² |
| 115482252 | Ubiquitin-conjugating enzyme E2-23 kDa | 20.1 | 3 | 0.4 | 1.14 × 10⁻² |
| 115483755 | Ubiquitin-activating enzyme E1 2 | 22.6 | 25 | 0.4 | 3.41 × 10⁻³ |
| 115463349 | Putative DNA-binding protein GBP16 | 26.0 | 15 | 0.4 | 1.26 × 10⁻² |
| 115454751 | Proteasome subunit beta type-2 | 30.2 | 9 | 0.4 | 2.65 × 10⁻² |
| 115465685 | Putative serine carboxypeptidase | 24.9 | 12 | 0.4 | 4.19 × 10⁻³ |
| 115451123 | Proteasome subunit alpha type-6 | 43.1 | 13 | 0.3 | 1.22 × 10⁻³ |
| 115456219 | Leukotriene A-4 hydrolase homolog | 20.8 | 12 | 0.3 | 6.69 × 10⁻³ |
| 115480143 | Proteasome subunit beta type | 36.3 | 7 | 0.3 | 1.63 × 10⁻² |
| 115444057 | Proteasome subunit alpha type-1 | 40.0 | 13 | 0.3 | 1.08 × 10⁻² |
| 115440299 | Putative insulin degrading enzyme | 3.0 | 2 | 0.3 | 2.91 × 10⁻² |
| 115440617 | Proteasome subunit alpha type-3 | 39.4 | 10 | 0.3 | 4.04 × 10⁻² |
| 115480019 | Proteasome subunit beta type-1 | 28.1 | 6 | 0.2 | 7.50 × 10⁻³ |
| 115448935 | Proteasome subunit beta type | 40.7 | 12 | 0.2 | 6.34 × 10⁻⁴ |
| 115476300 | Aminopeptidase M1-B | 22.7 | 19 | 0.2 | 8.85 × 10⁻⁵ |
| 115461973 | Aspartic proteinase | 23.8 | 11 | 0.2 | 3.50 × 10⁻³ |
| 115445047 | Aminopeptidase M1-A | 18.8 | 17 | 0.2 | 1.04 × 10⁻⁵ |
| 115451209 | Eukaryotic aspartyl protease family protein | 11.4 | 4 | 0.2 | 2.37 × 10⁻³ |
| Protein transport | |||||
| 115475569 | Preprotein translocase subunit SECY, chloroplastic | 4.1 | 3 | 5.5 | 1.76 × 10⁻³ |
| 115454153 | SEC1 family transport protein SLY1 | 8.0 | 4 | 5.3 | 1.93 × 10⁻² |
| 115451815 | Translocase of chloroplast | 20.2 | 7 | 3.1 | 1.42 × 10⁻² |
| 115452177 | Protein TOC75, chloroplastic | 34.4 | 25 | 2.9 | 3.10 × 10⁻⁶ |
| 115435528 | Importin-alpha re-exporter | 5.5 | 2 | 0.5 | 7.40 × 10⁻⁴ |
| 115435714 | GTP-binding protein | 21.2 | 3 | 0.3 | 4.33 × 10⁻² |
| 115463933 | Putative GDP dissociation inhibitor | 30.8 | 16 | 0.3 | 3.53 × 10⁻⁵ |
| 115454911 | Coatomer subunit alpha-1 | 22.6 | 25 | 0.3 | 4.93 × 10⁻⁵ |
| 115461356 | Clathrin light chain 1 | 14.6 | 3 | 0.2 | 4.25 × 10⁻² |
| 115463119 | Coatomer subunit delta-1 | 11.5 | 7 | 0.2 | 1.90 × 10⁻³ |
| Translation | |||||
| 115480611 | Cysteinyl-tRNA synthetase | 11.8 | 6 | 8.7 | 1.93 × 10⁻³ |
| 115450395 | 50S ribosomal protein L11, chloroplast | 38.1 | 13 | 7.2 | 2.71 × 10⁻² |
| 115488938 | Elongation factor Ts | 25.6 | 45 | 6.7 | 1.06 × 10⁻⁹ |
| 115436768 | Tyrosine--tRNA ligase | 22.3 | 12 | 6.6 | 3.46 × 10⁻³ |
| 115472897 | Ribosome-recycling factor, chloroplastic | 31.2 | 17 | 6.6 | 1.13 × 10⁻³ |
| 115449027 | Putative isoleucyl-tRNA synthetase | 8.2 | 8 | 6.3 | 1.95 × 10⁻⁶ |
| 115470767 | Probable polyribonucleotide nucleotidyltransferase 1, chloroplastic | 9.6 | 10 | 6.1 | 4.16 × 10⁻⁴ |
| 115445399 | Putative 50S ribosomal protein L21, chloroplast | 25.7 | 7 | 5.8 | 1.12 × 10⁻² |
| 115489150 | 60S ribosomal protein L2 | 30.6 | 11 | 4.8 | 6.71 × 10⁻³ |
| 115486501 | Peptide chain release factor 1 | 17.8 | 7 | 4.7 | 4.88 × 10⁻⁴ |
| 50233964 | 30S ribosomal protein S2, chloroplastic | 25.9 | 10 | 4.5 | 8.95 × 10⁻⁴ |
| 115438779 | Peptide deformylase 1B, chloroplastic | 16.4 | 5 | 4.1 | 4.50 × 10⁻² |
| 115458788 | OSJNBa0072F16.12 protein | 21.3 | 5 | 3.9 | 4.05 × 10⁻² |
| 115450427 | 50S ribosomal protein L5, chloroplastic | 42.6 | 17 | 3.9 | 1.43 × 10⁻³ |
| 115448755 | Putative histidine-tRNA ligase | 6.6 | 4 | 3.8 | 4.60 × 10⁻² |
| 115451609 | 50S ribosomal protein L15, chloroplast | 29.7 | 11 | 3.5 | 3.81 × 10⁻² |
| 115446545 | Putative threonyl-tRNA synthetase | 14.1 | 9 | 2.9 | 1.25 × 10⁻⁶ |
| 115439267 | Met-tRNAi formyl transferase-like | 20.7 | 6 | 2.8 | 2.49 × 10⁻³ |
| 115465593 | Translation initiation factor IF-2 | 14.3 | 7 | 2.5 | 4.04 × 10⁻² |
| 115463659 | Putative chloroplast ribosomal protein L1 | 30.6 | 24 | 2.4 | 1.55 × 10⁻³ |
| 115487526 | 60S ribosomal protein L3 | 29.3 | 17 | 2.1 | 1.93 × 10⁻² |
| 115447385 | Lysine--tRNA ligase | 14.5 | 9 | 1.5 | 4.36 × 10⁻² |
| 115488928 | Tryptophanyl-tRNA synthetase | 21.8 | 7 | 0.5 | 4.03 × 10⁻² |
| 115453877 | 40S ribosomal protein S3 | 44.7 | 14 | 0.5 | 2.32 × 10⁻³ |
| 115487104 | 40S ribosomal protein S16 | 27.5 | 6 | 0.4 | 1.16 × 10⁻² |
| 115434960 | Putative tRNA-glutamine synthetase | 11.2 | 8 | 0.3 | 7.99 × 10⁻³ |
| 115473889 | Elongation factor 1-beta | 39.7 | 21 | 0.3 | 1.27 × 10⁻² |
| 115486179 | 40S ribosomal protein S9 | 26.2 | 6 | 0.3 | 2.61 × 10⁻³ |
| 115475427 | Putative 60S ribosomal protein L7 | 22.5 | 9 | 0.2 | 2.22 × 10⁻² |
| Protein folding | |||||
| 115444001 | Putative uncharacterized protein P0576F08.31 | 16.7 | 6 | 22.9 | 1.64 × 10⁻⁴ |
| 115458444 | GrpE protein homolog | 26.6 | 9 | 18.2 | 1.12 × 10⁻² |
| 115476198 | Putative peptidyl-prolyl cis-trans isomerase, chloroplast | 34.3 | 21 | 14.9 | 5.61 × 10⁻⁵ |
| 115449059 | Putative 20 kDa chaperonin, chloroplast | 46.3 | 9 | 8.2 | 1.49 × 10⁻² |
| 115461585 | Peptidyl-prolyl cis-trans isomerase | 39.2 | 23 | 7.7 | 3.33 × 10⁻³ |
| 115460872 | OSJNBb0079B02.1 protein | 4.6 | 3 | 6.1 | 2.96 × 10⁻² |
| 115467746 | Trigger factor-like | 39.5 | 27 | 4.8 | 1.77 × 10⁻⁴ |
| 115472829 | Putative peptidyl-proly cis-trans isomerase protein | 29.2 | 20 | 4.7 | 5.14 × 10⁻⁵ |
| 115448437 | Putative protease IV | 14.5 | 10 | 4.7 | 6.37 × 10⁻³ |
| 115472151 | Peptidyl-prolyl cis-trans isomerase | 23.3 | 5 | 4.6 | 4.48 × 10⁻² |
| 115488160 | 60 kDa chaperonin alpha subunit | 55.5 | 64 | 3.8 | 5.70 × 10⁻⁵ |
| 115473507 | Receptor protein kinase | 11.7 | 8 | 3.8 | 1.55 × 10⁻² |
| 115466004 | Putative chaperonin 60 beta | 48.2 | 63 | 3.7 | 1.65 × 10⁻³ |
| 115475740 | Putative uncharacterized protein OSJNBb0075O18.114 | 23.2 | 6 | 3.6 | 6.47 × 10⁻³ |
| 115465267 | Serine/threonine-protein kinase SNT7 | 13.6 | 8 | 3.4 | 1.46 × 10⁻² |
| 115448713 | Peptidyl-prolyl cis-trans isomerase | 34.3 | 11 | 3.1 | 8.95 × 10⁻⁴ |
| 115484731 | ABC-1 domain containing protein | 9.0 | 7 | 2.9 | 1.57 × 10⁻² |
| 115441683 | ABC1-like | 5.3 | 3 | 2.8 | 4.11 × 10⁻² |
| 115477014 | Putative heat-shock protein | 21.0 | 17 | 2.5 | 1.11 × 10⁻² |
| 115463261 | Putative DnaJ protein | 25.3 | 14 | 2.5 | 4.82 × 10⁻³ |
| 115487998 | 70 kDa heat shock protein | 45.4 | 60 | 2.3 | 1.13 × 10⁻² |
| 115469982 | Endoplasmin homolog precursor | 26.7 | 28 | 0.5 | 1.62 × 10⁻² |
| 115456045 | T-complex protein 1, theta subunit | 34.1 | 17 | 0.4 | 1.77 × 10⁻² |
| 115462083 | Chaperonin protein | 19.4 | 11 | 0.3 | 3.37 × 10⁻² |
| 115471369 | Calreticulin | 19.8 | 9 | 0.2 | 1.11 × 10⁻² |
| 115477393 | Putative 70 kDa peptidylprolyl isomerase | 15.3 | 9 | 0.2 | 3.70 × 10⁻⁴ |
| 115468394 | T-complex protein 1 subunit gamma | 21.3 | 12 | 0.2 | 1.36 × 10⁻³ |
| 115458184 | Calnexin | 26.6 | 15 | 0.2 | 4.69 × 10⁻⁴ |
| Monosaccharide metabolism | |||||
| 115458768 | Glyceraldehyde-3-phosphate dehydrogenase | 63.4 | 120 | 22.5 | 1.98 × 10⁻⁴ |
| 115484401 | Fructose-bisphosphate aldolase, chloroplastic | 74.0 | 126 | 22.1 | 4.10 × 10⁻⁷ |
| 115468886 | Fructose-bisphosphate aldolase | 57.3 | 49 | 20.5 | 8.04 × 10⁻⁷ |
| 115455637 | Malate dehydrogenase | 67.0 | 35 | 12.6 | 8.32 × 10⁻⁴ |
| 115450493 | Glyceraldehyde-3-phosphate dehydrogenase | 57.2 | 91 | 7.7 | 2.32 × 10⁻⁵ |
| 115466256 | Putative enolase | 46.0 | 32 | 7.3 | 1.48 × 10⁻² |
| 115470849 | Putative ribose-5-phosphate isomerase | 52.5 | 32 | 5.6 | 1.19 × 10⁻² |
| 115477891 | PfkB type carbohydrate kinase protein family-like | 12.1 | 4 | 5.3 | 1.34 × 10⁻² |
| 115434516 | Triosephosphate isomerase, cytosolic | 69.2 | 29 | 5.0 | 4.75 × 10⁻² |
| 115462281 | Fructose-6-phosphate 2-kinase/fructose-2,6-bisphosphatase | 22.9 | 20 | 5.0 | 8.62 × 10⁻⁸ |
| 115479643 | Glucose-6-phosphate isomerase | 29.9 | 19 | 4.8 | 3.56 × 10⁻⁴ |
| 115457638 | OSJNBa0023J03.8 protein | 31.3 | 8 | 4.5 | 2.00 × 10⁻² |
| 115455133 | 4-hydroxy-3-methylbut-2-enyl diphosphate reductase, chloroplastic | 35.9 | 19 | 3.5 | 7.98 × 10⁻⁴ |
| 115437808 | Oxidoreductase-like | 24.3 | 8 | 2.3 | 3.35 × 10⁻² |
| 115464965 | Hexokinase-5 | 24.1 | 10 | 2.2 | 2.59 × 10⁻² |
| 115439869 | Hexokinase-6 | 27.1 | 14 | 2.1 | 1.22 × 10⁻² |
| 115452337 | L-ascorbate peroxidase 1, cytosolic | 49.2 | 29 | 0.4 | 9.02 × 10⁻³ |
| 115467370 | Putative pyrophosphate-dependent phosphofructokinase beta subunit | 31.2 | 17 | 0.4 | 9.90 × 10⁻³ |
| 115484175 | Pyruvate kinase | 31.3 | 23 | 0.3 | 2.35 × 10⁻² |
| 115465974 | 6-phosphogluconate dehydrogenase, decarboxylating 1 | 44.8 | 29 | 0.3 | 6.70 × 10⁻⁷ |
| 115434198 | Fructose-bisphosphate aldolase | 24.5 | 10 | 0.3 | 1.53 × 10⁻² |
| 115441963 | Putative transaldolase | 42.6 | 22 | 0.2 | 2.29 × 10⁻³ |
| 115473973 | Xylose isomerase | 34.5 | 17 | 0.2 | 1.06 × 10⁻⁵ |
| Disaccharide metabolism | |||||
| 115439937 | Putative trehalose-6-phosphate synthase/phosphatase | 5.0 | 5 | 4.1 | 2.00 × 10⁻² |
| 115452927 | Sucrose synthase 4 | 9.4 | 9 | 0.5 | 1.24 × 10⁻² |
| 115466896 | Sucrose synthase 2 | 36.1 | 32 | 0.4 | 1.10 × 10⁻³ |
| 115453437 | Sucrose synthase 1 | 43.3 | 36 | 0.1 | 2.55 × 10⁻⁵ |
| Polysaccharide metabolism | |||||
| 115471703 | Granule binding starch synthase II | 22.2 | 14 | 25.6 | 7.88 × 10⁻⁵ |
| 115474235 | Putative uncharacterized protein P0034A04.101-1 | 26.4 | 30 | 17.4 | 5.07 × 10⁻⁵ |
| 115451283 | Inositol-3-phosphate synthase | 23.7 | 11 | 9.2 | 4.04 × 10⁻⁵ |
| 115476014 | Glucose-1-phosphate adenylyltransferase small subunit, chloroplastic/amyloplastic | 36.1 | 23 | 6.4 | 7.94 × 10⁻³ |
| 115455167 | Glucose-1-phosphate adenylyltransferase | 42.7 | 30 | 4.4 | 4.71 × 10⁻⁸ |
| 115460666 | Soluble starch synthase III-1 | 11.5 | 16 | 3.8 | 3.09 × 10⁻² |
| 115461086 | Probable UDP-arabinopyranose mutase 2 | 10.7 | 4 | 0.3 | 1.00 × 10⁻² |
| 115470060 | 1,4-alpha-glucan-branching enzyme, chloroplastic/amyloplastic | 7.3 | 6 | 0.1 | 1.93 × 10⁻³ |
| 115454033 | UDP-arabinopyranose mutase 1 | 52.2 | 24 | 0.1 | 1.53 × 10⁻⁶ |
| 115459168 | Chitinase 4 | 11.8 | 3 | 0.1 | 1.53 × 10⁻² |
| Fatty acid metabolism | |||||
| 115444801 | Lipoxygenase | 16.3 | 12 | 17.1 | 4.99 × 10⁻⁶ |
| 115489048 | Lipoxygenase | 17.6 | 15 | 7.0 | 7.04 × 10⁻³ |
| 115441871 | Acyl-[acyl-carrier-protein] desaturase 2, chloroplastic | 11.5 | 4 | 4.6 | 1.66 × 10⁻² |
| 115436430 | Putative tetrafunctional protein of glyoxysomal fatty acid beta-oxidation | 17.3 | 13 | 0.3 | 2.76 × 10⁻⁴ |
| 115445513 | Peroxisomal fatty acid beta-oxidation multifunctional protein | 21.9 | 18 | 0.1 | 7.07 × 10⁻⁸ |
| Amino acid metabolism | |||||
| 115455221 | Serine hydroxymethyltransferase | 57.1 | 73 | 22.1 | 4.47 × 10⁻¹² |
| 115461066 | Glutamine synthetase, chloroplastic | 61.0 | 69 | 20.1 | 5.47 × 10⁻⁴ |
| 115460656 | Aminomethyltransferase | 57.1 | 51 | 19.8 | 4.34 × 10⁻⁵ |
| 115442595 | Cysteine synthase | 51.3 | 60 | 14.6 | 1.19 × 10⁻⁴ |
| 115439533 | Glycine dehydrogenase P protein | 60.8 | 157 | 12.8 | 1.08 × 10⁻⁴ |
| 115457070 | Cysteine synthase | 43.0 | 18 | 9.7 | 3.31 × 10⁻⁵ |
| 115478398 | Aspartate kinase-homoserine dehydrogenase | 10.9 | 11 | 5.8 | 2.85 × 10⁻³ |
| 115476972 | Putative 3-deoxy-D-arabino-heptulosonate 7-phosphate synthase | 23.6 | 12 | 5.2 | 2.76 × 10⁻⁴ |
| 115433966 | Os01g0101200 protein | 19.0 | 10 | 3.1 | 2.48 × 10⁻² |
| 115480417 | Putative dehydroquinate synthase | 37.9 | 20 | 2.8 | 7.39 × 10⁻³ |
| 115450561 | ATP phosphoribosyltransferase, chloroplastic | 22.8 | 10 | 2.7 | 1.57 × 10⁻² |
| 115448201 | Carbamoyl-phosphate synthase small chain, chloroplastic | 20.7 | 9 | 2.7 | 4.08 × 10⁻² |
| 115445929 | Probable diaminopimelate decarboxylase, chloroplastic | 30.4 | 14 | 2.5 | 2.14 × 10⁻³ |
| 115486343 | Phosphoserine phosphatase | 17.6 | 4 | 2.5 | 4.98 × 10⁻² |
| 115468570 | Cysteine synthase | 11.2 | 5 | 2.3 | 4.85 × 10⁻² |
| 115482324 | Glutamine synthetase family | 4.9 | 4 | 0.6 | 3.26 × 10⁻² |
| 115461214 | Methylthioribose kinase 1 | 14.2 | 6 | 0.4 | 4.30 × 10⁻² |
| 115449517 | Glutathione reductase, cytosolic | 20.8 | 9 | 0.4 | 2.44 × 10⁻² |
| 115456165 | Probable methylenetetrahydrofolate reductase | 36.4 | 24 | 0.4 | 9.95 × 10⁻⁶ |
| 115466226 | 3-phosphoshikimate 1-carboxyvinyltransferase | 22.7 | 12 | 0.4 | 3.98 × 10⁻² |
| 115434790 | Phospholipase D alpha 1 | 28.5 | 23 | 0.3 | 6.75 × 10⁻⁴ |
| 115454997 | Glutamate decarboxylase | 22.4 | 10 | 0.3 | 7.16 × 10⁻³ |
| 115447403 | Phenylalanine ammonia-lyase | 45.6 | 36 | 0.1 | 2.39 × 10⁻² |
| Generation of precursor metabolites and energy | |||||
| 115472339 | Putative ATP synthase gamma chain 1, chloroplast | 44.4 | 70 | 24.9 | 1.72 × 10⁻⁹ |
| 115472727 | Cytochrome b6-f complex iron-sulfur subunit, chloroplastic | 56.0 | 37 | 23.1 | 1.34 × 10⁻⁴ |
| 115457390 | ATP synthase B chain | 50.3 | 23 | 11.7 | 2.97 × 10⁻³ |
| 115435200 | Putative phosphoenolpyruvate carboxylase 1 | 29.0 | 34 | 7.4 | 1.51 × 10⁻⁴ |
| 115452259 | ATP synthase B chain, chloroplast | 34.6 | 30 | 5.8 | 8.67 × 10⁻⁴ |
| 115448701 | Putative H(+)-transporting ATP synthase | 26.3 | 25 | 5.1 | 8.73 × 10⁻⁴ |
| 115469362 | Putative vacuolar proton-ATPase | 43.4 | 36 | 0.6 | 1.69 × 10⁻² |
| 115435934 | NAD-dependent isocitrate dehydrogenase a | 29.3 | 11 | 0.6 | 3.96 × 10⁻² |
| 115474559 | Succinate dehydrogenase [ubiquinone] iron-sulfur subunit, mitochondrial | 24.9 | 8 | 0.5 | 1.16 × 10⁻² |
| 115438975 | Putative H + -exporting ATPase | 40.0 | 11 | 0.5 | 6.50 × 10⁻³ |
| 115444791 | Citrate synthase | 26.9 | 13 | 0.4 | 2.19 × 10⁻³ |
| 115447367 | Succinyl-CoA ligase [ADP-forming] subunit beta, mitochondrial | 31.0 | 14 | 0.3 | 1.77 × 10⁻² |
| 115470583 | Ferredoxin--NADP reductase, embryo isozyme, chloroplastic | 16.4 | 6 | 0.3 | 5.45 × 10⁻³ |
| 115470493 | Succinate dehydrogenase [ubiquinone] flavoprotein subunit, mitochondrial | 13.2 | 9 | 0.2 | 2.91 × 10⁻³ |
| 115469332 | Glutaredoxin-C8 | 36.4 | 3 | 0.1 | 4.59 × 10⁻² |
| 115459340 | Glutaredoxin-C6 | 43.8 | 7 | 0.1 | 9.69 × 10⁻³ |
| 115470941 | Thioredoxin H1 | 40.2 | 11 | 0.1 | 7.29 × 10⁻³ |
| Vitamin metabolism | |||||
| 115472485 | Thiamine thiazole synthase, chloroplastic | 49.8 | 29 | 6.7 | 5.04 × 10⁻³ |
| 115454593 | Thiamine biosynthesis protein thiC | 25.7 | 14 | 5.4 | 3.81 × 10⁻⁷ |
| 115446113 | Riboflavin biosynthesis protein RibD family protein | 9.2 | 4 | 3.9 | 1.81 × 10⁻² |
| 115482032 | GDP-mannose 3,5-epimerase 1 | 42.6 | 26 | 2.7 | 4.02 × 10⁻² |
| Nucleotide metabolism | |||||
| 115475007 | Putative uncharacterized protein OJ1590_E05.35-1 | 10.5 | 4 | 9.5 | 7.33 × 10⁻³ |
| 115455473 | WRKY DNA binding domain containing protein | 4.9 | 5 | 5.1 | 1.59 × 10⁻² |
| 115450117 | (RAP Annotation release2) Formyltetrahydrofolate deformylase family protein | 13.2 | 4 | 4.2 | 1.28 × 10⁻² |
| 115462253 | Probable GTP diphosphokinase CRSH2, chloroplastic | 15.7 | 9 | 3.8 | 4.78 × 10⁻² |
| 115480339 | Deoxyribodipyrimidine photolyase family protein-like | 8.5 | 6 | 3.5 | 1.70 × 10⁻² |
| 115488968 | Nucleoside diphosphate kinase | 31.8 | 11 | 3.3 | 9.20 × 10⁻³ |
| 115454773 | Adenylosuccinate synthetase 2, chloroplastic | 34.0 | 21 | 3.1 | 8.43 × 10⁻⁴ |
| 115464251 | Putative uracil phosphoribosyltransferase | 28.9 | 9 | 3.0 | 7.42 × 10⁻⁴ |
| 115451155 | SAP-like protein | 13.1 | 4 | 2.9 | 4.14 × 10⁻² |
| Isoprenoid metabolism | |||||
| 115472641 | Putative isopentenyl pyrophosphate:dimethyllallyl pyrophosphate isomerase | 12.6 | 3 | 15.6 | 7.33 × 10⁻³ |
| 115447171 | 4-Hydroxy-3-methylbut-2-en-1-yl diphosphate synthase, chloroplastic | 28.2 | 21 | 9.2 | 1.37 × 10⁻⁸ |
| 115471093 | Zeta-carotene desaturase | 26.8 | 18 | 7.9 | 4.21 × 10⁻⁶ |
| 115458652 | Zeaxanthin epoxidase, chloroplastic | 16.2 | 10 | 5.9 | 3.86 × 10⁻⁵ |
| 115434044 | 1-Deoxy-D-xylulose 5-phosphate reductoisomerase, chloroplastic | 24.7 | 15 | 4.5 | 3.59 × 10⁻² |
| 115451171 | Phytoene dehydrogenase, chloroplastic/chromoplastic | 15.4 | 9 | 2.8 | 2.84 × 10⁻² |
| Phosphorus metabolism | |||||
| 115463815 | Pyruvate, phosphate dikinase 1, chloroplastic | 40.4 | 51 | 7.4 | 1.85 × 10⁻¹¹ |
| 115448919 | Chloroplast inorganic pyrophosphatase | 42.2 | 19 | 6.3 | 2.57 × 10⁻² |
| 115488252 | Phosphoglucan, water dikinase, chloroplastic | 12.9 | 15 | 3.8 | 2.37 × 10⁻⁶ |
| 115468200 | Alpha-glucan water dikinase | 13.0 | 18 | 3.0 | 8.67 × 10⁻⁵ |
| Sulfur metabolism | |||||
| 115456862 | ATP sulfurylase | 55.6 | 17 | 7.0 | 2.17 × 10⁻³ |
| 115472303 | Probable 5′-adenylylsulfate reductase 1, chloroplastic | 20.6 | 11 | 3.9 | 5.43 × 10⁻⁴ |
| 115450913 | Glutathione reductase, chloroplast | 31.0 | 20 | 3.3 | 1.25 × 10⁻³ |
| Macromolecule catabolic process | |||||
| 115444937 | 26S proteasome regulatory particle triple-A ATPase subunit 6 | 30.9 | 16 | 0.4 | 3.81 × 10⁻³ |
| 115466690 | Putative 26S proteasome regulatory particle triple-A ATPase subunit 5a | 20.3 | 12 | 0.2 | 2.09 × 10⁻³ |
| Response to reactive oxygen species | |||||
| 115446663 | Probable L-ascorbate peroxidase 8, chloroplastic | 27.2 | 31 | 6.7 | 2.50 × 10⁻² |
| 115450521 | Catalase | 47.2 | 38 | 6.2 | 1.09 × 10⁻² |
| 115477837 | Superoxide dismutase [Cu-Zn], chloroplastic | 54.0 | 28 | 5.4 | 1.30 × 10⁻² |
| 115473833 | Thioredoxin reductase NTRC | 33.0 | 12 | 4.4 | 1.38 × 10⁻⁵ |
| 115477687 | L-Ascorbate peroxidase | 34.4 | 24 | 3.2 | 1.48 × 10⁻² |
| Cofactor metabolism | |||||
| 115479433 | Formate-tetrahydrofolate ligase | 29.4 | 25 | 3.0 | 4.12 × 10⁻³ |
| 115440827 | ABC transporter subunit-like | 13.2 | 8 | 2.7 | 1.62 × 10⁻² |
| 115434288 | Putative SufD | 18.1 | 9 | 2.6 | 4.64 × 10⁻² |
| Regulation of nitrogen utilization | |||||
| 115477733 | Putative NADPH-dependent reductase | 41.2 | 18 | 7.4 | 2.14 × 10⁻⁷ |
| 115445203 | Putative UOS1 | 30.3 | 19 | 6.9 | 1.72 × 10⁻⁶ |
| 115469824 | Putative UOS1 | 23.3 | 13 | 5.5 | 6.31 × 10⁻⁴ |
| 115453029 | Divinyl chlorophyllide a 8-vinyl-reductase, chloroplastic | 24.2 | 11 | 4.6 | 6.54 × 10⁻³ |
| Cellular homeostasis | |||||
| 115472057 | Thioredoxin-like protein CDSP32, chloroplastic | 29.9 | 13 | 10.1 | 2.89 × 10⁻⁵ |
| 115444771 | Peroxiredoxin-2E-2, chloroplastic | 63.1 | 34 | 7.7 | 6.91 × 10⁻⁵ |
| 115466906 | Peroxiredoxin Q, chloroplastic | 45.2 | 22 | 7.6 | 5.32 × 10⁻⁴ |
| 115446541 | 2-Cys peroxiredoxin BAS1, chloroplastic | 56.3 | 36 | 5.2 | 3.44 × 10⁻³ |
| 115477793 | Putative auxin-regulated protein | 32.8 | 13 | 4.5 | 3.11 × 10⁻² |
| 115436320 | Dihydrolipoyl dehydrogenase | 56.3 | 47 | 3.9 | 4.04 × 10⁻⁵ |
| 115435536 | Peptide transporter protein-like | 10.7 | 3 | 2.8 | 1.39 × 10⁻² |
| 115471449 | Putative uncharacterized protein OJ1370_E02.126 | 39.3 | 10 | 1.8 | 2.24 × 10⁻² |
| 115464793 | Thioredoxin | 14.9 | 3 | 0.5 | 3.06 × 10⁻² |
| 115479475 | Protein disulfide isomerase-like 2-3 | 15.7 | 5 | 0.3 | 2.01 × 10⁻² |
| 115462193 | Protein disulfide isomerase-like 2-1 | 17.2 | 6 | 0.3 | 1.99 × 10⁻³ |
| 115455973 | Thioredoxin H2-2 | 14.2 | 2 | 0.2 | 3.38 × 10⁻² |
| 115484585 | Protein disulfide isomerase-like 1-1 | 28.1 | 20 | 0.1 | 9.78 × 10⁻⁸ |
| Oxidation reduction | |||||
| 115484891 | Rieske [2Fe-2S] domain | 35.0 | 18 | 13.7 | 3.63 × 10⁻⁵ |
| 115459670 | NAD(P)H-quinone oxidoreductase subunit M, chloroplastic | 39.1 | 14 | 11.5 | 6.11 × 10⁻³ |
| 115481490 | Flavonoid 3′-hydroxylase | 6.1 | 3 | 7.8 | 3.64 × 10⁻² |
| 115476190 | Putative oxidoreductase, zinc-binding | 51.0 | 34 | 6.6 | 3.97 × 10⁻⁶ |
| 115476820 | Nitrate reductase [NADH] 1 | 6.3 | 5 | 6.0 | 1.29 × 10⁻² |
| 115477461 | Moco containing protein | 34.5 | 13 | 5.1 | 1.02 × 10⁻³ |
| 115482950 | Aldo/keto reductase family protein | 9.3 | 3 | 5.1 | 2.94 × 10⁻³ |
| 115454109 | Oxidoreductase, aldo/keto reductase family protein | 38.5 | 16 | 4.9 | 2.69 × 10⁻⁴ |
| 115476618 | Glyceraldehyde-3-phosphate dehydrogenase | 36.5 | 29 | 4.7 | 8.09 × 10⁻³ |
| 115443657 | Putative ferredoxin-NADP(H) oxidoreductase | 55.1 | 51 | 4.3 | 2.52 × 10⁻³ |
| 115484125 | L-galactono-1,4-lactone dehydrogenase 1, mitochondrial | 6.7 | 3 | 3.9 | 1.56 × 10⁻³ |
| 115446723 | Glucose/ribitol dehydrogenase family protein | 19.1 | 4 | 2.6 | 1.50 × 10⁻² |
| 115477843 | Putative malate dehydrogenase [NADP], chloroplast | 21.5 | 13 | 2.5 | 1.35 × 10⁻² |
| 115438082 | Cytosolic aldehyde dehydrogenase | 21.5 | 11 | 2.1 | 4.10 × 10⁻² |
| 115487892 | NADP-dependent oxidoreductase P2 | 17.9 | 6 | 1.8 | 2.31 × 10⁻² |
| 115456131 | Putative alcohol dehydrogenase | 26.7 | 6 | 0.6 | 4.09 × 10⁻² |
| 115443911 | NADPH-dependent mannose 6-phosphate reductase | 26.9 | 12 | 0.6 | 1.66 × 10⁻² |
| 115482810 | Malic enzyme | 20.2 | 11 | 0.5 | 2.47 × 10⁻³ |
| 115460254 | OSJNBa0009P12.34 protein | 12.4 | 4 | 0.5 | 1.82 × 10⁻² |
| 115478070 | Putative NADPH-dependent retinol dehydrogenase/reductase | 26.1 | 8 | 0.4 | 3.40 × 10⁻² |
| 115484519 | Aldehyde dehydrogenase | 12.0 | 5 | 0.4 | 7.24 × 10⁻³ |
| 115479375 | Aldehyde dehydrogenase | 29.9 | 15 | 0.4 | 6.28 × 10⁻³ |
| 115463191 | Superoxide dismutase [Mn], mitochondrial | 32.9 | 13 | 0.3 | 3.01 × 10⁻² |
| 115464645 | Hypothetical protein | 5.7 | 3 | 0.3 | 3.11 × 10⁻² |
| 115434810 | NADH-cytochrome b5 reductase | 22.8 | 7 | 0.3 | 2.15 × 10⁻² |
| 115451245 | Oxidoreductase, zinc-binding dehydrogenase family protein | 16.1 | 5 | 0.3 | 1.48 × 10⁻² |
| 115478148 | Isopenicillin N synthase family protein | 5.2 | 2 | 0.2 | 7.89 × 10⁻³ |
| 115462115 | Putative 1-aminocyclopropane-1-carboxylate oxidase | 11.0 | 3 | 0.2 | 1.34 × 10⁻² |
| Response to oxidative stress | |||||
| 115445243 | Class III peroxidase 29 | 38.9 | 20 | 39.8 | 3.19 × 10⁻³ |
| 115460338 | Haem peroxidase family protein | 32.9 | 20 | 4.5 | 4.36 × 10⁻⁵ |
| 115436084 | Class III peroxidase 11 | 26.2 | 8 | 4.4 | 2.78 × 10⁻² |
| 115474059 | Peroxidase | 47.0 | 19 | 0.3 | 1.30 × 10⁻² |
| 115436300 | Class III peroxidase 16 | 23.1 | 10 | 0.3 | 2.50 × 10⁻² |
| 115456523 | Salt tolerance protein | 27.5 | 7 | 0.2 | 5.25 × 10⁻⁴ |
| 115459848 | Glutathione peroxidase | 33.9 | 10 | 0.2 | 4.64 × 10⁻² |
| 115442403 | Putative peroxidase | 37.9 | 19 | 0.1 | 3.85 × 10⁻⁴ |
| Others | |||||
| 115450080 | Cell division inhibitor-like | 20.9 | 14 | 5.4 | 2.53 × 10⁻² |
| 115450329 | Peroxisomal membrane protein 11-1 | 21.9 | 5 | 4.8 | 2.94 × 10⁻² |
| 115452321 | Ribosomal protein L10 containing protein | 50.9 | 15 | 4.1 | 3.30 × 10⁻⁴ |
| 115439157 | Two pore calcium channel protein 1 | 2.0 | 1 | 3.8 | 3.56 × 10⁻² |
| 115457630 | Phototropin-2 | 17.0 | 12 | 2.9 | 1.21 × 10⁻⁴ |
| 115474273 | Phosphoinositide phospholipase C | 27.3 | 15 | 0.5 | 4.60 × 10⁻² |
| 115446411 | RNA binding protein Rp120 | 29.6 | 29 | 0.5 | 1.61 × 10⁻² |
| 115448225 | GTPase activating protein-like | 5.2 | 4 | 0.3 | 5.92 × 10⁻³ |
| 115453079 | Villin-3 | 20.7 | 17 | 0.3 | 5.15 × 10⁻³ |
| 115451401 | Mitochondrial outer membrane protein porin 5 | 49.1 | 21 | 0.3 | 4.79 × 10⁻³ |
| 115441759 | Dolichyl-diphosphooligosaccharide--protein glycosyltransferase subunit 2 | 10.3 | 6 | 0.3 | 1.12 × 10⁻⁴ |
| 297601526 | Probable linoleate 9S-lipoxygenase 4 | 22.4 | 15 | 0.2 | 2.78 × 10⁻³ |
| 115434036 | Putative isoflavone reductase | 19.8 | 5 | 0.2 | 1.38 × 10⁻² |
| 115486998 | Non-specific lipid-transfer protein 2B | 57.3 | 17 | 0.1 | 4.26 × 10⁻³ |
| 115444635 | Response regulator | 2.1 | 3 | 0.02 | 2.08 × 10⁻² |
Note: “Peptides (95 %)” indicates distinct peptides were identified with at least 95 % confidence (protein score cutoff > 1.5); “Cov (95)” means percentage of matching amino acids from identified peptides with confidence over 95 %; Ratio and P-value represents tag labeled for mock leaves: tag labeled for RSV-infected leaves. Ratio >1.5 is considered as downregulated and <0.67 is upregulated
Chloroplast group
The 30 annotated significantly downregulated proteins in the chloroplast group process were involved in chlorophyll biosynthesis and photosynthesis (Table 2). For chlorophyll biosynthesis, 10 proteins involved in the chlorophyll contents in RSV-infected leaves were more than 3 times lower than in the mock leaves: magnesium chelatase subunit I (CHLI) and subunit D (CHLD), magnesium-protoporphyrin IX monomethyl ester [oxidative] cyclase, uroporphyrinogen decarboxylase 1, uroporphyrinogen decarboxylase 2, protoporphyrinogen oxidase, porphobilinogen deaminase, delta-aminolevulinic acid dehydratase, glutamate-1-semialdehyde 2,1-aminomutase, glutamyl-tRNA reductase (Table 2; Fig. 5). Twenty photosynthesis proteins were also annotated as enriched, whereas four oxygen-evolving enhancer proteins and a type protein involved in the chloroplast biosynthesis were over 10 times lower upon RSV infection than those in the mock control. Meanwhile, five chlorophyll a/b-binding proteins were downregulated in RSV-infected leaves compared with mock leaves (Table 2). Thus, the accumulation of 30 proteins in the chlorophyll metabolism was apparently reduced by RSV infection.
Fig. 5.

a Enzymes of chlorophyll biosynthetic pathway that decreased in accumulation during RSV infection. Selected steps are from KEGG pathways map (map 00860) for metabolism and enzymes. Bold words represent enzymes: glutamyl-tRNA synthetase, uroporphyrinogen III synthase, Mg-protoporphyrin IX methyltransferase, coproporphyrinogen III oxidase; boxed words represent enzymes: glutamyl-tRNA reductase, glutamate-1-semialdehyde aminotransferase, delta-aminolevulinic acid dehydratase, porphobillinogen deaminase, Mg-protoporphyrin IX monomethyl ester oxidative cyclase, magnesium-chelatase, protoporphyrinogen IX oxidase, uroporphyrinogen III decarboxylase. Eight enzymes at first stage of chlorophyll biosynthetic process were found and comprised 10 differentially accumulated proteins that were identified in RSV-induced leaves compared with the mock control leaves. b Two pathways could lead to programmed cell death including normal and RSV-induced plant. OsAP25 (radc1, Os03g0186900), OsAP37, rap, and p0026h03.19 were aspartic proteases genes
Defense group
Leaves are the primary tissue for RSV infection and colonization, so not surprisingly, four defensive proteins in RSV-infected leaves were identified as being altered in accumulation. Three pathogenesis-related proteins and a Bet v 1 allergen family protein were significantly more abundant in RSV-infected leaves than those in mock leaves: pathogenesis-related protein 1, pathogenesis-related protein 10, pathogenesis-related protein and Bet v I allergen family protein (Table 2). The upregulation of those proteins indicated that defensive reactions were induced after inoculation with RSV. From the 70 kDa heat shock protein (HSP70) family, ubiquitous in plants in response to diverse DNA and RNA viruses [39, 40], HSP70 and HSP (putative heat shock protein) were expressed at high levels in RSV-infected leaves compared with mock leaves, indicating that RSV activates the expression of the genes encoding HSP. In addition, superoxide dismutase [Mn] and four peroxidases expressed were upregulated in response to RSV (Table 2).
Of 28 annotated proteins involved in proteolysis, 19 proteins increased in response to RSV infection: 7 proteasome subunits, 3 ubiquitin type proteins, 3 aspartic type proteins, 2 aminopeptidase M1 subunits, 1 DNA-binding protein, 1 leukotriene A-4 hydrolase,1 serine carboxypeptidase and 1 insulin degrading enzyme. Three aspartic type proteins (eukaryotic aspartyl protease family protein, aspartic proteinase and peptidase aspartic) were expressed at a high level in the RSV-infected leaves (Table 2).
Validation of changes in RNA level by RT-qPCR and Northern blotting
Based on a proteomics analysis, the proteins differentially accumulated during RSV infection, key proteins for chlorophyll biosynthesis and an aspartic-type endopeptidase were identified as involved in the formation of RSV induced symptoms, and their presence was quantitatively confirmed using RT-qPCR and Northern blot to evaluate the correlation between mRNA and protein levels. Total RNA extracted from RSV-infected and mock leaves was analyzed to measure mRNA transcription levels of putative target proteins. The RT-qPCR results demonstrated that expression of the genes for CHLI and CHLD (magnesium chelatase) in RSV-infected leaves was downregulated more than three times the level of the control (Fig. 6a), and transcription of genes encoding radc1, rap and p0026h03.19 in RSV-infected leaves were upregulated 14, 2, 3 times higher than the level of the control leaves, respectively (Fig. 6a), verifying the iTRAQ results. Similarly, this trend for mRNA levels of the genes for CHLI and p0026h03.19 by Northern blotting analyses also supported the transcription of genes encoding respective protein by RT-qPCR (Fig. 6b). Whereas, elevated levels of five genes were different between transcription and proteins levels that may be due to posttranscription and posttranslational regulatory processes.
Fig. 6.
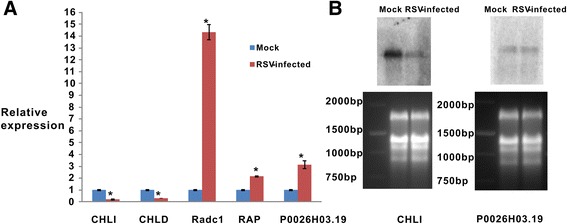
Validation of rice gene expression levels by real time RT-PCR and Northern blotting. a Comparison of protein and mRNA expression levels of mock leaves and RSV-infected leaves using RT-qPCR. Blue represents mock leaves; red represents RSV-infected leaves. The averaged readings from the three biological replicates normalized against endogenous gene OsEF1α; error bar denoted SD. Statistics were analyzed using the Student’s t-test. An asterisk indicated a significant difference from the corresponding control (P < 0.01). b Northern blot of two differentially expressed genes selected for verifying RT-qPCR results. Mock, mock-inoculated leaves; RSV-infected, RSV-infected leaves. Equal loading of total RNA was assessed by staining rRNA with ethidium bromide. Marker contained 2000 bp, 1500 bp, 1000 bp and 750 bp
Discussion
In the present study, iTRAQ-based experiments were implemented to identify proteins that were differentially accumulated between the RSV-infected and mock-inoculated leaves, then to determine which proteins may be involved in symptom formation. During RSV infection, 681 differentially accumulated proteins were found (Fig. 2; Table 1); 492 of these proteins were annotated by GO and located mostly in plastids, including the chloroplast, and participating in chlorophyll metabolism (Fig. 3, 4; Table 2). Chloroplast proteins was degraded by chloroplast vesiculation [41]. Upon RSV infection, the chloroplast vesiculation possibly targeted and destabilized the chloroplast for protein degradation, which resulted in cell death and induced the formation of vesicle containing many plastid proteins. According to the String database, protein-protein interaction networks were clustered in the chloroplast, defensive and metabolism groups (Additional file 2: Figure S1). Based on the functional analysis and RSV-induced disease symptoms, several proteins were associated with leaf chlorosis, cell death and plant defense during RSV invasion (Fig. 1, 3, 4). Additionally, the transcription of genes encoding selected proteins using RT-qPCR and Northern blot analyses matched with iTRAQ results (Fig. 6). We will discuss these various changes in proteins with regard to their significance to disease symptoms.
RSV induced a decrease in chlorophyll
At 21 dpi, chlorotic stripes on newly emerged leaves are typical on rice plants infected by RSV (Fig. 1). Chlorosis is correlated with a reduction in chlorophyll during infection with a virus [11]. Recently, chlorophyll structure was also confirmed to be altered by accumulation of RSV SP, and PsbP (oxygen-evolving complex protein) was shown to participate in the interaction between rice and RSV [16]. Similarly, we used iTRAQ to determine that the accumulation of four oxygen-evolving enhancer proteins in RSV-induced leaves was lower than in the control plants (Table 2); thus, reduced accumulation of oxygen-evolving enhancer protein is involved in interrupting chlorophyll production.
Chlorophyll production is also influenced independently by chlorophyll anabolic and catabolic reactions [42]. Here, eight enzymes involved in early steps of chlorophyll biosynthesis were identified as being lower in RSV-infected leaves than in the mock-inoculated leaves (Fig. 5a; Table 2), again implicating RSV infection in significantly inhibiting chlorophyll biosynthesis. One of these eight, magnesium chelatase, comprising three subunits (CHLI, CHLD, CHLH), is an important synthetic enzyme for chlorophyll a and chlorophyll b [43]. Specifically, subunits CHLI and CHLD were downregulated in RSV-infected leaves (Table 2, Fig. 3a) and had decreased mRNA levels (Fig. 6) compared with the control. These subunits are AAA+ proteins (ATPases associated with various cellular activities) and form a motor unit, which provides a structure for the functioning of magnesium chelatase [44, 45]. The reduced accumulation of CHLI and CHLD thus indicates that the function of magnesium chelatase in chlorophyll biosynthesis is also limited. These results suggest that the reduction of chlorophyll is associated with downregulation of magnesium chelatase during infection with RSV. Previous studies of CMV have shown that the yellow mosaic symptoms are induced by a domain of satellite RNA [46, 47]. Recently, small interfering RNA (siRNA) derived from this domain of satellite RNA was shown to mediate RNA silencing of the chlorophyll biosynthetic gene CHLI (magnesium protoporphyrin cheltase subunit I) and that CHLI mRNA is downregulated in the infected tobacco [12, 13]. The yellowing domain of CMV satellite RNA induces RNA silencing of chlorophyll biosynthetic gene by small interfering RNA [12, 13]. Unlike CMV, RSV does not have satellite RNA; so how does RSV regulate and alter the chlorophyll biosynthetic pathway and induce chlorosis? In addition, a reduction of chlorophyll a/b-binding protein was shown to cause a downregulation of chlorophyll accumulation [14]. Here, the level of five chlorophyll a/b-binding proteins was reduced during RSV infection (Table 2). Therefore, RSV infection disrupts chlorophyll biosynthesis.
Proteases coincided with cell death
The ubiquitin-26S proteasome system targets intercellular regulators that have a central role in battling pathogens [48–51] and in leaf senescence [52]. Several of the 26S proteasome units rose in accumulation in RSV-infected leaves compared with mock leaves (Table 2), suggesting it might promote host defense, then induce cell death in rice to restrict pathogen spread.
At the end stage of RSV infection, rice leaves developed chlorotic stripes, then the whole leaf died (Fig. 1b). Cell death requires a series of appropriate proteases. For example, over-expression of OsAP25 (Os03g0186900) and OsAP37 encoding aspartic proteases induces programmed cell death [18]. Similarly, in this study aspartic proteases encoded by radc1 (Os03g0186900), rap, and p0026h03.19 in RSV-infected leaves were sharply upregulated compared with the control leaves (Figs. 4 and 5b), indicating that the expression of the genes encoding aspartic protease was induced by RSV infection and participated in programmed cell death. However, we found that the aspartic protease pathway in RSV-infected leaves contained three proteins (radc1, rap, and p0026h03.19) that differed from the aspartic proteases (OsAP25 and OsAP37) in the normal plant. The aspartic protease pathway induced by a pathogen might thus be a new biological process.
Defense reaction during RSV infection
Pathogenesis-related protein is associated with systemic acquired resistance of plant against diverse pathogens [53]. RSV infection induced a plant defense response, as noted by the upregulation of the expression of the genes encoding rice pathogenesis-related proteins. Bet v1 allergen, a member of the ubiquitous family of pathogenesis-related plant proteins, acts as a plant steroid carrier and has ribonuclease activity, suggesting it might play a key role in the plant defense response against pathogens [54–56]. In RSV-infected leaves, three pathogenesis-related proteins belonging to the Bet v1 allergen family of proteins (OSJNBb0048E02.12) accumulated at a higher level than in mock leaves (Table 2). So the upregulation of Bet v1 allergen family proteins might improve the transport of a steroid such as a brassinosteroid and enhance ribonuclease activities against virus infection. In addition, the heat-shock protein HSP70 was more abundant in the RSV-infected leaves than in mock leaves (Table 2); thus RSV can induce HSP70 accumulation, as can various other RNA and DNA viruses [39, 40]. The expression of the genes encoding superoxide dismutase [Mn], superoxide dismutase [Cu-Zn] and peroxidase was also altered in response to RSV invasion (Table 2). Superoxide dismutase and peroxidase in plant were also identified as upregulated in response to TMV infection [57]. However, superoxide dismutase [Cu-Zn] was identified as downregulated during Sugarcane mosaic virus infection, showing that the regulation of superoxide dismutase can differ depending on the virus [58]. RSV infection thus clearly activated the accumulation of rice defense-related proteins, similar to the defense-related proteins such as PR10, HSP70 and peroxidase induced in rice infected by Rice yellow mottle virus (RYMV) that were identified using the 2-D method [59].
Conclusions
In summary, comparative proteomics analysis using iTRAQ LC-MS/MS technology identified 448 downregulated proteins and 233 upregulated proteins in many metabolic pathways during RSV infection. Several pathways potentially involved in RSV-induced symptom were found, including chlorophyll biosynthesis, proteolysis and defense response. Although our investigation provides knowledge of key proteins associated with the RSV-induced symptom, gene function analysis is needed to further understand the roles of these proteins in symptom formation. Therefore, our findings may provide new clues for elucidating the molecular mechanisms underlying RSV-induced symptom formation.
Methods
Insect population, plant materials and inoculation
A SBPH (small brown planthopper) population was maintained on susceptible rice (Oryza sativa var. japonica) cultivar (cv.) Wuyujing 3 in a climate chamber at 26 °C and a photoperiod of 14 h light and 10 h dark [60]. Third instar SBPH nymphs were allowed to feed on RSV-infected rice plants for a 3-day acquisition access period (AAP), then maintained in the climate chamber through the 10-day latent period. Ten viruliferous SBPH were then allowed to feed for a 2-day inoculation access period on three-leaved seedlings of Oryza sativa cv. Aichiasahi that had been grown in plastic pots containing a greenhouse soil mixture (40 % soil, 30 % vermiculite, 30 % straw powder). Subsequently, seedlings infested with non-viruliferous SBPH were used in the same way as a mock control. After the inoculation access period, seedlings were sprayed with insecticide and were transferred to insect-free greenhouse at 28 °C to observe symptom formation daily.
Sampling and RT-PCR (reverse transcription-polymerase chain reaction)
Samples were collected from both RSV-infected leaves and mock leaves at 21 dpi and immediately immersed in liquid nitrogen. Total RNA was extracted using Trizol reagent (Invitrogen Trading, Shanghai, China). M-MLV reverse transcriptase (Promega, Madison, USA) was used to reverse-transcribe 2 μg of the total RNA with gene-specific primers (Additional file 1: Table S1). PCR was performed in a final volume of 50 μL at 95 °C for 5 min, 32 cycles of 95 °C for 30 s, 57 °C for 45 s, 72 °C for 50 s. Amplified products were fractionated in a 1 % agarose gel.
Protein extraction, digestion and iTRAQ labeling
To extract total proteins from the RSV-infected leaves and control leaves, the samples were homogenized in lysis buffer (7 M urea, 2 M thiourea, 0.1 % CHAPS), and the mixture was then incubated at 30 °C for 30 min, and centrifuged at 15,000 × g for 20 min at 4 °C. The supernatant was collected and the proteins concentration was determined by the Bradford protein assay (Bio-Rad Laboratory, Hercules, CA, USA). Bovine serum albumin (BSA) was performed as the standard for the calibration curve. Approximately 200 μg proteins were reduced with 1 M dithiothreitol, alkylated with 1 M iodoacetamide, dissolved in the dissolution buffer, and digested with trypsin (AB Sciex, Foster City, USA) at 1:50 (w/w) for 37 °C overnight, which were then labeled using the iTRAQ Reagents 4-plex kit (AB Sciex) according to the manufacturer’s instructions. The peptides from RSV-infected leaves and mock leaves were labeled with 117 and 116 tags, respectively (Fig. 7).
Fig. 7.
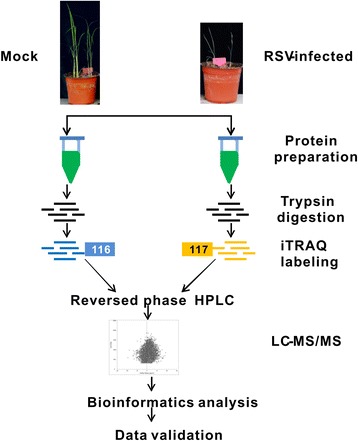
Strategy for iTRAQ LC-MS/MS analysis of comparative proteomics in rice infected with Rice stripe virus (RSV). At 21 days after inoculation, mock leaves (inoculated with healthy small brown planthoppers [SBPH]) and RSV-inoculated leaves (inoculated via RSV-viruliferous SBPH) were collected to extract total proteins. After prepared proteins were digested with trypsin, the peptides were labeled with the iTRAQ reagent and pooled. Pooled peptides were fractioned using the reversed-phase HPLC system, then individual fractions were analyzed using LC-MS/MS. MS raw data were processed using the NCBI protein database. Identified proteins were then analyzed using the DAVID platform and STRING software. Finally, key proteins were selected to validate their expression
Fractionation by reversed-phase high-performance liquid chromatography (HPLC)
Using the RIGOL L-3000 HPLC Pump system, the iTRAQ-labeled samples were reconstituted with mobile phase A (98 % H2O, 2 % acetonitrile, pH 10 adjusted by ammonia water) and mobile phase B (98 % acetonitrile, 2 % H2O adjusted by ammonia water), then fractionated on a Durashell-C18 column (4.6 mm × 250 mm, 5 μm, 100 Å; Agela, USA) at a speed of 0.7 mL min-1 using the gradient 0-5 min, 5-8 % buffer B; 5-35 min, 8-18 % buffer B; 35-62 min, 18-32 % buffer B; 62-64 min, 32-95 % buffer B; 64-68 min, 95 % buffer B; 68-72 min, 95-5 % buffer B. The chromatograms were recorded at 214 nm.
Mass spectrometric (MS) analysis
The fractionated peptides, dissolved in 2 % methyl alcohol and 0.1 % formic acid were analyzed using an ABI-5600 system (Applied Biosystems). After equilibration of the column with solvent A (100 % H2O, 0.1 % formic acid), the peptides eluted from the column (EASY-Spray column, 12 cm × 75 μm, C18, 3 μm) with a 90-min mobile phase gradient using solvent B (100 % acetonitrile, 0.1 % formic acid) with a flow rate of 350 nL min-1, a spray voltage of 2.1 kV and ionization interface temperature of 250 °C. Scan range was from 350 to 1800 m/z. The charge states of peptides were set to +2 to +4.
Protein identification and quantification
Proteins were identified and quantified by Protein Pilot Software 4.0 using the NCBI rice protein database (http://www.ncbi.nlm.nih.gov/protein/?term=oryza+sativa) search algorithm (Applied Biosystems). Proteins were identified based on various parameters such as trypsin digestion; dynamic modification; false discovery rate (FDR) determination for all peptide and protein identifications < 1 %; precursor ion mass tolerance, ±15 ppm; fragment ion mass tolerance, ±20 mmu; max missed cleavages, 2. Proteins were quantified as a change in relative expression; proteins with a fold-change >1.5 (P < 0.05) were considered to have decreased in level and those with fold-change <0.67 (P < 0.05) as increased.
Bioinformatics analysis
The Gene Ontology (GO) annotation for functional analysis was done using the DAVID resources 6.7 (http://david.abcc.ncifcrf.gov/) [61], and proteins were classified based on the molecular function, biological process, and cellular components. The Kyoto Encyclopedia of Genes and Genomes (KEGG) (http://www.kegg.jp/) annotation was also done for a pathway analysis [62], and we assessed the interaction network for differentially accumulated proteins using STRING software (http://string-db.org/) [63].
Analysis of gene expression by RT-qPCR (reverse transcription quantitative polymerase chain reaction)
RT-qPCR primers were designed by Primer Premier Version 5.0 based on the ORF (open reading frame) sequence of candidate genes cloned from rice (Additional file 1: Table S1), and a primer set for endogenous gene OsEF1α designed for another study [64] was also used. About 2 μg total RNA was reverse-transcribed using the FastQuant RT kit (Tiangen Biotech-Beijing Co.) according to the manufacturer’s instructions and then its concentration was measured by NanaDrop-1000 [65]. The RT-qPCR was done in final volume of 20 μL using the SupperReal PreMix Plus (SYBR Green) kit and the manufacturer’s instructions (Tiangen Biotech-Beijing Co.) in a ABI 7500 Real Time PCR thermal cycler and the following conditions: 95 °C for 15 min; 40 cycles of 95 °C for 10 s, 55 °C for 32 s, and 72 °C for 32 s. The experiment was repeated three times. Data for the melt curve were collected at 95 °C for 15 s, 60 °C for 1 min, 95 °C for 30 s, and 60 °C for 15 s. Relative gene expression was calculated by the 2-ΔΔCT method [66].
Northern blot analysis
Fifteen micrograms of the total RNA extracted was electrophoresed in a 1.5 % formaldehyde agarose gel and transferred to a Hybond-N+ membrane (GE Healthcare Bio-Scienes Corp., USA) [67]. The membrane was then baked at 80 °C for 2 h, then probed with α-32P-dCTP- randomly primer labeled probe at 65 °C overnight in a perfect hyb™ plus hybridization buffer (Sigma-Aldrich, St. Louis, USA). After the hybridization, the membrane was washed twice with 2× SSC (sodium chloride-sodium citrate), 1× SDS (sodium dodecyl sulfate); 1× SSC, 1× SDS and 0.5× SSC, 0.5× SDS at 65 °C, and the radioactive signals were detected using phosphor imaging.
Acknowledgments
Financial support was provided by the National Key Basic Research of China (2010CB126203), the Special Fund for Agro-scientific Research in the Public Interest (201303021), and the Plan for Scientific Innovation Talent of Henan Province (144100510018).
Additional files
The Gene Ontology (GO) annotation of differentially accumulated proteins using iTRAQ technology. Ratio represents tag labeled for mock leaves: tag labeled for RSV-infected leaves. Ratio >1.5 is considered as downregulated and <0.67 is upregulated.
The interaction network of differentially accumulated proteins between mock leaves and RSV-infected leaves using STRING soft program. We submitted 681 identified proteins to the STRING and analyzed 547 proteins in interaction with each other and constructing the network (A), which were roughly divided into three parts: metabolism (B), chloroplast (C) and defense (D).
Footnotes
Competing interests
The authors declare that they have no competing interests.
Authors’ contributions
BW contributed to the design of the study, iTRAQ-based quantitative proteomics analysis, designing the RT-qPCR protocol, statistical analysis and drafting the manuscript. JH contributed to sample collection, the RNA extractions, Northern blot analysis and drafting the manuscript. YR contributed to the design of the study, sample collection and drafting the manuscript. CL contributed to the design of the study and statistical analysis. XW contributed to the design of the study, statistical analysis and drafting the manuscript. All authors read and approved the final manuscript.
Contributor Information
Biao Wang, Email: bwang0721@163.com.
Jamal-U-Ddin Hajano, Email: hajanojamal@gmail.com.
Yingdang Ren, Email: renyd@126.com.
Chuantao Lu, Email: chuantaolu@qq.com.
Xifeng Wang, Email: wangxifeng@caas.cn.
References
- 1.Hibino H. Biology and epidemiology of rice viruses. Annu Rev Phytopathol. 1996;34:249–74. doi: 10.1146/annurev.phyto.34.1.249. [DOI] [PubMed] [Google Scholar]
- 2.Zhu FM, Xiao QP, Wang FM, Chen YL. Several new diseases occurring in rice south of the Yangtze River. Plant Protection. 1964;2:100–2. [Google Scholar]
- 3.Zhou Y, Li S, Cheng Z, Zhou T, Fan Y. Research advances in rice stripe disease in China. Jiangsu J Agr Sci. 2012;28:1007–15. [Google Scholar]
- 4.Zhang HM, Sun HR, Wang HD, Chen JP. Advances in the studies of molecular biology of Rice stripe virus. Acta Phytophyilacica Sinica. 2007;34:436–40. [Google Scholar]
- 5.Toriyama S. Rice stripe virus: prototype of a new group of viruses that replicate in plants and insects. Microbiol Sci. 1986;3:347–51. [PubMed] [Google Scholar]
- 6.Huo Y, Liu W, Zhang F, Chen X, Li L, Liu Q, et al. Transovarial transmission of a plant virus is mediated by vitellogenin of its insect vector. PLoS Path. 2014;10:e1003949. doi: 10.1371/journal.ppat.1003949. [DOI] [PMC free article] [PubMed] [Google Scholar]
- 7.Zhu Y, Hayakawa T, Toriyama S, Takahashi M. Complete nucleotide sequence of RNA 3 of rice stripe virus: an ambisense coding strategy. J Gen Virol. 1991;72:763–7. doi: 10.1099/0022-1317-72-4-763. [DOI] [PubMed] [Google Scholar]
- 8.Zhu Y, Hayakawa T, Toriyama S. Complete nucleotide sequence of RNA 4 of rice stripe virus isolate T, and comparison with another isolate and with maize stripe virus. J Gen Virol. 1992;73:1309–12. doi: 10.1099/0022-1317-73-5-1309. [DOI] [PubMed] [Google Scholar]
- 9.Knudson LL, Tibbitts TW, Edwards GE. Measurement of ozone injury by determination of leaf chlorophyll concentration. Plant Physiol. 1977;60:606–8. doi: 10.1104/pp.60.4.606. [DOI] [PMC free article] [PubMed] [Google Scholar]
- 10.McNulty IB, Newman DW. Mechanism (s) of fluoride induced chlorosis. Plant Physiol. 1961;36:385–8. doi: 10.1104/pp.36.4.385. [DOI] [PMC free article] [PubMed] [Google Scholar]
- 11.Dawson WO. Tobamovirus-plant interactions. Virology. 1992;186:359–67. doi: 10.1016/0042-6822(92)90001-6. [DOI] [PubMed] [Google Scholar]
- 12.Smith NA, Eamens AL, Wang M-B. Viral small interfering RNAs target host genes to mediate disease symptoms in plants. PLoS Path. 2011;7:e1002022. doi: 10.1371/journal.ppat.1002022. [DOI] [PMC free article] [PubMed] [Google Scholar]
- 13.Shimura H, Pantaleo V, Ishihara T, Myojo N, Inaba J-i, Sueda K, et al. A viral satellite RNA induces yellow symptoms on tobacco by targeting a gene involved in chlorophyll biosynthesis using the RNA silencing machinery. PLoS Path. 2011;7:e1002021. doi: 10.1371/journal.ppat.1002021. [DOI] [PMC free article] [PubMed] [Google Scholar]
- 14.Liu J, Yang J, Bi H, Zhang P. Why mosaic? Gene expression profiling of African cassava mosaic virus-infected cassava reveals the effect of chlorophyll degradation on symptom development. J Integr Plant Biol. 2014;56:122–32. doi: 10.1111/jipb.12133. [DOI] [PubMed] [Google Scholar]
- 15.Lehto K, Tikkanen M, Hiriart JB, Paakkarinen V, Aro EM. Depletion of the photosystem II core complex in mature tobacco leaves infected by the flavum strain of tobacco mosaic virus. Mol Plant Microbe In. 2003;16:1135–44. doi: 10.1094/MPMI.2003.16.12.1135. [DOI] [PubMed] [Google Scholar]
- 16.Kong L, Wu J, Lu L, Xu Y, Zhou X. Interaction between Rice stripe virus disease-specific protein and host PsbP enhances virus symptoms. Mol Plant. 2014;7:691–708. doi: 10.1093/mp/sst158. [DOI] [PubMed] [Google Scholar]
- 17.Hatsugai N, Kuroyanagi M, Yamada K, Meshi T, Tsuda S, Kondo M, et al. A plant vacuolar protease, VPE, mediates virus-induced hypersensitive cell death. Science. 2004;305:855–8. doi: 10.1126/science.1099859. [DOI] [PubMed] [Google Scholar]
- 18.Niu NN, Liang WQ, Yang XJ, Jin WL, Wilson ZA, Hu JP, et al. EAT1 promotes tapetal cell death by regulating aspartic proteases during male reproductive development in rice. Nat Commun. 2013;4:1445. doi: 10.1038/ncomms2396. [DOI] [PubMed] [Google Scholar]
- 19.Mar T, Liu WW, Wang XF. Proteomic analysis of interaction between P7-1 of Southern rice black-streaked dwarf virus and the insect vector reveals diverse insect proteins involved in successful transmission. J Proteomics. 2014;102:83–97. doi: 10.1016/j.jprot.2014.03.004. [DOI] [PubMed] [Google Scholar]
- 20.Qin FL, Liu WW, Li L, Wang XF. Screening of putative proteins in vector Laodelphax striatellus which are interacted with disease-specific protein of Rice stripe virus by yeast two-hybrid based on the split-ubiquitin. Scientia Agricultura Sinica. 2014;47:2784–94. [Google Scholar]
- 21.Scofield SR, Tobias CM, Rathjen JP, Chang JH, Lavelle DT, Michelmore RW, et al. Molecular basis of gene-for-gene specificity in bacterial speck disease of tomato. Science. 1996;274:2063–5. doi: 10.1126/science.274.5295.2063. [DOI] [PubMed] [Google Scholar]
- 22.Nomura K, Debroy S, Lee YH, Pumplin N, Jones J, He SY. A bacterial virulence protein suppresses host innate immunity to cause plant disease. Science. 2006;313:220–3. doi: 10.1126/science.1129523. [DOI] [PubMed] [Google Scholar]
- 23.Feng F, Yang F, Rong W, Wu X, Zhang J, Chen S, et al. A Xanthomonas uridine 5′-monophosphate transferase inhibits plant immune kinases. Nature. 2012;485:114–8. doi: 10.1038/nature10962. [DOI] [PubMed] [Google Scholar]
- 24.Wang Y, Mao Q, Liu W, Mar T, Wei T, Liu Y, et al. Localization and distribution of Wheat dwarf virus in its vector leafhopper, Psammotettix alienus. Phytopathology. 2014;104:897–904. doi: 10.1094/PHYTO-08-13-0227-R. [DOI] [PubMed] [Google Scholar]
- 25.Digonnet C, Martinez Y, Denance N, Chasseray M, Dabos P, Ranocha P, et al. Deciphering the route of Ralstonia solanacearum colonization in Arabidopsis thaliana roots during a compatible interaction: focus at the plant cell wall. Planta. 2012;236:1419–31. doi: 10.1007/s00425-012-1694-y. [DOI] [PubMed] [Google Scholar]
- 26.Kim ST, Kim SG, Agrawal GK, Kikuchi S, Rakwal R. Rice proteomics: a model system for crop improvement and food security. Proteomics. 2014;14:593–610. doi: 10.1002/pmic.201300388. [DOI] [PubMed] [Google Scholar]
- 27.Agrawal GK, Rakwal R. Rice proteomics: A move toward expanded proteome coverage to comparative and functional proteomics uncovers the mysteries of rice and plant biology. Proteomics. 2011;11:1630–49. doi: 10.1002/pmic.201000696. [DOI] [PubMed] [Google Scholar]
- 28.Marsh E, Alvarez S, Hicks LM, Barbazuk WB, Qiu W, Kovacs L, et al. Changes in protein abundance during powdery mildew infection of leaf tissues of Cabernet Sauvignon grapevine (Vitis vinifera L.) Proteomics. 2010;10:2057–64. doi: 10.1002/pmic.200900712. [DOI] [PubMed] [Google Scholar]
- 29.Ross PL, Huang YLN, Marchese JN, Williamson B, Parker K, Hattan S, et al. Multiplexed protein quantitation in Saccharomyces cerevisiae using amine-reactive isobaric tagging reagents. Mol Cell Proteomics. 2004;3:1154–69. doi: 10.1074/mcp.M400129-MCP200. [DOI] [PubMed] [Google Scholar]
- 30.Karp NA, Huber W, Sadowski PG, Charles PD, Hester SV, Lilley KS. Addressing accuracy and precision issues in iTRAQ quantitation. Mol Cell Proteomics. 2010;9:1885–97. doi: 10.1074/mcp.M900628-MCP200. [DOI] [PMC free article] [PubMed] [Google Scholar]
- 31.Gross W, Lenze D, Nowitzki U, Weiske J, Schnarrenberger C. Characterization, cloning, and evolutionary history of the chloroplast and cytosolic class I aldolases of the red alga Galdieria sulphuraria. Gene. 1999;230:7–14. doi: 10.1016/S0378-1119(99)00059-1. [DOI] [PubMed] [Google Scholar]
- 32.Lai MM. Cellular factors in the transcription and replication of viral RNA genomes: a parallel to DNA-dependent RNA transcription. Virology. 1998;244:1–12. doi: 10.1006/viro.1998.9098. [DOI] [PubMed] [Google Scholar]
- 33.Hara MR, Agrawal N, Kim SF, Cascio MB, Fujimuro M, Ozeki Y, et al. S-nitrosylated GAPDH initiates apoptotic cell death by nuclear translocation following Siah1 binding. Nat Cell Biol. 2005;7:665–74. doi: 10.1038/ncb1268. [DOI] [PubMed] [Google Scholar]
- 34.Wang RY-L, Nagy PD. Tomato bushy stunt virus co-opts the RNA-binding function of a host metabolic enzyme for viral genomic RNA synthesis. Cell Host Microbe. 2008;3:178–87. doi: 10.1016/j.chom.2008.02.005. [DOI] [PubMed] [Google Scholar]
- 35.Prasanth KR, Huang Y-W, Liou M-R, Wang RY-L, Hu C-C, Tsai C-H, et al. Glyceraldehyde 3-phosphate dehydrogenase negatively regulates the replication of Bamboo mosaic virus and its associated satellite RNA. J Virol. 2011;85:8829–40. doi: 10.1128/JVI.00556-11. [DOI] [PMC free article] [PubMed] [Google Scholar]
- 36.Zaffagnini M, Fermani S, Costa A, Lemaire SD, Trost P. Plant cytoplasmic GAPDH: redox post-translational modifications and moonlighting properties. Front Plant Sci. 2013;4:450. doi: 10.3389/fpls.2013.00450. [DOI] [PMC free article] [PubMed] [Google Scholar]
- 37.Kaido M, Abe K, Mine A, Hyodo K, Taniguchi T, Taniguchi H, et al. GAPDH-a recruits a plant virus movement protein to cortical virus replication complexes to facilitate viral cell-to-cell movement. PLoS Pathog. 2014;10:e1004505. doi: 10.1371/journal.ppat.1004505. [DOI] [PMC free article] [PubMed] [Google Scholar]
- 38.Han S, Wang Y, Zheng X, Jia Q, Zhao J, Bai F, et al. Cytoplastic glyceraldehyde-3-phosphate dehydrogenases interact with ATG3 to negatively regulate autophagy and immunity in Nicotiana benthamiana. Plant Cell. 2015;27:1316–31. doi: 10.1105/tpc.114.134692. [DOI] [PMC free article] [PubMed] [Google Scholar]
- 39.Aranda MA, Escaler M, Wang DW, Maule AJ. Induction of HSP70 and polyubiquitin expression associated with plant virus replication. Proc Natl Acad Sci U S A. 1996;93:15289–93. doi: 10.1073/pnas.93.26.15289. [DOI] [PMC free article] [PubMed] [Google Scholar]
- 40.Whitham SA, Yang CL, Goodin MM. Global impact: Elucidating plant responses to viral infection. Mol Plant Microbe In. 2006;19:1207–15. doi: 10.1094/MPMI-19-1207. [DOI] [PubMed] [Google Scholar]
- 41.Wang S, Blumwald E. Stress-induced chloroplast degradation in Arabidopsis is regulated via a process independent of autophagy and senescence-associated vacuoles. Plant Cell. 2014;26:4875–88. doi: 10.1105/tpc.114.133116. [DOI] [PMC free article] [PubMed] [Google Scholar]
- 42.Schelbert S, Aubry S, Burla B, Agne B, Kessler F, Krupinska K, et al. Pheophytin Pheophorbide Hydrolase (Pheophytinase) is involved in chlorophyll breakdown during leaf senescence in Arabidopsis. Plant Cell. 2009;21:767–85. doi: 10.1105/tpc.108.064089. [DOI] [PMC free article] [PubMed] [Google Scholar]
- 43.Moulin M, McCormac AC, Terry MJ, Smith AG. Tetrapyrrole profiling in Arabidopsis seedlings reveals that retrograde plastid nuclear signaling is not due to Mg-protoporphyrin IX accumulation. Proc Natl Acad Sci U S A. 2008;105:15178–83. doi: 10.1073/pnas.0803054105. [DOI] [PMC free article] [PubMed] [Google Scholar]
- 44.Lundqvist J, Elmlund H, Wulff RP, Berglund L, Elmlund D, Emanuelsson C, et al. ATP-induced conformational dynamics in the AAA+ motor unit of magnesium chelatase. Structure. 2010;18:354–65. doi: 10.1016/j.str.2010.01.001. [DOI] [PubMed] [Google Scholar]
- 45.Sawicki A, Willows RD. Kinetic analyses of the magnesium chelatase provide insights into the mechanism, structure, and formation of the complex. J Biol Chem. 2008;283:31294–302. doi: 10.1074/jbc.M805792200. [DOI] [PubMed] [Google Scholar]
- 46.Kuwata S, Masuta C, Takanami Y. Reciprocal phenotype alterations between two satellite RNAs of cucumber mosaic virus. J Gen Virol. 1991;72:2385–9. doi: 10.1099/0022-1317-72-10-2385. [DOI] [PubMed] [Google Scholar]
- 47.Masuta C, Takanami Y. Determination of sequence and structural requirements for pathogenicity of a cucumber mosaic virus satellite RNA (Y-satRNA) Plant Cell. 1989;1:1165–73. doi: 10.1105/tpc.1.12.1165. [DOI] [PMC free article] [PubMed] [Google Scholar]
- 48.Vierstra RD. The ubiquitin-26S proteasome system at the nexus of plant biology. Nat Rev Mol Cell Bio. 2009;10:385–97. doi: 10.1038/nrm2688. [DOI] [PubMed] [Google Scholar]
- 49.Smalle J, Vierstra RD. The ubiquitin 26S proteasome proteolytic pathway. Annu Rev Plant Biol. 2004;55:555–90. doi: 10.1146/annurev.arplant.55.031903.141801. [DOI] [PubMed] [Google Scholar]
- 50.Dudler R. Manipulation of host proteasomes as a virulence mechanism of plant pathogens. Annu Rev Phytopathol. 2013;51:521–42. doi: 10.1146/annurev-phyto-082712-102312. [DOI] [PubMed] [Google Scholar]
- 51.Dielen AS, Badaoui S, Candresse T, German-Retana S. The ubiquitin/26S proteasome system in plant-pathogen interactions: a never-ending hide-and-seek game. Mol Plant Pathol. 2010;11:293–308. doi: 10.1111/j.1364-3703.2009.00596.x. [DOI] [PMC free article] [PubMed] [Google Scholar]
- 52.Vierstra RD. Proteolysis in plants: mechanisms and functions. Plant Mol Biol. 1996;32:275–302. doi: 10.1007/BF00039386. [DOI] [PubMed] [Google Scholar]
- 53.van Loon LC, Rep M, Pieterse CMJ. Significance of inducible defense-related proteins in infected plants. Annu Rev Phytopathol. 2006;44:135–62. doi: 10.1146/annurev.phyto.44.070505.143425. [DOI] [PubMed] [Google Scholar]
- 54.Marković-Housley Z, Degano M, Lamba D, von Roepenack-Lahaye E, Clemens S, Susani M, et al. Crystal structure of a hypoallergenic isoform of the major birch pollen allergen Bet v 1 and its likely biological function as a plant steroid carrier. J Mol Biol. 2003;325:123–33. doi: 10.1016/S0022-2836(02)01197-X. [DOI] [PubMed] [Google Scholar]
- 55.Liu JJ, Ekramoddoullah AKM. The family 10 of plant pathogenesis-related proteins: Their structure, regulation, and function in response to biotic and abiotic stresses. Physiol Mol Plant P. 2006;68:3–13. doi: 10.1016/j.pmpp.2006.06.004. [DOI] [Google Scholar]
- 56.Park CJ, Kim KJ, Shin R, Park JM, Shin YC, Paek KH. Pathogenesis-related protein 10 isolated from hot pepper functions as a ribonuclease in an antiviral pathway. Plant J. 2004;37:186–98. doi: 10.1046/j.1365-313X.2003.01951.x. [DOI] [PubMed] [Google Scholar]
- 57.Casado-Vela J, Selles S, Martinez RB. Proteomic analysis of tobacco mosaic virus-infected tomato (Lycopersicon esculentum M.) fruits and detection of viral coat protein. Proteomics. 2006;6:S196–206. doi: 10.1002/pmic.200500317. [DOI] [PubMed] [Google Scholar]
- 58.Wu L, Han Z, Wang S, Wang X, Sun A, Zu X, et al. Comparative proteomic analysis of the plant–virus interaction in resistant and susceptible ecotypes of maize infected with sugarcane mosaic virus. J Proteomics. 2013;89:124–40. doi: 10.1016/j.jprot.2013.06.005. [DOI] [PubMed] [Google Scholar]
- 59.Ventelon-Debout M, Delalande F, Brizard JP, Diemer H, Van Dorsselaer A, Brugidou C. Proteome analysis of cultivar-specific deregulations of Oryza sativa indica and O. sativa japonica cellular suspensions undergoing Rice yellow mottle virus infection. Proteomics. 2004;4:216–25. doi: 10.1002/pmic.200300502. [DOI] [PubMed] [Google Scholar]
- 60.Zhang X, Wang X, Zhou G. A one-step real time RT-PCR assay for quantifying rice stripe virus in rice and in the small brown planthopper (Laodelphax striatellus Fallen) J Virol Methods. 2008;151:181–7. doi: 10.1016/j.jviromet.2008.05.024. [DOI] [PubMed] [Google Scholar]
- 61.Huang DW, Sherman BT, Lempicki RA. Systematic and integrative analysis of large gene lists using DAVID bioinformatics resources. Nat Protoc. 2009;4:44–57. doi: 10.1038/nprot.2008.211. [DOI] [PubMed] [Google Scholar]
- 62.Kanehisa M, Goto S, Sato Y, Kawashima M, Furumichi M, Tanabe M. Data, information, knowledge and principle: back to metabolism in KEGG. Nucleic Acids Res. 2014;42:D199–205. doi: 10.1093/nar/gkt1076. [DOI] [PMC free article] [PubMed] [Google Scholar]
- 63.Franceschini A, Szklarczyk D, Frankild S, Kuhn M, Simonovic M, Roth A, et al. STRING v9.1: protein-protein interaction networks, with increased coverage and integration. Nucleic Acids Res. 2013;41:D808–15. doi: 10.1093/nar/gks1094. [DOI] [PMC free article] [PubMed] [Google Scholar]
- 64.Liu B, Chen Z, Song X, Liu C, Cui X, Zhao X, et al. Oryza sativa Dicer-like4 reveals a key role for small interfering RNA silencing in plant development. Plant Cell. 2007;19:2705–18. doi: 10.1105/tpc.107.052209. [DOI] [PMC free article] [PubMed] [Google Scholar]
- 65.Zhang P, Mar TT, Liu WW, Li L, Wang XF. Simultaneous detection and differentiation of Rice black streaked dwarf virus (RBSDV) and Southern rice black streaked dwarf virus (SRBSDV) by duplex real time RT-PCR. Virol J. 2013;10:24. doi: 10.1186/1743-422X-10-24. [DOI] [PMC free article] [PubMed] [Google Scholar]
- 66.Livak KJ, Schmittgen TD. Analysis of relative gene expression data using real-time quantitative PCR and the 2−ΔΔCT Method. Methods. 2001;25:402–8. doi: 10.1006/meth.2001.1262. [DOI] [PubMed] [Google Scholar]
- 67.Russell DW, Sambrook J. Molecular cloning: a laboratory manual. Cold Spring Harbor Laboratory Press. 2001. [Google Scholar]