


Abstract
While phospho-proteomics studies have shed light on the dynamics of cellular signaling, they mainly describe global effects and rarely explore mechanistic details, such as kinase/substrate relationships. Tools and databases, such as NetworKIN and PhosphoSitePlus, provide valuable regulatory details on signaling networks but rely on prior knowledge. They therefore provide limited information on less studied kinases and fewer unexpected relationships given that better studied signaling events can mask condition- or cell-specific ‘network wiring’.
SELPHI is a web-based tool providing in-depth analysis of phospho-proteomics data that is intuitive and accessible to non-bioinformatics experts. It uses correlation analysis of phospho-sites to extract kinase/phosphatase and phospho-peptide associations, and highlights the potential flow of signaling in the system under study. We illustrate SELPHI via analysis of phospho-proteomics data acquired in the presence of erlotinib—a tyrosine kinase inhibitor (TKI)—in cancer cells expressing TKI-resistant and -sensitive variants of the Epidermal Growth Factor Receptor. In this data set, SELPHI revealed information overlooked by the reporting study, including the known role of MET and EPHA2 kinases in conferring resistance to erlotinib in TKI sensitive strains. SELPHI can significantly enhance the analysis of phospho-proteomics data contributing to improved understanding of sample-specific signaling networks. SELPHI is freely available via http://llama.mshri.on.ca/SELPHI.
INTRODUCTION
Protein phosphorylation is the major driver of cellular signaling in cells, leading to dynamic and complex network responses. Deregulation of these pathways is a major cause in many diseases including cancer, driving our need to understand them at the molecular interaction level.
Quantitative, large-scale phospho-proteomics studies (1,2) have uncovered signaling responses to a variety of environmental conditions and cell types. Typically, they infer global signaling changes using GO term/ Pathway enrichment analysis (3–5), identify over-represented motifs (6), use clustering to identify co-modulated sets of phospho-peptides, and map the modulated peptides onto known protein interactions networks (7). However, this type of analysis leaves a wealth of mechanistic information unexplored.
Several tools and databases, such as PhosphoSitePlus (8), NetworKIN (9) and KinomeXplorer (10) have been developed to extract regulatory details from high throughput data sets (Supplementary Table S1). Because these tools rely on existing knowledge, they provide valuable details on networks involving well-studied kinases or pathways. For example, NetPhorest (11) was used in the work of Olsen et al. (12) to predict kinase/substrate connections on a dynamic phospho-proteome map of the cell cycle. Reliance of this analysis on prior knowledge, however, makes these methods less able to reveal less studied pathways and unexpected condition-specific events, such as a novel kinase substrate recognition motif.
Network representations of phospho-profile correlations (13) can visualize co-changing phospho-peptides in a global phospho-proteomics data set, highlighting potential co-functioning groups and kinase-substrate relationships relevant to the conditions studied. In combination with methods described above that can predict kinase-substrate relationships and model networks (14), they can provide specific insights into the signaling network of interest.
Here we present SELPHI (Systematic Extraction of Linked PHospho-Interactions), a tool that aims to make the analysis of global phospho-proteomics data readily available to the non-bioinformatics expert. SELPHI performs a data-driven correlation analysis that focuses on relationships between kinases, phosphatases and other phospho-peptides in order to better understand the flow of cell signaling. The resulting correlation networks are applicable to any phospho-proteomics data set, and can be readily grasped intuitively. Because it integrates information from a wide range of databases and generates global correlation networks, SELPHI also provides an excellent starting point for bioinformaticians, allowing them to focus on more advanced or application-specific modeling.
MATERIALS AND METHODS
Interface input and analysis customization
SELPHI provides a user-friendly interface with extensive documentation. At minimum it requires two types of input: (i) the user's phospho-proteomics data, in the form of one or more Excel™ or tab-delimited text files. The required columns include the proteins identified, the modified peptide sequence and the (normalized) fold-change ratios of the phospho-peptide ion intensities in the samples. Optionally, users can specify the peptide intensity or score, which is then used to calculate a weighted mean of the fold-change ratios when merging identical peptides. (ii) Information about the proteins and sequence sites to which peptides map, either as a sequence database (in FASTA format), which SELPHI will use to extract this information, or if this is unavailable as (a) an Excel™ or tab-delimited text file with the ids listed in the ‘Proteins’ column of their input file followed by columns labeled UniprotID (listing the UniprotKB ID) and/or GeneID (listing the Entrez GeneID) and (b) a file mapping phospho-peptides to their corresponding sequence (e.g MAPK1_VADPDHDHTGFLpTEpYVATR MAPK1_Y187). We have developed a tool called SELPH-Convert to help the users convert their data reports to SELPHI-useable files (Supplementary Note 1). Several parameters (Table 1 and Supplementary Table S2) can be tuned to customize the analysis. For example the user can restrict the interactions integrated from STRING (15) or GeneMania (16) to only those that are supported by experimental, database (STRING) or physical interaction (GeneMania) evidence as opposed to all types of evidence, which would include e.g. text-mining.
Table 1. Main analysis customization input parameters and their default values (Full table of input options is presented in Supplementary Table S1).
| Parameter | Default | Description |
|---|---|---|
| Clustering method | NONE | Cluster phospho-peptides using either PCA & k-means (19) or mclust (20) |
| Ratio Cutoff | 3 | Threshold for phospho-peptide intensity ratio |
| Correlation Method | Spearman | Choose correlation index among Spearman, Pearson and Kendall tau. |
| Correlation Cutoff | 0.8–0.9 | Correlation coefficient threshold. Default 0.9 for Pearson, 0.8 for Spearman or Kendall tau |
| Correlation P-value Cutoff | 0.05 | Threshold for significance of correlation of phospho-peptide profiles |
Web server workflow and output
SELPHI's workflow is presented in Figure 1. If the user has provided protein sequences, SELPHI first pre-processes the input data to identify the associated UniprotKB ID (17) and phosphosite positions in the sequence and filters the data according to the fold change cutoff defined (default is 3-fold). Duplicate peptide identifications are merged using either their weighted average (if there is an intensity or score column available) or the value that represents the maximum change, according to the preferred user settings. Combined input data sets with less than two data points, defined as a ratio or intensity value acquired by a single sample, replicate and condition, are not processed by SELPHI, while the user can restrict their data to only peptides that appear in a minimum number of samples/conditions through the submission interface. There is no limit to the number of peptides in a data set. KEGG pathway (18) and GO Term (FuncAssociate 5) enrichment for the changed peptides is then calculated. The results are plotted as a clustered matrix of the over-represented pathways/GO terms against the samples (Figure 2A, B), colored by the additive (pathways) or average additive (GO terms) log-ratio of intensity for peptides belonging to that term for each sample and demonstrating the enrichment's effect size (log odds ratio) via the size of the box.
Figure 1.
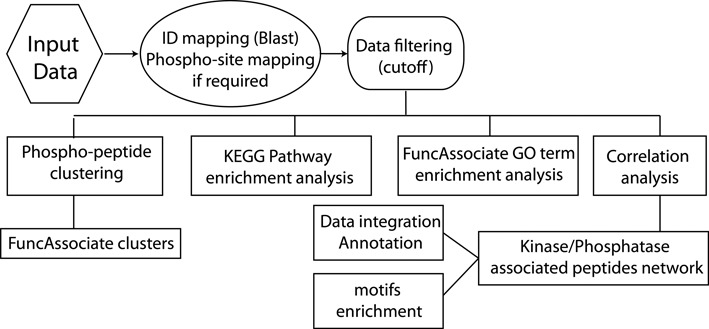
Workflow of SELPHI. SELPHI first identifies the UniprotKB IDs and sequence location of the input phosphosites. The data are then filtered according to the input cutoff and clustering, KEGG pathway/GO term enrichment analysis and correlation analysis is applied on the input data. The result is an exploratory representation of the global effects relating to cell pathways and functions, a network view of potentially relevant kinase/phosphatase/substrate associations with the likely flow of signaling, as well as motifs enriched in the data set.
Figure 2.
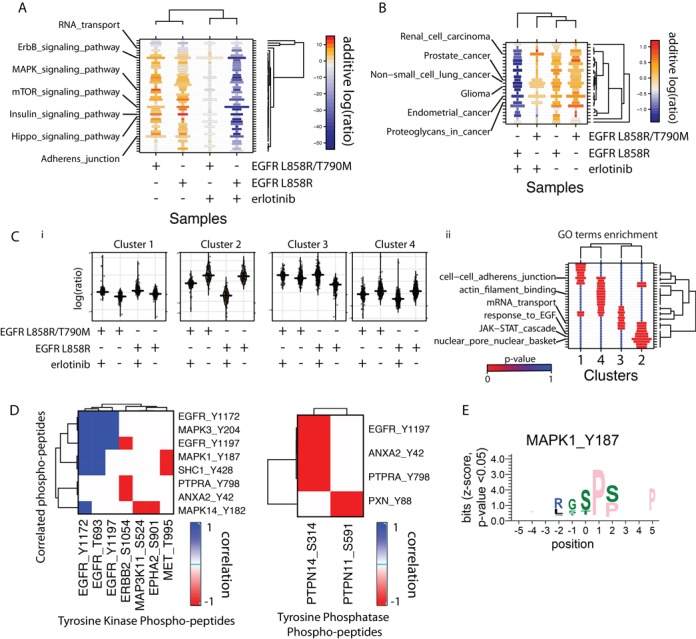
(A) Signaling Pathway and (B) Disease pathway enrichment in the modulated peptides of the case study data set comprising samples collected from adenocarcinoma cells expressing tyrosine kinase inhibitor (TKI) resistant and sensitive EGFR in the presence and absence of the TKI erlotinib (33). The size of the boxes represents the odds ratio of pathway enrichment and the color represents the sum of log(ratios) of the phospho-peptide in each condition shown in the x axis. Clustering was done according to the latter measure. (C) (i) Phospho-profile changes for the peptides in each cluster (ii) GO terms enrichment (5) for each cluster. (D) Heatmaps of correlations between tyrosine kinases and phosphatases and their associated phospho-peptides. (E) Logo (31) of significantly (P-value < 0.05) over-represented residues in the phospho-peptides associated with MAPK1 (Supplementary Table S6) in the case study against a background of 10000 random S/T/Y centered peptides from the non-redundant (at 40% sequence identity) human proteome.
When clustering the phospho-peptides, SELPHI uses either k-means clustering (19) to split the peptides into k groups (where k is defined by principal component analysis) or Normal Mixture Modeling (20). It subsequently performs GO term enrichment analysis, on each of these sub-clusters using FuncAssociate (5), plots the phospho-profiles of these clustered groups (Figure 2C), and then hierarchically clusters phospho-profiles to uncover additional groups of interest within these sub-clusters.
Correlation analysis, using a user-defined measure (Table 1), is then performed between all pairs of kinases/phosphatases in the set and the set of changed peptides (using R functions cor and cor.test). The kinases and phosphatases are defined as having at least one SMART (21) or Pfam (22) kinase domain in their sequence. SELPHI only performs a correlation analysis if there are three or more input data points for the phospho-peptides and uses the Pearson correlation coefficient if there are fewer than six. The Spearman correlation is used by default otherwise. These data points can be ratios (recommended) or normalized intensities, however they have to be consistent, i.e. the user can't mix both types of data. In the event that there are multiple replicates of the samples, the user can either treat them as separate data sets, or upload a file that defines which data points comprise replicates of the same sample and SELPHI will merge these points using either the average change or maximum change, according to the user's choice. Each correlation pair is then filtered by P-value (Table 1; Supplementary Note 2) and annotated with information integrated from external databases (Table 2) (6,8–10,15–16,18,23–27). If there is evidence supporting the pair and/or if the correlation meets the defined cutoff, then the pair is kept. The result is a heatmap (Figure 2D) of co-changing kinase/phosphatase phospho-peptides and other modulated phospho-peptides. These networks are provided both as files in text format and visualized in a Cytoscape web-app (28).
Table 2. Databases used to integrate information for annotation and filtering.
| Database/Tool | Description |
|---|---|
| GeneMania (16) | Database of functional association networks |
| PhosphoSitePlus (8) | Database of phospho-sites, including kinase-substrate information and role of phosphorylation on function |
| PhosphoELM (23) | Database of phospho-sites and kinase-substrate relationships |
| KEGG Pathways (18) | Database of curated pathways |
| Animal TFDB (24) | Database of animal transcription factors and binding sites |
| nTFdb (25) | Database of worm transcription factors |
| YEASTRACT (26) | Database of yeast transcription factors and binding sites |
| ELM (6) | Database of Eukaryotic Linear Motifs |
| NetworKIN (9,10) | Tool to predict kinase/substrate relationships |
| STRING (15) | Database of protein associations and interactions |
| ProteoConnections (27) | Data integration tool for proteomics data (SELPHI uses the motifs list) |
Finally, SELPHI calculates motif enrichment (29) amongst peptides associated with each kinase. The phospho-peptides are centered at the modified residue and ± 5 amino acids from the protein sequence surrounding the residue are included. The background sequences relative to which enrichment is calculated comprise 10000 random peptides, 11 amino acids long, centered at a serine/threonine or tyrosine, and extracted from the corresponding proteome (human, mouse or yeast) after redundancy reduction at 40% sequence identity using cd-hit (17,30). No bias for specific residues was found when using random vs in silico digested tryptic peptides as background. The results are presented as logos (31).
All the clustered matrices are leaf-order-optimized using R package cba (v.0.2-14) and all output files remain downloadable for at least one week (Supplementary Table S3).
Web server implementation
SELPHI is mounted through a custom Node.js (http://nodejs.org/) webserver. After the data are uploaded through the web form, the server submits child processes that launch SELPHI (perl and R). The output association networks are converted into a JSON object using an R script, allowing their seamless integration into the Cytoscape.js (28) library and the creation of a webpage (linked through the results page) with dynamic functions (zooming, moving nodes, coloring according to phospho-profiles).
RESULTS
Sample data set: epidermal growth factor receptor case study
The Epidermal Growth Factor Receptor (EGFR) is a receptor tyrosine kinase, involved in cell adhesion, migration and proliferation. EGFR has been extensively studied due to its high mutation rates in lung and other cancers (32). Here we use a global phospho-proteomics data set reported by Zhang and coworkers (33) to illustrate the use of SELPHI. In this data set, lung adenocarcinoma cells expressing EGFRL858R or EGFRL858R/T790M variants—which are respectively sensitive and resistant to tyrosine kinase inhibitors (TKI)—were exposed to the TKI erlotinib with and without EGF stimulation. We submitted these data sets to SELPHI, using as cutoff the same fold-change ratio (1.5) as the authors.
First, SELPHI performs pathway enrichment analysis, finding ErbB, Insulin Receptor, mTOR signaling, and other pathways (Figure 2A) to be enriched amongst the changed phospho-peptides, consistent with the results of the original publication (33). The SELPHI-based visualization of the enrichment highlights the differences between the TKI-resistant and -sensitive strains. For example, as shown in Figure 2B, erlotinib was identified as having an effect on the KEGG (18) ‘Non small cell lung cancer pathway’ for sensitive strains, but clearly not for resistant EGFR-mutated strains. The TKI-resistant EGFRL858R/T790M mutant is a frequent adaptation to prolonged treatment of non small-cell lung cancer with erlotinib (34). We observe a similar result for prostate cancer and other cancer types. Similar results are also obtained with the GO term enrichment analysis (Supplementary Figure S1).
Next, the peptides were grouped into four clusters (19). Figure 2C shows the changes in the phospho-peptides in these groups for each condition. GO term enrichment analysis was performed in each of the clusters uncovering the subgroups enriched in functions such as cytoskeletal organization or RNA processing and transport. Clusters 1 and 2 yielded significant (P-value 0.002 and 8.2*10−9 respectively) over-representation of proteins that are known to interact (15), suggesting functional relevance of the clusters.
SELPHI identifies phospho-peptides with correlated log-ratios of phospho-peptide intensity (see Methods section). Among 40421 potentially correlated pairs, 641 are either known interactions or have a known (35) or predicted (36) kinase-substrate relationship (NetworKIN cutoff = 2.5). We were able to recover 90 of the known relationships within our 3656 (correlation P-value < 0.05) significantly correlated pairs. This represents a significant enrichment of known interactions in the filtered set (Fisher's Exact test P-value 1.5e-05, odds ratio = 1.6), supporting the use of phospho-profile correlation analysis to extract association information between kinases/phosphatases and modulated phospho-peptides, even when the available data points are very few, like in our example, thus reducing the statistical power of the approach (Supplementary Note 2, Supplementary Figure S3). Using the entire SELPHI pipeline the final data set included 119 of the known or predicted interactions, representing an even higher enrichment (Fisher's Exact test P-value < 2.2e-016, odds ratio = 2.6). The remaining known relationships were missed, perhaps due in part to the experimental conditions used or due to strict filtering, which is user-adjustable.
Annotation and filtering of kinase/phosphatase—phospho-peptide pairs based on data integrated from public databases (see Methods) result in 3285 candidate relationships. For easier interpretation SELPHI focuses on the peptides associated with tyrosine kinase phospho-peptides, which are likely to occur upstream in the pathway and might represent kinase-substrate relationships or direct consequences of the EGFR phosphorylation. The sites with most associations clearly stand out in this representation indicating phospho-sites that are potential drivers of pathway progression, rather than random effects from downstream pathways or sample preparation. In this case study (Figure 2D), we observe that SELPHI correctly associates EGFR with its known effector SHC1 (37), and with MAPK1, MAPK3 and MAPK14, in agreement with activation of the MAP kinase pathway known to result from EGF stimulation. All three identified EGFR phospho-sites are known to activate its kinase activity (8). The Y1197 site is also associated with the phosphatase PTPN14. The Hippo pathway protein YAP, knock-down of which sensitizes cancer cells to erlotinib, is known to be negatively regulated via the PPxY motif of PTPN14 (38). The results of the SELPHI analysis suggest a cancer-cell relevant feedback mechanism with PTPN14 reducing EGFR activation, perhaps through crosstalk with the Hippo pathway.
MET and EPHA2 receptor tyrosine kinases seem to be strongly anti-correlated with MAPK1, and MAPK14. The MET phospho-peptide is reduced in all conditions except in the presence of erlotinib and EGF stimulation in the TKI sensitive strain. MET activity is increased in non-small lung cell carcinomas that are being treated with erlotinib (39,40), potentially conferring resistance to this drug. This is supported by the negative correlation of this kinase with the main signaling branches that are down regulated by erlotinib treatment. EPHA2 is also stabilized by kinase-inhibited EGFR contributing to TKI cancer cell resistance (40). Similar information can be extracted from the downstream serine/threonine phospho-network (Supplementary Note 3, Supplementary Table S4, Figure S2) and the association of kinases with phospho-peptides of transcription factors is also available (Supplementary Table S5; Supplementary Note 4).
Finally SELPHI searches for enriched motifs that have functional significance suggesting the overall kinase specificity and the generation of phospho-binding sites for a specific protein target in these conditions. For example, we identify the known MAPK recognition site XXX(ST)PXX (6)(Figure 2E).
DISCUSSION
We have developed SELPHI to enable accessible, automated analysis and interpretation of global phospho-proteomics data for non-bioinformaticians. Beyond the analysis of novel data, this also allows the analysis and integration of data sets published in the literature to uncover previously overlooked information on a signaling system. For example, the role of EGF signaling on RNA processing has been reported in other studies (41), but was not reported in the work we re-analyzed as a case study. Another previously overlooked observation was that MET and EPHA2 are negatively correlated with the phosphorylation of the SHC1 and MAPK1 phospho-peptides. SELPHI highlights such dependencies and presents them in a way that allows for the straightforward suggestion of candidate signaling component relationships.
The intuitive submission form of SELPHI enables the user to apply a default analysis to their data but also provides control over most major parameters, giving flexibility to customize the analysis according to the data and purpose, e.g. exploratory analysis or formation of testable hypotheses.
SELPHI's correlation analysis displays kinases/phosphatases and associated phospho-peptides in easily interpretable heatmaps and networks. Although suggested kinase networks do not necessarily represent direct kinase/substrate relationships and may have many false positives, they provide an important starting filter for a user to further apply their own domain knowledge and discover condition-specific kinase-substrate relationships. Phospho-modifications of kinases that potentially alter activity should exhibit stronger and more abundant correlations with other phospho-peptides, and it is therefore possible through SELPHI to identify potential information flows from receptor tyrosine kinases all the way to transcriptional factors. Moreover, in combination with all the annotation provided by SELPHI, modeling of signaling pathways can be greatly simplified and accelerated. Toward interaction modeling, identification of enriched sequence patterns can provide insights into kinase specificity and substrate preferences.
We expect that SELPHI will contribute to enhanced use of published and novel phospho-proteomics data, facilitating more detailed visualization, modeling and understanding of cell type- and condition-specific cellular signaling.
AVAILABILITY
SELPHI is freely available at http://llama.mshri.on.ca/SELPHI.
SUPPLEMENTARY DATA
Supplementary Data are available at NAR Online.
Acknowledgments
The authors would like to acknowledge Jochen Weile for useful discussions and feedback.
Footnotes
Deceased.
FUNDING
Ontario Research Fund Research Excellence [RE-05-029, GL2-01-025 to T.P. ORF-RE-037 to T.P. and F.P.R.]; Krembil Foundation; NIH/NHGRI [HG001715, HG004233]; Canada Excellence Research Chairs Program; Avon Foundation. Canadian Institutes of Health Research [MOP-6849 to T.P.]. Funding for open access charge: Canada Excellence Research Chairs Program.
Conflict of interest statement. None declared.
REFERENCES
- 1.Macek B., Mann M., Olsen J.V. Global and site-specific quantitative phosphoproteomics: principles and applications. Annu. Rev. Pharmacol. Toxicol. 2009;49:199–221. doi: 10.1146/annurev.pharmtox.011008.145606. [DOI] [PubMed] [Google Scholar]
- 2.Schmelzle K., White F.M. Phosphoproteomic approaches to elucidate cellular signaling networks. Curr. Opin. Biotechnol. 2006;17:406–414. doi: 10.1016/j.copbio.2006.06.004. [DOI] [PubMed] [Google Scholar]
- 3.Pan C., Olsen J.V., Daub H., Mann M. Global effects of kinase inhibitors on signaling networks revealed by quantitative phosphoproteomics. Mol. Cell. Proteomics. 2009;8:2796–2808. doi: 10.1074/mcp.M900285-MCP200. [DOI] [PMC free article] [PubMed] [Google Scholar]
- 4.Huang da W., Sherman B.T., Lempicki R.A. Systematic and integrative analysis of large gene lists using DAVID bioinformatics resources. Nat. Protoc. 2009;4:44–57. doi: 10.1038/nprot.2008.211. [DOI] [PubMed] [Google Scholar]
- 5.Berriz G.F., Beaver J.E., Cenik C., Tasan M., Roth F.P. Next generation software for functional trend analysis. Bioinformatics. 2009;25:3043–3044. doi: 10.1093/bioinformatics/btp498. [DOI] [PMC free article] [PubMed] [Google Scholar]
- 6.Dinkel H., Van Roey K., Michael S., Davey N.E., Weatheritt R.J., Born D., Speck T., Kruger D., Grebnev G., Kuban M., et al. The eukaryotic linear motif resource ELM: 10 years and counting. Nucleic Acids Res. 2014;42:D259–D266. doi: 10.1093/nar/gkt1047. [DOI] [PMC free article] [PubMed] [Google Scholar]
- 7.Berriz G.F., King O.D., Bryant B., Sander C., Roth F.P. Characterizing gene sets with FuncAssociate. Bioinformatics. 2003;19:2502–2504. doi: 10.1093/bioinformatics/btg363. [DOI] [PubMed] [Google Scholar]
- 8.Hornbeck P.V., Zhang B., Murray B., Kornhauser J.M., Latham V., Skrzypek E. PhosphoSitePlus, 2014: mutations, PTMs and recalibrations. Nucleic Acids Res. 2014;43:D512–D520. doi: 10.1093/nar/gku1267. [DOI] [PMC free article] [PubMed] [Google Scholar]
- 9.Linding R., Jensen L.J., Ostheimer G.J., van Vugt M.A., Jorgensen C., Miron I.M., Diella F., Colwill K., Taylor L., Elder K., et al. Systematic discovery of in vivo phosphorylation networks. Cell. 2007;129:1415–1426. doi: 10.1016/j.cell.2007.05.052. [DOI] [PMC free article] [PubMed] [Google Scholar]
- 10.Horn H., Schoof E.M., Kim J., Robin X., Miller M.L., Diella F., Palma A., Cesareni G., Jensen L.J., Linding R. KinomeXplorer: an integrated platform for kinome biology studies. Nat. Methods. 2014;11:603–604. doi: 10.1038/nmeth.2968. [DOI] [PubMed] [Google Scholar]
- 11.Miller M.L., Jensen L.J., Diella F., Jorgensen C., Tinti M., Li L., Hsiung M., Parker S.A., Bordeaux J., Sicheritz-Ponten T., et al. Linear motif atlas for phosphorylation-dependent signaling. Sci. Signal. 2008;1:ra2. doi: 10.1126/scisignal.1159433. [DOI] [PMC free article] [PubMed] [Google Scholar]
- 12.Olsen J.V., Vermeulen M., Santamaria A., Kumar C., Miller M.L., Jensen L.J., Gnad F., Cox J., Jensen T.S., Nigg E.A., et al. Quantitative phosphoproteomics reveals widespread full phosphorylation site occupancy during mitosis. Sci. Signal. 2010;3:ra3. doi: 10.1126/scisignal.2000475. [DOI] [PubMed] [Google Scholar]
- 13.Imamura H., Yachie N., Saito R., Ishihama Y., Tomita M. Towards the systematic discovery of signal transduction networks using phosphorylation dynamics data. BMC Bioinforms. 2010;11:232–242. doi: 10.1186/1471-2105-11-232. [DOI] [PMC free article] [PubMed] [Google Scholar]
- 14.Zhang Y., Kweon H.K., Shively C., Kumar A., Andrews P.C. Towards systematic discovery of signaling networks in budding yeast filamentous growth stress response using interventional phosphorylation data. PLoS Comput. Biol. 2013;9:e1003077. doi: 10.1371/journal.pcbi.1003077. [DOI] [PMC free article] [PubMed] [Google Scholar]
- 15.Szklarczyk D., Franceschini A., Wyder S., Forslund K., Heller D., Huerta-Cepas J., Simonovic M., Roth A., Santos A., Tsafou K.P., et al. STRING v10: protein-protein interaction networks, integrated over the tree of life. Nucleic Acids Res. 2015;43:D447–D452. doi: 10.1093/nar/gku1003. [DOI] [PMC free article] [PubMed] [Google Scholar]
- 16.Zuberi K., Franz M., Rodriguez H., Montojo J., Lopes C.T., Bader G.D., Morris Q. GeneMANIA prediction server 2013 update. Nucleic Acids Res.. 2013;41:W115–W122. doi: 10.1093/nar/gkt533. [DOI] [PMC free article] [PubMed] [Google Scholar]
- 17.UniProt Consortium. UniProt: a hub for protein information. Nucleic Acids Res. 2015;43:D204–D212. doi: 10.1093/nar/gku989. [DOI] [PMC free article] [PubMed] [Google Scholar]
- 18.Kanehisa M., Goto S. KEGG: kyoto encyclopedia of genes and genomes. Nucleic Acids Res. 2000;28:27–30. doi: 10.1093/nar/28.1.27. [DOI] [PMC free article] [PubMed] [Google Scholar]
- 19.de Hoon M.J., Imoto S., Nolan J., Miyano S. Open source clustering software. Bioinformatics. 2004;20:1453–1454. doi: 10.1093/bioinformatics/bth078. [DOI] [PubMed] [Google Scholar]
- 20.Fraley C., Raftery A., Brendan T.M., Scrucca L. Technical Report no.597. University of Washington; 2012. MCLUST Version 4 for R: Normal Mixture Modeling for Model-Based Clustering, Classification, and Density Estimation. [Google Scholar]
- 21.Letunic I., Doerks T., Bork P. SMART: recent updates, new developments and status in 2015. Nucleic Acids Res. 2015;43:D257–D260. doi: 10.1093/nar/gku949. [DOI] [PMC free article] [PubMed] [Google Scholar]
- 22.Finn R.D., Bateman A., Clements J., Coggill P., Eberhardt R.Y., Eddy S.R., Heger A., Hetherington K., Holm L., Mistry J., et al. Pfam: the protein families database. Nucleic Acids Res. 2014;42:D222–D230. doi: 10.1093/nar/gkt1223. [DOI] [PMC free article] [PubMed] [Google Scholar]
- 23.Dinkel H., Chica C., Via A., Gould C.M., Jensen L.J., Gibson T.J., Diella F. Phospho.ELM: a database of phosphorylation sites–update 2011. Nucleic Acids Res. 2011;39:D261–D267. doi: 10.1093/nar/gkq1104. [DOI] [PMC free article] [PubMed] [Google Scholar]
- 24.Zhang H.-M., Chen H., Liu W., Liu H., Gong J., Wang H., Guo A.-Y. AnimalTFDB: a comprehensive animal transcription factor database. Nucleic Acids Res. 2012;40:D144–D149. doi: 10.1093/nar/gkr965. [DOI] [PMC free article] [PubMed] [Google Scholar]
- 25.Haerty W., Artieri C., Khezri N., Singh R.S., Gupta B.P. Comparative analysis of function and interaction of transcription factors in nematodes: extensive conservation of orthology coupled to rapid sequence evolution. BMC Genomics. 2008;9:399–414. doi: 10.1186/1471-2164-9-399. [DOI] [PMC free article] [PubMed] [Google Scholar]
- 26.Teixeira M.C., Monteiro P.T., Guerreiro J.F., Goncalves J.P., Mira N.P., dos Santos S.C., Cabrito T.R., Palma M., Costa C., Francisco A.P., et al. The YEASTRACT database: an upgraded information system for the analysis of gene and genomic transcription regulation in Saccharomyces cerevisiae. Nucleic Acids Res. 2014;42:D161–D166. doi: 10.1093/nar/gkt1015. [DOI] [PMC free article] [PubMed] [Google Scholar]
- 27.Courcelles M., Lemieux S., Voisin L., Meloche S., Thibault P. ProteoConnections: a bioinformatics platform to facilitate proteome and phosphoproteome analyses. Proteomics. 2011;11:2654–2671. doi: 10.1002/pmic.201000776. [DOI] [PubMed] [Google Scholar]
- 28.Shannon P., Markiel A., Ozier O., Baliga N.S., Wang J.T., Ramage D., Amin N., Schwikowski B., Ideker T. Cytoscape: a software environment for integrated models of biomolecular interaction networks. Genome Res. 2003;13:2498–2504. doi: 10.1101/gr.1239303. [DOI] [PMC free article] [PubMed] [Google Scholar]
- 29.Colaert N., Helsens K., Martens L., Vandekerckhove J., Gevaert K. Improved visualization of protein consensus sequences by iceLogo. Nat. Methods. 2009;6:786–787. doi: 10.1038/nmeth1109-786. [DOI] [PubMed] [Google Scholar]
- 30.Fu L., Niu B., Zhu Z., Wu S., Li W. CD-HIT: accelerated for clustering the next-generation sequencing data. Bioinformatics. 2012;28:3150–3152. doi: 10.1093/bioinformatics/bts565. [DOI] [PMC free article] [PubMed] [Google Scholar]
- 31.Crooks G.E., Hon G., Chandonia J.M., Brenner S.E. WebLogo: a sequence logo generator. Genome Res. 2004;14:1188–1190. doi: 10.1101/gr.849004. [DOI] [PMC free article] [PubMed] [Google Scholar]
- 32.Herbst R.S. Review of epidermal growth factor receptor biology. Int. J. Radiat. Oncol. Biol. Phys. 2004;59:21–26. doi: 10.1016/j.ijrobp.2003.11.041. [DOI] [PubMed] [Google Scholar]
- 33.Zhang X., Belkina N., Jacob H.K., Maity T., Biswas R., Venugopalan A., Shaw P.G., Kim M.S., Chaerkady R., Pandey A., et al. Identifying novel targets of oncogenic EGF receptor signaling in lung cancer through global phosphoproteomics. Proteomics. 2015;15:340–355. doi: 10.1002/pmic.201400315. [DOI] [PMC free article] [PubMed] [Google Scholar]
- 34.Pao W., Miller V.A., Politi K.A., Riely G.J., Somwar R., Zakowski M.F., Kris M.G., Varmus H. Acquired resistance of lung adenocarcinomas to gefitinib or erlotinib is associated with a second mutation in the EGFR kinase domain. PLoS Med. 2005;2:e73. doi: 10.1371/journal.pmed.0020073. [DOI] [PMC free article] [PubMed] [Google Scholar]
- 35.Hornbeck P.V., Kornhauser J.M., Tkachev S., Zhang B., Skrzypek E., Murray B., Latham V., Sullivan M. PhosphoSitePlus: a comprehensive resource for investigating the structure and function of experimentally determined post-translational modifications in man and mouse. Nucleic Acids Res. 2012;40:D261–D270. doi: 10.1093/nar/gkr1122. [DOI] [PMC free article] [PubMed] [Google Scholar]
- 36.Linding R., Jensen L.J., Pasculescu A., Olhovsky M., Colwill K., Bork P., Yaffe M.B., Pawson T. NetworKIN: a resource for exploring cellular phosphorylation networks. Nucleic Acids Res. 2008;36:D695–D699. doi: 10.1093/nar/gkm902. [DOI] [PMC free article] [PubMed] [Google Scholar]
- 37.Zheng Y., Zhang C., Croucher D.R., Soliman M.A., St-Denis N., Pasculescu A., Taylor L., Tate S.A., Hardy W.R., Colwill K., et al. Temporal regulation of EGF signalling networks by the scaffold protein Shc1. Nature. 2013;499:166–171. doi: 10.1038/nature12308. [DOI] [PMC free article] [PubMed] [Google Scholar]
- 38.Huang J.M., Nagatomo I., Suzuki E., Mizuno T., Kumagai T., Berezov A., Zhang H., Karlan B., Greene M.I., Wang Q. YAP modifies cancer cell sensitivity to EGFR and survivin inhibitors and is negatively regulated by the non-receptor type protein tyrosine phosphatase 14. Oncogene. 2013;32:2220–2229. doi: 10.1038/onc.2012.231. [DOI] [PMC free article] [PubMed] [Google Scholar]
- 39.Bean J., Brennan C., Shih J.Y., Riely G., Viale A., Wang L., Chitale D., Motoi N., Szoke J., Broderick S., et al. MET amplification occurs with or without T790M mutations in EGFR mutant lung tumors with acquired resistance to gefitinib or erlotinib. Proc. Natl. Acad. Sci. U.S.A. 2007;104:20932–20937. doi: 10.1073/pnas.0710370104. [DOI] [PMC free article] [PubMed] [Google Scholar]
- 40.Gusenbauer S., Vlaicu P., Ullrich A. HGF induces novel EGFR functions involved in resistance formation to tyrosine kinase inhibitors. Oncogene. 2013;32:3846–3856. doi: 10.1038/onc.2012.396. [DOI] [PubMed] [Google Scholar]
- 41.Omerovic J., Hammond D.E., Prior I.A., Clague M.J. Global snapshot of the influence of endocytosis upon EGF receptor signaling output. J. Proteome Res. 2012;11:5157–5166. doi: 10.1021/pr3007304. [DOI] [PubMed] [Google Scholar]
Associated Data
This section collects any data citations, data availability statements, or supplementary materials included in this article.