

Abstract
Metabolomics, the quantification of small biochemicals in plasma and tissues, can provide insight into complex biochemical processes and enable the identification of biomarkers that may serve as therapeutic targets. We hypothesized that the plasma metabolome of asthma would reveal metabolic consequences of the specific immune and inflammatory responses unique to endotypes of asthma.
The plasma metabolomic profiles of 20 asthmatic subjects and 10 healthy controls were examined using an untargeted global and focused metabolomic analysis. Individuals were classified based upon clinical definitions of asthma severity or by levels of fraction of exhaled nitric oxide (FENO), a biomarker of airway inflammation.
Of the 293 biochemicals identified in the plasma, 25 were significantly different among asthma and healthy controls (p<0.05). Plasma levels of taurine, lathosterol, bile acids (taurocholate and glycodeoxycholate), nicotinamide, and adenosine-5-phosphate, were significantly higher in asthmatics compared with healthy controls. Severe asthmatics had biochemical changes related to steroid and amino acid/protein metabolism. Asthmatics with high FENO, compared with those with low FENO, had higher levels of plasma branched chain amino acids and bile acids.
Asthmatics have a unique plasma metabolome that distinguishes them from healthy controls and points to activation of inflammatory and immune pathways. The severe asthmatic and high FENO asthmatic have unique endotypes that suggest changes in NO-associated taurine transport and bile acid metabolism.
INTRODUCTION
Asthma is a common chronic disorder of the airways, characterized by the presence of inflammation and airway remodeling. The pathogenesis of asthma involves complex interactions of various cell types (immune, airway epithelial and smooth muscle, and inflammatory cells) and numerous biologically active pro-inflammatory mediators (1–3). Amongst these, there is evidence to suggest that cytokines (TNFα, IFNγ, IL13, IL4), endogenous reactive oxygen (ROS) and nitrogen species (RNS) such as hydrogen peroxide, superoxide and nitric oxide (NO) are responsible for the inflammation and tissue damage of asthma (1–3). The causes of asthma remain incompletely understood, however, based upon clinical, functional and biochemical profiles, it is apparent that asthma is the result of a broad range of immunological, inflammatory and biochemical perturbations.
NO and TH2 (T helper cell 2) responses are recognized as fundamental to the pathophysiology of asthma. Patients have been categorized into phenotypes of low -TH2 and high-TH2, the latter having been proposed as useful to apply biologic therapies (anti-IL5 or anti-IL13) targeting TH2 pathways (4–8). In general, the fraction of NO in expired air (FENO) is high in asthmatic populations as compared with healthy controls (6, 9), indicates a TH2 eosinphilic inflammation and predicts clinical response to inhaled or oral glucocorticoids (6). NO is produced in the airways by the inducible NO synthase, which is induced by the high levels of cytokines in the inflamed airways. However, asthmatics also may have low or normal levels of FENO, and little is known of this asthma phenotype.
The diagnosis of asthma is currently based on assessment of symptoms and physiological tests of airway reactivity (7). These measurements do not precisely reveal the biology of inflammation and bronchoconstriction. Metabolomics is a high-throughput method of rapidly assessing the impact of a disease state on tissue/organ and on the whole-body (10–13). By quantifying small molecules, that are the products of disparate metabolic pathways, metabolomics can reveal the relative activity of each pathway. (10–13). We postulated that the plasma metabolome of asthma would reveal metabolic consequences of the specific immune and inflammatory response. In this pilot study we report the metabolomic profile of subjects with asthma and compare it with healthy controls. We subgroup asthmatics clinically by standardized definitions of severity of asthma or by levels of FENO to examine whether specific metabolomic endotypes can identify the altered biochemical pathways in these defined groups.
METHODS
Study Population
The study population included 20 asthmatics (10 nonsevere and 10 severe) and 10 healthy controls. The severity of asthma i.e. severe and nonsevere was defined as per the proceedings of the American Thoracic Society Workshop on Refractory Asthma, with major and minor characteristics (14). Briefly, major characteristics for severe asthma include (1) treatment with continuous or near continuous oral corticosteroids, and/or (2) high dose inhaled corticosteroids. The minor criteria are as follow: (1) daily treatment with other medication in addition to inhaled corticosteroids; (2) use of short-acting beta-agonist on a daily or near daily basis; (3) persistent airway obstruction [FEV1>80% predicted and diurnal peak expiratory flow (PEF) variability >20%]; (4) one or more urgent care visits for asthma per year; (5) three or more oral corticosteroid bursts per year; (6) prompt deterioration with reduction in oral or inhaled corticosteroid dose; (7) near-fatal asthma event in the past. Subjects met criteria for severe asthma with at least 1 major and at least 2 minor criteria. Inclusion criteria for healthy control subjects were (1) lack of cardiopulmonary symptoms, (2) normal baseline spirometry, and (3) a negative methacholine challenge test (defined as less than 20% decline in FEV1 with the maximum dose of methacholine). Exclusion criteria included current smoking history, or smoking history within one year, former smokers with greater than 5 pack-year total history, pregnancy and human immunodeficiency virus infection. Separate from the subclass of nonsevere and severe asthma, we also grouped asthmatics based upon high (≥35ppb) or low (<35 ppb) FENO according to ATS guidelines (4, 15, 16). Plasma samples in EDTA had been obtained from the study subjects randomly at time of study visit, and not following any specific period of fasting or any dietary preparation. The protocol was approved by the Cleveland Clinic Institutional Review Board and all participants provided informed consent.
Metabolomic analysis
Non-targeted metabolomic analysis was performed at Metabolon Inc., Durham, N.C., USA. The global, unbiased platform was based on a combination of three separate platforms: ultrahigh performance liquid chromatography/tandem mass spectrometry (UHLC/MS/MS) optimized for basic species, UHLC/MS/MS optimized for acidic species, and gas chromatography/mass spectrometry (GC/MS). The major components of the analytic process and of the analytic platform have been described in detail in previous publications (10, 12). UHLPC/MS/MS analysis utilized a Waters Acquity UHPLC (Waters Corporation, Milford, MA) coupled to an LTQ mass spectrometer (Thermo Fisher Scientific, Inc., Waltham, MA) equipped with an electrospray ionization source. Two separate injections were performed on each sample: one optimized for positive ions and one for negative ions. Derivatized samples for GC/MS were analyzed on a Thermo-Finnigan Trace DSQ fast-scanning single-quadrupole MS operated at unit mass resolving power. Chromatographic separation followed by full scan mass spectra was carried to record retention time, mass to charge (m/z) ratio and MS/MS of all detectable ions present in the samples. Compounds were identified by automated comparison to Metabolon’s reference library entries. Identification of known chemical entities was based on comparison with Metabolon’s library entries of purified standards.
Data was normalized to correct for variation resulting from instrument inter-day tuning differences. Raw areas counts for a compound were divided by the median value, setting the medians equal for each day’s run. Missing values were assumed to result from areas being below the limits of detection. Missing values for a given compound were imputed with half the observed minimum after the normalization step. Quantitative values were derived from integrated raw detector counts of the mass spectrometers. Importantly, while peak area comparisons between samples represent relative amounts of each ion detected, different compounds and ions have different ionization potentials. To preserve all of the variation, yet allow compounds of widely different raw peak areas to be compared directly on a similar graphic scale, a simple arithmetic transformation was performed in which each data point was divided by the mean of the entire set for that compound.
Amino acid analysis
Plasma amino acid concentrations were measured using high performance liquid chromatography (Agilent 1100 series HPLC; Agilent Technologies; Wilmington, DE), following OPA (ortho-phthalaldehyde) derivatization using a fluorescent detector as described previously (17)
Cytokine analyses
Plasma cytokines were measured using Human Cytokines/Chemokines kit from Lincoplex®: Multiplexed Biomarker Immunoassays. Each sample from a formatted 96-well plate was drawn into the flow-based Bio-Plex array reader (Bio-Rad Laboratories, Inc. Hercules, Ca.) in which analytes were identified & quantified. Bio-plex Manager software automated the data analysis.
Apoptosis analysis
Apoptosis-associated caspase-cleaved keratin-18 (ccK18) was measured in the plasma using M30 Apoptosense ELISA kit (Enzo Life Science, Farmingdale, NY)
Statistical analysis
Statistical analysis of the maetabolomic data have been described previously (12) Briefly, statistical analysis was performed using either JMP (SAS, Cary, NC) and “R” (http://cran.r-project.org), a freely available open-source software package. The observed relative concentration of each biochemical was log transformed and imputed with minimum observed values for that compound. Welch’s two-sample t-test was used to identify biochemicals that differed significantly between non-severe asthma, severe asthma and healthy control, as well as between healthy controls, high and low FENO asthmatics. A significance level of 0.05 was used. When the p-value is less than 0.05, we have enough evidence to conclude that the population means are statistical significant. An estimate of the false discovery rate (q-value) was calculated to take into account the multiple comparisons that normally occur in metabolomic-based studies; as q-values were reasonable for p≤0.05, no q-value cutoff was established for this study. Correlations were assessed using a linear model.
RESULTS
The study included 20 asthmatics and 10 healthy control subjects. The clinical characteristics of the study subjects are shown in Table I. Age, gender and ethnicity distribution were similar amongst the healthy controls and asthmatics. The BMI of subjects with asthma was significantly higher than healthy controls [Table I]. None of the asthmatics had overt diabetes or were receiving any anti-diabetic medication. As anticipated the pulmonary function of asthmatics were lower than controls. Subjects with severe asthma were older, had higher BMI and worse lung function as compared with nonsevere asthmatics [Table II]. All severe asthmatics received high dose of inhaled or oral corticosteroids either singly or in combination with long acting beta agonists [Table II]. Nonsevere asthmatics did not receive any corticosteroids or long acting beta agonists and received inhaled beta agonist (rescue medication) infrequently but less than 2 times per week. Nonsevere asthmatics were well controlled (AQLQ above 5) and had significantly better lung function than severe asthmatics [Table II]. Sixty seven percent (6/9) of nonsevere subjects and 33% (3/9) of severe asthmatics had high FENO (≥35 ppm); 2 individuals did not undergo exhaled NO measurements.
Table I.
Demographics, Pulmonary function and Cytokines for all subjects
| Healthy Control (n=10) | Asthma (n=20) | |
|---|---|---|
| Demographics | ||
| Age (yr) | 35.1 ± 3.8 | 37.6 ± 2.6 |
| Gender (M/F) | 4/6 | 9/11 |
| Ethnicity (Non-hispanic/Hispanic) | 10/0 | 17/3 |
| Race (AA/CC/others) | 2/7/1 | 9/10/1 |
| Duration of asthma (yrs) | N/A | 24.8 ± 2.9 |
| BMI | 25.9 ± 1.8 | 30.4 ± 1.4* |
| AQLQ | 7 ± 0.0 | 4.53 ± 0.31* |
| Blood counts | ||
| Total cell count (x106) | 5.1 ± 0.4 | 6.0 ± 0.5 |
| Eosinophils (%) | 2.67 ± 0.4 | 4.27 ±0.6* |
| Lung Functions | ||
| FEV1 (L) | 3.56 ± 0.18 | 2.60 ± 1.0* |
| FEV1, % | 99.4 ± 5.8 | 76.0 ± 4.5* |
| FVC (L) | 4.63 ± 0.29 | 3.70 ± 0.3 * |
| FVC, % | 106.5 ± 4.6 | 92.0 ± 4.5* |
| FEV1/FVC | 0.77 ± 0.02 | 0.70 ± 0.02 |
| FENO, ppb | 18.3 ± 1.8 | 37.6 ± 6.4 |
| PC20 | N/A | 2.02 ± 0.53 |
| Asthma Phenotypes | ||
| Severity (% severe asthmatics) | 50 | |
| FENO (% asthmatics with FENO ≥35ppb) | - | 45 |
| Cytokines | ||
| Interleukin-6 (pg/ml) | 3.45 ± 1.1 | 2.49 ± 0.77 |
| Interleukin-8 (pg/ml) | 2.27 ± 0.46 | 2.61 ± 0.23 |
| TNF-α (pg/ml) | 4.00 ± 0.46 | 4.66 ± 0.34 |
| MCP-1 (pg/ml) | 169.6 ± 15.7 | 145.8 ± 11.5 |
| HGF (pg/ml) | 830.9 ± 74.8 | 976.9 ± 95.4 |
| NGF (pg/ml) | 7.77 ± 1.49 | 5.91 ± 0.83 |
| Apoptosis markers | ||
| ccK18 (U/l) | 162.1 ± 13.8 | 152.7 ± 7.8 |
Results are presented as mean (SE).
P<0.05 between control and asthma.
AA= African American; C=Caucasian; AQLQ= Asthma Quality of Life Questionnaire; FEV1=Forced expiratory volume in 1s; FVC= Forced vital capacity; FENO= fractional exhaled NO; PC20=the first provocative concentration that caused a 20% fall in FEV1; TNF-α= tumor necrosis factor–alpha; MCP-1= monocyte chemo-attractant protein-1; HGF= hepatocyte growth factor; NGF =nerve growth factor; ccK18= Cleaved cytokeratine-18.
Table II.
Demographics, for All asthmatics based on asthma severity
| Asthma Severity | ||
|---|---|---|
| NonSevere (N=10) | Severe (N=10) | |
| Demographics | ||
| Age (yr) | 31.4 ± 2.6 | 44.5 ± 3.4* |
| Gender (M/F) | 6/4 | 8/2 |
| Duration of asthma | 21.6 ± 4.6 | 28.2 ± 3.2 |
| Weight (kg) | 84.3 ± 3.5 | 90.1 ±7.8 |
| Height (cm) | 177 ± 0.03 | 162 ± 0.04* |
| BMI | 26.8 ± 3.1 | 33.9 ± 7* |
| AQLQ | 5.11 ± 0.30 | 3.75 ± 0.33* |
| Lung Functions | ||
| FEV1, L | 3.26 ± 0.32 | 1.92 ±0.17* |
| FEV1, % | 87.2 ± 5.3 | 64.78 ± 5.2* |
| FVC, L | 4.63 ±0.42 | 2.77 ± 0.18* |
| FVC, % | 104.1 ± 5.5 | 79.6 ± 9.9* |
| FEV1/FVC | 0.71 ± 0.04 | 0.69 ±0.04 |
| PC20 | 2.2 ± 0.8 | 1.7 ± 0.9 |
| FENO (ppb) | 48.9 ± 9.9 | 23.2 ± 4.7* |
| FENO Phenotype | ||
| FENO ≥35ppb (%) | 67 | 33 |
| Medication | ||
| Corticosteroids | ||
| Inhaled, n | 0 | 9 |
| Oral, n | 0 | 3 |
| Injected, n | 0 | 0 |
| β-agonist: inhaled, n | 9 | 7 |
| Long acting β-agonist, n | 0 | 8 |
| Theophylline, n | 0 | 0 |
| Leukotriene receptor agonist, n | 0 | 6 |
| Ipratropium, n | 0 | 1 |
| Immunotherapy, n | 0 | 0 |
Results are presented as mean (SE).
P<0.05 between healthy control and asthma.
AA= African American; C=Caucasian; FEV1=Forced expiratory volume in 1s; FVC= Forced vital capacity; FENO= fractional exhaled NO; PC20=the first provocative concentration that caused a 20% fall in FEV1; n= number of subjects.
The plasma levels of cytokines IL-6, IL-8, TNF-a, MCP-1, HGF and NGF were not significantly different between asthmatics and healthy controls [Table I]. Plasma levels of ccK18, a caspase cleavage fragment released from apoptotic epithelial cells (18) was also not different amongst subjects with asthma and healthy controls [Table I].
Plasma Amino acids
Focused metabolomics revealed that taurine was the only amino acid significantly higher in asthmatics as compared with healthy controls [Table III, Figure 1A]. Severity of asthma or FENO did not influence plasma taurine levels [mean (SE) micromoles/L; nonsevere: 132.3 (19.7), severe: 145.1 (16.8), p>0.05; Low FENO: 150.3 (20.6), High FENO: 122.6 (19.1), p>0.05]
Table III.
Plasma levels of Amino Acids in healthy and asthmatic individuals
| Healthy Controls (n=10) |
Asthma (n=20) |
Asthma based on FENO | ||
|---|---|---|---|---|
| FENO<35ppm (n=9) | FENO≥35ppm (n=9) | |||
| Taurine | 70.4 ± 15.7 | 138.5 ± 11.1* | 150.3 ± 20.6 | 122.5 ± 19.1 |
| Aspartic Acid | 6.8 ± 1.2 | 7.25 ± 0.8 | 7.8 ± 0.9 | 6.6 ± 0.7 |
| Glutamic Acid | 53.9 ± 10.7 | 73.6 ± 7.6 | 72.2 ± 9.2 | 73.4 ± 14.6 |
| Asparagine | 52.5 ± 4.7 | 49.9 ± 2.3 | 51.8 ± 4.6 | 51.1 ± 6.7 |
| Serine | 99.8 ± 8.0 | 89.2 ± 5.6 | 87.4 ± 7.0 | 95.3 ± 8.4 |
| Glutamine | 545.2 ± 17.5 | 527.0 ± 12.4 | 550.4 ± 16.8 | 505.1 ± 15.8 |
| Histidine | 93.6 ± 5.5 | 89.9 ±3.9 | 96.2 ± 5.2 | 88.4 ± 6.3 |
| Glycine | 240.1 ± 24.2 | 221.8 ± 17.1 | 223.4 ± 27.5 | 232.5 ± 30.4 |
| Citrulline | 37.5 ± 3.5 | 28.9 ± 2.5 | 28.9 ± 1.7 | 28.1 ± 3.0 |
| Threonine | 140.0 ± 14.4 | 147.1 ± 10.2 | 155.4 ± 14.1 | 144.1 ± 18.7 |
| Alanine | 391.7 ± 27.7 | 387.7 ± 19.6 | 401.9 ± 28.6 | 382.7 ± 27.1 |
| Arginine | 98.4 ± 11.4 | 101.8 ± 8.0 | 112.7 ± 11.9 | 93.7 ± 14.1 |
| Tyrosine | 64.2 ± 4.8 | 71.0 ± 3.4 | 71.2 ± 3.7 | 73.7 ± 4.4 |
| Amino Butyric Acid | 20.3 ± 1.4 | 16.8 ± 1.0* | 16.4 ± 1.02 | 17.9 ± 1.8 |
| Methionine | 22.5 ± 1.6 | 22.7 ± 1.1 | 21.6 ± 0.7 | 24.6 ± 2.0 |
| Valine | 242.3 ± 12.6 | 229.3 ± 8.9 | 216.7 ± 10.1 | 244.3 ± 8.2# |
| Tryptophan | 49.0 ± 3.1 | 49.5 ± 2.2 | 46.0 ± 3.9 | 54.7 ± 2.8 |
| Phenylalanine | 61.7 ± 3.2 | 61.2 ± 2.3 | 61.6 ± 2.7 | 63.2 ± 2.8 |
| Isoleucine | 72.5 ± 5.8 | 65.3 ± 4.1 | 60.1 ± 4.4 | 71.8 ± 3.1# |
| Leucine | 138.8 ± 9.9 | 125.0 ± 7.0 | 113.8 ± 8.7 | 138.0 ± 5.5# |
| Ornithine | 67.7 ± 7.1 | 70.5 ± 5.1 | 69.9 ± 8.9 | 70.9 ± 6.9 |
| Lysine | 180.8 ± 10.5 | 172.4 ± 7.4 | 177.4 ± 12.7 | 172.7 ± 10.5 |
All data are micromoles/l and mean±SE.
p<0.05 between healthy controls and Asthmatics;
p<0.05 between asthmatics with low and high FENO.
Figure 1. Biochemicals reflecting the impact of increased NO production in Asthma.

Taurine (A), lathesterol (B) and taurocholate (C) levels were increased in asthmatics (N=20) as compared with healthy controls (N=10). Data are box plots with median value and min and maximal distribution. (D) An abbreviated of the bile acid production pathway Bold are the metabolites higher in asthma. NO can cause functional impairment of the taurine transporter leading to higher taurine levels, which can be augmented by higher arichidonate levels in asthma. Nitric oxide, by increasing bile acid metabolism can result in high bile acid levels (see text for details).
Asthmatics with low FENO had significantly lower branched chain amino acids (BCAA) i.e. leucine, isoleucine, and valine, in the plasma as compared with those with high FENO and healthy controls [Table III]. The differences remained significant even when BCAA levels were measured using the metabolomic platform (see below). Severity of asthma had no effect on BCAA.
Metabolomic analysis
Using LC/MS and GC/MS analysis, 293 distinct metabolites were identified in the plasma samples. The changes in the metabolites between the groups were calculated by the ratio of their group means. The list of all the identified biochemicals with their relative change among the asthma phenotypes and healthy controls are appended in Supplemental Tables S1 and S2. The number of named compounds, with statistically significant different levels, ranged from 25 to 13 across various comparisons [Table IV]. Overall, the number of statistically different compounds between asthmatics and healthy control subjects was 25; most of the metabolites were higher in asthmatics as compared with healthy controls [Table IV and S1]. Analysis of asthmatic cohort based upon severity i.e severe vs nonsevere asthma identified 18 biochemicals as statistically different with 1 biochemical higher and 17 biochemicals lower in severe asthmatics as compared with nonsevere asthmatics [Table IV, S1]. Analysis of the metabolites based on FENO levels revealed that 13 biochemicals were statistically different among the groups, i.e. 3 higher and 10 lower in those with low FENO as compared with the high FENO group [Table IV, S2].
Table IV.
Number of biochemicals that were significantly different in asthma
| Welch’s Two- Sample t-Test | Asthma vs Healthy Control | Severe Asthma vs NonSevere Asthma | Low FENO vs High FENO |
|---|---|---|---|
| Total number of biochemicals with p ≤ 0.05 | 25 | 18 | 13 |
| Biochemicals (↑/↓) | 20/5 | 1/17 | 3/10 |
Significantly (P<0.05) higher ↑ and lower ↓ biochemicals
Biochemicals related to protein, carbohydrate, lipids, xenobiotics, peptides, cofactors and vitamins, and nucleotide metabolism were significantly altered in asthmatic subjects as compared with the healthy controls [Table S1]. Table V shows all biochemicals significantly different between asthmatics and healthy controls. The majority of the identified biochemicals (11 out of 25) were associated with lipid, steroid and long chain fatty acid metabolism. Of particular interest was the marked increase in bile acids (taurocholate and glycodeoxycholate) in the asthmatic subjects [Figure 1B]. Lathosterol levels also were higher in asthma [Figure 1C]. Asthmatics had increased levels of peptides related to glutamate cycle, glutamylphenylalanine and glutamyltyrosine, as compared with the healthy controls. In addition, markers of inflammation such as nicotinamide (2 fold), adenosine monophosphate (3 fold) and arachidonate (1.5 fold) were higher in asthma [Table V, Figure 2]. None of these biochemicals, except taurocholate, were significantly different when asthmatics were segregated by severity [Table S1] or by FENO [Table S2]. Asthmatics with high FENO had significantly higher taurocholate as compared to healthy controls [Taurocholate, scaled intensity, mean (SE): healthy control, 0.72 (0.23); high FENO, 2.69 (1.34); p=0.028] [Table S2].
Table V.
Metabolites with significant fold change between asthma and healthy control subjects.
| Fold Change* | ||
|---|---|---|
|
| ||
| Pathway | Asthma | |
| Healthy Controls | ||
| Amino Acid | ||
| -Urea: | Urea | 0.8 |
| -Branched chain amino acids: | α-hydroxyisocaproate | 0.74 |
| Carbohydrate | ||
| -Glycolysis, gluconeogenesis: | 3-phosphoglycerate | 1.7 |
| -Glycogen: | Maltose | 3.0 |
| Maltotriose | 3.59 | |
| Lipid | ||
| -Sterol/Steroid: | 7-α-hydroxy-3-oxo-4- cholestenoate | 1.31 |
| Androsterone sulfate | 0.7 | |
| Epiandrosterone sulfate | 0.7 | |
| -Glycerolipid: | Glycerophosphorylcholine (GPC) | 1.65 |
| Phosphoethanolamine | 1.82 | |
| -Long chain fatty acid: | arachidonate (20:4n6) | 1.37 |
| -Fatty acid, amide: | Oleamide | 0.57 |
| -Sphingolipid: | Sphingosine | 2.27 |
| Bile acid and Cholesterol | ||
| Glycodeoxycholate | 2.18 | |
| Taurocholate | 3.22 | |
| Lathosterol | 1.64 | |
| Xenobiotics | ||
| -Xanthines: | Caffeine | 3.89 |
| Paraxanthine | 2.14 | |
| Theophylline | 2.35 | |
| -Benzoate: | Catechol sulfate | 1.54 |
| Peptide | ||
| γ-glutamyl: | γ-glutamylphenylalanine | 1.22 |
| γ-glutamyltyrosine | 1.33 | |
| -Dipeptide: | Cyclo(leu-pro) | 1.79 |
| Cofactors and vitamins | ||
| -Nicotinate and nicotinamide: | Nicotinamide | 2.32 |
| Nucleotide | ||
| -Purines: | Adenosine 5′-monophosphate | 2.84 |
p<0.05,
Figure 2. Biochemicals indicative of augmented immune and inflammatory responses.
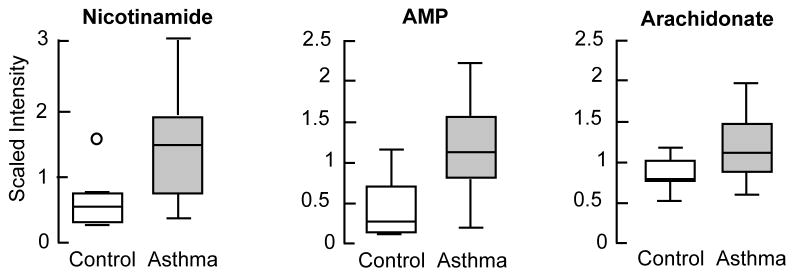
[A] Untargeted metabolomics revealed significantly higher levels of nicotinamide, adenosine monophosphate and arachidonate were (N=20) in asthmatics as compared with healthy control subjects (N=10). Data are box plots with median value and min and maximal distribution. AMP= Adenosine 5′-monophosphate
Metabolome of asthma based upon Severity
Severity of asthma, based on use of high dose corticosteroid treatment, impacted mostly the biochemicals related to steroid metabolism: 1- steraroyylglycerol, dehydroisoandrosterone sulfate, epi-androsterone sulfate and androsterone sulfate [Figure 3, Table VI]. In addition significant changes were seen in biochemicals related to amino acid metabolism [Table VI]. Beta-alanine, a non essential amino acid was significantly higher in severe asthmatics as compared to nonsevere asthmatic [Table VI S1].
Figure 3. Plasma steroids levels in relation to the severity of asthma.

Steroid metabolites were significantly lower in severe asthmatics (N=10) as compared to nonsevere asthmatics (N=10). Data are box plots with median value and min and maximal distribution.
Table VI.
Biochemicals significantly different between Severe and Nonsevere asthmatic Phenotype
| Fold Change* | ||
|---|---|---|
|
| ||
| Pathway | Severe | |
| Nonsevere | ||
| Amino Acid | ||
| -Branched chain amino acids: | β-hydroxyisovalerate | 0.59 |
| α-hydroxyisovalerate | 0.51 | |
| -Lysine: | Glutarylcarnitine | 0.76 |
| -Tryptophan: | Indolepropionate | 0.65 |
| -Alanine and aspartate: | β-alanine | 2.28 |
| Carbohydrate | ||
| -Glycolysis, gluconeogenesis: | 1,5-anhydroglucitol | 0.76 |
| Lipid | ||
| -Monoacylglycerol | 1-stearoylglycerol | 0.75 |
| -Sterol/Steroid: | Dehydroisoandrosterone sulfate | 0.35 |
| Epiandrosterone sulfate | 0.48 | |
| Androsterone sulfate | 0.54 | |
| 4-androsten-3β,17β-diol disulfate 1 | 0.25 | |
| 4-androsten-3β,17β a-diol disulfate 2 | 0.45 | |
| 5α-androstan-3β,17β-dioldisulfate | 0.34 | |
| Pregnen-diol disulfate* | 0.36 | |
| Andro steroid monosulfate 2 | 0.42 | |
| Peptide | ||
| -γ–-glutamyl | γ–glutamylvaline | 0.75 |
p<0.05
Metabolome of asthma based upon FENO
High or low FENO were discriminated mostly by differences in amino acid, lipids and bile acid related metabolites [Table VII]. As with focused metabolomics [Table III], branched chain amino acids were significantly lower in asthmatics with low FENO as compared with those high FENO, [Table VII]. Bile acids glycocholate and cholate are significantly higher in asthmatics with high FENO [Table VII].
Table VII.
Biochemicals significantly different between FENO phenotype.
| Fold Change* | ||
|---|---|---|
|
| ||
| Pathway | Low FENO | |
| High FENO | ||
| Amino Acid | ||
| -Branched Chain Amino Acids: | Isoleucine | 0.84 |
| Valine | 0.88 | |
| 3- hydroxyisobutyrate | 0.65 | |
| -Phenyalanine & tyrosine: | p-Cresol sulfate | 1.84 |
| -Tryptophan: | Tryptophan | 0.82 |
| C- glycosylthrptophan | 1.3 | |
| -Histidine: | Trans-urocanate | 2.08 |
| Carbohydrate | ||
| -Glycolysis, gluconeogenesis: | Glycerate | 0.55 |
| Lipid | ||
| -Fatty acid: | Isovalerate | 0.67 |
| -Long chain fatty acid: | Pentadecanoate | 0.79 |
| Bile acid | ||
| Glycocholate | 0.32 | |
| Cholate | 0.32 | |
| Nucleotide | ||
| -Ascorbate and alderate: | Threonate | 0.62 |
p<0.05.
Correlations
Plasma taurine levels were positively correlated with plasma arachidonate (R=0.50, p=0.004).
DISCUSSION
In the present study, we performed untargeted and focused metabolomic analysis in order to identify the plasma metabolomic endotypes of asthma. By using these techniques, we have identified differences in plasma biochemicals of asthmatics as compared with healthy controls. Asthmatics had significantly higher plasma levels of taurine, bile acids, nicotinamide, arachidonate, and adenosine-5-phosphate as compared with healthy controls. Severe asthmatics had significantly lower biochemicals related to steroid metabolism as compared with nonsevere asthmatics. High FENO in asthmatic was associated with significantly higher bile acids as compared with asthmatics with low FENO.
The concentration of plasma taurine was higher in asthmatics as compared with healthy controls irrespective of severity or FENO phenotype. Taurine, a beta amino acid is not incorporated into proteins and is present in high concentrations in the intracellular compartment in most tissues. Although the physiological roles of taurine continue to be explored, it is now accepted that taurine can function as an intracellular osmolyte, an antioxidant and a critical compound in the development of brain for certain animals (19). The mechanism of increase in plasma taurine can only be speculated because of lack of any data in the literature in relation to asthma. Taurine levels have been reported to be higher in the bronchoalveolar lavage (BAL) fluid of individuals with asthma (20, 21). Whether the increase the levels of taurine in BAL is related to higher NO or other cytokines in asthma or are a result of release from damaged cells has not been examined. NO has been shown to functionally impair the taurine transporter in rat renal brush border membrane vesicles (22) and in oocytes (23). The impairment of taurine transport was mediated via the formation of peroxynitrite from the reaction of NO with superoxide (23). Asthmatic airways have increased formation of peroxynitrite due to increased production of NO and decreased antioxidant activities, suggesting that a similar effect on taurine transporter may occur in asthma (24, 25). However the interactions of NO with taurine transporter are more complex and possibly depend upon the tissue examined since NO also transcriptionally upregulates expression of taurine transporter in cultured human retinal epithelial cells (22). NO regulates extracellular taurine levels in other tissues, such as the hippocampus, where the effects are related to specific NO synthase enzymes (26). Arachidonate, a precursor of leukotrienes was higher in asthmatics, regardless of phenotype. The mobilization and oxidation of arachidonic acid via 5-lipoxygenase (5-LO) to leukotrienes is an important pathway of inflammation in asthma, and in the swelling-induced activation of the taurine-releasing pathways leading to an efflux of taurine from the intracellular compartment (27, 28). In the present study, there was a positive correlation between plasma levels of taurine and plasma levels of arachidonate in asthma, suggesting that taurine may serve as a biomarker of this specific inflammatory pathway in asthma. The levels of beta alanine were higher in severe asthma compared with the nonsevere asthma. Beta alanine competes for the transporter of taurine, and could also contribute to the higher levels of taurine in asthma.
The major metabolic route of elimination of taurine is in the form of bile acids. In the present study, non-targeted metabolomics revealed higher levels of taurocholate in asthma, with the highest levels in asthmatics with high FENO compare with the healthy controls. Previous studies in vivo and in vitro have demonstrated that NO modulates bile acid metabolism and bile production. Schonhoff et al showed that NO inhibits taurocholate uptake by inducing nitrosylation of the sodium-taurocholate transporter (29). Hepatic perfusion with NO donors increased bile acid out flow (30). In isolated hepatocytes, NO inhibited bile acid uptake, and inhibition of NOS with L-N(G)-nitroarginine decreased the synthesis of bile acids and increased cholesterol levels (31) Transgenic mice overexpressing endothelial NO synthase have increased levels of primary and secondary bile acids as well as conjugated bile acids (32). Based upon these data, Sansbury et al proposed that the mechanism of increase in bile acids by NO may be due to increased hepatic synthesis, higher bacterial dehydroxylation in the gut and increased conjugation in the liver (32). The higher levels of lathosterol in asthma in our study suggest higher rate of synthesis of cholesterol, a precursor of bile acids (33, 34). Overall, asthmatics have higher plasma taurine, likely a result of cellular efflux, and higher lathosterol and bile acids, likely a result of increased synthesis, which all may be related to greater NO and inflammation in asthma [Figure 1D].
The plasma concentration of nicotinamide was markedly increased (3-fold) in asthmatics irrespective of the severity of the disease or the level of FENO. There was no associated change in tryptophan levels or in the levels of the biochemical intermediates of tryptophan metabolism. This would suggest that the increase in nicotinamide may not be related to an increase in production of NAD+ but rather to an increase in its consumption. NAD+ is a substrate for three classes of enzymes that cleave NAD to produce nicotinamide (35). These are ADP-ribose transferase, cADP-ribose synthase and sirtuins (protein lysine deacetylases). Of these cADP-ribose synthase, also known as the lymphocyte antigen CD38 and CD157, is of particular interest because of its described role in regulation of immune responses and airway hyper-responsiveness in asthma. CD38 is a multifunctional cell surface protein expressed in airway smooth muscle cells and on immune cells (36). In addition, CD38 is an ectoenzyme and its major enzyme activity is hydrolysis of NAD+ (36, 37). Its expression is augmented by inflammatory cytokines like TNFα, interleukin (IL)-1β, interferon (IFNγ), and IL-13 (38, 39). Increased CD38 expression resulted in high rate of production of c-ADP-ribose by airway smooth muscle cells (40), while inhibition of its activity by siRNA mediated knockdown or by gene deletion (CD38−/− mice) resulted in lower levels of cADP-ribose and increased intracellular levels of NAD+ (37). We postulate that the higher levels of nicotinamide in asthmatics are related to increased rate of production via CD38 in response to ongoing immunologic activation in asthma.
The low levels of steroids in the severe asthmatics are consistent with suppression of adrenal steroids as a consequence of therapeutic use of corticosteroids. However the severe group shared many of the same metabolomic signatures as nonsevere asthmatics, who were not on corticosteroids. The ability to detect changes in steroid metabolism, yet observe similar metabolomic profile in severe and nonsevere asthma indicates that corticosteroid therapy is unlikely to be the cause of the differences seen among asthma and healthy controls. On the other hand, the low FENO group of asthmatics had lower levels of branched chain amino acids in the presence of unchanged other essential amino acids e.g. phenyalanine, methionine, suggesting alteration in the metabolism of BCAA in this group. The mechanism of this change remains unclear.
The following limitations of our study should be recognized: (1) It should be underscored that the asthmatic subjects in our study were clinically stable and well controlled on medications. The clinical management of asthma may have attenuated some of the biochemical pathways related to the disease and therefore impacted the observed endotype. (2) Our study is a pilot exploratory study and our sample size is small. (3) The blood samples were obtained randomly. Although important, it may not have been critical for the present study since the biochemicals affected by asthma are not known to be significantly impacted by feeding and fasting. (4) Our measurements in the blood mostly reflect systemic responses to airway disease and are not pulmonary responses to asthma. These confounders could impact the data obtained and its interpretation. Asthma is a heterogeneous disorder and larger samples of carefully characterized individuals are required to confirm the metabolomic endotypes observed in this cohort (41, 42).
In summary, the metabolomics analysis of asthma revealed a characteristic metabolome dominated by biochemical/metabolic responses related to NO, TH2 immunity and inflammation. The definition of asthma by metabolomic endotype may offer opportunities to develop biomarkers of disease activity, adherence to medication and targeted therapeutics.
Supplementary Material
Acknowledgments
Funding: National Institutes of Health grants HL103453 (Metabolomics supplement to SAAC), HL081064-06, HL109250, and Clinical & Translational Science Award, RR024989 and by Alfred Lerner Memorial Chair to Dr Erzurum.
References
- 1.Comhair SA, Erzurum SC. Redox control of asthma: molecular mechanisms and therapeutic opportunities. Antioxid Redox Signal. 2010;12:93–124. doi: 10.1089/ars.2008.2425. [DOI] [PMC free article] [PubMed] [Google Scholar]
- 2.Busse W, Elias J, Sheppard D, Banks-Schlegel S. Airway remodeling and repair. American journal of respiratory and critical care medicine. 1999;160:1035–1042. doi: 10.1164/ajrccm.160.3.9902064. [DOI] [PubMed] [Google Scholar]
- 3.Calhoun WJ, Reed HE, Moest DR, Stevens CA. Enhanced superoxide production by alveolar macrophages and air-space cells, airway inflammation, and alveolar macrophage density changes after segmental antigen bronchoprovocation in allergic subjects. Am Rev Respir Dis. 1992;145:317–325. doi: 10.1164/ajrccm/145.2_Pt_1.317. [DOI] [PubMed] [Google Scholar]
- 4.Dweik RA, Boggs PB, Erzurum SC, Irvin CG, Leigh MW, Lundberg JO, Olin AC, Plummer AL, Taylor DR American Thoracic Society Committee on Interpretation of Exhaled Nitric Oxide Levels for Clinical A. An official ATS clinical practice guideline: interpretation of exhaled nitric oxide levels (FENO) for clinical applications. American journal of respiratory and critical care medicine. 2011;184:602–615. doi: 10.1164/rccm.9120-11ST. [DOI] [PMC free article] [PubMed] [Google Scholar]
- 5.Dweik RA, Laskowski D, Ozkan M, Farver C, Erzurum SC. High levels of exhaled nitric oxide (NO) and NO synthase III expression in lesional smooth muscle in lymphangioleiomyomatosis. Am J Respir Cell Mol Biol. 2001;24:414–418. doi: 10.1165/ajrcmb.24.4.4127. [DOI] [PubMed] [Google Scholar]
- 6.Dweik RA, Sorkness RL, Wenzel S, Hammel J, Curran-Everett D, Comhair SA, Bleecker E, Busse W, Calhoun WJ, Castro M, Chung KF, Israel E, Jarjour N, Moore W, Peters S, Teague G, Gaston B, Erzurum SC National Heart, L, Blood Institute Severe Asthma Research P. Use of exhaled nitric oxide measurement to identify a reactive, at-risk phenotype among patients with asthma. American journal of respiratory and critical care medicine. 2010;181:1033–1041. doi: 10.1164/rccm.200905-0695OC. [DOI] [PMC free article] [PubMed] [Google Scholar]
- 7.Erzurum SC, Gaston BM. Biomarkers in asthma: a real hope to better manage asthma. Clin Chest Med. 2012;33:459–471. doi: 10.1016/j.ccm.2012.06.007. [DOI] [PMC free article] [PubMed] [Google Scholar]
- 8.Woodruff PG, Modrek B, Choy DF, Jia G, Abbas AR, Ellwanger A, Koth LL, Arron JR, Fahy JV. T-helper type 2-driven inflammation defines major subphenotypes of asthma. American journal of respiratory and critical care medicine. 2009;180:388–395. doi: 10.1164/rccm.200903-0392OC. [DOI] [PMC free article] [PubMed] [Google Scholar]
- 9.Dweik RA, Comhair SA, Gaston B, Thunnissen FB, Farver C, Thomassen MJ, Kavuru M, Hammel J, Abu-Soud HM, Erzurum SC. NO chemical events in the human airway during the immediate and late antigen-induced asthmatic response. Proc Natl Acad Sci U S A. 2001;98:2622–2627. doi: 10.1073/pnas.051629498. [DOI] [PMC free article] [PubMed] [Google Scholar]
- 10.Evans AM, DeHaven CD, Barrett T, Mitchell M, Milgram E. Integrated, nontargeted ultrahigh performance liquid chromatography/electrospray ionization tandem mass spectrometry platform for the identification and relative quantification of the small-molecule complement of biological systems. Anal Chem. 2009;81:6656–6667. doi: 10.1021/ac901536h. [DOI] [PubMed] [Google Scholar]
- 11.Gibney MJ, Walsh M, Brennan L, Roche HM, German B, van Ommen B. Metabolomics in human nutrition: opportunities and challenges. Am J Clin Nutr. 2005;82:497–503. doi: 10.1093/ajcn.82.3.497. [DOI] [PubMed] [Google Scholar]
- 12.Kalhan SC, Guo L, Edmison J, Dasarathy S, McCullough AJ, Hanson RW, Milburn M. Plasma metabolomic profile in nonalcoholic fatty liver disease. Metabolism. 2011;60:404–413. doi: 10.1016/j.metabol.2010.03.006. [DOI] [PMC free article] [PubMed] [Google Scholar]
- 13.Wishart DS. Current progress in computational metabolomics. Brief Bioinform. 2007;8:279–293. doi: 10.1093/bib/bbm030. [DOI] [PubMed] [Google Scholar]
- 14.Proceedings of the ATS workshop on refractory asthma: current understanding, recommendations, and unanswered questions. American Thoracic Society. American journal of respiratory and critical care medicine. 2000;162:2341–2351. doi: 10.1164/ajrccm.162.6.ats9-00. [DOI] [PubMed] [Google Scholar]
- 15.Cowan DC, Taylor DR, Peterson LE, Cowan JO, Palmay R, Williamson A, Hammel J, Erzurum SC, Hazen SL, Comhair SA. Biomarker-based asthma phenotypes of corticosteroid response. The Journal of allergy and clinical immunology. 2014 doi: 10.1016/j.jaci.2014.10.026. [DOI] [PMC free article] [PubMed] [Google Scholar]
- 16.Michils A, Baldassarre S, Van Muylem A. Exhaled nitric oxide and asthma control: a longitudinal study in unselected patients. Eur Respir J. 2008;31:539–546. doi: 10.1183/09031936.00020407. [DOI] [PubMed] [Google Scholar]
- 17.Kalhan SC, Gruca LL, Parimi PS, O’Brien A, Dierker L, Burkett E. Serine metabolism in human pregnancy. American journal of physiology. Endocrinology and metabolism. 2003;284:E733–740. doi: 10.1152/ajpendo.00167.2002. [DOI] [PubMed] [Google Scholar]
- 18.John K, Wielgosz S, Schulze-Osthoff K, Bantel H, Hass R. Increased plasma levels of CK-18 as potential cell death biomarker in patients with HELLP syndrome. Cell Death Dis. 2013;4:e886. doi: 10.1038/cddis.2013.408. [DOI] [PMC free article] [PubMed] [Google Scholar]
- 19.Ripps H, Shen W. Review: taurine: a “very essential” amino acid. Molecular vision. 2012;18:2673–2686. [PMC free article] [PubMed] [Google Scholar]
- 20.Hofford JM, Milakofsky L, Pell S, Fish JE, Peters SP, Pollice M, Vogel WH. Levels of amino acids and related compounds in bronchoalveolar lavage fluids of asthmatic patients. American journal of respiratory and critical care medicine. 1997;155:432–435. doi: 10.1164/ajrccm.155.2.9032174. [DOI] [PubMed] [Google Scholar]
- 21.Santangelo F, Cortijo J, Morcillo E. Taurine and the lung: which role in asthma? Advances in experimental medicine and biology. 2003;526:403–410. [PubMed] [Google Scholar]
- 22.Bridges CC, Ola MS, Prasad PD, El-Sherbeny A, Ganapathy V, Smith SB. Regulation of taurine transporter expression by NO in cultured human retinal pigment epithelial cells. Am J Physiol Cell Physiol. 2001;281:C1825–1836. doi: 10.1152/ajpcell.2001.281.6.C1825. [DOI] [PMC free article] [PubMed] [Google Scholar]
- 23.Koo TS, Kwon HJ, Kim MH, Kim DD, Shim CK, Chung SJ, Chong S. Functional impairment of rat taurine transporter by activation of nitrogen oxide through superoxide. Drug metabolism and pharmacokinetics. 2012;27:286–293. doi: 10.2133/dmpk.dmpk-11-rg-076. [DOI] [PubMed] [Google Scholar]
- 24.Comhair SA, Xu W, Ghosh S, Thunnissen FB, Almasan A, Calhoun WJ, Janocha AJ, Zheng L, Hazen SL, Erzurum SC. Superoxide dismutase inactivation in pathophysiology of asthmatic airway remodeling and reactivity. Am J Pathol. 2005;166:663–674. doi: 10.1016/S0002-9440(10)62288-2. [DOI] [PMC free article] [PubMed] [Google Scholar]
- 25.Marozkina NV, Gaston B. Nitrogen chemistry and lung physiology. Annual review of physiology. 2015;77:431–452. doi: 10.1146/annurev-physiol-021113-170352. [DOI] [PubMed] [Google Scholar]
- 26.Watts J, Segieth J, Pearce B, Whitton PS. Regulatory role of nitric oxide over extracellular taurine in the hippocampus of freely moving rats. Neurosci Lett. 2004;357:179–182. doi: 10.1016/j.neulet.2003.12.056. [DOI] [PubMed] [Google Scholar]
- 27.Lambert IH. Regulation of the cellular content of the organic osmolyte taurine in mammalian cells. Neurochemical research. 2004;29:27–63. doi: 10.1023/b:nere.0000010433.08577.96. [DOI] [PubMed] [Google Scholar]
- 28.Pedersen SF, Poulsen KA, Lambert IH. Roles of phospholipase A2 isoforms in swelling- and melittin-induced arachidonic acid release and taurine efflux in NIH3T3 fibroblasts. American journal of physiology. Cell physiology. 2006;291:C1286–1296. doi: 10.1152/ajpcell.00325.2005. [DOI] [PubMed] [Google Scholar]
- 29.Schonhoff CM, Ramasamy U, Anwer MS. Nitric oxide-mediated inhibition of taurocholate uptake involves S-nitrosylation of NTCP. American journal of physiology. Gastrointestinal and liver physiology. 2011;300:G364–370. doi: 10.1152/ajpgi.00170.2010. [DOI] [PMC free article] [PubMed] [Google Scholar]
- 30.Trauner M, Mennone A, Gigliozzi A, Fraioli F, Boyer JL. Nitric oxide and guanosine 3′,5′-cyclic monophosphate stimulate bile secretion in isolated rat hepatocyte couplets, but not in isolated bile duct units. Hepatology. 1998;28:1621–1628. doi: 10.1002/hep.510280623. [DOI] [PubMed] [Google Scholar]
- 31.Khedara A, Goto T, Kayashita J, Kato N. Hypercholesterolemic effect in rats of a dietary addition of the nitric oxide synthase inhibitor, L-N omega nitroarginine, by less synthesis of bile acids. Bioscience, biotechnology, and biochemistry. 1998;62:773–777. doi: 10.1271/bbb.62.773. [DOI] [PubMed] [Google Scholar]
- 32.Sansbury BE, Bhatnagar A, Hill BG. Impact of nutrient excess and endothelial nitric oxide synthase on the plasma metabolite profile in mice. Front Physiol. 2014;5:453. doi: 10.3389/fphys.2014.00453. [DOI] [PMC free article] [PubMed] [Google Scholar]
- 33.Miettinen TA, Gylling H. Synthesis and absorption markers of cholesterol in serum and lipoproteins during a large dose of statin treatment. European journal of clinical investigation. 2003;33:976–982. doi: 10.1046/j.1365-2362.2003.01229.x. [DOI] [PubMed] [Google Scholar]
- 34.Wu AH, Ruan W, Todd J, Lynch KL. Biological variation of beta-sitosterol, campesterol, and lathosterol as cholesterol absorption and synthesis biomarkers. Clinica chimica acta; international journal of clinical chemistry. 2014;430:43–47. doi: 10.1016/j.cca.2013.12.040. [DOI] [PubMed] [Google Scholar]
- 35.Belenky P, Bogan KL, Brenner C. NAD+ metabolism in health and disease. Trends Biochem Sci. 2007;32:12–19. doi: 10.1016/j.tibs.2006.11.006. [DOI] [PubMed] [Google Scholar]
- 36.Aksoy P, White TA, Thompson M, Chini EN. Regulation of intracellular levels of NAD: a novel role for CD38. Biochem Biophys Res Commun. 2006;345:1386–1392. doi: 10.1016/j.bbrc.2006.05.042. [DOI] [PubMed] [Google Scholar]
- 37.Young GS, Choleris E, Lund FE, Kirkland JB. Decreased cADPR and increased NAD+ in the Cd38−/− mouse. Biochem Biophys Res Commun. 2006;346:188–192. doi: 10.1016/j.bbrc.2006.05.100. [DOI] [PubMed] [Google Scholar]
- 38.Deshpande DA, Dogan S, Walseth TF, Miller SM, Amrani Y, Panettieri RA, Kannan MS. Modulation of calcium signaling by interleukin-13 in human airway smooth muscle: role of CD38/cyclic adenosine diphosphate ribose pathway. American journal of respiratory cell and molecular biology. 2004;31:36–42. doi: 10.1165/rcmb.2003-0313OC. [DOI] [PubMed] [Google Scholar]
- 39.Deshpande DA, Walseth TF, Panettieri RA, Kannan MS. CD38/cyclic ADP-ribose-mediated Ca2+ signaling contributes to airway smooth muscle hyper-responsiveness. FASEB journal: official publication of the Federation of American Societies for Experimental Biology. 2003;17:452–454. doi: 10.1096/fj.02-0450fje. [DOI] [PubMed] [Google Scholar]
- 40.Guedes AG, Deshpande DA, Dileepan M, Walseth TF, Panettieri RA, Jr, Subramanian S, Kannan MS. CD38 and airway hyper-responsiveness: studies on human airway smooth muscle cells and mouse models. Can J Physiol Pharmacol. 2015;93:145–153. doi: 10.1139/cjpp-2014-0410. [DOI] [PMC free article] [PubMed] [Google Scholar]
- 41.Anderson GP. Endotyping asthma: new insights into key pathogenic mechanisms in a complex, heterogeneous disease. Lancet. 2008;372:1107–1119. doi: 10.1016/S0140-6736(08)61452-X. [DOI] [PubMed] [Google Scholar]
- 42.Lotvall J, Akdis CA, Bacharier LB, Bjermer L, Casale TB, Custovic A, Lemanske RF, Jr, Wardlaw AJ, Wenzel SE, Greenberger PA. Asthma endotypes: a new approach to classification of disease entities within the asthma syndrome. The Journal of allergy and clinical immunology. 2011;127:355–360. doi: 10.1016/j.jaci.2010.11.037. [DOI] [PubMed] [Google Scholar]
Associated Data
This section collects any data citations, data availability statements, or supplementary materials included in this article.