Significance
We explored the human genome as a dynamical system. Using a data-guided mathematical framework and genome-wide assays, we interrogated the dynamical relationship between genome architecture (structure) and gene expression (function) and its impact on phenotype, which defines the 4D Nucleome. Structure and function entrained with remarkable persistence in genes that underlie wound healing processes and circadian rhythms. Using genome-wide intragene and intergene contact maps, we identified gene networks with high potential for coregulation and colocalization, consistent with expression via transcription factories. In an intriguing example, we found periodic movements of circadian genes in three dimensions that entrained with expression. This work can be broadly applied to identifying genomic signatures that define critical cell states during differentiation, reprogramming, and cancer.
Keywords: 4D Nucleome, networks, Laplacian, interphase nucleus, phase plane
Abstract
The 4D organization of the interphase nucleus, or the 4D Nucleome (4DN), reflects a dynamical interaction between 3D genome structure and function and its relationship to phenotype. We present initial analyses of the human 4DN, capturing genome-wide structure using chromosome conformation capture and 3D imaging, and function using RNA-sequencing. We introduce a quantitative index that measures underlying topological stability of a genomic region. Our results show that structural features of genomic regions correlate with function with surprising persistence over time. Furthermore, constructing genome-wide gene-level contact maps aided in identifying gene pairs with high potential for coregulation and colocalization in a manner consistent with expression via transcription factories. We additionally use 2D phase planes to visualize patterns in 4DN data. Finally, we evaluated gene pairs within a circadian gene module using 3D imaging, and found periodicity in the movement of clock circadian regulator and period circadian clock 2 relative to each other that followed a circadian rhythm and entrained with their expression.
The human genome is a beautiful example of a dynamical system in three dimensions. A comprehensive understanding of the genome, like any biological system, relies on recognizing its dynamical structure–function (S-F) relationships, from a molecular scale to a system-wide scale. It is known that gene topology or arrangement in 3D space (hereafter, structure) affects gene expression (function) (1, 2). Additionally, insertions or rearrangements in the genome may interfere with native genome topology and influence disease state. For example, it has been found that retroviral insertions can have 3D interactions with known cancer genes (3). Recent studies have also highlighted that distinct genome topology is found in different cell states, such as at different stages of the cell cycle (4) or in different cell types (5). However, very little is known about these S-F relationships in a true dynamical setting. A major goal of the 4D Nucleome (4DN) approach is to integrate the dynamical features of 3D architecture systematically in the interphase nucleus and the dynamical transcriptional landscape, with consequent phenotypic variation in cellular differentiation and disease (6).
Here, we take steps toward a more dynamical view of understanding S-F relationships in the genome. Biologically, we sought to understand genetic bases for wound healing processes as well as biological clocks, a concept captured by the term biochronicity (7). Therefore, we interrogated a proliferating population of karyotypically normal human fibroblasts, for which the cell cycle and circadian rhythms were initially synchronized (8, 9) (SI Appendix). Following synchronization, in samples taken throughout a time series, we evaluated structure through genome-wide chromosome conformation capture (Hi-C) and 3D-FISH, and function through RNA-sequencing (RNA-seq) to measure genome-wide transcription (Materials and Methods and SI Appendix).
We use quantitative approaches that are novel in their application to the study of dynamical S-F relationships in the human genome. The key mathematical object is the graph Laplacian constructed from measurements of genome-wide gene expression or contacts from Hi-C. Our goal is to uncover the partitioning of the Hi-C matrices and their correlation with function over time. The Laplacian signifies diffusion (consensus) among a discrete number or continuum of entities. It has been used across many disciplines in situations where autonomous entities reach a consensus without a central direction (10). Examples include the movement of animals in a group, such as “flocking” in birds, and the emergence of common languages in primitive societies (11, 12). Another important application of the Laplacian is in spectral clustering, where it provides an efficient method for graph partitioning (13).
The Laplacian can be summarized as follows. Consider an adjacency matrix , where , and weight function, satisfying (symmetrical) and (nonnegative). The Laplacian of is defined to be , where and . The normalized Laplacian is the matrix . The second smallest eigenvalue of is called the Fiedler number, and the corresponding eigenvector is called the Fiedler vector (14). In the context of the 4DN, the magnitude of the Fiedler number is a measure of the underlying stability of the topology of the genomic region at any given scale. For Hi-C contacts, a high Fiedler number in a genomic region would suggest high conformational stability that may be important for regulation of gene expression. The Fiedler vector partitions the genome into two parts that reflect underlying topology, as given by edge weights inferred from Hi-C data. The Fiedler vector plays a role similar to the eigenvector associated with the largest eigenvalue (principal component 1) of the correlation matrix of the normalized Hi-C matrix (15), but it is directly related to properties of the associated graph (14). Similar analyses can be performed for gene expression. Therefore, analyses based on the graph Laplacian provide a flexible framework for assessing dynamical S-F correlations in the genome (16).
Using our quantitative approaches, we have performed genome-wide gene-level S-F analyses over time, and give examples of how these methods can be adapted to the study of any genomic scale and any genomic region of interest. To capture genome-wide gene-level structure more precisely, we have constructed adaptive resolution contact maps with tailored binning of contacts to within each gene regardless of size, rather than using conventional fixed resolution Hi-C matrices. To gain an understanding of patterns in S-F relationships and how they evolve over time, we performed 2D phase plane analyses of our data, where axes on the plane represent structure and function. A phase plane is useful for understanding phenomena in a nonlinear system, such as the solution to an ordinary differential equation (17). For example, in the autonomous system with solutions , the x–y plane is called the phase plane of the system. A phase curve is a plot of the solution to a set of equations of motion in a phase plane, which helps to visualize patterns in the system. In the context of the 4DN, and can represent structure and function measures for chromosome regions or genes.
Results
Unified 4DN Analysis Framework.
Many methods have been used in the analysis of genome structure and transcriptional activity. Lieberman-Aiden et al. (15) segregated genomic regions into two compartments that corresponded to chromatin accessibility and gene expression, using the first eigenvector of the correlation matrix of the normalized Hi-C matrix. Rao et al. (18) extended this analysis to multiple compartments using a variety of methods, including hierarchical clustering. Dixon et al. (19) and Filippova et al. (20) identified topological domains via the hidden Markov model and dynamic programming, respectively. Furthermore, 3D chromosome reconstruction has been performed with Hi-C data using multidimensional scaling approaches (21, 22). For analysis of transcription profiles, hierarchical clustering is usually performed (23).
Our goal was to build a unified general strategy for these analyses for efficient characterization of chromatin structure and corresponding functional output. Analysis based on the graph Laplacian provides a common base for all of the above analyses. In particular, the Laplacian framework is advantageous in that it provides both the eigenvector (Fiedler vector) and the corresponding eigenvalue (Fiedler number) in quantification of the underlying topology. The Fiedler vector of the normalized Hi-C matrix efficiently identified chromosome compartments (a comparison with previously published data and methods is provided in SI Appendix, Fig. S1 A–D) and hierarchical topological domains in our data. By using the Fiedler number to quantify the stability of the topology of genomic regions, we were able to assign to genome structures a meaningful value that facilitated further quantitative analysis. We derive and summarize the associated algorithms and their advantages in detail in SI Appendix.
Chromosome Domain Analysis and Adaptive Resolution Contact Maps.
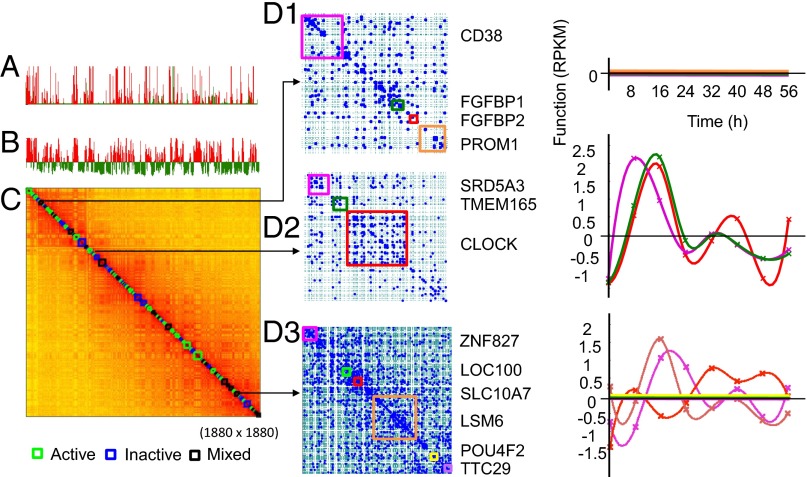
We generated nine high-quality Hi-C libraries from our 56-h time course for studying genome structure and function (summarized in SI Appendix, Dataset S1). Previous analyses of Hi-C chromatin interaction maps suggest the formation of chromosome territories and spatial segregation between active and inactive chromatin (15), and topologically associating domains (TADs) have been proposed as a backbone of chromatin organization that is cell type-invariant (19). In addition, high-resolution Hi-C maps have revealed chromatin loops that are conserved among cell types (18), and suggest cell lineage-specific preexisting looping that predicts gene expression (24). Furthermore, analysis of ES cells and differentiated progeny shows compartment switching, changes in domain-level interactions, and allelic gene expression imbalance (5). We have identified topological domains with the graph Laplacian method that are consistent with those topological domains identified using principal component analysis (SI Appendix, Fig. S1E). By further considering the activity of genes within a domain using RNA-seq data from the same time points, we have annotated the domains as active, inactive, or mixed state. Fig. 1 A–C shows the Fiedler vector and the identified domains using a 100-kb resolution Hi-C matrix for chromosome 4. We further examined three of the domains using the fragment-level contact maps and the corresponding expression profiles of genes within the domains (Fig. 1 D1–D3).
Fig. 1.
TAD and corresponding gene expression dynamics of chromosome 4 (Chr 4). (A) Mean RNA-seq counts [reads per kilobase length per million reads (RPKM)] of binned genes]. (B) Fiedler vector computed from the normalized Hi-C matrix. Red bins are the genes associated with the positive Fiedler vector entries, and green bins are the genes associated with negative Fiedler vector entries. (C) Hi-C matrix of Chr 4 with activity of identified TADs annotated by colored boxes on the diagonal. Active (green), inactive (blue), or mixed (black) TADs contain genes that are all actively transcribed, repressed, or a mix of both, respectively. (D1) Fragment read contact map of an inactive TAD with genes annotated by color (Left) or no detectable transcripts from any genes in this TAD over time (Right), with individual genes colored corresponding to the maps (Left). (D2) Fragment read contact map of an active TAD (Left) or active transcription of all genes in this TAD over time (Right). (D3, Left) Fragment read contact map of a mixed TAD. (D3, Right) Expression patterns of its genes are both active and inactive over time. Dashed green lines on the maps indicate HindIII cutting sites.
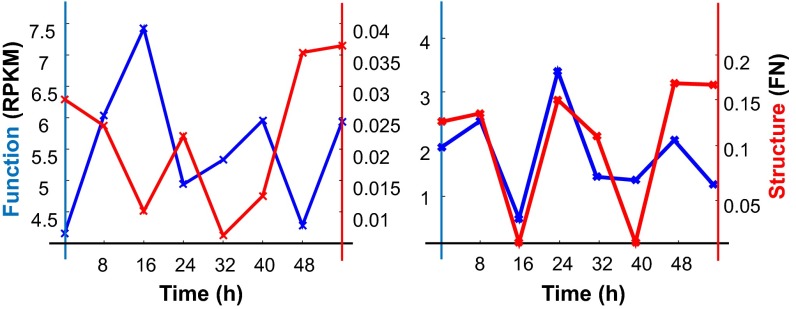
Select regions of dense contacts were observed, for example, within the clock circadian regulator (CLOCK) gene. However, the fixed resolution binning (e.g., 1 Mb, 100 kb) of conventional contact maps does not allow for gene-level analysis due to the large variability in gene lengths. We therefore constructed an adaptive gene-resolution contact matrix by summarizing the ligations according to the coordinates of genes instead of using fixed-size bins (SI Appendix, Fig. S1F). SI Appendix, Fig. S1G shows the constructed normalized contact relationships of all 617 genes on chromosome 14 over time, with RNA-seq counts for each gene shown above the contact maps. Analyzing sequential contact maps allowed us to study gene-level dynamical relationships between structure and function. Fragment contact maps also revealed specific gene-level 3D organization in space (SI Appendix, Fig. S1H). In addition, transcriptional activity appeared to be sensitive to contacts in regions flanking a gene body, which may reflect local folding within gene regulatory elements (25) (SI Appendix, Fig. S1 I–K). It is also possible to summarize the number of contacts between Hi-C restriction sites and to construct an adaptive fragment-level contact matrix, thus enabling exploration of structures within a gene itself (Fig. 2 and SI Appendix, Fig. S1H).
Fig. 2.
Gene dynamics. S-F dynamics of CLOCK (Left) and PER2 (Right).
Structure and Function Phase Plane.
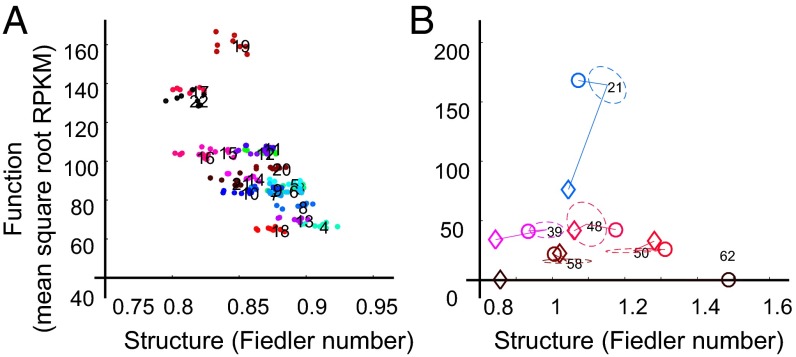
We introduce a phase plane for a qualitative assessment of the dynamics of structure and function, because these relationships are not yet well defined. In this phase plane, one axis represents structure and the other represents function for a given genomic unit. Thus, points in the plane represent structure and function values for the genomic unit at a given time. We term the difference between two points an S-F gap. In SI Appendix, Fig. S1L, we show our data in phase planes with the genomic unit as genes, TADs, and whole chromosomes. For the gene level, structure was captured by the Fiedler number for the whole gene from its fragment-level contact map (SI Appendix) and the function was captured by the transcript level as determined by RNA-seq. For larger genomic scales, structure was represented by the Fiedler number, based on the contact map of the region, and function was captured by the mean transcript levels of the region. Point clouds in the phase plane, made up of eight time points, were termed S-F domains, analogous to basins of attraction in dynamical systems theory. The difference between centroids of two S-F domains contrasts the structure and function for different genomic regions in the same cell type or the same genomic region across different cell types. We find that chromosomes occupy distinct regions in this plane, as exemplified by the positions of chromosomes 18 (gene-poor) and 19 (gene-rich) (Fig. 3A).
Fig. 3.
Four-dimensional Nucleome phase plane. (A) Phase plane for Chr 1–22. (B) Phase plane for six representative TADs from Chr 4 across three cell types. Fundamental differences are seen in TAD coordinates in ES cells (○) and lymphoblastoid cells (♢) compared with the coordinates of fibroblast TAD domains (dashed ellipses).
We hypothesized that S-F domains would be cell type-specific, and that points outside a baseline S-F domain could be used to indicate changes in cell state after perturbations. Thus, the phase plane could be used to visualize patterns in S-F status during cell differentiation or for cells evolving in response to a particular imposed environment (SI Appendix, Fig. S1M). To determine whether the phase plane representation would distinguish between cell types, we examined S-F data obtained from human ES cells (19) and from human lymphoblastoid cells (15), collected for single time points. Fig. 3B shows six representative TADs (out of 63 identified) in a phase plane comparison of ES cells and lymphoblastoid cells with fibroblasts. Nearly all of the TADs in ES cells and lymphoblastoid cells had S-F values that were at least 3 SDs outside the fibroblast S-F domain, indicating that we can easily distinguish between cell types using the S-F phase plane. Thus, using structure and function information simultaneously improves discriminative power for a better understanding of cell type specificity.
Dynamically Expressed Gene Modules.
For RNA-seq (26, 27) of primary human fibroblasts over the 56-h time course, we analyzed three replicates for each condition in cells that were initially cell cycle- and circadian rhythm-synchronized. Time 0 includes dexamethasone (dex) treatment samples and corresponding baseline controls without exposure to serum. The rest were sampled at 8-h intervals counting from time 0 after exposure to serum (Materials and Methods).
We identified a set of 7,786 genes that significantly varied in expression levels between any two time points (SI Appendix and Dataset S2). We then performed clustering analysis based on the correlation matrix of their expression levels over time, and consider the correlation matrix (shifted by one to make entries positive) as the weighted adjacency matrix (SI Appendix). Variance-normalized spectral clustering was then applied on this adjacency matrix with the cluster number set to 6, 8, 16, or 32. Through two-step spectral clustering, first to group the genes into the eight top clusters and second to recluster each top cluster into four subclusters, we found a total of 32 subclusters, which represent the expression patterns of the significant genes (SI Appendix, Fig. S2A).
We performed gene ontology (GO) analysis (28) of the genes in each subcluster for enrichment under GO terms (false discovery rate <0.05; SI Appendix, Dataset S3). A summary of the top 65 significant GO terms enriched with genes (Bonferroni P < 0.05) from each of the 32 subclusters is presented in SI Appendix, Fig. S2 B and C and Dataset S4. We also observed several characteristic expression patterns in cells after serum stimulation, which are shown in SI Appendix, Fig. S2A.
Dynamical S-F Correlations.
We have used concepts from the theory of networks to evaluate genome-wide S-F dynamical correlations. For structure, gene boundaries were defined by the transcribed region plus 2 kb upstream of the transcription start site and 2 kb downstream of the polyadenylation site (29). In method A, we used gene dynamics: the time-dependent variation in structure and function within each gene. In method B, we used gene network dynamics. Network analyses were performed using two methods. In method A, we inferred networks from gene dynamics, that is, by constructing the interaction or the edge based on the correlation between gene expression and the correlation between the structures of each gene. In method B, we constructed edges based on the correlation between gene expression and Hi-C contacts (SI Appendix, Fig. S3A). In both methods, we surveyed regulatory regions of the identified correlated gene pairs for common transcription factor binding sites and determined whether these common transcription factors were expressed in our RNA-seq dataset. Gene network dynamics therefore facilitate identification of gene pairs or clusters with high potential for coregulated expression that is consistent with the transcription factory model.
To identify the genes with S-F correlations, we studied the 7,786 genes that significantly varied in expression and then four biological modules: wound healing, cell cycle, 24-h circadian clock, and dex response. The distribution of these genes in our 32 clusters is shown in SI Appendix, Fig. S2D. The set of wound healing genes was obtained from published data (23, 30). The set of cell cycle genes was taken from the “cell cycle” GO term list (SI Appendix, Dataset S5). For the set of circadian genes, we used the 24-h periodic genes from JTK-CYCLE (31) analysis of our RNA-seq data. The dex response genes were identified using bromouride labeling and sequencing (Bru-seq), a method that captures newly synthesized transcripts (32). We found several hundred new transcripts with significant differences in abundance between samples with and without dex treatment (SI Appendix, Datasets S8 and S9).
Gene Dynamics.
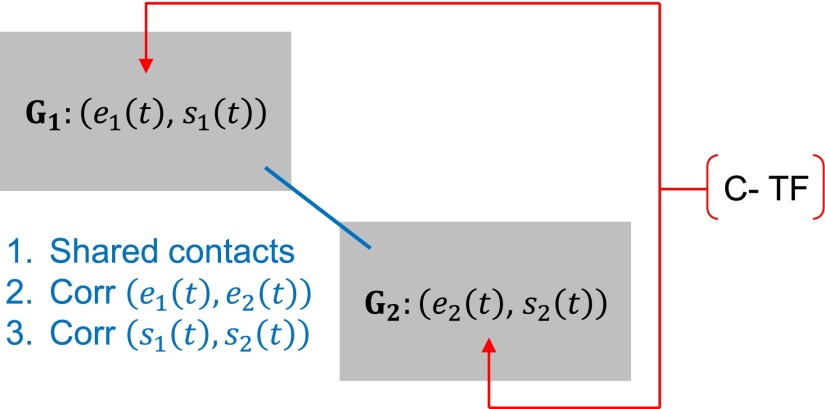
We defined gene dynamics using the dynamical correlation between gene expression and gene structure (Fig. 4 and SI Appendix, Fig. S3A). We identified a set of 2,574 genes from the 7,786 significant genes, using the following criteria: (i) a gene’s Hi-C Fiedler number >0 for at least four time points (a value of 0 was considered artifactual), (ii) the absolute value of the correlation between RNA-seq and a Fiedler number >0.3, and (iii) genes were along a unique length of DNA.
Fig. 4.
Synthetic transcription factory (STF). G1 and G2 are two genes, where e1(t) and e2(t) are their expression levels over time and s1(t) and s2(t) are their structural changes over time. The potential for interaction between G1 and G2 can be defined with (i) shared contacts, (ii) the correlation between their expression [Corr(e1(t), e2(t))], (iii) the correlation between their structures [Corr(s1(t),s2(t))], and (iv) common transcription factors (C-TF), as determined by common binding motifs and expression of the transcription factors in our RNA-seq data. If conditions 1–4 are satisfied, the two genes have high potential for common regulation via shared transcriptional space, consistent with a transcription factory model.
Gene Network Dynamics.
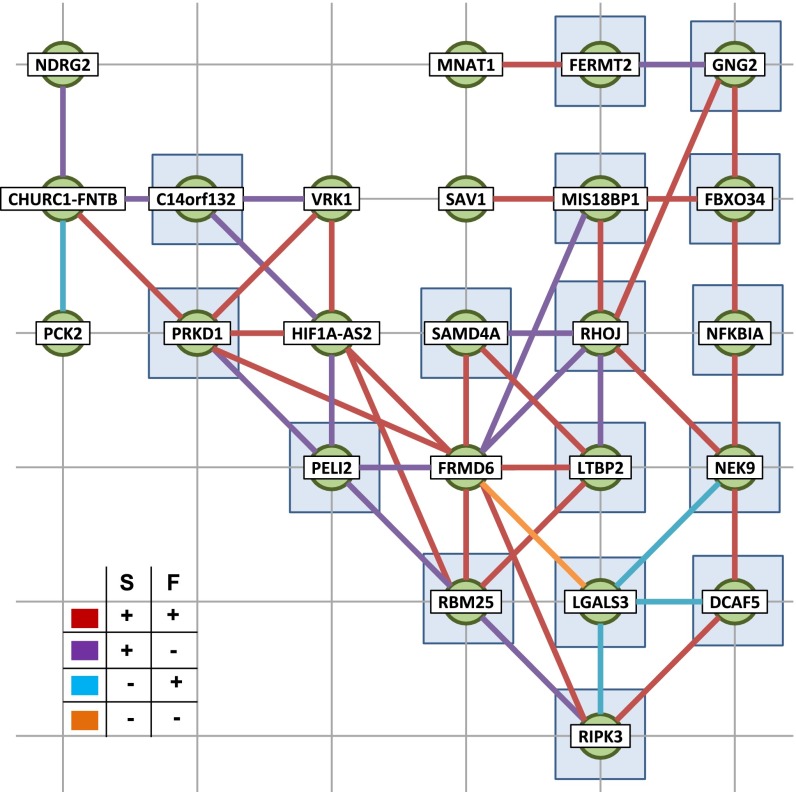
We first constructed networks by considering the correlation between gene structures represented by Fiedler number. We performed the analysis (method A above; steps and parameters are shown in SI Appendix, Fig. S3A) on the above-mentioned 2,574 genes, chromosome by chromosome. A total of 986 gene pairs were identified (SI Appendix, Dataset S10). We report the identified gene pairs and the constructed networks for chromosome 14 in Fig. 5. We then identified common binding sites of expressed transcription factors for these gene pairs (SI Appendix). We found that gene pairs shared more binding sites than randomly expected in 16 of 22 chromosomes (SI Appendix, Fig. S3B), suggesting that transcription may be coordinated in these structure- and function-correlated gene pairs. We also examined the mean contact over time between all gene pairs of the extracted 2,574 genes. We found that if two genes have a high Fiedler number correlation, they are more likely to have contacts between them (SI Appendix, Fig. S3C).
Fig. 5.
Networks of dynamic intracorrelated and intercorrelated S-F gene pairs on Chr 14. Green nodes represent genes, and thick edges between pairs of genes represent a correlation. (Inset) Colors of edges show how the two genes are correlated (color key). Genes with transcription factors in common with all other genes that share edges are denoted by shaded blue squares. Transcription factors associated with gene pairs are shown in SI Appendix, Dataset S10.
We applied the above analysis to the four biological modules and found 35 wound healing, 49 cell cycle, 52 circadian clock, and 49 dex response gene pairs that were highly correlated between structure and function (SI Appendix, Dataset S10). Networks constructed for the circadian clock module are shown in Fig. 3 D–I, and the others are shown in SI Appendix, Fig. S3 C–G. We also mapped common binding sites for all these gene pairs, as shown in SI Appendix, Dataset S10.
We then constructed gene networks by considering the correlation between transcription and pairwise contacts over time (method B above; steps and parameters are shown in SI Appendix, Fig. S3A). Coregulation networks can be established via the gene pairs that behave in this manner. We found 873 gene pairs by performing this analysis on the dynamic gene set, chromosome by chromosome. Three selected networks for chromosome 14, with average gene expression and average gene contacts within each network, are shown in SI Appendix, Fig. S3L. We identified 22 gene pairs for chromosome 14. A permutation test was then performed to show the significance of the number of identified pairs (SI Appendix, Fig. S3J). SI Appendix, Fig. S3K shows the number of pairs identified using various correlation thresholds. Identified gene pairs for all chromosomes are reported in SI Appendix, Dataset S11, along with shared transcription factor motifs.
The analysis was then applied to the four biological modules. A total of 43 wound healing, 214 cell cycle, 104 circadian clock, and 104 dex response gene pairs were found to be significantly correlated (SI Appendix, Fig. S3J). Representative networks of all modules, along with their mean expression and the contacts, are shown in SI Appendix, Fig. S3 L–P and Dataset S10. In addition, we identified gene networks in which expression was anticorrelated with contacts over time, which may indicate a common repressing mechanism (SI Appendix, Fig. S3Q). To measure the intersection between method A and method B, we computed the correlation of Fiedler number between the gene pairs identified above, and found that 64% (14 pairs), 63% (27 pairs), 82% (176 pairs), 70% (73 pairs), and 78% (81 pairs) (for chromosome 14 and the four respective gene modules) had absolute Fiedler number correlations larger than 0.3.
Periodicity in Spatial Movement in Core Circadian Genes.
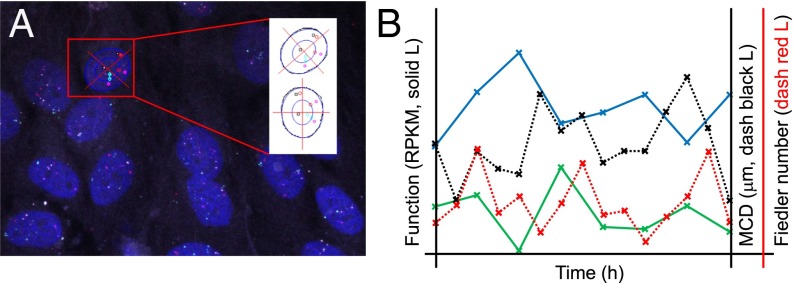
We used multicolor 3D-FISH to examine spatial dynamics of the core circadian genes CLOCK, aryl hydrocarbon receptor nuclear translocator-like (ARNTL), cryptochrome 1 (CRY1), and period 2 (PER2) (33) (SI Appendix), which have well-studied transcriptional periodicity. Notably, although we found no Hi-C contacts between CLOCK and PER2 (SI Appendix, Fig. S4 A and B), we found that CLOCK S-F dynamics are negatively correlated, whereas they are positively correlated for PER2. Because transcriptional activity that is concurrent with movement in the nucleus has been reported (2, 9), we hypothesized that CLOCK and PER2, which have antiphase transcriptional periodicity (33), would show distinct spatial dynamics. We therefore used multicolor 3D-FISH to obtain the allele locations of the genes for each of 16 time points simultaneously (Fig. 6A).
Fig. 6.
Processing of 3D-FISH raw data maximum projection images (MPIs). (A) Cartesian coordinate system is superimposed after fitting nuclei to an ellipse. Red, cyan, white, and magenta points represent probe signals for PER2, cryptochrome 1 (CRY1), aryl hydrocarbon receptor nuclear translocator-like (ARNTL), and CLOCK, respectively. (B) RNA-seq data over time are plotted on the left y axis for CLOCK [solid blue line (L)] and PER2 (solid green L) in RPKM. MCD in micrometers (dashed black L) and Fiedler number (dashed red L) between CLOCK and PER2 over time are plotted on the right y axis.
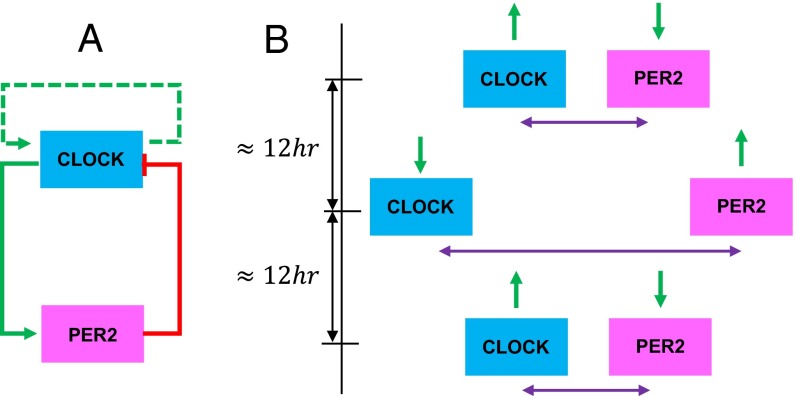
We used two measures to quantify the dynamics of the relative distances between gene pairs for all four circadian genes. The first measure was the mean closest distance (MCD; SI Appendix, Fig. S4C) between each gene pair (relative distance curve), and the second measure was the Fiedler number of the Euclidian distance matrix among the four genes (stability curve). We then correlated these measures with transcription data. We found that the relative distance and stability curves for CLOCK and PER2 showed periodicity, and followed a 24-h circadian rhythm (Fig. 6B and SI Appendix, Fig. S4 D and E). When the MCD between PER2 and CLOCK was at its minimum, PER2 transcription was minimal and CLOCK transcription was maximal, and vice versa. Collectively, we observed that the MCD, the Fiedler number, and expression levels over time between PER2 and CLOCK were all within approximately 6-h phase shifts of one another. This CLOCK/PER2 system had the highest Fiedler numbers when CLOCK and PER2 had the largest relative distance between them, which may hint at a particular state or time for which genome topology has particular significance in circadian gene dynamics. A schematic of this process is outlined in Fig. 7 and SI Appendix, Fig. S4 E and F. These observations provide insight into circadian gene modules, although the mechanisms driving these S-F dynamics require further investigation.
Fig. 7.
CLOCK/PER2 circuit. (A) Proposed feedback circuit for CLOCK and PER2 expression, where CLOCK may self-activate. (B) Relative expression of CLOCK and PER2 (green arrows) at given relative Euclidian distances (purple arrows).
Discussion
In the current study on genome S-F dynamics, we have analyzed Hi-C and RNA-seq data sampled over a 56-h time course in primary human fibroblasts. We have developed a mathematical framework that we demonstrate effectively captures known characteristics of interphase chromosome organization, such as partitioning the genome into compartments and identification of TADs (15, 19, 32). This framework additionally provides the Fiedler number, a useful quantitative measure of the stability of underlying topology at any desired genomic scale. Measures of topology of a graph have provided useful information in many fields that can predict behavior or properties of that graph. For example, the Fiedler number of the weighted Laplacian has been used in multiagent networked systems to describe interactions between nodes, and further for studying how to impose control efficiently on the network (10). Moreover, the Wiener index in chemical graph theory is a measure of the topology of molecules that correlates with their properties, such as boiling points and behavior in liquid phase (34, 35).
Tailoring bin sizes of Hi-C contacts to fit known genes has facilitated assessment of S-F relationships, both within and between those genes, vs. binning in fixed lengths along the genome. Thus, we have captured gene-level structure, as well as expression for each gene. Although we focused primarily on transcribed regions of genes, similar analyses could be conducted for other genomic regions with known boundaries. For example, known regulatory regions could be assessed genome-wide for local higher order structures and how these structures correlate with expression in a particular cell type or state.
In proliferating human fibroblasts, the 7,786 genes with highly dynamic expression may be considered a wound healing module that responds to proliferation cues, such as serum stimulation (23); indeed, we found that 76% of known wound healing genes were within this highly dynamic set (SI Appendix, Dataset S3). A large number of genes in this highly dynamic set have highly correlated S-F dynamics, but the significance of this property and whether it is found in other cell types are not yet known. Interestingly, the wound healing response overlaps with cancer metastasis (23, 30). Thus, a better understanding of the wound healing module may provide insight into cellular functions that are active in metastatic cancer cells.
For S-F data collected over time, we have developed an algorithm for genome-wide identification of gene pairs or networks and candidate transcription factors that may be involved in coordinated gene expression. Criteria used in this identification are consistent with expression via transcription factories, although it is unknown whether genes would be actively recruited into or spontaneously self-organize in shared transcriptional space. Our algorithm could be used in any system to identify novel or key interacting genes, and varying correlation thresholds provides additional flexibility in restricting analyses to gene pairs with particular S-F properties (SI Appendix, Fig. S3A and Datasets S10 and S11). The observations of CLOCK and PER2 transcription and genomic movements in 3D space provide a geometric picture of gene regulation in the context of circadian clocks, one that may give insight into the mechanisms regulating biological time. These studies also suggest that important spatial relationships may be too distant in Euclidian space for capture by Hi-C.
Phase planes have helped us to visualize dynamic S-F correlations (Fig. 3 and SI Appendix, Fig. S1L) and serve as a coordinate system for distinguishing different cell types with more discriminative power than use of a single index, such as gene expression. Trajectories within this coordinate system could be evaluated quantitatively as well. We envision applications in the study of cellular differentiation to identify states that represent previously undescribed intermediates along a cell lineage or in the identification of disease states. Investigating cellular states with particular S-F relationships may provide insight into the coregulated gene networks driving each stage of differentiation. Furthermore, our 4DN framework could provide insight into key stages of differentiation that are vulnerable to external influence, based on the S-F dynamics of gene networks that are active at that stage, and understanding of whether key nodes within those networks have influence on global cellular states. Thus, network-based analyses of gene interactions may guide intelligent reprogramming strategies that target vulnerable stages or key nodes. In addition, dynamical S-F relationships may provide clues as to the nature of abnormal cellular states, such as cancer progression.
Materials and Methods
Hi-C, RNA-seq, Bru-seq, and multicolor 3D-FISH data were collected from cell cycle- and circadian rhythm-synchronized proliferating human fibroblasts of normal karyotype. Data were collected every 8 h for Hi-C and RNA-seq, and every 4 h for 3D-FISH, spanning a total of 56 h. Detailed materials and methods are provided in SI Appendix.
Supplementary Material
Acknowledgments
We thank the University of Michigan Sequencing Core, and especially Jeanne Geskes, for assistance. We thank Richard McEachin and Nicholas Comment for support in processing Illumina sequence data with a standardized pipeline. We also thank Laura Seaman, Ravi Allada, Alfred Hero, Daniel Burns, and Vyrn Muir for critical reading of the manuscript and helpful discussions. We extend special thanks to James Gimlett and Fariba Fahroo at Defense Advanced Research Projects Agency (DARPA) and Christian Macedonia for support and encouragement. We are grateful to Job Dekker for providing the Hi-C protocol. This work is supported, in part, by the DARPA Biochronicity Program and NIH Grant K25DK082791-01A109 (to I.R.).
Footnotes
The authors declare no conflict of interest.
This article is a PNAS Direct Submission.
This article contains supporting information online at www.pnas.org/lookup/suppl/doi:10.1073/pnas.1505822112/-/DCSupplemental.
References
- 1.Cavalli G, Misteli T. Functional implications of genome topology. Nat Struct Mol Biol. 2013;20(3):290–299. doi: 10.1038/nsmb.2474. [DOI] [PMC free article] [PubMed] [Google Scholar]
- 2.Rajapakse I, Groudine M. On emerging nuclear order. J Cell Biol. 2011;192(5):711–721. doi: 10.1083/jcb.201010129. [DOI] [PMC free article] [PubMed] [Google Scholar]
- 3.Babaei S, Akhtar W, de Jong J, Reinders M, de Ridder J. 3D hotspots of recurrent retroviral insertions reveal long-range interactions with cancer genes. Nat Commun. 2015;6(6381):6381. doi: 10.1038/ncomms7381. [DOI] [PMC free article] [PubMed] [Google Scholar]
- 4.Naumova N, et al. Organization of the mitotic chromosome. Science. 2013;342(6161):948–953. doi: 10.1126/science.1236083. [DOI] [PMC free article] [PubMed] [Google Scholar]
- 5.Dixon JR, et al. Chromatin architecture reorganization during stem cell differentiation. Nature. 2015;518(7539):331–336. doi: 10.1038/nature14222. [DOI] [PMC free article] [PubMed] [Google Scholar]
- 6. NIH Office of Strategic Information (2014) The Common Fund. 4D Nucleome Overview. Available at commonfund.nih.gov/4DNucleome/overview. Accessed February 4, 2015.
- 7. DARPA (2011) Biological Technologies Office, Biochronicity Program. Available at www.darpa.mil/our_work/bto/programs/biochronicity.aspx. Accessed February 4, 2015.
- 8.Balsalobre A, et al. Resetting of circadian time in peripheral tissues by glucocorticoid signaling. Science. 2000;289(5488):2344–2347. doi: 10.1126/science.289.5488.2344. [DOI] [PubMed] [Google Scholar]
- 9.Ragoczy T, Bender MA, Telling A, Byron R, Groudine M. The locus control region is required for association of the murine beta-globin locus with engaged transcription factories during erythroid maturation. Genes Dev. 2006;20(11):1447–1457. doi: 10.1101/gad.1419506. [DOI] [PMC free article] [PubMed] [Google Scholar]
- 10.Olfati-Saber R, Fax JA, Murray RM. Consensus and Cooperation in Networked Multi-Agent Systems. Proc IEEE. 2007;95(1):215–233. [Google Scholar]
- 11.Cucker F, Smale S. Emergent behavior in flocks. IEEE Trans Automat Contrl. 2007;52(5):852–862. [Google Scholar]
- 12.Cucker F, Smale S. On the mathematics of emergence. Jpn J Math. 2007;2(1):197–227. [Google Scholar]
- 13.Lee AB, Luca D, Roeder K. A Spectral Graph Approach to Discovering Genetic Ancestry. Ann Appl Stat. 2010;4(1):179–202. doi: 10.1214/09-AOAS281. [DOI] [PMC free article] [PubMed] [Google Scholar]
- 14.Chung FR. Spectral Graph Theory. American Mathematical Society; Providence, RI: 1997. [Google Scholar]
- 15.Lieberman-Aiden E, et al. Comprehensive mapping of long-range interactions reveals folding principles of the human genome. Science. 2009;326(5950):289–293. doi: 10.1126/science.1181369. [DOI] [PMC free article] [PubMed] [Google Scholar]
- 16.Rajapakse I, Groudine M, Mesbahi M. Dynamics and control of state-dependent networks for probing genomic organization. Proc Natl Acad Sci USA. 2011;108(42):17257–17262. doi: 10.1073/pnas.1113249108. [DOI] [PMC free article] [PubMed] [Google Scholar]
- 17.Hirsch MW, Smale S, Devaney RL. Differential Equations, Dynamical Systems, and an Introduction to Chaos. 2nd Ed Elsevier; San Diego: 1974. [Google Scholar]
- 18.Rao SS, et al. A 3D map of the human genome at kilobase resolution reveals principles of chromatin looping. Cell. 2014;159(7):1665–1680. doi: 10.1016/j.cell.2014.11.021. [DOI] [PMC free article] [PubMed] [Google Scholar]
- 19.Dixon JR, et al. Topological domains in mammalian genomes identified by analysis of chromatin interactions. Nature. 2012;485(7398):376–380. doi: 10.1038/nature11082. [DOI] [PMC free article] [PubMed] [Google Scholar]
- 20.Filippova D, Patro R, Duggal G, Kingsford C. Identification of alternative topological domains in chromatin. Algorithms Mol Biol. 2014;9(14):14. doi: 10.1186/1748-7188-9-14. [DOI] [PMC free article] [PubMed] [Google Scholar]
- 21.Duan Z, et al. A three-dimensional model of the yeast genome. Nature. 2010;465(7296):363–367. doi: 10.1038/nature08973. [DOI] [PMC free article] [PubMed] [Google Scholar]
- 22.Varoquaux N, Ay F, Noble WS, Vert JP. A statistical approach for inferring the 3D structure of the genome. Bioinformatics. 2014;30(12):i26–i33. doi: 10.1093/bioinformatics/btu268. [DOI] [PMC free article] [PubMed] [Google Scholar]
- 23.Iyer VR, et al. The transcriptional program in the response of human fibroblasts to serum. Science. 1999;283(5398):83–87. doi: 10.1126/science.283.5398.83. [DOI] [PubMed] [Google Scholar]
- 24.Jin F, et al. A high-resolution map of the three-dimensional chromatin interactome in human cells. Nature. 2013;503(7475):290–294. doi: 10.1038/nature12644. [DOI] [PMC free article] [PubMed] [Google Scholar]
- 25.ENCODE Project Consortium An integrated encyclopedia of DNA elements in the human genome. Nature. 2012;489(7414):57–74. doi: 10.1038/nature11247. [DOI] [PMC free article] [PubMed] [Google Scholar]
- 26.Wang Z, Gerstein M, Snyder M. RNA-Seq: A revolutionary tool for transcriptomics. Nat Rev Genet. 2009;10(1):57–63. doi: 10.1038/nrg2484. [DOI] [PMC free article] [PubMed] [Google Scholar]
- 27.Mortazavi A, Williams BA, McCue K, Schaeffer L, Wold B. Mapping and quantifying mammalian transcriptomes by RNA-Seq. Nat Methods. 2008;5(7):621–628. doi: 10.1038/nmeth.1226. [DOI] [PubMed] [Google Scholar]
- 28.Huang W, Sherman BT, Lempicki RA. Systematic and integrative analysis of large gene lists using DAVID bioinformatics resources. Nat Protoc. 2009;4(1):44–57. doi: 10.1038/nprot.2008.211. [DOI] [PubMed] [Google Scholar]
- 29.Cao Y, et al. Genome-wide MyoD binding in skeletal muscle cells: A potential for broad cellular reprogramming. Dev Cell. 2010;18(4):662–674. doi: 10.1016/j.devcel.2010.02.014. [DOI] [PMC free article] [PubMed] [Google Scholar]
- 30.Chang HY, et al. Gene expression signature of fibroblast serum response predicts human cancer progression: Similarities between tumors and wounds. PLoS Biol. 2004;2(2):E7. doi: 10.1371/journal.pbio.0020007. [DOI] [PMC free article] [PubMed] [Google Scholar]
- 31.Hughes ME, Hogenesch JB, Kornacker K. JTK_CYCLE: An efficient nonparametric algorithm for detecting rhythmic components in genome-scale data sets. J Biol Rhythms. 2010;25(5):372–380. doi: 10.1177/0748730410379711. [DOI] [PMC free article] [PubMed] [Google Scholar]
- 32.Paulsen MT, et al. Coordinated regulation of synthesis and stability of RNA during the acute TNF-induced proinflammatory response. Proc Natl Acad Sci USA. 2013;110(6):2240–2245. doi: 10.1073/pnas.1219192110. [DOI] [PMC free article] [PubMed] [Google Scholar]
- 33.Buhr ED, Takahashi JS. Molecular components of the Mammalian circadian clock. Handb Exp Pharmacol. 2013;(217):3–27. doi: 10.1007/978-3-642-25950-0_1. [DOI] [PMC free article] [PubMed] [Google Scholar]
- 34.Needham DE, Wei IC, Seybold PG. Molecular modeling of the physical properties of alkanes. J Am Chem Soc. 1988;110(13):4186–4194. [Google Scholar]
- 35.Wiener H. Structural determination of paraffin boiling points. J Am Chem Soc. 1947;69(1):17–20. doi: 10.1021/ja01193a005. [DOI] [PubMed] [Google Scholar]
Associated Data
This section collects any data citations, data availability statements, or supplementary materials included in this article.


