

Abstract
Primary coenzyme Q10 (CoQ10) deficiency is due to mutations in genes involved in CoQ biosynthesis. The disease has been associated with five major phenotypes, but a genotype–phenotype correlation is unclear. Here, we compare two mouse models with a genetic modification in Coq9 gene (Coq9Q95X and Coq9R239X), and their responses to 2,4-dihydroxybenzoic acid (2,4-diHB). Coq9R239X mice manifest severe widespread CoQ deficiency associated with fatal encephalomyopathy and respond to 2,4-diHB increasing CoQ levels. In contrast, Coq9Q95X mice exhibit mild CoQ deficiency manifesting with reduction in CI+III activity and mitochondrial respiration in skeletal muscle, and late-onset mild mitochondrial myopathy, which does not respond to 2,4-diHB. We show that these differences are due to the levels of COQ biosynthetic proteins, suggesting that the presence of a truncated version of COQ9 protein in Coq9R239X mice destabilizes the CoQ multiprotein complex. Our study points out the importance of the multiprotein complex for CoQ biosynthesis in mammals, which may provide new insights to understand the genotype–phenotype heterogeneity associated with human CoQ deficiency and may have a potential impact on the treatment of this mitochondrial disorder.
Keywords: CoQ multiprotein complex, Coq9, mitochondrial myopathy, mouse model, nonsense-mediated mRNA decay
Introduction
Coenzyme Q (CoQ) is an essential molecule for mitochondrial ATP synthesis and other metabolic processes (Turunen et al, 2004; Garcia-Corzo et al, 2013). Its endogenous biosynthesis occurs ubiquitously in the mitochondria and starts with the formation of a 4-hydroxybenzoate (4-HB) head group and a lipophilic polyisoprenoid tail. While the quinone ring is derived from tyrosine or phenylalanine, the isoprenoid side chain is produced by addition of isopentenyl diphosphate molecules to farnesyl diphosphate or geranylgeranyl diphosphate in multiple steps catalyzed by polyprenyl diphosphate synthase (PDSS1–PDSS2). Then, 4-para-hydroxybenzoate:polyprenyl transferase, encoded by Coq2, mediates the conjugation of the aromatic ring precursor, 4-HB, to the side chain, while five other enzymes, encoded by Coq3 to Coq7, reside in the mitochondrial inner membrane and modify the quinone ring of CoQ (Supplementary Fig S1) (Tran & Clarke, 2007). Other proteins are thought to have regulatory functions in the CoQ biosynthetic pathway: (i) COQ9 is essential for the function of COQ7, an enzyme that catalyzes the hydroxylation of demethoxyubiquinone to produce 5-hydroxyquinone (Garcia-Corzo et al, 2013); (ii) ADCK3 and ADCK4 regulate other CoQ biosynthetic proteins by their kinase activities (Tran & Clarke, 2007); and (iii) PTC7 regulates the activity of COQ7 by its phosphatase activity (Martin-Montalvo et al, 2013). Moreover, several studies have shown evidence that, in yeast, the enzymes required for CoQ biosynthesis are organized in a multiprotein complex. This organization would allow channeling of labile/reactive intermediates, enhance catalytic efficiency, and provide a mechanism for coordinative regulation of components (Tran & Clarke, 2007). However, there is no proof of the existence of a multiprotein complex for CoQ biosynthesis in mammals.
Mutations in CoQ biosynthetic genes produce primary CoQ10 deficiency, a mitochondrial syndrome with five major clinical presentations: (i) encephalomyopathy with brain involvement and recurrent myoglobinuria; (ii) infantile multisystem disorder with encephalopathy usually associated with nephropathy and variable involvement of other organs; (iii) ataxic syndrome with cerebellar atrophy; (iv) isolated myopathy; and (v) steroid-resistant nephrotic syndrome (Emmanuele et al, 2012). Moreover, mutations in COQ2 have been recently reported in Japanese patients with multiple system atrophy (Multiple-System Atrophy Research, 2013). The causes of this clinical variability are unknown, and it is difficult to explain why mutations in the same gene may cause different phenotypes, for example, mutations in COQ2 and COQ6 have been associated with isolated nephropathy or multisystemic disease (Quinzii et al, 2006; Diomedi-Camassei et al, 2007; Heeringa et al, 2011; Jakobs et al, 2013), due to the limited number of patients described.
To better understand the pathophysiologic consequences of primary CoQ10 deficiency, we recently generated a mouse model carrying a homozygous mutation in Coq9 gene (R239X, Coq9R239X). This mutation is homologue to the human R244X mutation (Duncan et al, 2009). Coq9R239X mice showed widespread CoQ deficiency (Garcia-Corzo et al, 2013), and their characterization demonstrated that: (i) the presence of a dysfunctional COQ9 protein and/or the deficit in CoQ in the brain causes an increase in free complex III, leading to a decrease in mitochondrial respiration and ATP synthesis, (ii) mitochondrial dysfunction in the brain induces oxidative damage and a caspase-independent apoptotic cell death, and (iii) the encephalomyopathic form of CoQ deficiency is progressive and takes place with neuronal death, severe reactive astrogliosis and spongiform degeneration. Therefore, Coq9R239X mice show clinical, histopathological, biochemical and molecular signs of a fatal mitochondrial encephalomyopathy (Garcia-Corzo et al, 2013).
To understand the molecular mechanisms underlying the genotype–phenotype correlation in CoQ deficiency, we have generated and characterized at biochemical, molecular and clinical level a new mouse model with a different genetic defect in the same Coq9 gene, specifically, a homozygous Coq9 Q95X mutant (Coq9Q95X), to compare with the Coq9R239X mouse model.
Results
Lack of the Coq9 protein causes moderate CoQ deficiency
Coq9Q95X mice pups had normal development and were indistinguishable from wild-type mice (Coq9+/+). As described in the Coq9R239X, by postnatal day 21, Coq9Q95X mice had also lost their body hair (Fig1A), which grew back during the next hair growth cycle.
Figure 1.
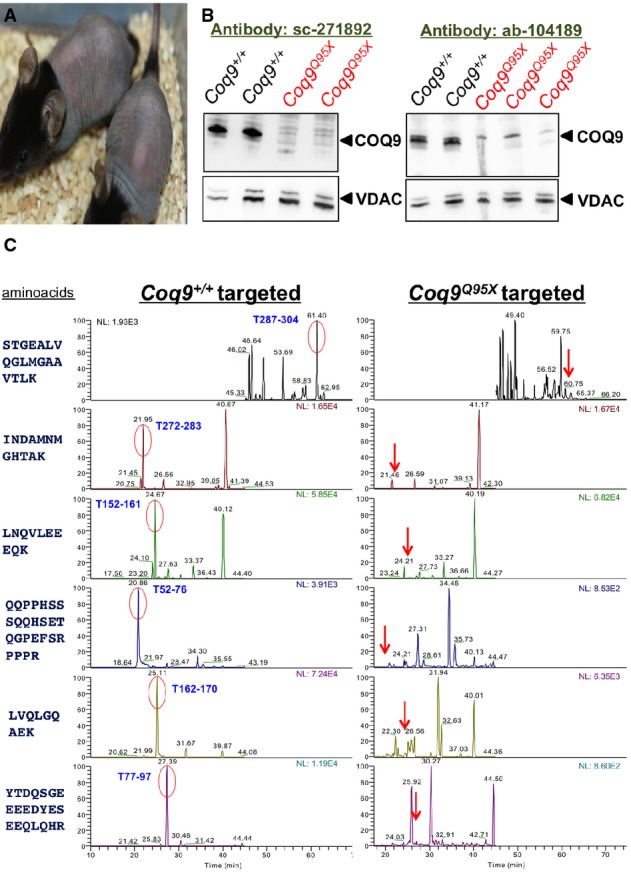
- Coq9Q95X mice at 21 postnatal days showing the loss of corporal hair.
- Representative Western blot images of COQ9 protein in kidney homogenate from Coq9+/+ (n = 4) and Coq9Q95X mice (n = 4) at 3 months of age. Antibody sc-271892 was used to map the C-terminal region of the COQ9 protein and antibody ab-104189 was used to map the internal sequence of the COQ9 protein.
- High-resolution LC-MS/MS proteomic analysis of kidney mitochondria from Coq9+/+ (n = 3) and Coq9Q95X mice (n = 3) at 3 months of age. None of the six peptides of the COQ9 protein identified in Coq9+/+ mice was detected in Coq9Q95X mice.
Source data are available online for this figure.
To prove that wild-type COQ9 protein was not produced in Coq9Q95X mice, we first performed an immunoblotting analysis using two different anti-COQ9 antibodies: one against amino acids 165–318, to map the C-terminal region of the protein (sc-271892), and the other against amino acids 160–190, corresponding to a region within internal sequence of the COQ9 protein (ab-104189). No protein was detected in Coq9Q95X mice compared to wild-type (Fig1B). To check whether the premature termination of the COQ9 protein induces the complete loss of the protein, we also performed a proteomic analysis by high-resolution LC-MS/MS against six identified peptides from the COQ9 protein, one of them being (QQPPHSSSQQHSETQGPEFSRPPR) present in a possible truncated version of the protein of 95 amino acids (Pagliarini et al, 2008). Although COQ9 was clearly detected in the wild-type samples, none of its peptides were observed in Coq9Q95X mice (Fig1C), demonstrating that the COQ9 protein was completely absent in Coq9Q95X mice. In contrast, in Coq9R239X mice, a truncated version of COQ9 protein was observed by Western blot using an antibody against the internal sequence of the protein (Supplementary Fig S2).
The consequence of the lack of the COQ9 protein was a significant decrease of both CoQ9 (the major form of ubiquinone in rodents) and CoQ10 levels in all examined tissues (cerebrum, cerebellum, heart, kidney, extensor and triceps surae) of Coq9Q95X mice compared with the age-mated Coq9+/+mice (Fig2A–F and Supplementary Fig S3A–F). While CoQ9 levels were around 50% in cerebrum, cerebellum and heart (Fig2A–C), kidney and skeletal muscle had 30% of residual CoQ9 levels compared with wild-type animals (Fig2D–F).
Figure 2.
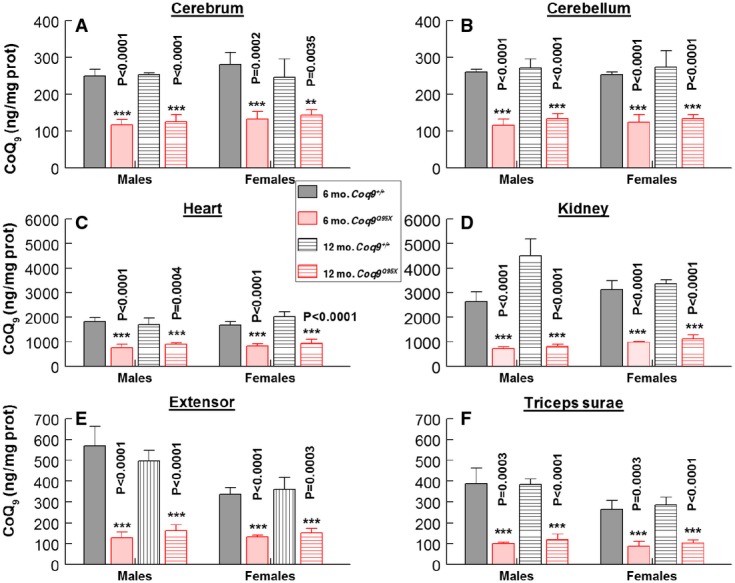
- A–F CoQ9 levels in tissue homogenates from brain (A), cerebellum (B), heart (C), kidney (D), extensor (E) and triceps surae (F) of male and female Coq9+/+ and Coq9Q95X mice at 6 and 12 months of age. Data are expressed as mean ± SD. Statistical analysis was performed on 6-month-old Coq9+/+ mice versus 6-month-old Coq9Q95X mice and 12-month-old Coq9+/+ mice versus 12-month-old Coq9Q95X mice. **P < 0.01; ***P < 0.001. Student's t-test (n = 8 for each group).
Source data are available online for this figure.
An intriguing observation was that in all tissues, CoQ9 levels in Coq9Q95X mice were higher compared with Coq9R239X mice, in which residual CoQ9 levels were around 20% compared to wild-type animals (Fig3A–F). However, muscle was the tissue with more similar CoQ9 levels between both models (Fig3F).
Figure 3.
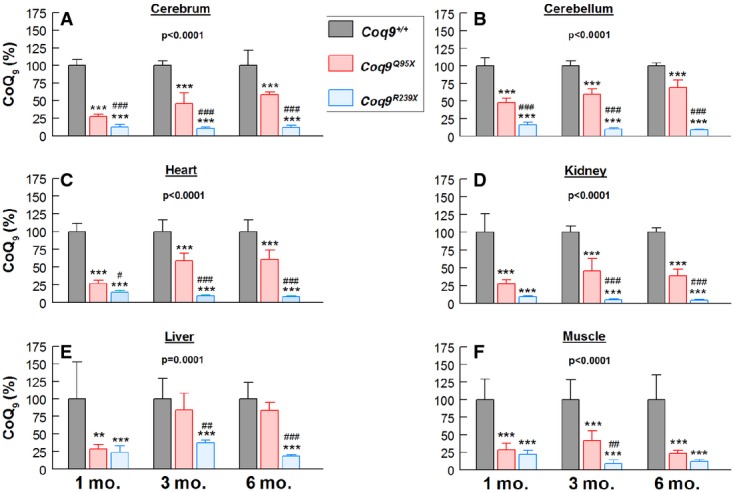
- A–F Residual CoQ9 levels in tissue homogenates from brain (A), cerebellum (B), heart (C), kidney (D), liver (E) and skeletal muscle (F) of Coq9+/+, Coq9Q95X and Coq9R239X mice at 1, 3 and 5 months of age. Data are expressed as mean ± SD. **P < 0.01; ***P < 0.001; Coq9Q95X and Coq9R239X mice versus Coq9+/+ mice. #P < 0.05; ##P < 0.01; ###P < 0.001; Coq9Q95X versus Coq9R239X mice (one-way ANOVA with a Tukey's post hoc test; n = 8 for each group; numbers above columns indicate P-values of the one-way ANOVA test).
Two distinctive mutations in the Coq9 gene induce different changes in the Coq biosynthetic gene expression and protein level
The differences found in CoQ9 levels between the Coq9Q95X and Coq9R239X mice may be due to differences in the expression of the Coq genes or, alternatively, to differences in the stability of the CoQ multiprotein complex manifested by different levels of COQ proteins.
By virtue of that, we first determined mRNA expression levels of some genes encoding proteins that are involved in CoQ biosynthesis and are components of the CoQ mutiprotein complex, that is, Coq9, Coq7, Coq6, Coq5 and Adck3, in cerebrum, kidney and muscle from age-matched Coq9+/+, Coq9Q95X and Coq9R239X mice.
In cerebrum and kidney, Coq9 mRNA levels were nearly undetectable in Coq9Q95X compared with Coq9+/+ mice (1 ± 0.38 and 1 ± 0.90%, respectively) and significantly decreased in Coq9R239X compared with Coq9+/+ mice (18 ± 0.38 and 10 ± 0.21%, respectively) (Fig4A and F). Similar levels of Coq7 and Coq5 mRNA expression were detected in cerebrum and kidney of Coq9Q95X, Coq9R239X and Coq9+/+ mice (Fig4B, D, G and I), while Coq6 was significantly decreased (72.1 ± 4.35%) only in cerebrum of Coq9Q95X compared with Coq9+/+ mice (Fig4D); Adck3 was slightly increased in kidney of Coq9R239X compared to Coq9Q95X (116 ± 7.9 versus 85.1 ± 20.6%) (Fig4H). In muscle, Coq9 mRNA levels were similarly decreased in both Coq9Q95X and Coq9R239X (3 ± 0.9 and 0.5 ± 0.2%) compared to Coq9+/+ mice (Fig4K). Moreover, Adck3 and Coq5 mRNA levels were significantly decreased in Coq9Q95X mice compared to Coq9+/+ mice (65.3 ± 11.1% for Adck3 and 77.6 ± 8.9% for Coq5) (Fig4M and N). Comparing the two mutant mice, it is remarkable that Coq9 mRNA expression levels in cerebrum and kidney of Coq9R239X mice were significantly higher compared to Coq9Q95X (18.3 ± 1.6 versus 1.3 ± 0.4% in cerebrum and 10.6 ± 2.2 versus 1.3 ± 0.9% in kidney) (Fig4A and F). In contrast, in muscle, there were no differences in Coq9 mRNA levels between the two mutant models (Fig4K). The degradation of the mutant Coq9 mRNA in both mouse models (Coq9Q95X and Coq9R239X) is due to nonsense-mediated mRNA decay (NMD) since the treatment of mutant MEFs with cyclohexamide, an inhibitor of NMD (Rio Frio et al, 2008), increased the levels of Coq9 mRNA in Coq9Q95X (fold increase 5.5 ± 1.1, treated/untreated) and Coq9R239X (fold increase 21.4 ± 6.8, treated/untreated) compared to the mild effect in Coq9+/+ (fold increase 1.5 ± 0.1, treated/untreated) cells (Table1).
Figure 4.

- A–E mRNA expression levels of Coq9 (A), Coq7 (B), Adck3 (C), Coq5 (D) and Coq6 (E) on cerebrum of Coq9+/+, Coq9Q95X and Coq9Q95X mice at 3 months of age. **P < 0.01; ***P < 0.001; Coq9Q95X and Coq9R239X mice versus Coq9+/+ mice. ###P < 0.001; Coq9Q95X versus Coq9R239X mice.
- F–J mRNA expression levels of Coq9 (F), Coq7 (G), Adck3 (H), Coq5 (I) and Coq6 (J) on kidney of Coq9+/+, Coq9Q95X and Coq9Q95X mice at 3 months of age. ***P < 0.001; Coq9Q95X and Coq9R239X mice versus Coq9+/+ mice. #P < 0.05; ###P < 0.001; Coq9Q95X versus Coq9R239X mice.
- K–O mRNA expression levels of Coq9 (K), Coq7 (L), Adck3 (M), Coq5 (N) and Coq6 (O) on triceps surae of Coq9+/+, Coq9Q95X and Coq9Q95X mice at 3 months of age. *P < 0.05; ***P < 0.001; Coq9Q95X and Coq9R239X mice versus Coq9+/+ mice. #P < 0.05; Coq9Q95X versus Coq9R239X mice.
Data information: All values are presented as mean ± SD. One-way ANOVA with a Tukey's post hoc test. Numbers above columns indicate P-values of the one-way ANOVA test (n = 5 for each group).
Table 1.
Administration of cyclohexamide (CH) inhibits NMD in MEFs from Coq9Q95X and Coq9R239X mice
| Coq9 mRNA (CH-treated/untreated) | |
|---|---|
| Coq9+/+ | 1.54 ± 0.12 |
| Coq9Q95X | 5.47 ± 1.14* |
| Coq9R239X | 21.44 ± 6.8**,## |
The results are represented as fold increase of Coq9 mRNA levels after cyclohexamide administration. Data are expressed as the mean ± SD of five experiments in triplicates per group. One-way ANOVA with a Tukey post hoc test.
P < 0.05;
P < 0.01; Coq9Q95X and Coq9R239X mice versus Coq9+/+ mice.
P < 0.01; Coq9Q95X versus Coq9R239X mice. One-way ANOVA for comparison between the three experimental groups: P = 0.0022.
Secondly, we measured the levels of the CoQ biosynthetic proteins encoded by these genes. In Coq9Q95X mice, steady-state levels of COQ7 and COQ5 were significantly decreased in cerebrum (19 ± 9 and 41 ± 13%), kidney (9 ± 6 and 50 ± 9%) and muscle (16 ± 3 and 17 ± 6%) compared with Coq9+/+ mice. Coq9R239X mice showed extremely reduced levels of COQ5 and COQ7 in cerebrum (0.1 ± 0.1 and 35 ± 11%), kidney (0.1 ± 0.1 and 38 ± 14%), and muscle (undetectable, and 17 ± 6%) compared to Coq9+/+ mice (Supplementary Fig S4A and C; Fig5A, C, E and G).
Figure 5.
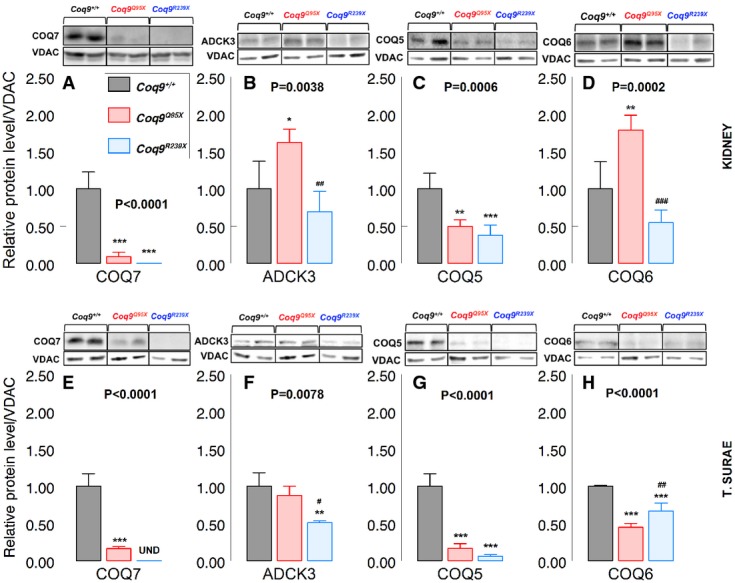
- A–D Representative Western blot and quantitation of Western blot bands of COQ7 (A), ADCK3 (B), COQ5 (C) and COQ6 (D), and VDAC1 as a loading control in the kidneys of 3-month-old mice. *P < 0.05; **P < 0.01; ***P < 0.001; Coq9Q95X and Coq9R239X mice versus Coq9+/+ mice. ##P < 0.01; ###P < 0.001; Coq9Q95X versus Coq9R239X mice. One-way ANOVA with a Tukey's post hoc test.
- E–H Representative Western blot and quantitation of Western blot bands of COQ7 (E), ADCK3 (F), COQ5 (G) and COQ6 (H), and VDAC1 as a loading control in skeletal muscle of 3-month-old mice. **P < 0.01; ***P < 0.001; Coq9Q95X and Coq9R239X mice versus Coq9+/+ mice. #P < 0.05; ##P < 0.01; Coq9Q95X versus Coq9R239X mice.
Data information: All values are presented as mean ± SD. One-way ANOVA with a Tukey's post hoc test. Numbers above columns indicate P-values of the one-way ANOVA test. Coq9+/+ mice n = 4; Coq9Q95X and Coq9R239X mice n = 5.
Source data are available online for this figure.
In cerebrum and muscle, ADCK3 levels were unchanged in Coq9Q95X mice and decreased in Coq9R239X mice compared to Coq9+/+ mice (55 ± 19 and 51 ± 3%) (Supplementary Fig S4; Fig5F). In kidney, ADCK3 and COQ6 levels were significantly increased in Coq9Q95X mice (162 ± 18 and 179 ± 20%) compared with Coq9+/+ mice and reduced in Coq9R239X mice compared with Coq9Q95X mice (43 ± 17% for ADCK3 and 31 ± 9% for COQ6) (Fig5B and D). Muscle of Coq9Q95X mice also showed a significant decrease of COQ6 compared to Coq9+/+ mice (45 ± 5%) (Fig5H).
Consistent with the results obtained in Coq9R239X mice, human skin fibroblasts carrying the R239X homologue mutation (COQ9R244X) showed a reduction in COQ9, COQ7, ADCK3 and COQ5 protein levels (Supplementary Fig S5A–D).
Moderate CoQ deficiency in Coq9Q95X mice leads to impaired mitochondrial bioenergetics function
To assess whether there was a direct correlation between the tissue CoQ deficiency and the bioenergetics defect, we next evaluated CoQ levels and mitochondrial respiratory chain function in isolated mitochondria from cerebrum, kidney and muscle of Coq9Q95X and control mice at 6 months of age. Mitochondrial CoQ levels were significantly decreased in cerebrum, kidney and muscle of Coq9Q95X compared with Coq9+/+ mice (Fig6A–C), and the level of CoQ deficiency correlated with the CoQ levels measured in tissue homogenates.
Figure 6.

- A–C Mitochondrial CoQ9 levels from cerebrum (A), kidney (B) and skeletal muscle (C) of Coq9+/+ and Coq9Q95X males and females. n = 8 for each group.
- D–F CI+CIII activity in cerebrum (D), kidney (E) and skeletal muscle (F) of male and female Coq9+/+ and Coq9Q95X mice. n = 6 for each group.
- G–I CII+CIII activity in cerebrum (G), kidney (H) and skeletal muscle (I) of male and female Coq9+/+ and Coq9Q95X mice. n = 6 for each group.
- J–L Blue-native gel electrophoresis (BNGE) followed by immunoblotting analysis of mitochondrial supercomplexes from Coq9+/+ (n = 3) and Coq9Q95X mice (n = 4) at 3 months of age.
Data information: (A–I) Data are expressed as mean ± SD. Statistical analyses were performed on Coq9+/+ male mice versus Coq9Q95X male mice and Coq9+/+ female mice versus Coq9Q95X female mice. **P < 0.01; ***P < 0.001. Student's t-test. Complex I+III, NADH-cytochrome c reductase; complex II+III, SDH-cytochrome c reductase.
Source data are available online for this figure.
CoQ-dependent mitochondrial CI+III activity was considerably reduced only in kidney and muscle of female Coq9Q95X mice, while there were no differences in mutant males when compared with the wild-type littermates (Fig6D–F). On the contrary, CoQ-dependent CII+III activities were comparable in mutant and control mice (Fig6G–I). These results correlate with the levels of CoQ because the decrease in CI+III and CII+III activities were more pronounced in Coq9R239X mice (Garcia-Corzo et al, 2013).
The analysis by blue native gel electrophoresis (BNGE) followed by immunoblotting with an anti-core I (complex III subunit) antibody showed that the overall amount of complex III substantially forming SC, as well as the free complex III, was similar in cerebral, kidney and muscle mitochondria of Coq9Q95X and Coq9+/+ mice (Fig6J–L). These results differ from those in Coq9R239X mice, where an increase of free complex III was detected in cerebrum and kidney (Garcia-Corzo et al, 2013).
The bioenergetics defect in kidney and muscle of Coq9Q95X mice was confirmed by measurement of mitochondrial O2 consumption using isolated mitochondria in the XFe24 Extracellular Flux Analyzer (Seahorse Bioscience). In kidney, the phosphorylating respiration (State 3o, in the presence of ADP and substrates) showed a significant decrease in Coq9Q95X females (82 ± 6%), and Coq9R239X males and females (56 ± 13 and 57 ± 1%, respectively) compared with wild-type controls (Fig7A and B and Supplementary Fig S7A). In muscle, State 3o was significantly decreased in Coq9Q95X (62 ± 7% in males and 73 ± 6% in females) and Coq9R239X mice (58 ± 10% in males and 44 ± 4% in females) (Fig7C and D and Supplementary Fig S7B). In both mutant models, the percentage of decrease in the ADP-stimulated respiration was higher in muscle than in kidney (Fig7A and C). Similar data were obtained in other respiratory states, for example, basal respiration (State 2), resting respiration (State 4, after the addition of oligomycin) and maximal uncoupler-stimulated respiration (State 3u, after the addition of FCCP) (Supplementary Figs S6A–F and S7A and B and Fig7B and D).
Figure 7.
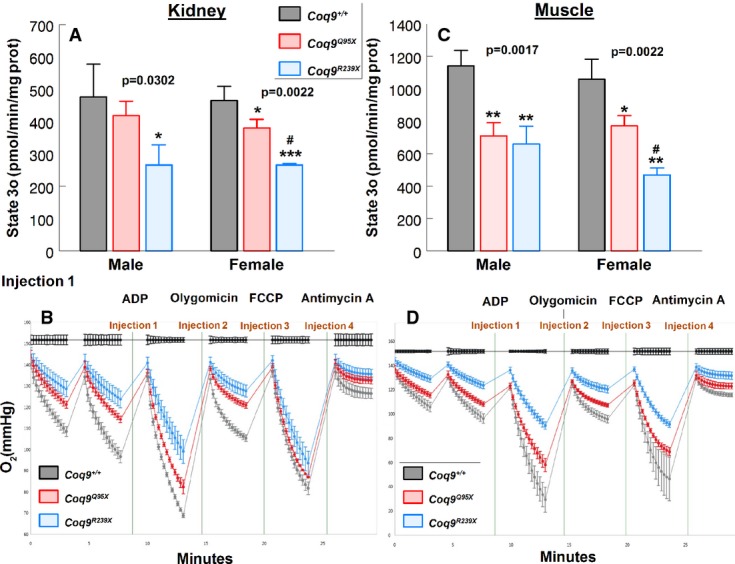
- A–D Measurement of phosphorylating respiration (represented as State 3o, in the presence of ADP and substrates) in kidney (A) and skeletal muscle (C) from male and female Coq9+/+, Coq9Q95X and Coq9R239X mice at 3 months of age. Representative O2 consumption graphic in kidney (B) and skeletal muscle (D) from female Coq9+/+, Coq9Q95X and Coq9R239X mice.
Data information: All values are presented as mean ± SD. (A, C) *P < 0.05; **P < 0.01; ***P < 0.001; Coq9Q95X and Coq9R239X mice versus Coq9+/+ mice. #P < 0.05; Coq9Q95X versus Coq9R239X mice. One-way ANOVA with a Tukey's post hoc test. Numbers above columns indicate P-values of the one-way ANOVA test (n = 3 for each group).
Morphological evaluation of Coq9Q95X mice
To assess whether the moderate CoQ deficiency and mitochondrial bioenergetics impairment lead to structural changes in Coq9Q95X mice tissues, we performed histopathological and histochemical analysis of different sections from cerebrum, kidney and muscle at different ages and compared them with the age- and sex-matched Coq9+/+ littermates.
Hematoxylin and eosin (H&E) and Luxol fast blue (LFB) stains of cerebrum did not show any structural abnormalities at 3 months of age (Supplementary Fig S8A–D). Likewise, the periodic acid-Schiff (PAS) stain did not reveal histologic alterations in kidney (Supplementary Fig S8E and F). Further evaluation of kidney at 12 and 18 months of age did not show any anatomopathological changes (Supplementary Fig S11A–H). These results, together with the normal biomarkers levels obtained from urine albumin and urea (Supplementary Table S1), suggest that Coq9Q95X mice did not manifest evidence of kidney diseases associated with CoQ deficiency.
In triceps surae muscle, we observed round-shaped muscle fibers with central nuclei in one Coq9Q95X female sample (out of six) (Supplementary Fig S8G–J). To check whether this was an isolated event or it was a sign of muscle pathology, we next performed a histochemical examination of triceps surae in controls and homozygous mutant mice at 3, 6, 12 and 18 months of age. In younger Coq9Q95X mice (3–12 months old), cytochrome c oxidase (COX) and succinate dehydrogenase (SDH) activity did not differ compared to Coq9+/+ littermates (Fig8A, B, E and F and Supplementary Fig S9A–H). Nevertheless, at 18 months, Coq9Q95X females showed a higher number of COX- and SDH-negative fibers (Fig8C, D, G and H), suggesting that there was a shift from type I fibers (slow-twitch) to type II fibers (fast-twitch). The Gomori trichrome stain did not show signs of mitochondrial proliferation and scattered ragged red fibers (RRF) (Fig8I–L and Supplementary Fig S9I–L). No changes in the overall architecture and general morphology were detected by H&E stain (Fig8M–P and Supplementary Fig S9M–P).
Figure 8.
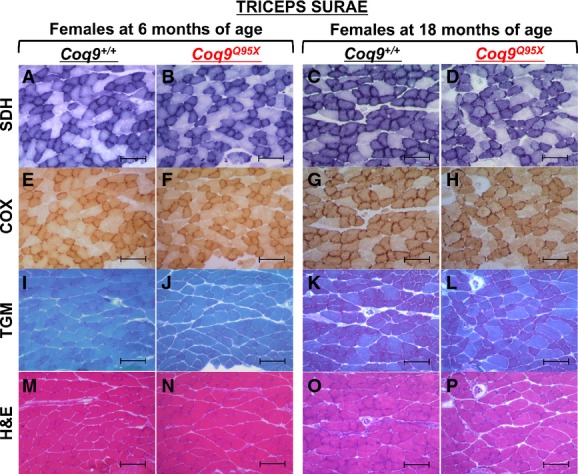
- A–H Complex II (SDH) and complex IV (COX) histochemistry of triceps surae showing a decreased stain in 18-month-old Coq9Q95X female mice (D, H) in contrast to normal SDH and COX activity in 6- and 18-month-old Coq9+/+ (A, C, E, G), as well as 6-month-old Coq9Q95X female mice (B, F).
- I–L Gomori trichrome stain (TGM) of triceps surae showed no differences between 6- and 18-month-old Coq9+/+ and Coq9Q95X female mice.
- M–P Hematoxylin and eosin (H&E) stains of triceps surae did not reveal any structural abnormality.
Data information: Scale bars: 100 μm. n = 3 for each group. Complex IV, cytochrome c oxidase (COX); complex II, succinate dehydrogenase (SDH).
Immunohistochemistry with primary anti-glial fibrillary acid protein (GFAP) antibody did not show significant changes in the distribution and number of astrocytes in diencephalon (Supplementary Fig S10A, B, E and F) and pons (Supplementary Fig S10I, J, M and N) of 12-month-old Coq9Q95X. At 18 months of age, there was an overall increase of astrocytes proliferation with no differences between mutants and control animals (Supplementary Fig S10C, D, G, H, K, L, O and P). Heart evaluation at 12 and 18 months of age did not show any anatomopathological changes (Supplementary Fig S11I–P).
Female Coq9Q95X mice develop a mild myopathic phenotype with exercise intolerance
Because the muscle was the most impaired tissue in Coq9Q95X homozygous mice, we assessed the locomotor activity and muscle strength at 6 months of age. Compared to sex-matched wild-type controls, Coq9Q95X females showed a significant reduction on the average speed during the use of the wheel and spontaneous wheel activity, while there were no differences between mutant and control male animals (Fig9A–C). The decrease in the distance travelled in the home-cage running wheels was corroborated by the observation of reduced spontaneous movement in the open-field test (Fig9E). Likewise, the reaches score obtained in the hanging wire test was lower just in homozygous mutant females (Fig9D). However, muscle strength of forelimbs was not affected (Fig9F). The life span of Coq9Q95X and Coq9+/+ mice was similar in both genders.
Figure 9.
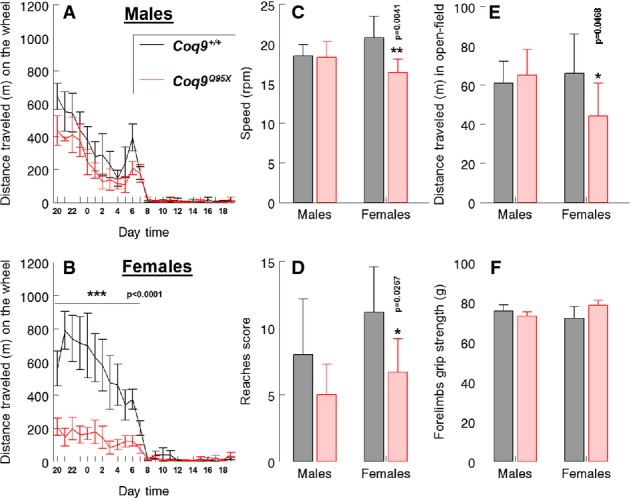
- A–C Voluntary wheel running test. Distance traveled on the wheel and average speed during the use of the wheel were decreased in female Coq9Q95X mice at 6 months of age (B, C).
- D Hanging wire test. Coq9Q95X female mice obtained less reaches score in the ‘fall and reaches’ method.
- E Open-field test. Coq9Q95X mice showed a reduction in the average distance traveled in Coq9Q95X female mice at 6 months of age.
- F Grip test: Muscle strength was not affected in Coq9Q95X mice at 6 months of age.
Data information: Data are expressed as mean ± SD. Statistical analysis was performed on Coq9+/+ male mice versus Coq9Q95X male mice and Coq9+/+ females versus Coq9Q95X females. *P < 0.05; **P < 0.01 and ***P < 0.001. Student's t-test. n = 8 for each group.
Effects of oral administration of 2,4-dihydroxybenzoic acid (2,4-diHB)
As a proof of concept, we also evaluated whether the stability of the CoQ multiprotein complex would affect a possible bypass therapy. For that purpose, we treated Coq9+/+, Coq9Q95X and Coq9R239X mice with oral 2,4-dihydroxybenzoic acid (2,4-diHB), which has been previously tested as a bypass therapy for Δcoq7 Saccharomyces cerevisiae strains (Xie et al, 2012; Doimo et al, 2014). After 1 month of treatment, Coq9Q95X and Coq9+/+ mice showed a reduction of kidney CoQ9 levels compared with the non-treated littermate (Fig10A and B and Supplementary Fig S12A–D). On the contrary, Coq9R239X mice treated with 2,4-diHB exhibited significantly higher levels of CoQ9 (184 ± 9.3%) compared with untreated Coq9R239X mice (Fig10A and B and Supplementary Fig S12E and F). Interestingly, this increase in CoQ9 levels in Coq9R239X mice was also observed in the skin fibroblasts from the patient with the homolog COQ9R244X molecular defect treated with 2,4-diHB (175.8 ± 5.6%), while on control fibroblasts, CoQ10 biosynthesis was inhibited by 2,4-diHB supplementation (Fig10C and D and Supplementary Fig S12G and H).
Figure 10.
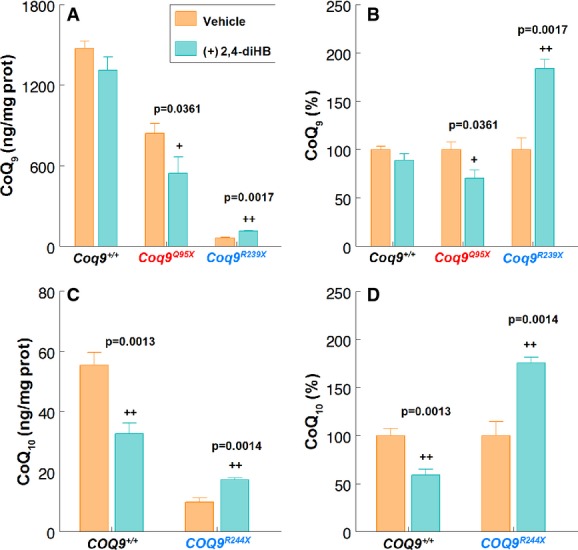
- A, B Kidney CoQ9 levels in Coq9+/+, Coq9Q95X and Coq9R239X mice treated with 2,4-diHB (+2,4-diHB) compared with the non-treated littermate (vehicle). Statistical analysis was performed on +2,4-diHB Coq9+/+, Coq9Q95X and Coq9R239X mice versus vehicle Coq9+/+, Coq9Q95X and Coq9R239X mice, respectively (n = 3 for each group).
- C, D CoQ10 levels in COQ9R244X skin fibroblasts treated with 2,4-DiHB (+2,4-diHB) compared with the non-treated controls (vehicle). Statistical analysis was performed on +2,4-diHB COQ9R244X versus vehicle COQ9R244X (n = 4 for each group).
Data information: Data are expressed as mean ± SD. Student' t-test. +P < 0.05; ++P < 0.01.
The HPLC chromatographs used to quantify the CoQ levels showed an abnormal peak in Coq9+/+, Coq9Q95X and Coq9R239X mice treated with 2,4-diHB. The retention time of this additional peak was 7.5 min. The mass spectral identification of this lipid exhibited a molecular ion peak of 767.634 [M + H]+ and 789.616 [M + Na]+ (Fig10I) and could thus be identified as the reduced demethoxyubiquinone 9 (DMQ9H2) (theoretical mass [C53H82O3] = 767.63422 [M + H]+ and 789.61616 [M + Na]+).
Discussion
Primary CoQ10 deficiency is an autosomal recessive condition with extremely variable age of onset and clinical manifestations. The reason for the marked diversity in the clinical phenotypes associated with mutations in individual genes remains still unclear (Desbats et al, 2014). In this study, we demonstrate that two different premature terminations in the COQ9 protein distinctively affect the levels of other COQ proteins, suggesting that the truncated version of the COQ9 protein produced in the Coq9R239X mouse model induces a dominant-negative effect on the multiprotein complex for CoQ biosynthesis. As a consequence, the Coq9R239X mouse model has a global reduction in the COQ proteins, which causes severe CoQ deficiency and clinical phenotype. In contrast, in the new Coq9Q95X mouse model reported here, the lack of COQ9 protein results in decreased levels of only COQ7 and COQ5 proteins, which leads to moderate CoQ deficiency and a mild mitochondrial myopathy, especially evident in females. Therefore, the stability of this multiprotein complex is a key factor in the CoQ biosynthesis rate and, consequently, in the degree of the severity of CoQ deficiency and in the development of a particular clinical phenotype.
Genetic diseases caused by nonsense or frameshift mutations can generate premature termination codons, which usually trigger nonsense-mediated mRNA decay (NMD). This process is considered to be a surveillance pathway reducing the amount of non-functional mRNA that would produce truncated proteins with dominant-negative or deleterious gain-of-function activities (Brogna & Wen, 2009). Because premature terminations of COQ9 are induced in both mouse models, Coq9Q95X and Coq9R239X, it was expected a degradation of Coq9 mRNA by NMD. Accordingly, Coq9 mRNA was undetectable in cerebrum, kidney and muscle of Coq9Q95X mice. On the contrary, Coq9 mRNA was detectable in cerebrum and kidney of Coq9R239X mice, being the levels around 15% of the control values. As in other genetic diseases (Holbrook et al, 2004; Rio Frio et al, 2008), the low levels of Coq9 mRNA are due to NMD because the incubation of Coq9Q95X and Coq9R239X MEFs with the NMD inhibitor cyclohexamide increased the Coq9 mRNA levels. Therefore, the differences in Coq9 mRNA levels between the two mouse models may account for differences in the efficiency of the NMD to degrade the Coq9 mRNA containing two nonsense mutations that cause different premature terminations (Inoue et al, 2004; Gong et al, 2014). A different pattern was, however, observed in muscle, where Coq9 mRNA levels were almost undetectable in both Coq9Q95X and Coq9R239X mice, suggesting that there is tissue specificity in the efficiency of NMD. The existence of this tissue specificity of RNA surveillance has been previously reported in other diseases, for example, osteogenesis imperfecta type I due to premature termination codon mutations COL1A1 gene (Bateman et al, 2003; Zetoune et al, 2008). These differences in the efficiency of NMD between tissues are due to variable expression of the NMD factors (Zetoune et al, 2008) and contribute to how disease manifests in different tissues (Khajavi et al, 2006).
In Coq9R239X mice, the residual Coq9 mRNA observed in cerebrum and kidney from incomplete nonsense-mediated decay is translated into an aberrant COQ9 protein without the C-terminal 75 amino acid residues of the mature COQ9 protein. This truncated COQ9 protein may produce a dominant-negative or gain-of-function effect, as it has been reported in other mitochondrial diseases (Tyynismaa et al, 2009; Torres-Torronteras et al, 2011). The deleterious gain-of-function effect of the truncated COQ9 protein in Coq9R239X mice affects the stability of the CoQ multiprotein complex since the overall levels of COQ proteins were lower in Coq9R239X mice than those measured in Coq9Q95X mice. Accordingly, we propose that the truncation of the COQ9 protein in the Coq9R239X mouse model would have two consequences: (i) severe and moderate reduction of COQ7 and COQ5 levels, respectively, and (ii) destabilization of the multiprotein complex, decreasing therefore the levels of the other COQ proteins. Similar results in the levels of COQ proteins were obtained by LC-MS/MS in Coq9R239X mice (Lohman et al, 2014), as well as in the skin fibroblasts belonging to the patient with the homologues COQ9 mutation (COQ9R244X) (Duncan et al, 2009). On the contrary, in the Coq9Q95X mouse model, the absence of the COQ9 protein only affects the levels of COQ7 and COQ5 protein and not the integrity of the multi-subunit complex. While the reason behind the decrease in COQ5 levels is unclear, the decrease in COQ7 levels is justified by the direct physical interaction of COQ9–COQ7, which is needed by COQ9 to expose demethoxyubiquinone, the substrate for the reaction catalyzed by COQ7 (Garcia-Corzo et al, 2013; Lohman et al, 2014). The different responses of both mutant mice to the treatment with 2,4-diHB also suggest that Coq9Q95X mice have a stable CoQ mutiprotein complex that is able to regulate CoQ biosynthesis and provide mechanisms of competitive and/or substrate inhibition (Tran & Clarke, 2007; Quinzii et al, 2012), in contrast to Coq9R239X mice. The differences found in the levels of COQ proteins between Coq9R239X and Coq9Q95X mice are also supported by the yeasts studies, where phenotypes of certain COQ point mutants dramatically differ from the respective null mutants (Belogrudov et al, 2001; Baba et al, 2004; Tran et al, 2006). Moreover, we observed two tissue-specific differences in the COQ protein levels: (i) ADCK3 and COQ6 protein levels were increased only in kidney of Coq9Q95X mice, and (ii) COQ6 protein level was decreased in skeletal muscle but not in kidney of Coq9Q95X mice. These divergences could reflect a tissue-specific regulatory feature of CoQ biosynthesis and CoQ multiprotein complex formation.
The imbalance of the CoQ biosynthetic multiprotein complex would explain the severe reduction of CoQ levels in Coq9R239X mice compared to the moderate CoQ deficiency found in Coq9Q95X mice. The bioenergetics repercussion of having an intermediate CoQ deficiency was a reduction of CoQ-dependent respiratory complex I+III activity and mitochondrial respiration in kidney and muscle from Coq9Q95X females. This decrease was not due to the impairment on the distribution between free complex III and supercomplex-associated complex III and may be attributed to the low residual CoQ levels in these tissues (30% of normal). This proportion of the complex I+III activity independent of the supercomplex I-III is supported by our recent study on the effects of ubiquinol-10 supplementation in Coq9R239X mice, which showed that ubiquinol-10 treatment increases complex I+III activity without increasing the amount of complex III associated to the supercomplex (Garcia-Corzo et al, 2014).
Although muscle and kidney of Coq9Q95X mice had the lowest CoQ content and the most bioenergetics defect, the function and the histologic structure of the kidneys were not affected. This is consistent with the previous study on Coq9R239X mice, which do not manifest kidney disease either (Garcia-Corzo et al, 2013). However, it remains unclear why Pdss2kd/kd mice develop nephrotic syndrome and Coq9 mutant mice do not (Peng et al, 2008; Quinzii et al, 2013). On the contrary, histochemical evaluation of muscle revealed an increased number of COX- and SDH-negative fibers in Coq9Q95X females at 18 months of age, suggestive of a late-onset mild myopathy. This reduction in the muscle mitochondrial energetic activity suggests a skeletal muscle fiber-type transformation from slow fibers (type I) to fast fibers (type II). The changes in fiber-type composition were first reported in an experimental model of respiratory chain myopathy as a compensatory mechanism for the enzymatic deficiency to maintenance muscle strength via increased recruitment of glycolysis for ATP production, at the expense of increased energetic cost (Venhoff et al, 2012). Similar to our results, Sommerville et al (2013) found an increased frequency of type IIC fibers in morphologically normal muscle biopsies from 18 patients with CoQ10 deficiency. Moreover, muscles with a slow/oxidative phenotypic profile contain higher levels of CoQ than muscles with a fast/glycolytic phenotypic profile (Nierobisz et al, 2010), suggesting that type I fibers are more susceptible to CoQ deficiency.
Results from the locomotor activity tests also showed a gender difference that is correlated to the bioenergetics and histological findings, that is, Coq9Q95X females, and not males, had reduced exercise tolerance. Increased susceptibility of female mice to mitochondrial myopathy was also observed in a muscle-specific knockout mouse model of COX10 (Diaz et al, 2005) and may account to the effect of testosterone in muscle mass (Schulte-Hostedde et al, 2003). This is consistent with the decreased voluntary activity of androgen receptor knockout male mice (Rana et al, 2011). Additionally, it has been reported that the lower levels of CoQ in females could predispose them to a major susceptibility to myopathy associated to statin consumption (Bhardwaj et al, 2013). Our results show lower CoQ levels in muscle tissues of females compared to male mice, supporting the concept of a greater sensitivity of female to CoQ deficiency.
In conclusion, our study provides the first evidence of the existence of a multiprotein complex for CoQ biosynthesis in mammals and its importance in determining the degree of CoQ deficiency and the clinical phenotype. Our study suggests that the presence of a COQ9-truncated protein because of an incomplete NMD induces instability of the CoQ mutiprotein complex and contributes in this way to the genetic and tissue-specific pathomechanisms. Furthermore, our work describes the first mouse model of mitochondrial myopathy with exercise intolerance associated to CoQ deficiency, providing new insights to understand the genotype–phenotype disparity associated to CoQ deficiency. Finally, our results may have a potential impact on the treatment of this mitochondrial disorder in two ways: (i) The efficacy of the bypass therapy recently proposed for primary CoQ deficiency caused by molecular defects in proteins of the biosynthetic multicomplex may differ according to the stability of the CoQ multiprotein complex (Xie et al, 2012; Doimo et al, 2014), and (ii) increasing CoQ levels above 50% of its normal levels may be enough to avoid a severe clinical phenotype.
Materials and Methods
Generation of the genetically modified mouse models
The Coq9Q95X mouse model used in this study was generated by the Wellcome Trust Sanger Institute from ES cell clone EPD0112_2_A09 obtained from the supported KOMP Repository (http://www.komp.org). The ‘knockout first’ cassette was inserted into the C57BL/6N genetic background (project #CSD38115) (Supplementary Fig S13A). Male heterozygous Coq9Q95X/+ mice (C57BL/6N genetic background) were crossbred with female Coq9+/+ mice under C57BL/6J genetic background. Heterozygous Coq9Q95X/+ mice of the offspring were, consequently, a mix of C57BL/6N and C57BL/6J genetic background (Supplementary Fig S13B). Thus, Coq9Q95X/+ mice were crossbred in order to generate Coq9+/+, Coq9Q95X/+ and Coq9Q95X/Q95X (referred in the article as Coq9Q95X).
The Coq9R239X mouse model was previously generated and characterized under mix of C57BL/6N and C57BL/6J genetic background (Supplementary Fig S13B) (Garcia-Corzo et al, 2013).
Only homozygous wild-type and mutant mice from both models were used in the study.
Mice were housed in the Animal Facility of the University of Granada under an SPF zone with lights on at 7:00 AM and off at 7:00 PM. Mice had unlimited access to water and rodent chow. All experiments were performed according to a protocol approved by the Institutional Animal Care and Use Committee of the University of Granada (procedures CEEA 2009-254 and 2010-275) and were in accordance with the European Convention for the Protection of Vertebrate Animals used for Experimental and Other Scientific Purposes (CETS #123) and the Spanish law (R.D. 53/2013). Animals were randomly assigned in experimental groups. Data were randomly collected and processed as well.
Cells culture and pharmacological treatment
Mouse embryonic fibroblasts (MEFs) from Coq9+/+, Coq9Q95X and Coq9R239X mice, as well as primary mutant and control fibroblasts, were grown in high glucose DMEM-GlutaMAX medium supplemented with 10% FBS, 1% MEM non-essential amino acids and 1% antibiotics/antimycotic. MEFs were treated for 6 h with 28 μg/ml of cycloheximide (Sigma; from a 5 mg/ml stock solution prepared in water) (Rio Frio et al, 2008). After treatment, cells were collected and analyzed.
PCR analyses of regions corresponding to exons 7–11 of Nnt
DNA was extracted from the mice tail tips, and PCR of Nnt gene was performed as previously described (Mekada et al, 2009). Nnt gene is complete in the sub-strain C57/BL6N while presents a deletion in exons 7–11 in the sub-strains C57/BL6J. Therefore, exon 6 was used to identify the sub-strains C57/BL6J and C57/BL6N, and exon 7 was used to identify the sub-strain C57/BL6N. To amplify exon 6, we used the following primers: forward, GGGTTTTCGATTGCTGTCATT; reverse, AGTCAGCAGCACTCCTCCAT. To amplify exon 7, we used the following primers: forward, ATTTAGCTGCTGAGGCTGGA; reverse, GACAAAGACCCGAGAAGCAC.
Proteomic analysis of kidney mitochondria by high-resolution LC-MS/MS
Mitochondrial isolation was performed as describe elsewhere (Fernandez-Vizarra et al, 2002). Mitochondrial pellets were solubilized in 200 μl 2% SDS, 100 mM DTT, and 100 mM Tris–HCl, pH 7.4. Proteins were quantified by Bradford, and 50 μg of each extract was digested by filter-aided sample preparation (FASP) method. The tryptic extracts from the wild-type samples (Coq9+/+) were analyzed by high-resolution LC-MS/MS in data-dependent mode with an inclusion list. All the COQ9 peptides obtained from the tryptic digestion, in the range from 500 to 4,000, were included in the list (allowing one missed cleavage). One microgram of peptide extract was diluted with 20 μl of 5% MeOH: 1% HCOOH in order to be injected and analyzed by LC-MS/MS. LC-MS/MS spectra were searched using SEQUEST (Proteome Discoverer v1.4; ThermoFisher) and the following parameters: peptide mass tolerance 10 ppm, fragment tolerance 0.02 Da, enzyme set as trypsin and allowance up to three missed cleavages, dynamic modification of methionine oxidation (+ 16 Da) and fixed modification of cysteine carbamidomethylation (+ 57 Da). The database used for searching was Mus musculus. Peptide identifications were filtered at 1% FDR using the Percolator algorithm included in the Proteome Discoverer software.
The MS system used was an LTQ XL Orbitrap (ThermoFisher) equipped with a nanoESI ion source. A volume of 20 μl from each sample was loaded into the chromatographic system consisting of a C18 preconcentration cartridge (Agilent Technologies) connected to a 15-cm-long, 100 μm i.d. C18 column (Nikkyo Technos Co.). The separation was done at 0.4 μl/min in a 90-min acetonitrile gradient from 3 to 40% (solvent A: 0.1% formic acid, solvent B: acetonitrile 0.1% formic acid). The HPLC system was composed of an Agilent 1200 capillary nano pump, a binary pump, a thermostated micro injector and a micro switch valve. The LTQ XL Orbitrap was operated in the positive ion mode with a spray voltage of 1.8 kV. The spectrometric analysis was performed in a data-dependent mode, acquiring a full scan followed by eight MS/MS scans of the eight most intense signals detected in the MS scan from the global list. The full MS (range 400–1,700) was acquired in the Orbitrap with a resolution of 60,000. The MS/MS spectra were done in the linear–ion trap. From the data-dependent analysis, six COQ9 peptides of the protein were characterized. After the characterization, a targeted method for the analysis of the six detected peptides was designed. Wild-type samples were used to validate the targeted method.
Quantification of CoQ9 and CoQ10 levels in mice tissues and mitochondrial fraction
After lipid extraction from homogenized tissues or cultured skin fibroblasts, CoQ9 and CoQ10 levels were determined via reversed-phase HPLC coupled to electrochemical (EC) detection (Lopez et al, 2010; Garcia-Corzo et al, 2013). The results were expressed in ng CoQ/mg prot.
Gene expression analyses
Total cellular RNA from frozen tissue was extracted and electrophoresed in agarose 1.5% to check RNA integrity. RNA from muscle and cerebrum samples was extracted with RNeasy Fibrous Tissue Midi kit (for muscle) and RNeasy Lipid Tissue Mini kit (for cerebrum) (Qiagen, Hilden, Germany) and treated with RNase-Free DNase (Qiagen). RNA from kidney samples was extracted with Real Total RNA Spin Plus Kit (Real). Total RNA was quantified by optical density at 260/280 nm and was used to generate cDNA with High Capacity cDNA Reverse Transcription Kit (Applied Biosystems). Amplification was performed with quantitative real-time PCR, by standard curve method, with specific Taqman probes (from Applied Biosystems) for the targeted gene mouse Coq9 (Mm00804236_m1), Coq7 (Mm00501588_m1), Coq6 (Mm00553570_m1), Coq5 (Mm005018239_m1), Adck3 (mM00469737_m1) and the mouse Hprt probe as a standard loading control (Mm01545399_m1).
Sample preparation and Western blot analysis in mice tissues
Western blot analyses were performed in cerebrum, kidney and muscle homogenates. Samples were homogenized in buffer A (50 mM Tris–HCl, 1% Triton X-100, 1 mM dithiothreitol, pH 7.6, protease inhibitor cocktail) at 1,100 rpm in a glass–teflon homogenizer. Homogenates were sonicated and centrifuged at 1,000 g for 5 min at 4°C, and the resultant supernatant was used for Western blot analysis. 60 μg of proteins from the sample extracts was electrophoresed in 12% Mini-PROTEAN TGX™ precast gels (Bio-Rad) using the electrophoresis system mini-PROTEAN Tetra Cell (Bio-Rad). To detect the truncated version of the COQ9 protein in Coq9R239X mice, 70 μg of proteins from mitochondrial samples extracts was prepared in XT sample buffer + XT-reducing agent (Bio-Rad) and electrophoresed in a 10% Criterion™ XT precast gel (Bio-Rad) using MOPS running buffer and the electrophoresis system Criterion Cell (Bio-Rad). In all experiments, proteins were transferred onto PVDF 0.45-μm membranes using a mini Trans-blot Cell (Bio-rad) or Trans-blot Cell (Bio-Rad) and probed with target antibodies. Protein–antibody interactions were detected with peroxidase-conjugated horse anti-mouse, anti-rabbit or anti-goat IgG antibodies using Amersham ECL™ Prime Western Blotting Detection Reagent (GE Healthcare, Buckinghamshire, UK). Band quantification was carried out using an Image Station 2000R (Kodak, Spain) and a Kodak 1D 3.6 software. COQ protein band intensity was normalized to Vdac1, and the data expressed in terms of percent relative to wild-type mice (Garcia-Corzo et al, 2013).
The following primary antibodies were used: anti-COQ7 (generously provided by Dr Hekimi, McGill University, Canada), anti-COQ6 (Santa Cruz Biotechnology, sc-393932), anti-COQ5 (Proteintech™, 17453-1-AP), anti-ADCK3 (Abnova, M04A) anti-COQ9 (Santa Cruz, sc-271892), anti-COQ9 (Abcam, ab104189) and anti-VDAC1 (Abcam, ab14734).
Sample preparation and Western blot analysis in human skin fibroblasts
About 1 × 10⁵ cells were collected, washed twice with 1× PBS, homogenated in 1× PBS and sonicated on ice for 10 s. 30 μg of protein was mixed with 4× LDS sample buffer and 25% DDT. After denaturation at 55°C for 5 min, samples were loaded in 12% SDS–PAGE gel. Proteins were transferred on PDVF membranes and incubated overnight at 4°C with primary antibodies: 1:100 COQ7 rabbit polyclonal antibody (Thermo Scientific; PA5-25774), 1:100 COQ6 rabbit polyclonal antibody (Abcam; ab128652), 1:100 COQ9 rabbit polyclonal antibody (Thermo Scientific; PA5-24816), 1:100 COQ5 rabbit polyclonal antibody (Thermo Scientific; PA5-26327), 1:100 COQ8/ADCK3 mouse monoclonal antibody (Abnova; H00056997-M04A) and 1:1,000 vinculin monoclonal mouse antibody (Abcam SPM227), used as a loading control. Protein–antibody interaction was detected by peroxidase-conjugated mouse antibody, peroxidase-conjugated rabbit antibody or peroxidase-conjugated goat antibody using ECL Prime Western Blotting Detection Reagents (GE Healthcare). Band intensity was assessed by Image J.
CoQ-dependent respiratory chain activities
CoQ-dependent respiratory chain activities (CI + III and CII + III) were measured in submitochondrial particles as described elsewhere (Kirby et al, 2007; Garcia-Corzo et al, 2013). The results were expressed in nmol reduced cyt c/min/mg prot.
Evaluation of supercomplex formation by BNGE
BNGE was performed on the mitochondrial fraction from mice tissues. Mitochondrial isolation was performed as previously described (Fernandez-Vizarra et al, 2002; Garcia-Corzo et al, 2013). Mitochondrial membrane proteins (100 μg) were applied and run on a 3–13% first-dimension gradient BNGE gel as previously described (Schagger, 2001; Acin-Perez et al, 2008; Garcia-Corzo et al, 2013). After electrophoresis, the complexes were electroblotted onto PVDF filters and sequentially probed with specific antibodies against complex III, anti-ubiquinol-Cytochrome c Reductase Core Protein I (Abcam, ab110252).
Mitochondrial respiration
To isolate fresh mitochondria, mice were sacrificed and the organs were extracted rapidly on ice. Muscle (triceps surae and vastus lateralis) was submerged in 1 mg/ml proteinase K solution for 60 s. Then, muscle was homogenized (1: 10, w/v) in isolation buffer (250 mM sucrose, 2 mM EDTA, 10 mM Tris, 0,5% free fatty acids albumin, pH 7.4) at 800 rpm at 4°C with a glass–teflon homogenizer. The homogenate was centrifuged twice at 1,000 g for 5 min at 4°C, and the supernatant was centrifuged at 23,000 g for 10 min at 4°C. Then, the mitochondrial pellet was resuspended in 100 μl of isolation buffer, and a 10 μl aliquot was used for protein determination. The remaining sample was washed with 900 μl of isolation buffer and centrifuged at 13,000 g for 3 min at 4°C. The final crude mitochondrial pellet was resuspended in 90 μl MAS 1× medium [70 mM sucrose, 220 mM mannitol, 10 mM KH2PO4, 5 mM MgCl2, 2 mM HEPES, 1 mM EGTA and 0.2% (w/v) fatty acid-free BSA, pH 7.2]. Kidney was homogenated (1:10, w/v) in a respiration buffer A (250 mM sucrose, 0.5 mM Na2EDTA, 10 mM Tris and 1% free fatty acid albumin) at 800 rpm in a glass–teflon homogenizer. Then, homogenate was centrifuged at 500 g for 7 min at 4°C, and the supernatant was centrifuged at 7,800 g for 10 min at 4°C. The pellet was then resuspended in respiration buffer B (250 mM sucrose, 0.5 mM Na2EDTA and 10 mM Tris), and a 5 μl aliquot was used for protein determination. The remaining sample was then centrifuged at 6,000 g for 10 min at 4°C. The pellet was resuspended in buffer A and centrifuged again at 6,000 g for 10 min at 4°C. The final crude mitochondrial pellet was re-suspended in 95 μl MAS 1× medium.
Mitochondrial respiration was measured by using an XFe24 Extracellular Flux Analyzer (Seahorse Bioscience) (Rogers et al, 2011). Mitochondria were first diluted to the needed concentration required for plating in cold 1× MAS (2.5 μg/well in kidney; 1.5 μg/well in muscle). Next, 50 μl of mitochondrial suspension was delivered to each well (except for background correction wells) while the plate was on ice. The plate was then centrifuged at 2,000 g for 10 min at 4°C. After centrifugation, 450 μl of 1× MAS + substrate (10 mM succinate, 2 mM malate, 2 mM glutamate and 10 mM pyruvate) was added to each well. Respiration by the mitochondria was sequentially measured in a coupled state with substrate present (basal respiration or State 2), followed by State 3o (phosphorylating respiration, in the presence of ADP and substrates); State 4 (non-phosphorylating or resting respiration) was measured after the addition of oligomycin when all ADP was consumed, and then maximal uncoupler-stimulated respiration (State 3u). Injections were as follows: port A, 50 μl of 40 mM ADP (4 mM final); port B, 55 μl of 30 μg/ml oligomycin (3 μg/ml final); port C, 60 μl of 40 μM FCCP (4 μM final); and port D, 65 μl of 40 μM antimycin A (4 μM final). All data were expressed in pmol/min/μg protein.
Histology and immunohistochemistry
Cerebrum, heart and kidney were formalin-fixed and paraffin-embedded. Multiple sections (4 μm) were deparaffinized with xylene and stained with hematoxylin and eosin (H&E), Masson's trichrome (TCM), periodic acid–Schiff (PAS) and Luxol fast blue (LFB) (Garcia-Corzo et al, 2013). Immunohistochemistry was carried out in the same sections, using the following primary antibodies: glial fibrillary acidic protein or anti-GFAP (Millipore, MAB360), anti-oligodendrocytes (Millipore, MAB1580) and neuronal class III β-tubulin anti-TUJ1 (Covance, MMS-435P) (Garcia-Corzo et al, 2013). Dako Animal Research Kit for mouse primary antibodies (Dako Diagnóstico S.A., Spain) was used for the qualitative identification of antigens by light microscopy. Sections were examined at 40–400× magnifications with an OLYMPUS CX41 microscope, and the images were scanned under equal light conditions with the CELL A computer program.
Muscle samples (triceps surae) were snap-frozen in isopentane cooled in liquid nitrogen. Cross sections (8 μm thick) of frozen muscle were stained for succinate dehydrogenase (SDH) and cytochrome oxidase (COX) activities (Tanji & Bonilla, 2008). Muscle sections were also stained with hematoxylin–eosin and Gomori Trichrome to assess muscle fiber area and general morphology (Tanji & Bonilla, 2008).
Determination of the metabolite profile in urine
Urine samples were collected for 24 h and analyzed in a BS-200 Clinical Chemistry Analyzer (Mindray Medical España S.L., Spain) at 37°C. The following colorimetric tests were performed: urea and albumin (Linear Chemicals S.L., Spain) (Garcia-Corzo et al, 2013).
Assessment of the locomotor activity
Locomotor activity was tested in age-matched mice (6 months old) with a similar averaged body weight. Voluntary wheel running was assessed in polycarbonate cages (20.5 cm wide × 36.5 cm long × 14 cm high) with free access to stainless steel activity wheels (diameter 23 cm; width 5 cm) with a ball-bearing axle (Bioseb, Boulogne, France). The wheels were connected to a computer that automatically recorded the distance traveled by the mice per hour of recording, as well as the duration and speed of every running bout during the whole recording period. Spontaneous wheel running was monitored continuously during 48 h, starting at the beginning of the dark period (20:00 h), and the results obtained in the 2 days of evaluation were averaged. Animals had food and water available ad libitum and were trained to the wheels for 1 day before the data collection period (Cobos et al, 2012).
The open-field test consisted of a square arena in a ground space of 25 × 25 × 25 cm. Walls were opaque, so the animals could not see the room. Each mouse was placed in the center of the square arena between 8 and 9 PM under red light exposure and its movement monitored through the video-tracking system SMART® (Panlab S.L., Spain) for 30 min after an adaption period of 30 min (Pallud et al, 2011). Distance travelled (cm) of each mouse was quantified (Garcia-Corzo et al, 2013).
Muscle strength was assessed using a computerized grip strength meter (Model 47200, Ugo-Basile, Varese, Italy). The experimenter held the mouse gently by the base of the tail, allowing the animal to grab the metal bar with the forelimbs before being gently pulled until it released its grip. The peak force of each measurement was automatically recorded by the device and expressed in grams (g). The forelimb grip strength of each mouse was measured in duplicate with at least 1 min between measurements.
For the hanging wire test, we chose the ‘falls and reaches’ method (Raymackers et al, 2003). Mice were subjected to a 180 s lasting hanging test, during which a ‘reaching’ score is recorded. At the beginning of the test, each animal was given a reaching score of 0. Animals were suspended by their forelimbs to a 1.5-mm-thick, 55-cm-long metallic wire suspended 45 cm above soft ground, and then, the timer was started.
The timer was stopped anytime the animal fell and restarted when it was placed again on the wire until 180 s. If the animal reached one end of the wire, timer was stopped and ‘reaching’ score was increased by 1. Results were expressed as the ‘average of reaches score’.
Supplementation with 2,4-diHB
The supplementation procedure in mice consisted of administering 2,4-diHB in the drinking water in a dose of 1 g/kg bw/day. The treatment started at 1 month of age, and the mice were sacrificed at 2 months of age. The drinking water was changed twice a week. The supplementation procedure in primary fibroblasts consisted of administering 0.5 mM or 2.5 mM 2,4-diHB. A control group with vehicle (DMSO) at the same dose was also studied. Cells were collected 1 week after the supplementation.
Ultra carrying out liquid chromatography–mass spectrometer (MS/MS) analysis of intermediate metabolites
Lipid extracts were obtained as described above for the CoQ quantification. Samples were analyzed using an Acquity Ultra-Performance liquid chromatography system coupled to a high definition QTOF SynaptG2 detector of mass spectrometry (MS/MS) (Waters Corporation). The analytical separation column was a BEH C18, 1.7 μm, 2.1 × 50 mm column (Waters, Spain). The mobile phase consisted of methanol and 0.1% formic acid at the constant flow rate of 0.5 ml/min. Source and probe temperatures were set at 100 and 500°C, respectively. Nitrogen was used as both cone gas (30 l/h) and desolvation gas (600 l/h). Acquisition range was between 50 and 1,200 uma.
Statistical analysis
All statistical analyses were performed using the GraphPad scientific software. Data are expressed as the mean ± SD of 3–10 experiments per group. A one-way ANOVA with a Tukey's post hoc test was used to compare the differences between three experimental groups. Studies with two experimental groups were evaluated using unpaired Student's t-test. A P-value of 0.05 was considered to be statistically significant.
Effect size was calculated using the application available in http://www.biomath.info/power/ttest.htm. Number of animals in each group were calculated in order to detect gross ~60% changes in the biomarkers measurements (based upon α = 0.05 and power of β = 0.8) using the application available in http://www.biomath.info/power/index.htm. The Gaussian distribution was checked using GraphPad Software: http://graphpad.com/quickcalcs/probability1.cfm.
The paper explained
Problem
The biosynthesis of coenzyme Q10 (CoQ10) occurs in mitochondria and involves at least 11 different proteins that are associated, at least in yeasts, in a multiprotein complex. Primary CoQ10 deficiency is due to mutations in genes involved in CoQ biosynthesis. The disease has been associated with six major phenotypes: (i) encephalomyopathy, (ii) severe infantile multisystemic disease, (iii) nephropathy, (iv) cerebellar ataxia, (v) isolated myopathy, and (vi) multiple system atrophy. Curiously, mutations in the same gene may cause different phenotypes; for example, mutations in COQ2 and COQ6 have been indistinctly attributed to nephropathy or multisystemic disease. To try to understand genotype–phenotype disparities, we compare two mouse models with a genetic modification in Coq9 gene, that is, Coq9Q95X and Coq9R239X.
Results
Contrary to Coq9R239X, which manifests severe widespread CoQ10 deficiency associated with fatal encephalomyopathy, Coq9Q95X mice exhibited mild CoQ deficiency manifesting with reduction in CI+III activity and mitochondrial respiration in skeletal muscle, leading to a late-onset mild mitochondrial myopathy with decreased locomotor activity. Moreover, 2,4-dihydroxybenzoic acid (2,4-diHB) supplementation increased the levels of CoQ9 only in Coq9R239X mice. We show that these differences were due to the levels of COQ biosynthetic proteins, suggesting that the presence of a truncated version of COQ9 protein in Coq9R239X mice destabilizes the CoQ multiprotein complex.
Impact
Our study provides the first evidence of the existence of a multiprotein complex for CoQ biosynthesis in mammals and its importance in determining the degree of CoQ deficiency and the clinical phenotype. Our study suggests that the presence of a COQ9-truncated protein because of an incomplete nonsense-mediated mRNA decay (NMD) induces instability of the CoQ mutiprotein complex and contributes in this way to the genetic and tissue-specific pathomechanisms. Furthermore, our work describes the first mouse model of mitochondrial myopathy with exercise intolerance associated to CoQ deficiency, providing new insights to understand the genotype–phenotype disparity associated to CoQ deficiency and may have a potential impact on the treatment of this mitochondrial disorder.
Acknowledgments
We are grateful to Ana Nieto, PhD (Universidad de Granada), and Manuel Pablo Olmos, PhD (AnaPath, Granada, Spain), for their support in the histopathological evaluation, as well as to Shamima Rahman, MD (University College of London), for providing the human skin fibroblasts with the mutation in the COQ9 gene. This work was supported by grants from the Marie Curie International Reintegration Grant Programme (COQMITMEL-266691 to LCL) within the Seventh European Community Framework Programme, from Ministerio de Economía y Competitividad, Spain (SAF2009-08315 and SAF2013-47761-R to LCL), from the Consejería de Economía, Innovación, Ciencia y Empleo, Junta de Andalucía (P10-CTS-6133 to LCL), and from the ‘CEIBioTic’ (20F12/1 to LCL). MLS is a predoctral fellow from the Consejería de Economía, Innovación, Ciencia y Empleo, Junta de Andalucía. LCL is supported by the ‘Ramón y Cajal’ National Programme, Ministerio de Economía y Competitividad, Spain (RYC-2011-07643). MAT is supported by a predoctoral grant from the University of Granada. EJC is supported by the Research Program of the University of Granada. CMQ is supported by NICHD Grants 5K23 HDO65871-05 and P01 HD080642-01, and by a MDA grant. The proteomic analysis was performed in the CSIC/UAB Proteomics Facility of IIBB-CSIC that belongs to ProteoRed, PRB2-ISCIII, supported by Grant PT13/0001.
Author contributions
ML-S designed the study, carried out experiments and data analysis, and drafted the manuscript; ED-C contributed to biochemical experiments; EB carried out the Western blot experiments in human skin fibroblasts; MAT, AM-G and EJC contributed to the phenotypic evaluation; GE, DA-C and CMQ supervised experiments and edited the manuscript; and LCL designed the study, directed and supervised experimental procedures, and edited the manuscript. The results shown in this article will constitute a section of the ML-S doctoral thesis at the University of Granada.
Conflict of interest
The authors declare that they have no conflict of interest.
For more information
Online Mendelian Inheritance in Man (OMIM)
COQ9: S. Cerevisiae, homolog of; COQ9
http://omim.org/entry/612837#0001
International mito-patients
http://www.mitopatients.org/index.html
The association of mitochondrial disease patients in Spain
http://www.aepmi.org/publicoIngles/index.php
The United Mitochondrial Disease Foundation
Supporting Information
Supplementary Figure S1
Supplementary Figure S2
Supplementary Figure S3
Supplementary Figure S4
Supplementary Figure S5
Supplementary Figure S6
Supplementary Figure S7
Supplementary Figure S8
Supplementary Figure S9
Supplementary Figure S10
Supplementary Figure S11
Supplementary Figure S12
Supplementary Figure S13
Supplementary Table S1 and Supplementary Figure Legends
Source Data for Supplementary Figure S4
Review Process File
Source Data for Figure 1B
Source Data for Figure 2E
Source Data for Figure 5
Source Data for Figure 6
References
- Acin-Perez R, Fernandez-Silva P, Peleato ML, Perez-Martos A, Enriquez JA. Respiratory active mitochondrial supercomplexes. Mol Cell. 2008;32:529–539. doi: 10.1016/j.molcel.2008.10.021. [DOI] [PubMed] [Google Scholar]
- Baba SW, Belogrudov GI, Lee JC, Lee PT, Strahan J, Shepherd JN, Clarke CF. Yeast Coq5 C-methyltransferase is required for stability of other polypeptides involved in coenzyme Q biosynthesis. J Biol Chem. 2004;279:10052–10059. doi: 10.1074/jbc.M313712200. [DOI] [PubMed] [Google Scholar]
- Bateman JF, Freddi S, Nattrass G, Savarirayan R. Tissue-specific RNA surveillance? Nonsense-mediated mRNA decay causes collagen X haploinsufficiency in Schmid metaphyseal chondrodysplasia cartilage. Hum Mol Genet. 2003;12:217–225. doi: 10.1093/hmg/ddg054. [DOI] [PubMed] [Google Scholar]
- Belogrudov GI, Lee PT, Jonassen T, Hsu AY, Gin P, Clarke CF. Yeast COQ4 encodes a mitochondrial protein required for coenzyme Q synthesis. Arch Biochem Biophys. 2001;392:48–58. doi: 10.1006/abbi.2001.2448. [DOI] [PubMed] [Google Scholar]
- Bhardwaj S, Selvarajah S, Schneider EB. Muscular effects of statins in the elderly female: a review. Clin Interv Aging. 2013;8:47–59. doi: 10.2147/CIA.S29686. [DOI] [PMC free article] [PubMed] [Google Scholar]
- Brogna S, Wen J. Nonsense-mediated mRNA decay (NMD) mechanisms. Nat Struct Mol Biol. 2009;16:107–113. doi: 10.1038/nsmb.1550. [DOI] [PubMed] [Google Scholar]
- Cobos EJ, Ghasemlou N, Araldi D, Segal D, Duong K, Woolf CJ. Inflammation-induced decrease in voluntary wheel running in mice: a nonreflexive test for evaluating inflammatory pain and analgesia. Pain. 2012;153:876–884. doi: 10.1016/j.pain.2012.01.016. [DOI] [PMC free article] [PubMed] [Google Scholar]
- Desbats MA, Lunardi G, Doimo M, Trevisson E, Salviati L. Genetic bases and clinical manifestations of coenzyme Q (CoQ) deficiency. J Inherit Metab Dis. 2014;38:145–156. doi: 10.1007/s10545-014-9749-9. [DOI] [PubMed] [Google Scholar]
- Diaz F, Thomas CK, Garcia S, Hernandez D, Moraes CT. Mice lacking COX10 in skeletal muscle recapitulate the phenotype of progressive mitochondrial myopathies associated with cytochrome c oxidase deficiency. Hum Mol Genet. 2005;14:2737–2748. doi: 10.1093/hmg/ddi307. [DOI] [PMC free article] [PubMed] [Google Scholar]
- Diomedi-Camassei F, Di Giandomenico S, Santorelli FM, Caridi G, Piemonte F, Montini G, Ghiggeri GM, Murer L, Barisoni L, Pastore A, et al. COQ2 nephropathy: a newly described inherited mitochondriopathy with primary renal involvement. J Am Soc Nephrol. 2007;18:2773–2780. doi: 10.1681/ASN.2006080833. [DOI] [PubMed] [Google Scholar]
- Doimo M, Trevisson E, Airik R, Bergdoll M, Santos-Ocana C, Hildebrandt F, Navas P, Pierrel F, Salviati L. Effect of vanillic acid on COQ6 mutants identified in patients with coenzyme Q deficiency. Biochim Biophys Acta. 2014;1842:1–6. doi: 10.1016/j.bbadis.2013.10.007. [DOI] [PMC free article] [PubMed] [Google Scholar]
- Duncan AJ, Bitner-Glindzicz M, Meunier B, Costello H, Hargreaves IP, Lopez LC, Hirano M, Quinzii CM, Sadowski MI, Hardy J, et al. A nonsense mutation in COQ9 causes autosomal-recessive neonatal-onset primary coenzyme Q10 deficiency: a potentially treatable form of mitochondrial disease. Am J Hum Genet. 2009;84:558–566. doi: 10.1016/j.ajhg.2009.03.018. [DOI] [PMC free article] [PubMed] [Google Scholar]
- Emmanuele V, Lopez LC, Berardo A, Naini A, Tadesse S, Wen B, D'Agostino E, Solomon M, DiMauro S, Quinzii C, et al. Heterogeneity of coenzyme Q10 deficiency: patient study and literature review. Arch Neurol. 2012;69:978–983. doi: 10.1001/archneurol.2012.206. [DOI] [PMC free article] [PubMed] [Google Scholar]
- Fernandez-Vizarra E, Lopez-Perez MJ, Enriquez JA. Isolation of biogenetically competent mitochondria from mammalian tissues and cultured cells. Methods. 2002;26:292–297. doi: 10.1016/S1046-2023(02)00034-8. [DOI] [PubMed] [Google Scholar]
- Garcia-Corzo L, Luna-Sanchez M, Doerrier C, Garcia JA, Guaras A, Acin-Perez R, Bullejos-Peregrin J, Lopez A, Escames G, Enriquez JA, et al. Dysfunctional Coq9 protein causes predominant encephalomyopathy associated with CoQ deficiency. Hum Mol Genet. 2013;22:1233–1248. doi: 10.1093/hmg/dds530. [DOI] [PubMed] [Google Scholar]
- Garcia-Corzo L, Luna-Sanchez M, Doerrier C, Ortiz F, Escames G, Acuna-Castroviejo D, Lopez LC. Ubiquinol-10 ameliorates mitochondrial encephalopathy associated with CoQ deficiency. Biochim Biophys Acta. 2014;1842:893–901. doi: 10.1016/j.bbadis.2014.02.008. [DOI] [PubMed] [Google Scholar]
- Gong Q, Stump MR, Zhou Z. Position of premature termination codons determines susceptibility of hERG mutations to nonsense-mediated mRNA decay in long QT syndrome. Gene. 2014;539:190–197. doi: 10.1016/j.gene.2014.02.012. [DOI] [PMC free article] [PubMed] [Google Scholar]
- Heeringa SF, Chernin G, Chaki M, Zhou W, Sloan AJ, Ji Z, Xie LX, Salviati L, Hurd TW, Vega-Warner V, et al. COQ6 mutations in human patients produce nephrotic syndrome with sensorineural deafness. J Clin Invest. 2011;121:2013–2024. doi: 10.1172/JCI45693. [DOI] [PMC free article] [PubMed] [Google Scholar]
- Holbrook JA, Neu-Yilik G, Hentze MW, Kulozik AE. Nonsense-mediated decay approaches the clinic. Nat Genet. 2004;36:801–808. doi: 10.1038/ng1403. [DOI] [PubMed] [Google Scholar]
- Inoue K, Ikegami H, Fujisawa T, Noso S, Nojima K, Babaya N, Itoi-Babaya M, Makimo S, Ogihara T. Allelic variation in class I K gene as candidate for a second component of MHC-linked susceptibility to type 1 diabetes in non-obese diabetic mice. Diabetologia. 2004;47:739–747. doi: 10.1007/s00125-004-1370-2. [DOI] [PubMed] [Google Scholar]
- Jakobs BS, van den Heuvel LP, Smeets RJ, de Vries MC, Hien S, Schaible T, Smeitink JA, Wevers RA, Wortmann SB, Rodenburg RJ. A novel mutation in COQ2 leading to fatal infantile multisystem disease. J Neurol Sci. 2013;326:24–28. doi: 10.1016/j.jns.2013.01.004. [DOI] [PubMed] [Google Scholar]
- Khajavi M, Inoue K, Lupski JR. Nonsense-mediated mRNA decay modulates clinical outcome of genetic disease. Eur J Hum Genet. 2006;14:1074–1081. doi: 10.1038/sj.ejhg.5201649. [DOI] [PubMed] [Google Scholar]
- Kirby DM, Thorburn DR, Turnbull DM, Taylor RW. Biochemical assays of respiratory chain complex activity. Methods Cell Biol. 2007;80:93–119. doi: 10.1016/S0091-679X(06)80004-X. [DOI] [PubMed] [Google Scholar]
- Lohman DC, Forouhar F, Beebe ET, Stefely MS, Minogue CE, Ulbrich A, Stefely JA, Sukumar S, Luna-Sanchez M, Jochem A, et al. Mitochondrial COQ9 is a lipid-binding protein that associates with COQ7 to enable coenzyme Q biosynthesis. Proc Natl Acad Sci USA. 2014;111:E4697–E4705. doi: 10.1073/pnas.1413128111. [DOI] [PMC free article] [PubMed] [Google Scholar]
- Lopez LC, Quinzii CM, Area E, Naini A, Rahman S, Schuelke M, Salviati L, DiMauro S, Hirano M. Treatment of CoQ(10) deficient fibroblasts with ubiquinone, CoQ analogs, and vitamin C: time- and compound-dependent effects. PLoS One. 2010;5:e11897. doi: 10.1371/journal.pone.0011897. [DOI] [PMC free article] [PubMed] [Google Scholar]
- Martin-Montalvo A, Gonzalez-Mariscal I, Pomares-Viciana T, Padilla-Lopez S, Ballesteros M, Vazquez-Fonseca L, Gandolfo P, Brautigan DL, Navas P, Santos-Ocana C. The phosphatase Ptc7 induces coenzyme Q biosynthesis by activating the hydroxylase Coq7 in yeast. J Biol Chem. 2013;288:28126–28137. doi: 10.1074/jbc.M113.474494. [DOI] [PMC free article] [PubMed] [Google Scholar]
- Mekada K, Abe K, Murakami A, Nakamura S, Nakata H, Moriwaki K, Obata Y, Yoshiki A. Genetic differences among C57BL/6 substrains. Exp Anim. 2009;58:141–149. doi: 10.1538/expanim.58.141. [DOI] [PubMed] [Google Scholar]
- Multiple-System Atrophy Research C. Mutations in COQ2 in familial and sporadic multiple-system atrophy. N Engl J Med. 2013;369:233–244. doi: 10.1056/NEJMoa1212115. [DOI] [PubMed] [Google Scholar]
- Nierobisz LS, Hentz NG, Felts JV, Mozdziak PE. Fiber phenotype and coenzyme Q(1)(0) content in Turkey skeletal muscles. Cells Tissues Organs. 2010;192:382–394. doi: 10.1159/000319550. [DOI] [PMC free article] [PubMed] [Google Scholar]
- Pagliarini DJ, Calvo SE, Chang B, Sheth SA, Vafai SB, Ong SE, Walford GA, Sugiana C, Boneh A, Chen WK, et al. A mitochondrial protein compendium elucidates complex I disease biology. Cell. 2008;134:112–123. doi: 10.1016/j.cell.2008.06.016. [DOI] [PMC free article] [PubMed] [Google Scholar]
- Pallud J, Häussler U, Langlois M, Hamelin S, Devaux B, Deransart C, Depaulis A. Dentate gyrus and hilus transection blocks seizure propagation and granule cell dispersion in a mouse model for mesial temporal lobe epilepsy. Hippocampus. 2011;21:334–343. doi: 10.1002/hipo.20795. [DOI] [PubMed] [Google Scholar]
- Peng M, Falk MJ, Haase VH, King R, Polyak E, Selak M, Yudkoff M, Hancock WW, Meade R, Saiki R, et al. Primary coenzyme Q deficiency in Pdss2 mutant mice causes isolated renal disease. PLoS Genet. 2008;4:e1000061. doi: 10.1371/journal.pgen.1000061. [DOI] [PMC free article] [PubMed] [Google Scholar]
- Quinzii C, Naini A, Salviati L, Trevisson E, Navas P, DiMauro S, Hirano M. A mutation in para-hydroxybenzoate-polyprenyl transferase (COQ2) causes primary coenzyme Q10 deficiency. Am J Hum Genet. 2006;78:345–349. doi: 10.1086/500092. [DOI] [PMC free article] [PubMed] [Google Scholar]
- Quinzii CM, Tadesse S, Naini A, Hirano M. Effects of inhibiting CoQ10 biosynthesis with 4-nitrobenzoate in human fibroblasts. PLoS One. 2012;7:e30606. doi: 10.1371/journal.pone.0030606. [DOI] [PMC free article] [PubMed] [Google Scholar]
- Quinzii CM, Garone C, Emmanuele V, Tadesse S, Krishna S, Dorado B, Hirano M. Tissue-specific oxidative stress and loss of mitochondria in CoQ-deficient Pdss2 mutant mice. FASEB J. 2013;27:612–621. doi: 10.1096/fj.12-209361. [DOI] [PMC free article] [PubMed] [Google Scholar]
- Rana K, Fam BC, Clarke MV, Pang TP, Zajac JD, MacLean HE. Increased adiposity in DNA binding-dependent androgen receptor knockout male mice associated with decreased voluntary activity and not insulin resistance. Am J Physiol Endocrinol Metab. 2011;301:E767–E778. doi: 10.1152/ajpendo.00584.2010. [DOI] [PubMed] [Google Scholar]
- Raymackers JM, Debaix H, Colson-Van Schoor M, De Backer F, Tajeddine N, Schwaller B, Gailly P, Gillis JM. Consequence of parvalbumin deficiency in the mdx mouse: histological, biochemical and mechanical phenotype of a new double mutant. Neuromuscul Disord. 2003;13:376–387. doi: 10.1016/s0960-8966(03)00031-2. [DOI] [PubMed] [Google Scholar]
- Rio Frio T, Wade NM, Ransijn A, Berson EL, Beckmann JS, Rivolta C. Premature termination codons in PRPF31 cause retinitis pigmentosa via haploinsufficiency due to nonsense-mediated mRNA decay. J Clin Invest. 2008;118:1519–1531. doi: 10.1172/JCI34211. [DOI] [PMC free article] [PubMed] [Google Scholar]
- Rogers GW, Brand MD, Petrosyan S, Ashok D, Elorza AA, Ferrick DA, Murphy AN. High throughput microplate respiratory measurements using minimal quantities of isolated mitochondria. PLoS One. 2011;6:e21746. doi: 10.1371/journal.pone.0021746. [DOI] [PMC free article] [PubMed] [Google Scholar]
- Schagger H. Blue-native gels to isolate protein complexes from mitochondria. Methods Cell Biol. 2001;65:231–244. doi: 10.1016/s0091-679x(01)65014-3. [DOI] [PubMed] [Google Scholar]
- Schulte-Hostedde AI, Millar JS, Hickling GJ. Intraspecific variation in testis size of small mammals: implications for muscle mass. Can J Zool. 2003;81:591–595. [Google Scholar]
- Sommerville RB, Zaidman CM, Pestronk A. Coenzyme Q10 deficiency in children: frequent type 2C muscle fibers with normal morphology. Muscle Nerve. 2013;48:722–726. doi: 10.1002/mus.23837. [DOI] [PubMed] [Google Scholar]
- Tanji K, Bonilla E. Light microscopic methods to visualize mitochondria on tissue sections. Methods. 2008;46:274–280. doi: 10.1016/j.ymeth.2008.09.027. [DOI] [PubMed] [Google Scholar]
- Torres-Torronteras J, Rodriguez-Palmero A, Pinos T, Accarino A, Andreu AL, Pintos-Morell G, Martii R. A novel nonstop mutation in TYMP does not induce nonstop mRNA decay in a MNGIE patient with severe neuropathy. Hum Mutat. 2011;32:E2061–E2068. doi: 10.1002/humu.21447. [DOI] [PubMed] [Google Scholar]
- Tran UC, Marbois B, Gin P, Gulmezian M, Jonassen T, Clarke CF. Complementation of Saccharomyces cerevisiae coq7 mutants by mitochondrial targeting of the Escherichia coli UbiF polypeptide: two functions of yeast Coq7 polypeptide in coenzyme Q biosynthesis. J Biol Chem. 2006;281:16401–16409. doi: 10.1074/jbc.M513267200. [DOI] [PMC free article] [PubMed] [Google Scholar]
- Tran UC, Clarke CF. Endogenous synthesis of coenzyme Q in eukaryotes. Mitochondrion. 2007;7(Suppl):S62–S71. doi: 10.1016/j.mito.2007.03.007. [DOI] [PMC free article] [PubMed] [Google Scholar]
- Turunen M, Olsson J, Dallner G. Metabolism and function of coenzyme Q. Biochim Biophys Acta. 2004;1660:171–199. doi: 10.1016/j.bbamem.2003.11.012. [DOI] [PubMed] [Google Scholar]
- Tyynismaa H, Ylikallio E, Patel M, Molnar MJ, Haller RG, Suomalainen A. A heterozygous truncating mutation in RRM2B causes autosomal-dominant progressive external ophthalmoplegia with multiple mtDNA deletions. Am J Hum Genet. 2009;85:290–295. doi: 10.1016/j.ajhg.2009.07.009. [DOI] [PMC free article] [PubMed] [Google Scholar]
- Venhoff N, Lebrecht D, Pfeifer D, Venhoff AC, Bisse E, Kirschner J, Walker UA. Muscle-fiber transdifferentiation in an experimental model of respiratory chain myopathy. Arthritis Res Ther. 2012;14:R233. doi: 10.1186/ar4076. [DOI] [PMC free article] [PubMed] [Google Scholar]
- Xie LX, Ozeir M, Tang JY, Chen JY, Kieffer-Jaquinod S, Fontecave M, Clarke CF, Pierrel F. Over-expression of the Coq8 kinase in Saccharomyces cerevisiae coq null mutants allows for accumulation of diagnostic intermediates of the Coenzyme Q6 biosynthetic pathway. J Biol Chem. 2012;287:23571–23581. doi: 10.1074/jbc.M112.360354. [DOI] [PMC free article] [PubMed] [Google Scholar]
- Zetoune AB, Fontaniere S, Magnin D, Anczukow O, Buisson M, Zhang CX, Mazoyer S. Comparison of nonsense-mediated mRNA decay efficiency in various murine tissues. BMC Genet. 2008;9:83. doi: 10.1186/1471-2156-9-83. [DOI] [PMC free article] [PubMed] [Google Scholar]
Associated Data
This section collects any data citations, data availability statements, or supplementary materials included in this article.
Supplementary Materials
Supplementary Figure S1
Supplementary Figure S2
Supplementary Figure S3
Supplementary Figure S4
Supplementary Figure S5
Supplementary Figure S6
Supplementary Figure S7
Supplementary Figure S8
Supplementary Figure S9
Supplementary Figure S10
Supplementary Figure S11
Supplementary Figure S12
Supplementary Figure S13
Supplementary Table S1 and Supplementary Figure Legends
Source Data for Supplementary Figure S4
Review Process File
Source Data for Figure 1B
Source Data for Figure 2E
Source Data for Figure 5
Source Data for Figure 6