

Abstract
The nuclear envelope is a double membrane that separates the nucleus from the cytoplasm. The inner nuclear membrane (INM) functions in essential nuclear processes including chromatin organization and regulation of gene expression1. The outer nuclear membrane is continuous with the endoplasmic reticulum (ER) and is the site of membrane protein synthesis. Protein homeostasis in this compartment is ensured by ER-associated protein degradation (ERAD) pathways that in yeast involve the integral membrane E3 ubiquitin ligases Hrd1 and Doa10 operating with the E2 ubiquitin-conjugating enzymes Ubc6 and Ubc72,3. However, little is known regarding protein quality control at the INM. Here we describe a protein degradation pathway at the INM mediated by the Asi complex consisting of the RING domain proteins Asi1 and Asi34. We report that the As complex functions together with the ubiquitin conjugating enzymes Ubc6andUbc7to degrade soluble and integral membrane proteins. Genetic evidence suggest that the Asi ubiquitin ligase defines a pathway distinct from but complementary to ERAD. Using unbiased screening with a novel genome-wide yeast library based on a tandem fluorescent protein timer (tFT)5, we identify more than 50 substrates of the Asi, Hrd1 and Doa10 E3 ubiquity ligases. We show that the Asi ubiquitin ligase is involved in degradation of mislocalised integral membrane proteins, thus acting to maintain and safeguard the identity of the INM.
To identify components of INM quality control, we focused on the ubiquitin-conjugating enzyme Ubc6. Ubc6 is an integral membrane protein that localises to the ER and the INM where it targets for degradation soluble and integral membrane proteins together with Ubc7 and Doa106,7. We established a microscopy-based bimolecular fluorescence complementation (BiFC) assay8 to screen for new E3 ubiquitin ligases interacting with Ubc6 (Fig. 1a). Ten out of 54 known or putative E3s, including Doa10, interacted with Ubc6 at distinct sub cellular locations (Fig. 1b and Extended Data Fig. 1a). Among these, Asi1 and Asi3 displayed a BiFC signal restricted to the nuclear rim (Fig. 1b). Despite their co localisation at the ER, no interaction was detected between Ubc6 and Hrd1 (Extended Data Fig. 1a), suggesting a low rate of false-positive interactions in our BiFC assay.
Figure 1.
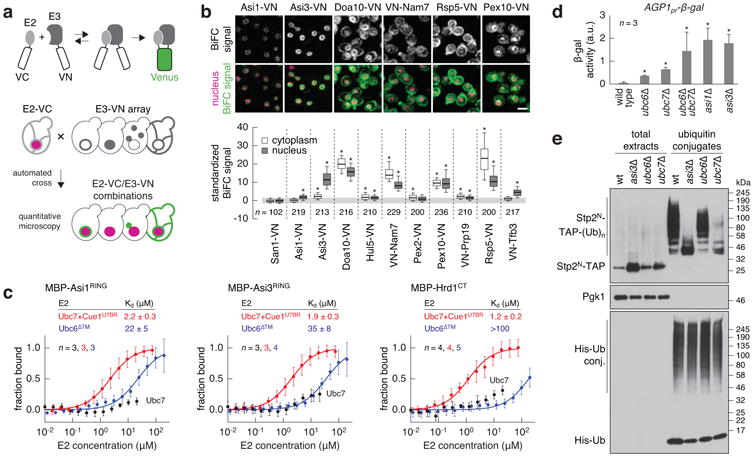
The Asi complex is a Ubc6/Ubc7-dependent E3 ubiquitin ligase of the INM.
a, BiFC strategy used to assay E2-E3 interactions. E2 and E3 proteins were endogenously tagged with C- and N-terminal fragments of the Venus fluorescent protein (VC and VN). Interactions between E2 and E3 proteins enable reconstitution of functional Venus that is detected with fluorescence microscopy. Rpn7-tDimer2 served as red nuclear marker.
b, Quantification of BiFC signals in cells co-expressing VC-Ubc6 and VN-tagged E3s. Fluorescence microscopy examples representative of six fields of view (top panel). Scale bar, 5 μm. BiFC signals were measured in the cytoplasm and nucleus of individual cells (bottom panel, n as indicated in the figure). Whiskers extend from 10th to 90th percentiles.
c, Microscale thermophoresis analysis of interactions between recombinant maltose binding protein (MBP)-E3 fragments and the indicated E2s. Plots show the fraction of MBP-E3 bound to the E2 at each tested E2 concentration (mean ± s.d., n as indicated in the figure). Dissociation constants (Kd, mean ± s.d.) were derived from non-linear fits with the law of mass action (solid lines).
d, Activity of β-galactosidase expressed from the AGP1 promoter in the indicated strains (mean ± s.d., n = 3clones); a.u., arbitrary units.
e, Ubiquitylation of Stp2N-TAP in strains expressing 10His-ubiquitin. Total cell extracts and ubiquitin conjugates eluted after immobilized-metal affinity chromatography were separated by SDS-PAGE followed by immune blotting with antibodies against the TAP tag, Pgk1 and ubiquitin. Representative immune blots from 3 technical replicates.
Statistics: (b) One-way ANOVA with Bonferroni correction for multiple testing. *P<10-4. (d) Two-tailed t-test. *P<0.05.
Asi1 and Asi3 are integral membrane RING domain proteins of the INM and form the Asi complex4,9,10. Together with the INM protein Asi2, the Asi complex functions in the SPS (Ssy1-Ptr3-Ssy5) amino acid sensing pathway where it is involved in degradation of Stp1 and Stp2 transcription factors11. We tested the interactions of Asi1 and Asi3 with all E2 ubiquitin-conjugating enzymes using the BiFC assay. In addition to Ub, Asi1 and Asi3 interacted with Ubc7 and weakly with Ubc4 (Extended Data Fig. 1b-d). We validated these interactions in microscale thermophoresis experiments12 with recombinant proteins(Fig. 1c, Extended Data Fig. 1e). The Ubc7-binding region of Cue1 (Cue1U7BR)13, a protein that tethers Ubc7 to the ER membrane14, was included in the assays. A C-terminal fragment of Hrd1 (Hrd1CT) expected to interact with Ubc7 but not Ubc6 served as control3. The RING domains of Asi1 and Asi3 (Asi1RING and Asi3RING) interacted with Ubc7, provided it was bound to Cue1U7BR, with affinities similar to Hrd1CT. Asi1RING and Asi3RING, but not Hrd1CT, also interacted weakly with Ubc6 lacking its transmembrane domain (Ubc6Δ™) (Fig. 1c).
The Asi proteins maintain the SPS pathway in the “off state” in the absence of inducing amino acids, and do so by targeting for proteasomal degradation the low levels of Stp1 and Stp2 that inadvertently mislocalise into the nucleus11. Consequently, asi mutants exhibit aberrant constitutive Stp1/Stp2-dependent transcription9. We observed that ubc7Δ and, to a lesser extent, ubc6Δ mutants exhibited increased expression of Stp1/Stp2-regulated genes similar to the asi1Δ and asi3Δ mutants(Fig. 1d, Extended Data Fig. 1f). These effects were not due to inactivation of Hrd1 or Doa10 ubiquitin ligases(Extended Data Fig. 1f), thus implicating Ubc6 and Ubc7 in the SPS pathway.
Next, we assayed the ubiquitylation of an artificial Asi substrate based on the first 45 amino acids of Stp2 (Stp2N). This fragment of Stp2 contains a degron that is recognized by the Asi complex11. Ubiquitylation of Stp2N fused to the TAP tag was reduced in ubc6Δ and severely impaired in asi3Δ and ubc7Δ mutants (Fig. 1e). In addition, ubiquitylation of Stp1 and Stp2 mutants with constitutive SPS-independent nuclear localization was impaired in asi1Δ and asi3Δ strains (Extended Data Fig. 1g). Together, these results establish the Asi complex as an E3 ubiquitin ligase of the INM that functions with Ubc6 and Ubc7.
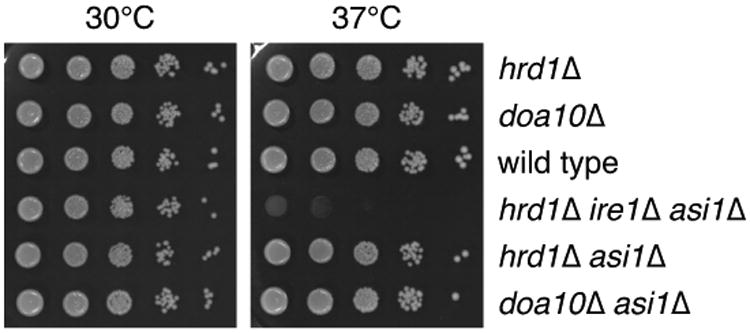
Functionally related genes can be identified by similarity of genetic interaction profiles15. We searched for novel functions of the Asi ubiquitin ligase by mining a genome-scale genetic interaction map16. In this data set, the fitness of 5.4 million double mutant combinations was measured by colony size, generating genetic interaction profiles for ∼75% of all S. Cerevisiaegenes. We calculated correlation coefficients between genetic interaction profiles of ASI genes and the other 4458 genes in the genetic interaction map. In this analysis, the genetic interaction profiles of ASI genes correlated with each other and, to a similar extent, with HRD1, DOA10, UBC6, UBC7 and CUE1 among others (Fig. 2a, Supplementary Table 1), suggesting that Asi and ERAD E3 ubiquitin ligases are functionally related. We sought to determine whether they work in the same or parallel pathways. Strains lacking HRD1 and the unfolded protein response genes IRE1 or HAC1 show impaired growth at elevated temperature17. Additional deletion of ASI1 resulted in a synthetic lethal phenotype under these conditions18 (Fig. 2b, Extended Data Fig. 2), suggesting that Asi1 and Hrd1 function in parallel pathways.
Figure 2.
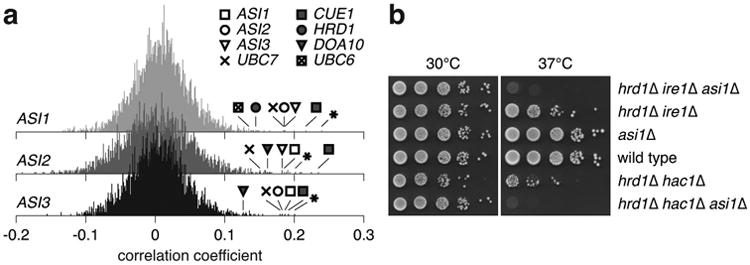
Functional overlap between Asi and ERAD E3 ubiquitin ligases.
a, Histograms of Pearson correlation coefficients calculated between the genetic interaction profiles of each ASI gene and ∼75% of all yeast genes, obtained from a previously published genome-scale genetic interaction map16. Asterisks mark the YMR119W-A dubious open reading frame, which overlaps with the ASI1 gene.
b, 10-fold serial dilutions of strains grown on synthetic complete medium for 2 days at 30 or 37°C.
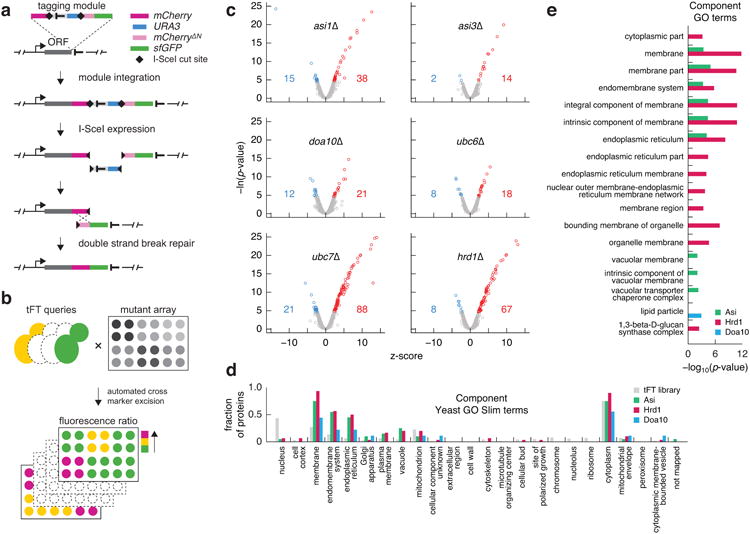
We used a tandem fluorescent protein timer (tFT) approach5 to perform unbiased proteome-wide screens for substrates of the Asi, Hrd1 and Doa10 ubiquitin ligases. A tFT is a tag composed of two fluorescent proteins (mCherry and sfGFP) with distinct fluorophore maturation rates. The mCherry/sfGFP intensity ratio is a measure of protein degradation kinetics in steady state(Fig. 3a), with a dynamic range and sensitivity that exceed conventional cycloheximide chase experiments5 (Supplementary Note 1). We constructed a genome-wide library of yeast strains each expressing a different tFT-tagged protein (Supplementary Methods). Library construction relied on a seamless tagging strategy that minimizes the influence of the tag on gene expression19 (Extended Data Fig. 3a). In total, 4044 proteins were successfully tagged to create a tFT library covering ∼73% of verified or uncharacterized open reading frames in the S. cerevisiae genome (Supplementary Table 2). We introduced asi1Δ, asi3Δ, hrd1Δ, doa10Δ, ubc6Δ and ubc7Δ deletion alleles into the tFT library using high-throughput genetic crosses20. The effect of each gene deletion on the stability of each protein in the library was examined with high-throughput fluorescence measurements of colonies5 (Extended Data Fig. 3b) and quantified as a z-score. More proteins were stabilized (positive z-score) than destabilized in the six mutants (Extended Data Fig. 3c, Supplementary Table 3), in agreement with the role of Asi, Hrd1 and Doa10 ubiquitin ligases in protein degradation. Hierarchical clustering of top hits recapitulated known E2-E3 interactions and revealed three clusters of 20, 30 and 9 potential substrates for the Asi, Hrd1 and Doa10 ubiquitin ligases, respectively (Fig. 3b). Hrd1 substrates, including the known substrate Der121, were stabilized only in the ubc7Δ mutant, whereas Doa10 substrates were stabilized in both ubc6Δ and ubc7Δ mutants. Most Asi substrates, including the recently identified Erg1118, were stabilized in the ubc7Δ mutant with only weak effects of the ubc6Δ mutant (Fig. 3b). Stp1 and Stp2 were not identified as Asi substrates in the screen, likely the consequence of their efficient targeting for degradation by the E3 ubiquitin ligase SCFGrr1 in the cytoplasm11. The vast majority of potential substrates in each set were integral membrane or secretory proteins distributed along the end membrane system and the Hrd1 and Asi substrates were enriched in ER and vacuolar proteins (Fig. 3c, d, Extended Data Fig. 3d, e). These findings are consistent with the organization and functions of ER-associated ubiquitin ligases, thus establishing the tFT library as a valuable resource for studies of protein degradation (Supplementary Note 2), and indicate that the Asi complex is involved in degradation of a distinct set of integral membrane proteins.
Figure 3.
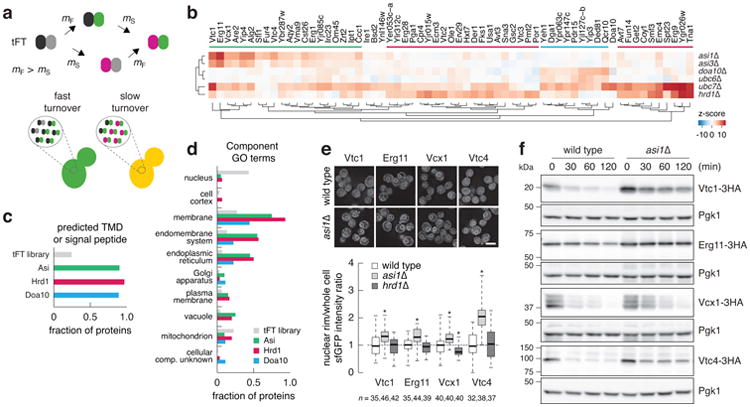
Systematic identification of substrates for Asi and ERAD E3 ubiquitin ligases.
a, A tandem fluorescent protein timer (tFT) is composed of two fluorescent proteins: one slower maturing (e.g. the red fluorescent protein mCherry, maturation rate constant mS) and the other faster maturing (e.g. the green fluorescent protein sfGFP, maturation rate constant mF). When fused to a protein of interest, a tFT reports on the degradation kinetics of the fusion protein: whereas fusions undergoing fast turnover are degraded prior to mCherry maturation, resulting in a low mCherry/sfGFP intensity ratio, the relative fraction of mature mCherry increases for proteins with slower turnover.
b, Summary heat map of the screens for tFT-tagged proteins with altered stability in the indicated mutants. Changes in protein stability (z-score) are color-coded from blue (decrease) to red (increase). Only proteins with a significant change in stability in at least one mutant (1% false discovery rate and z-score>4) are displayed. Clusters of potential substrates of Asi (green), Hrd1 (red) and Doa10 (blue) E3 ubiquitin ligases are indicated.
c, d, Fraction of proteins in the tFT library and in the three clusters in b with a predicted transmembrane domain (TMD) or signal peptide (c) or mapped to Component GO terms (d). Each cluster is significantly enriched in proteins with a predicted TMD or signal peptide compared to the tFT library (P<0.0034, Fisher's exact test).
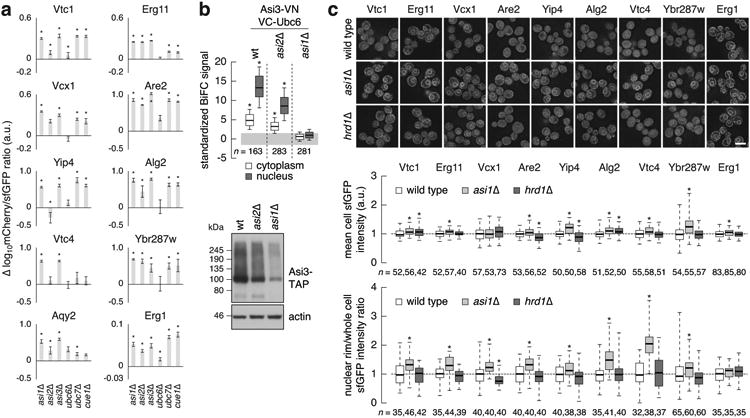
e, Quantification of sfGFP signals in strains expressing tFT-tagged proteins from the Asi cluster in b. Fluorescence microscopy examples representative of five fields of view (top panel). Scale bar, 5 μm. sfGFPintensities were measured in individual cells and at the nuclear rim (bottom panel, nas indicated in the figure). For each protein, measurements were normalized to the mean of the respective wild type. Whiskers extend from minimum to maximum values. Statistics: Two-tailed t-test. *P<0.05.
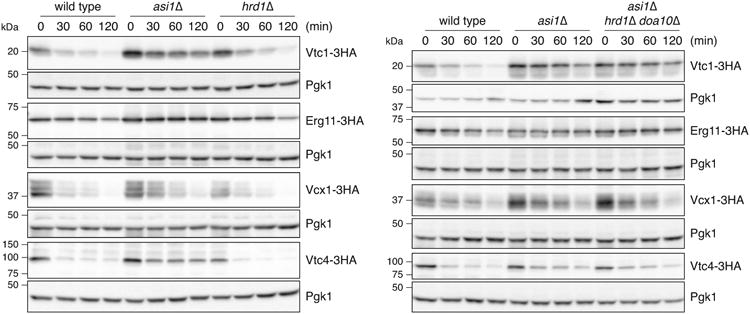
f, Degradation of 3HA-tagged proteins after blocking translation with cycloheximide. Whole cell extracts were separated by SDS-PAGE followed by immunoblotting with antibodies against the HA tag and Pgk1 as loading control. Representative immunoblots from 3 technical replicates.
We analysed this novel function of the Asi ubiquitin ligase with 10 tFT-tagged substrates. Genetic crosses with additional deletion mutants revealed the involvement of Cue1 in Asi-dependent degradation(Extended Data Fig. 4a), in agreement with our biochemical analysis (Fig. 1c). Several Asi substrates that were reproducibly stabilized in asi1Δ and asi3Δ mutants were not stabilized in strains lacking ASI2(Extended Data Fig. 4a), suggesting that Asi2 might function as a substrate-specific recognition factor. The Asi2-independentnature of the interaction between Asi3 and Ubc6 further supports this notion (Extended Data Fig. 4b). With exception of Aqy2, which was not expressed during exponential growth in liquid medium, all tFT-tagged substrates localised to the ER in wild type cells and 8 of them accumulated at the nuclear rim specifically in the asi1Δ mutant (Fig. 3e, Extended Data Fig. 4c). This result is consistent with protein stabilization at the INM where the Asi proteins reside. Cycloheximide chase experiments with HA-tagged variants revealed substantial turnover of Vtc1, Erg11, Vcx1 and Vtc4 in wild type cells. All four proteins were stabilized specifically in the absence of ASI1 (Fig. 3f, Extended Data Fig. 5), further validating our screening approach (Supplementary Note 1). Interestingly, Vtc1 and Vtc4 were previously shown to localise to the vacuolar membrane22. Both proteins mislocalise to the ER and nuclear rim only upon over expression or C-terminal tagging (Extended Data Fig. 6). Whether the Asi ubiquitin ligase recognizes such mislocalised proteins through specific degrons, as is the case with Stp1 and Stp2 transcription factors11, or other features such as compartment-specific properties of trans membrane domains23 is an open question.
The nuclear pore complex establishes a barrier between the cytoplasm and the nucleoplasm. However, increasing evidence suggest that not only small soluble proteins but also integral membrane proteins with cytoplasmic domains up to 60 kDa can passively diffuse past the nuclear pore through a ∼10 nm side channel6,24-28. We propose that the Asi ubiquitin ligase targets such mislocalised and potentially harmful proteins for degradation. Although the Asi proteins are not obviously conserved outside of yeast, the general importance of membrane-associated protein degradation mechanisms and the large diversity of integral membrane RING domain proteins in mammalian cells29 suggest that dedicated E3 ubiquitin ligases functioning in INM-associated protein degradation probably exist in higher eukaryotes.
Methods
Yeast methods and plasmids
Yeast genome manipulations (gene deletions and tagging) were performed using conventional PCR targeting, as described30. Yeast strains and plasmids used in this study are listed in Supplementary Tables 4 and 5, respectively.
β-galactosidase activity assay
Cells were grown in synthetic minimal medium and β-galactosidase activity was measured in N-lauroyl-sarcosine-permeabilized cells as described31.
RNA isolation and quantitative reverse transcriptase-PCR
Strains with auxotrophies complemented by plasmids pRS316 (URA3), pRS317 (LYS2) and pAB1 (HIS3, MET15, LEU2) were grown in synthetic minimal medium to 107 cells/ml and harvested by centrifugation. RNA was isolated using RiboPure™ Yeast Kit and treated with Turbo-DNase (Ambion). The quality of RNA preparations was assessed by electrophoresis on a 1% agarose gel with 10 mM guanidine thiocyanate, and the lack of DNA contamination was confirmed by PCR. One μg of RNA was used for cDNA synthesis with oligo (dT)12-19 (Invitrogen) using Super Script® III Reverse Transcriptase (Life Technologies). Quantitative PCR reactions were prepared using Kapa Sybr®Fast qPCR Master Mix (KapaBiosystems). cDNA mixtures were diluted 1/40 and 5 μl were used in a reaction volume of 20 μl with the following primer pairs:
AGP1fwd(CTGCCGTGCGTAGGTTTT) and
AGP1rev(AGAAGAAGGTGAGATAGCCGA);
GNP1fwd(CACCACAAGAACAAGAACAGAAAC) and
GNP1rev(ACCGACCAGCAAACCAGTA);
TAF10fwd(ATATTCCAGGATCAGGTCTTCCGTAGC) and
TAF10rev(CAACAACAACATCAACAGAATGAGAAGACTAC).
The levels of gene expression in three biological replicates were determined in two separate amplifications with triplicate technical replicates of each of the three genes analysed using the comparative ΔCT method (Rotor Gene 6000, Corbett Life Science). Relative levels of AGP1 and GNP1 mRNA were normalized with respect to the levels of the invariant reference geneTAF10; the levels of AGP1 and GNP1 in strains carrying the indicated mutations were subsequently averaged and normalized to the levels of expression in the corresponding isogenic wild type strains.
Purification of decahistidine-Ub protein conjugates
Ubiquitylated proteins were purified from100 OD600 equivalents of exponentially growing yeast cells expressing 10 His-tagged ubiquitin using a protocol adapted from Becuwe et al. (2012)32. Cell pellets were resuspended in 2 ml 20% trichloroacetic acid and lysed for 2 min using glass beads in a Disrupter Genie homogenizer (Scientific Industries). After precipitation, proteins were resuspended in 3 ml guanidium buffer (6 M GndHCl, 100 mM Tris-HCl pH 9, 300 mM NaCl, 10 mM imidazole, 0.2% Triton X-100, 5 mM chloroacetamide), clarified at 30,000 g and incubated for 1.5 h at room temperature withTALON® Metal Affinity Resin (Clontech). The beads were then washed with wash buffer (8 M Urea, 100 mM sodium phosphate pH 7.0, 300 mM NaCl, 5 mM imidazole, 0.2% Triton X-100, 5 mM chloroacetamide) containing 0.2% SDS (twice) and lacking SDS (twice).10His-ubiquitin conjugates were finally eluted with 200 μl elution buffer (8 M Urea, 100 mM sodium phosphate pH 7.0, 300 mM NaCl, 250 mM imidazole, 0.2% Triton X-100, 5 mM chloroacetamide). Total extracts (1% of the amount used for purification) and ubiquitin conjugate eluates were analyzed by SDS-PAGE and immunoblotting with antibodies against the TAP tag (PAP, 1:1,000, Sigma). As controls, levels of ubiquitin conjugates and Pgk1 were assessed with anti-ubiquitin (P4D1 HRP conjugate, 1:1,000, Santa Cruz) and anti-Pgk1 antibodies (clone 22C5D8, 1:10,000, Invitrogen), respectively. Immunogenic proteins were detected by chemiluminescence using SuperSignal West Femto Substrate (Thermo Scientific) and recorded using autoradiographic films (CP-BU, Agfa) processed with a Curix 60 developing machine (Agfa).
Purification of hexahistidine-Ub protein conjugates
Ubiquitylated proteins were purified from 50 OD600 equivalents of exponentially growing yeast cells expressing 6His-tagged ubiquitin as previously described33. 6His-ubiquitin conjugates were retained on nickel–nitrilotriacetic acid Sepharose beads (Qiagen) and eluted (eluate, E) in the presence of 300 mM (Stp1-HA, Stp1-RI17-33-HA) or 500 mM (Stp2-HA, Stp2Δ2-13-HA) imidazole. Total extracts (T), flow through (F) and eluate fractions were precipitated with 10% trichloroacetic acid, analysed by SDS-PAGE and immunoblotting with antibodies against the HA tag (1:5,000, Roche) and the signals were recorded using autoradiographic film (CL-Xposure, Thermo Scientific). As controls, levels of ubiquitin conjugates and Pgk1 were assessed with anti-His5 (1:5,000, Qiagen) and anti-Pgk1 antibodies (1:10,000, In Vitrogen), respectively, and detected by chemiluminescence using SuperSignal West Dura Extended Duration Substrate (Thermo Scientific) and a Molecular Imager ChemDoc XRS+ with Image Lab v3 build 11 software (BioRad). Loaded T and F fractions correspond to 2% (Stp1-HA or Stp1-RI17-33-HA) and 0.7% (Stp2-HA or Stp2Δ2-13-HA) of the amount used for purification of ubiquitin conjugates.
Bimolecular fluorescence complementation
BiFC interaction assays were performed using E2 and E3 proteins tagged with the VC173 and VN155 fragments (VC and VN) of the Venus fluorescent protein, respectively34. All E2 and E3 proteins were tagged C-terminally, with the following exceptions that were N-terminally tagged: Ubc6, since the C-terminus of Ubc6 faces the ER lumen35; Ubc7, to preserve its interaction with Cue136; Ubc1, because the growth of strains expressing Ubc1 endogenously tagged at the C-terminus with VC appears compromised; the E3 proteins Far1, Mot2, Nam7, Prp19, Ste5 and Tfb3, since they all have their E2 binding domain at the N-terminus. All fusions were expressed from their endogenous chromosomal loci, with the exception of Rsp5-VN, which was expressed from its endogenous promoter on the centromeric plasmid pGR703 (Supplementary Table 5).
Strains expressing VC-tagged E2 proteins were constructed in the scEB115 background. scEB115 carries markers for selection of haploid progeny in automated crosses (can1∷STE2pr-spHIS5 and lyp1∷STE3pr-HPH) and expresses the proteasomal subunit Rpn7 fused to the red fluorescent protein tDimer2 as nuclear marker (Supplementary Table 4). Strains expressing VN-tagged E3 proteins were either obtained from a commercially available collection (Bioneer Corporation) or constructed by homologous recombination in the BY4741 background. Expression of VC- and TAP-tagged fusions was validated by immunoblotting with mouse anti-GFP (clones 7.1 and 13.1, Roche) and peroxidase anti-peroxidase (Sigma) antibodies to detect VC and TAP tag, respectively, and mouse anti-action (clone c4, Merck Millipore) for loading controls.
Strains expressing individual E2 and E3 protein fusions were crossed to produce an array of yeast strains each expressing Rpn7-tDimer2 and a unique combination of tagged E2 and E3 proteins, as described20. The resulting strains were cultivated overnight at 20°C in YPD medium and diluted in low fluorescence medium37 3-4 h before imaging. Imaging was performed in 8-well LabTek chambers or 96-well plates (Imaging plates CG, Zell-Kontakt) using an inverted Leica SP8 confocal microscope. Images of the BiFC signal were collected using a 514 nm laser and a narrow band-pass filter (525-538 nm) around the emission peak of the Venus fluorescent protein to reduce the contribution of cellular autofluorescence. Rpn7-tDimer2 was imaged simultaneously using a 580-630 nm filter. Cellular auto fluorescence was imaged separately using the same band-pass filter as for BiFC images, but with a458 nm excitation. Rpn7 localises to the nucleus throughout the cell cycle in growing cells and relocalises to cytoplasmic structures when cells enter quiescence38. Rpn7-imer2 images were visually inspected before image processing to verify that cells are not quiescent. Rpn7-tDime and auto fluorescence images were used to segment the BiFC images into nuclear and cytoplasmic regions and to unmix the BiFC signal. Image segmentation and single cell fluorescence measurements were performed using custom plugins in ImageJ39 (available upon request). To enable comparison of data from different experiments, the quantification results were rescaled so that BiFC signals of control cells had a mean of zero and a standard deviation of one. Statistical analysis and graphical representation were performed with GraphPad Prism software. Statistically significant differences from control cells were identified by one-way ANOVA followed by Bonferroni post-hoc tests to correct for multiple comparisons.
Recombinant protein expression and purification
E. coli BL21 (DE3) were transformed with plasmids encoding MBP-Hrd1CT(Hrd1 residues 321-551), MBP-Asi1RING(Asi1 residues 559-624), MBP-Asi3RING(Asi3 residues 613-676), GST-Ubc6Δ™ (Ubc6 residues 1-230), GST-Ubc7or Cue1U7BR (Cue1 residues 151-203) and were cultivated in LB medium. Cue1U7BR was co expressed with GST-Ubc7. Protein expression was induced by addition of 1 mM IPTG during 4 h at 25°C. Cells were pelleted, resuspended in PBS, and lysed by sonication. Lysates were rotated with glutathione (GE Healthcare) or amylose beads (New England Biolab) for 1 h at 4°C. Beads were washed with PBS, 1 mM DTT. E2s were cleaved from GST using thrombin (Stago). MBP-E3s were eluted using 10 mM amylose and dialyzed against PBS, 1 mM DTT. All recombinant proteins were concentrated using spin filters (3 kDa, Amicon). Protein purity was tested by Coomassie staining after SDS-PAGE. Protein concentration was estimated by absorbance measurement at 280 nm.
Microscale thermophoresis
Microscale thermophoresis analysis was performed essentially as described12 using MBP-Asi1RING, MBP-Asi3RING or MBP-Hrd1CT fluorescently labelled with the fluorescent dye NT-647 (labelling was performed with the Monolith™ Protein Labeling Kit RED-NHS according to the instructions of the supplier) and high precision standard treated capillaries. MBP-E3s were diluted to 100 nM in PBS, 5% glycerol, 0.1% Tween 20, 1 mM DTT, 10 μM ZnAc and titrated with varying concentrations of unlabelled E2s before loading into capillaries. The difference of the thermophoretic properties of MBP-E3s were measured using a Monolith NT.115 instrument (NanoTemper Technologies GmbH) and a laser power of 60%. A non-linear fit with the law of mass action was used to derive the dissociation constant(Kd) of the interaction as well as the theoretical thermophoretic properties of the MBP-E3 in its fully bound and unbound states. Those values were then used to normalize the measurements and calculate the fraction of E3 bound at each E2 concentration. Data were plotted and fitted with the GraphPad Prism software.
tFT library construction
4081 verified or uncharacterized S. cerevisiae open reading frames were selected for tagging based on structural and functional criteria (detailed in the Supplementary Methods) to increase the probability that the C-terminal tFT tag would not affect protein functionality, and to avoid exposing the tag to an environment that could impact folding and maturation of the fluorescent proteins. Protocols for strain construction and validation are described in the Supplementary Methods. Briefly, strain manipulations were automated and performed in 96-well format whenever possible. Using conventional PCR targeting30 and lithium acetate transformation of yeast40, the module for seamless protein tagging with the mCherry-sfGFP timer (pMaM168 in Supplementary Table 5) was integrated into each selected genomic locus in the strain yMaM330 (Supplementary Table 4), a strain compatible with automated yeast genetics that carried a construct for conditional expression of the I-SceI meganuclease from the GAL1 promoter integrated into the leu2 locus. Correct integration of the tagging module into each locus and expression of tFT protein fusions was verified by PCR and whole colony fluorescence measurements for 4044 open reading frames, with two independent clones validated for 3952 open reading frames (Supplementary Table 2).
tFT library screening
Haploid array strains carrying deletions of individual components of the ubiquitin-proteasome system were obtained from the genome-wide heterozygous diploid yeast deletion library41 by sporulation and tetrad dissection. Screens were conducted in 1536-colony format. Using pinning robots (BioMatrix, S&P Robotics), tFT query strains (prior to marker excision) were mated with array mutants. Selection of diploids, sporulation and selection of haploids carrying simultaneously a tFT protein fusion and a gene deletion were performed by sequential pinning on appropriate selective media, as described20, followed by seamless marker excision19. In each screen, a single tFT strain was crossed to a set of mutants in the ubiquitin-proteasome pathway (including the asi1Δ, asi3Δ, hrd1Δ, doa10Δ, ubc6Δ and ubc7Δ mutants) (A.K., B.F., J.D.B., M.M., D.K., C.B., W.H. and M.K., manuscript in preparation) with four technical replicates of each cross. Technical replicates were arranged next to each other. Fluorescence intensities of the final colonies were measured after 24 h of growth on synthetic complete medium lacking histidine at 30°C using Infinite M1000 or Infinite M1000 Pro plate readers equipped with stackers for automated plate loading (Tecan) and custom temperature control chambers. Measurements in mCherry (587/10 nm excitation, 610/10 nm emission, optimal detector gain) and sfGFP (488/10 nm excitation, 510/10 nm emission, optimal detector gain) channels were performed at 400 Hz frequency of the flash lamp, with 10 flashes averaged for each measurement.
Measurements were filtered for potentially failed crosses based on colony size after haploid selection. Fluorescence intensity measurements were log-transformed and the data was normalized for spatial effects on plates by local regression. To estimate the changes from normal protein stability, median effects for tFT and deletion strains were subtracted from log-ratios of mCherry and sfGFP intensities. To avoid variance-mean dependences, standard deviations were regressed against the absolute fluorescence intensities. Changes in protein stability were divided by the regressed standard deviations, yielding a measurement comparable to a z-score, and tested against the hypothesis of zero change. A moderated t-test implemented in the R/Bioconductor package limma was used to compute p-values. p-values were adjusted for multiple testing by controlling the false discovery rate using the method of Benjamini-Hochberg.
Crosses with additional mutants were performed with independently constructed deletion strains using identical procedures on a RoToR pinning robot (Singer). Whole colony fluorescence intensities were corrected for auto fluorescence using measurements of corresponding mutant colonies crossed to strain yMaM344-2 expressing a truncated non-fluorescent mCherryΔN protein. For each tFT fusion, mCherry/sfGFP intensity ratios in each mutant were compared to a control cross with a wild type strain carrying the kanMX selection marker in the his3Δ locus.
Fluorescence microscopy
Strains were grown at 30°C in low fluorescence medium (synthetic complete medium prepared with yeast nitrogen base lacking folic acid and riboflavin (CYN6501, ForMedium)) to OD600 of 0.4-1.2 and attached to glass-bottom 96-well plates (MGB096-1-2-LG-L, Matrical) using Concanavalin A (C7275, Sigma) as described42. Single plane images were acquired on a Delta Vision Elite system (Applied Precision) consisting of an inverted epifluorescence microscope (IX71; Olympus) equipped with an LED light engine (SpectraX, Lumencor), 475/28 and 575/25 excitation, and 525/50 and 624/40 emission filters (Semrock), a dual-band beam splitter 89021 (Chroma Technology), using either a 100× NA 1.4 UPlanSApo or a 60× NA 1.42 Plan ApoN oil immersion objective (Olympus), an sCMOS camera (pco.edge 4.2, PCO) and a motorized stage contained in a temperature-controlled chamber. Image correction and quantification were performed in ImageJ39. Dark signal and flat field corrections were applied to all images as described42. Image deconvolution was performed with Soft worx software (Applied Precision) using the conservative ratio algorithm with default parameter settings. Individual cell, perinuclear region and cytoplasm segmentation masks were manually defined in deconvolved images and applied to non-deconvolved images. Mean single cell fluorescence measurements were corrected for cellular auto fluorescence. Mean perinuclear fluorescence measurements were corrected for cytoplasmic fluorescence of each individual cell.
Strains expressing N- and C-terminally tagged Vtc1 and Vtc4 were imaged with exposure setting adjusted to the expression levels: 3.3-fold longer exposure time for C-terminally tagged fusions. Representative deconvolved images were scaled identically.
Cycloheximide chases
Strains were grown at 30°C in synthetic complete medium to OD600 of ∼0.8 before addition of cycloheximide to 100 μg/ml final concentration. One ml samples taken at each time point were immediately mixed with 150 μl of 1.85 M NaOH and 10 μl beta-mercaptoethanol, and flash frozen in liquid nitrogen. Whole cell extracts were prepared as previously described40, separated by SDS-PAGE followed by semi-dry blotting and probed sequentially with mouse anti-HA (12CA5) and mouse anti-Pgk1 (22C5D8, Molecular Probes) antibodies. A secondary goat anti-mouse antibody (IgG (H+L)-HRP, Dianova) was used for detection on a LAS-4000 system (Fuji).
Extended Data
Extended Data Figure 1.
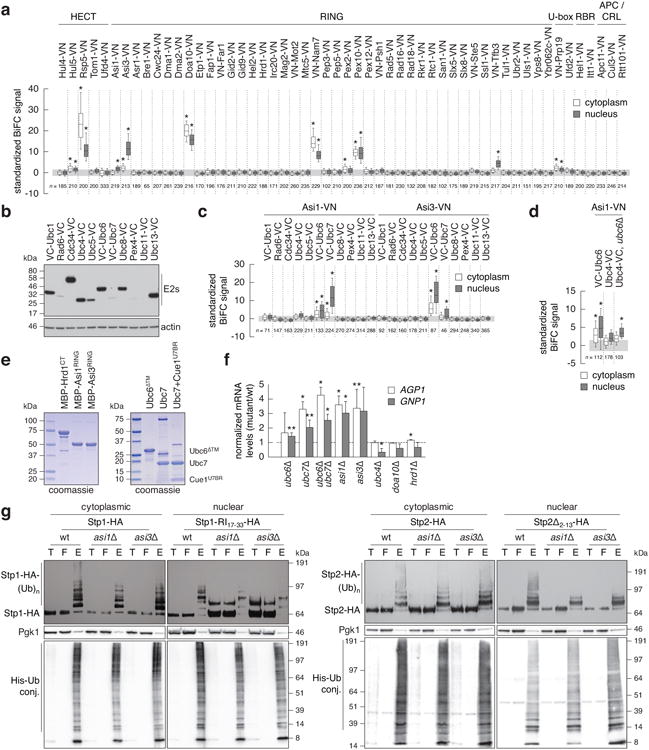
Identification of Ubc6 and Ubc7 ubiquitin conjugating enzymes as functional interacting partners of Asi1 and Asi3.
a, Quantification of BiFC signals in cells expressing VC-Ubc6 and all tested E3 ubiquitin ligases. BiFC signals were measured in the cytoplasm and nucleus of individual cells (n as indicated in the figure). Whiskers extend from 10th to 90th percentiles. The same representation is used in c and d.
b, Immunoblot showing expression levels of VC-tagged E2 ubiquitin conjugating enzymes. Ubc11-VC could not be detected in the growth condition of the BiFC assay.
c, Quantification of BiFC signals in cells co-expressing VC-tagged E2 ubiquitin conjugating enzymesand Asi1-VN or Asi3-VN (n as indicated in the figure).
d, Detection of a significant BiFC signal between Asi1-VN and Ubc4-VCin cells lacking UBC6 (n as indicated in the figure).
e, Coomassie-stained gels of recombinant proteins used in microscale thermophoresis experiments.
f, mRNA levels of AGP1 and GNP1 measured with qRT-PCR in the indicated strains (mean ± s.d., n = 3 clones). The signal was normalized to wild type (dashed line).
g, Ubiquitylation of Stp1-HA or Stp1-RI17-33-HA (left panel) and Stp2-HA or Stp2Δ2-13-HA (right panel) in strains expressing 6His-ubiquitin. Stp1-RI17-33 and Stp2Δ2-13 variants exhibit compromised cytoplasmic retention and enhanced Asi-dependent degradation, whereas full length Stp1 is degraded primarily in the cytoplasm in SCFGrr1-dependent manner11. Total cell extracts (T), flow through (F) and ubiquitin conjugates (E) eluted after immobilized-metal affinity chromatography were separated by SDS-PAGE followed by immunoblotting with antibodies against the HA tag, Pgk1 and the His tag. Representative immunoblots from 3 technical replicates.
Statistics: (a, c, d) One-way ANOVA with Bonferroni correction for multiple testing. *P<10-4. (f) Two-tailed t-test. *P<0.05 **P<0.10.
Extended Data Figure 2.
Lack of genetic interaction between ASI1 and HRD1 or DOA10 at 37°C.
10-fold serial dilutions of strains grown on synthetic complete medium for 2 days at 30 or 37°C.
Extended Data Figure 3.
tFT screens for substrates of Asi and ERAD E3 ubiquitin ligases.
a, Tagging approach used to construct the tFT libraryin a strain carrying the I-SceI meganuclease under an inducible promoter. First, a module for seamless C-terminal protein tagging with the mCherry-sfGFP timer is integrated into a genomic locus of interest using conventional PCR targeting. Subsequent I-SceI expression leads to excision of the heterologous terminator and the URA3 selection marker, followed by repair of the double strand break by homologous recombination between the mCherry and mCherryΔN sequences. A tFT fusion protein is expressed under control of endogenous promoter and terminator in the final strain.
b, Workflow of screens for substrates of E3 ubiquitin ligases involved in protein degradation. Each tFT query strain is crossed to an array of mutants carrying different gene deletion alleles. The resulting strains are imaged with a fluorescence plate reader to identify proteins with altered stability in each mutant.
c, Volcano plots of the screens for proteins with altered stability in the indicated mutants. Plots show z-scores for changes in protein stability on the x-axis and the negative logarithm of p-values adjusted for multiple testing on the y-axis. The number of proteins with increased (red) or decreased(blue) stability at 1% false discovery rate is indicated.
d, Fraction of proteins in the tFT library and in the three clusters in Fig. 3b mapped to the full Yeast Slim set of Component GO terms. Note that the GO term Cytoplasm contains all cellular contents except the nucleus and the plasma membrane.
e, The three clusters in Fig. 3b are enriched for proteins in the indicated Component GO terms. Bar plot shows -log10 transformed p-values of significant enrichments.
Extended Data Figure 4.
Analysis of integral membrane protein substrates of the Asi E3 ubiquitin ligase.
a, Differences in log10mCherry/sfGFP intensity ratio between the indicated mutants and the wild type (mean ± s.d., n = 4) for tFT-tagged proteins from the Asi cluster in Fig. 3b.
b, Quantification of BiFC signals in strains co-expressing VC-Ubc6 and Asi3-VN (top panel). BiFC signals were measured in the cytoplasm and nucleus of individual cells (n as indicated in the figure). Whiskers extend from 10th to 90th percentiles. A substantial BiFC signal is retained in the asi2Δ mutant, despite reduced expression of Asi3 (immunoblot, bottom panel).
c, Quantification of sfGFP signals in strains expressing tFT-tagged proteins from the Asi cluster in Fig. 3b. Fluorescence microscopy examples representative of five fields of view (top panel). Scale bar, 5 μm. sfGFP intensities were measured in individual cells (middle panel) and at the nuclear rim (bottom panel); a.u., arbitrary units. For each protein, measurements were normalized to the mean of the respective wild type. Whiskers extend from minimum to maximum values.
Extended Data Figure 5.
Cycloheximide chase experiments with substrates of the Asi E3 ubiquitin ligase.
Degradation of 3HA-tagged proteins after blocking translation with cycloheximide. Whole cell extracts were separated by SDS-PAGE followed by immunoblotting with antibodies against the HA tag and Pgk1 as loading control. Representative immunoblots from 2 technical replicates. Left panel wild type and asi1Δ immunoblots are reproduced in Fig. 3f.
Extended Data Figure 6.
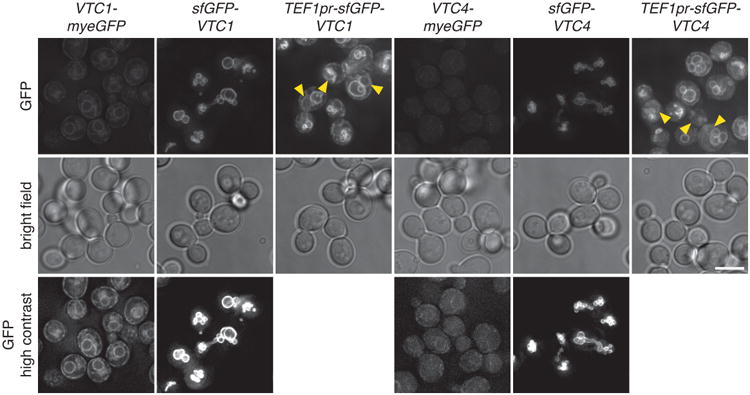
Influence of tagging and expression levels on localization of Vtc1 and Vtc4.
Fluorescence microscopy of strains expressing Vtc1 or Vtc4 tagged endogenously with myeGFP at the C-terminus or tagged with sfGFP at the N-terminus and expressed under control of endogenous or TEF1 promoters. Representative de convolved images of five fields of view with ∼100 cells each. Arrowheads indicate nuclear rim localisation. Scale bar, 5 μm.
Statistics: (a, c) Two-tailed t-test. *P<0.05. (b) One-way ANOVA with Bonferroni correction for multiple testing. *P<10-4.
Supplementary Material
Acknowledgments
We thank Marius Lemberg, Elmar Schiebel and Bernd Bukau for support and discussions, Andreas Kaufmann, Chi-Ting Ho, Anna Bartosik and Birgit Besenbeck for help with tFT library construction, Kicki Ryman for the qRT-PCR analysis of gene expression, Mark Hochstrasser for strains, the Gene Core and the media kitchen facilities of EMBL and Donnelly Centre for support with infrastructure and media. This work was supported by the Sonderforschungsbereich 1036 (SFB1036, TP10) from the Deutsche For schungsgemeinschaft (DFG) (M.K.), the Swedish Research Council grant VR2011-5925 (P.O.L.), INSERM and grants from ANR (ANR-12-JSV8-0003-001) and Biosit (G.R.), fellowships from the European Molecular Biology Organization (EMBO ALTF 1124-2010 and EMBO ASTF 546-2012) (A.K.) and fellowships from the Ministère de la Recherche et de l'Enseignement Supérieur and La Ligue Contre le Cancer (E.B.). M.K. received funds from the Cell Networks Cluster of Excellence (DFG) for support with tFT library construction. W.H. acknowledges funding from the EC Network of Excellence Systems Microscopy. C.B. was supported by funds from the Canadian Institute For Advanced Research (GNE-BOON-141871), National Institute of Health (R01HG005853-01), Canadian Institute for Health Research (MOP-102629) and the National Science and Engineering Research Council (RGPIN 204899-6).
Footnotes
Supplementary Information is available in the online version of the paper.
Author Contributions: G.R. designed the Bi FC, MST and ubiquitin pull down experiments that were performed by E.B., G.L.D. and A.B.M.P., D.J.O. and A.G. contributed the biochemical analysis of Asi-dependent ubiquitylation. M.K. and A.K. designed and coordinated the tFT project. A.K. and M.M. designed and constructed the tFT library and performed the screens with help from D.K. and C.B. B.F. and J.D.B. developed the screen analysis methods, with input from A.K., M.K., W.H.and C.B. M.K., A.K., G.R. and P.O.L. prepared the figures and wrote the paper with input from all authors.
The authors declare no competing financial interests.
Readers are welcome to comment on the online version of the paper.
References
- 1.Mekhail K, Moazed D. The nuclear envelope in genome organization, expression and stability. Nat Rev Mol Cell Biol. 2010;11:317–328. doi: 10.1038/nrm2894. [DOI] [PMC free article] [PubMed] [Google Scholar]
- 2.Zattas D, Hochstrasser M. Ubiquitin-dependent protein degradation at the yeast endoplasmic reticulum and nuclear envelope. Crit Rev Biochem Mol Biol. 2014:1–17. doi: 10.3109/10409238.2014.959889. [DOI] [PMC free article] [PubMed] [Google Scholar]
- 3.Ruggiano A, Foresti O, Carvalho P. Quality control: ER-associated degradation: protein quality control and beyond. J Cell Biol. 2014;204:869–879. doi: 10.1083/jcb.201312042. [DOI] [PMC free article] [PubMed] [Google Scholar]
- 4.Zargari A, et al. Inner nuclear membrane proteins Asi1, Asi2, and Asi3 function in concert to maintain the latent properties of transcription factors Stp1 and Stp2. J Biol Chem. 2007;282:594–605. doi: 10.1074/jbc.M609201200. [DOI] [PubMed] [Google Scholar]
- 5.Khmelinskii A, et al. Tandem fluorescent protein timers for in vivo analysis of protein dynamics. Nat Biotechnol. 2012;30:708–714. doi: 10.1038/nbt.2281. [DOI] [PubMed] [Google Scholar]
- 6.Deng M, Hochstrasser M. Spatially regulated ubiquitin ligation by an ER/nuclear membrane ligase. Nature. 2006;443:827–831. doi: 10.1038/nature05170. [DOI] [PubMed] [Google Scholar]
- 7.Boban M, Pantazopoulou M, Schick A, Ljungdahl PO, Foisner R. A nuclear ubiquitin-proteasome pathway targets the inner nuclear membrane protein Asi2 for degradation. J Cell Sci. 2014;127:3603–3613. doi: 10.1242/jcs.153163. [DOI] [PMC free article] [PubMed] [Google Scholar]
- 8.Hu CD, Chinenov Y, Kerppola TK. Visualization of interactions among bZIP and Rel family proteins in living cells using bimolecular fluorescence complementation. Mol Cell. 2002;9:789–798. doi: 10.1016/s1097-2765(02)00496-3. [DOI] [PubMed] [Google Scholar]
- 9.Forsberg H, Hammar M, Andreasson C, Molinér A, Ljungdahl PO. Suppressors of ssy1 and ptr3 null mutations define novel amino acid sensor-independent genes in Saccharomyces cerevisiae. Genetics. 2001;158:973–988. doi: 10.1093/genetics/158.3.973. [DOI] [PMC free article] [PubMed] [Google Scholar]
- 10.Boban M, et al. Asi1 is an inner nuclear membrane protein that restricts promoter access of two latent transcription factors. J Cell Biol. 2006;173:695–707. doi: 10.1083/jcb.200601011. [DOI] [PMC free article] [PubMed] [Google Scholar]
- 11.Omnus DJ, Ljungdahl PO. Latency of transcription factor Stp1 depends on a modular regulatory motif that functions as cytoplasmic retention determinant and nuclear degron. Mol Biol Cell. 2014;25:3823–3833. doi: 10.1091/mbc.E14-06-1140. [DOI] [PMC free article] [PubMed] [Google Scholar]
- 12.Wienken CJ, Baaske P, Rothbauer U, Braun D, Duhr S. Protein-binding assays in biological liquids using microscale thermophoresis. Nat Commun. 2010;1:100. doi: 10.1038/ncomms1093. [DOI] [PubMed] [Google Scholar]
- 13.Kostova Z, Mariano J, Scholz S, Koenig C, Weissman AM. A Ubc7p-binding domain in Cue1p activates ER-associated protein degradation. J Cell Sci. 2009;122:1374–1381. doi: 10.1242/jcs.044255. [DOI] [PMC free article] [PubMed] [Google Scholar]
- 14.Biederer T, Volkwein C, Sommer T. Role of Cue1p in ubiquitination and degradation at the ER surface. Science. 1997;278:1806–1809. doi: 10.1126/science.278.5344.1806. [DOI] [PubMed] [Google Scholar]
- 15.Costanzo M, Baryshnikova A, Myers CL, Andrews B, Boone C. Charting the genetic interaction map of a cell. Curr Opin Biotechnol. 2011;22:66–74. doi: 10.1016/j.copbio.2010.11.001. [DOI] [PubMed] [Google Scholar]
- 16.Costanzo M, et al. The Genetic Landscape of a Cell. Science. 2010;327:425–431. doi: 10.1126/science.1180823. [DOI] [PMC free article] [PubMed] [Google Scholar]
- 17.Friedlander R, Jarosch E, Urban J, Volkwein C, Sommer T. A regulatory link between ER-associated protein degradation and the unfolded-protein response. Nat Cell Biol. 2000;2:379–384. doi: 10.1038/35017001. [DOI] [PubMed] [Google Scholar]
- 18.Foresti O, Rodriguez-Vaello V, Funaya C, Carvalho P. Quality control of inner nuclear membrane proteins by the Asi complex. Science. 2014;346:751–755. doi: 10.1126/science.1255638. [DOI] [PubMed] [Google Scholar]
- 19.Khmelinskii A, Meurer M, Duishoev N, Delhomme N, Knop M. Seamless gene tagging by endonuclease-driven homologous recombination. PLoS ONE. 2011;6:e23794. doi: 10.1371/journal.pone.0023794. [DOI] [PMC free article] [PubMed] [Google Scholar]
- 20.Baryshnikova A, et al. Synthetic genetic array (SGA) analysis in Saccharomyces cerevisiae and Schizosaccharomyces pombe. Meth Enzymol. 2010;470:145–179. doi: 10.1016/S0076-6879(10)70007-0. [DOI] [PubMed] [Google Scholar]
- 21.Zattas D, Adle DJ, Rubenstein EM, Hochstrasser M. N-terminal acetylation of the yeast Derlin Der1 is essential for Hrd1 ubiquitin-ligase activity toward luminal ER substrates. Mol Biol Cell. 2013;24:890–900. doi: 10.1091/mbc.E12-11-0838. [DOI] [PMC free article] [PubMed] [Google Scholar]
- 22.Uttenweiler A, Schwarz H, Neumann H, Mayer A. The vacuolar transporter chaperone (VTC) complex is required for microautophagy. Mol Biol Cell. 2007;18:166–175. doi: 10.1091/mbc.E06-08-0664. [DOI] [PMC free article] [PubMed] [Google Scholar]
- 23.Sharpe HJ, Stevens TJ, Munro S. A comprehensive comparison of transmembrane domains reveals organelle-specific properties. Cell. 2010;142:158–169. doi: 10.1016/j.cell.2010.05.037. [DOI] [PMC free article] [PubMed] [Google Scholar]
- 24.Meinema AC, Poolman B, Veenhoff LM. The transport of integral membrane proteins across the nuclear pore complex. Nucleus. 2014;3:322–329. doi: 10.4161/nucl.20439. [DOI] [PubMed] [Google Scholar]
- 25.Ellenberg J, et al. Nuclear membrane dynamics and reassembly in living cells: targeting of an inner nuclear membrane protein in interphase and mitosis. J Cell Biol. 1997;138:1193–1206. doi: 10.1083/jcb.138.6.1193. [DOI] [PMC free article] [PubMed] [Google Scholar]
- 26.Soullam B, Worman HJ. The amino-terminal domain of the lamin B receptor is a nuclear envelope targeting signal. J Cell Biol. 1993;120:1093–1100. doi: 10.1083/jcb.120.5.1093. [DOI] [PMC free article] [PubMed] [Google Scholar]
- 27.Hinshaw JE, Carragher BO, Milligan RA. Architecture and design of the nuclear pore complex. Cell. 1992;69:1133–1141. doi: 10.1016/0092-8674(92)90635-p. [DOI] [PubMed] [Google Scholar]
- 28.Beck M, Lucić V, Förster F, Baumeister W, Medalia O. Snapshots of nuclear pore complexes in action captured by cryo-electron tomography. Nature. 2007;449:611–615. doi: 10.1038/nature06170. [DOI] [PubMed] [Google Scholar]
- 29.Nakamura N. The Role of the Transmembrane RING Finger Proteins in Cellular and Organelle Function. Membranes. 2011;1:354–393. doi: 10.3390/membranes1040354. [DOI] [PMC free article] [PubMed] [Google Scholar]
Online-only References
- 30.Janke C, et al. A versatile toolbox for PCR-based tagging of yeast genes: new fluorescent proteins, more markers and promoter substitution cassettes. Yeast. 2004;21:947–962. doi: 10.1002/yea.1142. [DOI] [PubMed] [Google Scholar]
- 31.Andréasson C, Ljungdahl PO. The N-terminal regulatory domain of Stp1p is modular and, fused to an artificial transcription factor, confers full Ssy1p-Ptr3p-Ssy5p sensor control. Mol Cell Biol. 2004;24:7503–7513. doi: 10.1128/MCB.24.17.7503-7513.2004. [DOI] [PMC free article] [PubMed] [Google Scholar]
- 32.Becuwe M, et al. A molecular switch on an arrestin-like protein relays glucose signaling to transporter endocytosis. J Cell Biol. 2012;196:247–259. doi: 10.1083/jcb.201109113. [DOI] [PMC free article] [PubMed] [Google Scholar]
- 33.Léon S, Erpapazoglou Z, Haguenauer-Tsapis R. Ear1p and Ssh4p are new adaptors of the ubiquitin ligase Rsp5p for cargo ubiquitylation and sorting at multivesicular bodies. Mol Biol Cell. 2008;19:2379–2388. doi: 10.1091/mbc.E08-01-0068. [DOI] [PMC free article] [PubMed] [Google Scholar]
- 34.Shyu YJ, Liu H, Deng X, Hu C. Identification of new fluorescent protein fragments for biomolecular fluorescence complementation analysis under physiological conditions. Biotechniques. 2006;40:61. doi: 10.2144/000112036. [DOI] [PubMed] [Google Scholar]
- 35.Sommer T, Jentsch S. A protein translocation defect linked to ubiquitin conjugation at the endoplasmic reticulum. Nature. 1993;365:176–179. doi: 10.1038/365176a0. [DOI] [PubMed] [Google Scholar]
- 36.Metzger MB, et al. A Structurally Unique E2-Binding Domain Activates Ubiquitination by the ERAD E2, Ubc7p, through Multiple Mechanisms. Mol Cell. 2013;50:516–527. doi: 10.1016/j.molcel.2013.04.004. [DOI] [PMC free article] [PubMed] [Google Scholar]
- 37.Sheff MA, Thorn KS. Optimized cassettes for fluorescent protein tagging in Saccharomyces cerevisiae. Yeast. 2004;21:661–670. doi: 10.1002/yea.1130. [DOI] [PubMed] [Google Scholar]
- 38.Laporte D, Salin B, Daignan-Fornier B, Sagot I. Reversible cytoplasmic localization of the proteasome in quiescent yeast cells. J Cell Biol. 2008;181:737–745. doi: 10.1083/jcb.200711154. [DOI] [PMC free article] [PubMed] [Google Scholar]
- 39.Schneider CA, Rasband WS, Eliceiri KW. NIH Image to ImageJ: 25 years of image analysis. Nature Methods. 2012;9:671–675. doi: 10.1038/nmeth.2089. [DOI] [PMC free article] [PubMed] [Google Scholar]
- 40.Knop M, et al. Epitope tagging of yeast genes using a PCR-based strategy: more tags and improved practical routines. Yeast. 1999;15:963–972. doi: 10.1002/(SICI)1097-0061(199907)15:10B<963::AID-YEA399>3.0.CO;2-W. [DOI] [PubMed] [Google Scholar]
- 41.Winzeler EA, et al. Functional characterization of the S. cerevisiae genome by gene deletion and parallel analysis. Science. 1999;285:901–906. doi: 10.1126/science.285.5429.901. [DOI] [PubMed] [Google Scholar]
- 42.Khmelinskii A, Knop M. Analysis of protein dynamics with tandem fluorescent protein timers. Methods Mol Biol. 2014;1174:195–210. doi: 10.1007/978-1-4939-0944-5_13. [DOI] [PubMed] [Google Scholar]
Associated Data
This section collects any data citations, data availability statements, or supplementary materials included in this article.