

Abstract
Affinity purification combined with tandem mass spectrometry (AP-MS/MS) is a well-established method used to discover interaction partners for a given protein of interest. Because most AP-MS/MS approaches are performed using the soluble fraction of whole cell extracts (WCE), information about the cellular compartments where the interactions occur is lost. More importantly, classical AP-MS/MS often fails to identify interactions that take place in the nonsoluble fraction of the cell, for example, on the chromatin or membranes; consequently, protein complexes that are less soluble are underrepresented. In this paper, we introduce a method called multiple cell compartment AP-MS/MS (MCC-AP-MS/MS), which identifies the interactions of a protein independently in three fractions of the cell: the cytoplasm, the nucleoplasm, and the chromatin. We show that this fractionation improves the sensitivity of the method when compared to the classical affinity purification procedure using soluble WCE while keeping a very high specificity. Using three proteins known to localize in various cell compartments as baits, the CDK9 subunit of transcription elongation factor P-TEFb, the RNA polymerase II (RNAP II)-associated protein 4 (RPAP4), and the largest subunit of RNAP II, POLR2A, we show that MCC-AP-MS/MS reproducibly yields fraction-specific interactions. Finally, we demonstrate that this improvement in sensitivity leads to the discovery of novel interactions of RNAP II carboxyl-terminal domain (CTD) interacting domain (CID) proteins with POLR2A.
Keywords: affinity purification, protein–protein interaction, mass spectrometry, bioinformatics, transcription factors, cytoplasm, nucleoplasm, CID proteins, RNA polymerase II CTD, chromatin
INTRODUCTION
Large-scale mapping of human protein–protein interactions (PPIs) not only leads to the discovery of new protein functions, but also to a better understanding of several biological processes. Medium to high throughput PPI detection approaches are essential for comprehensive network mapping. These include the yeast-two-hybrid (Y2H) method,1,2 the protein-fragment complementation assay (PCA)3 and the affinity purification coupled with tandem mass spectrometry (AP-MS/MS).4–9 Of those, AP-MS/MS has a number of advantages. First, this method accurately detects entire complexes when tagging only one protein (bait).10 PPIs obtained through AP-MS/MS can be direct or indirect interactions resulting from a cocomplex bait–prey association. Second, it can be used in any organism or cell type of interest. Finally, since it does not use a heterogeneous host, post-translational modifications necessary for a given interaction to take place may occur normally in the cell where the tagged protein is expressed.
Classical AP-MS/MS experiments, performed using whole cell extracts, purify proteins present in the soluble fraction of the cell,5–7 which includes the cytoplasm and the nucleoplasm, but not proteins tightly bound to chromatin or membranes. Consequently, this approach yields no information about the exact compartment where detected interactions are taking place. Over the years, some purification approaches have been proposed to circumvent this limitation. Techniques have been developed to target interactions of membrane proteins.11 These are based on sonication and sedimentation of membranes through differential centrifugation followed by solubilization of membrane proteins.11 Recently, approaches to identify interactions for chromatin-bound proteins have been developed, 12 including the modified chromatin immunopurification (mChIP) method that purifies protein–DNA macromolecules in yeast through mild sonication in order to minimize chromatin fragment precipitation.13 Another way to solubilize chromatin makes use of nucleases. Foltz et al. used affinity purification on soluble small DNA fragments digested with a micrococcal nuclease,14 while Du et al. used DNase I, digesting DNA completely.15 Lambert et al. addressed the impact of chromatin fragment size on affinity purification. They have shown that larger DNA fragments will favor indirect protein interactions,13 thereby complicating the interpretation of the results. Thus, the method of Du et al., with its complete DNA digestion, seems to be the best approach to minimize indirect protein interactions through DNA. However, they used the FLAG affinity purification technique,15 which may be more sensitive to detect transient interactions, but can also lead to more nonspecific interactions when compared to tandem affinity purification (TAP), because of the number of purifications performed (i.e., a single affinity purification step for FLAG as opposed to two for TAP16). Although these methods have their respective advantages and disadvantages, there is a need for a method detecting PPIs occurring on the chromatin, while yielding as few as possible indirect interactions through DNA and protein contaminants.
Accurate identification of the cellular compartment(s) where an interaction takes place is often critical to understand the function of that interaction. This information can also be crucial for the experimentalist as it can guide validation experiments and speed up discovery. For instance, we recently established a role of the RNA polymerase II (RNAP II)-Associated Protein 3 and 4 (RPAP3 and RPAP4) in assembly and nuclear import of the RNAP II enzyme.17 Because the study was initiated on the basis of AP-MS/MS data from soluble WCE, educated guesswork followed by laborious experimental work was required to characterize the role of these two proteins. As we will show, the technique introduced here localizes the interactions between RPAP3/RPAP4 and RNAP II to the cytoplasm and nucleoplasm, which would have immediately suggested a putative role in some cytoplasmic functions such as RNAP II assembly and/or nuclear import. Similarly, discovering interactions taking place on chromatin could quickly direct hypotheses to a DNA binding role for the PPIs in question.
We therefore propose a new approach to map and localize PPIs in a more comprehensive manner. The method, called multiple cell compartment affinity purification combined with tandem mass spectrometry (MCC-AP-MS/MS), can detect PPIs independently, from the same starting material, through TAP in three different cell compartments: in the cytoplasm, the nucleoplasm and on the chromatin based on several centrifugations and a complete digestion of DNA. We show that separating a typical WCE into these three fractions yields crucial information about the detected interactions, as well as an increase in sensitivity through fractionation of the sample. We show that MCC-AP-MS/MS identifies fraction-specific PPIs and, increases the sensitivity over WCE AP-MS/MS, while keeping high specificity and reproducibility. Moreover, we report the discovery of novel, compartment-specific, potentially biologically relevant PPIs for POLR2A.
EXPERIMENTAL PROCEDURES
We propose an approach for performing independent AP-MS/MS on three different cell compartments: cytoplasm, nucleoplasm, and resolubilized chromatin. The method then distinguishes bait specific interactions from contamination with a new version of our Decontaminator software.18 In this section, we describe the MCC-AP-MS/MS methodology and its associated computational component. Figure 1 summarizes the steps of the procedure.
Figure 1.

Pipeline of MCC-AP-MS/MS and its associated computational methods.
Cytoplasmic, Nuclear and Chromatin fractions
ORFs encoding human POLR2A, CDK9, PPARG2, RPAP4, KLF14, FTO, IRS1, RPAP2, RPAP3, and JAZF1, were cloned into the mammalian expression vector pMZI19 containing the protein A-Calmodulin Binding Peptide tag at the 3′ end of the MCS in order to generate a fusion protein with a TAP tag at its C-terminus.10 EcR-293 (Invitrogen) inducible stable cell lines carrying these constructs were produced as previously described20 and selected clones were grown to obtain 2 g of cell pellet. To generate the cytoplasmic, nucleoplasmic and the chromatin fraction, WCE was prepared as previously described21 with some modifications. Cells were lysed by mechanical homogenization in lysis buffer [10 mM Tris-HCl (pH 8), 0.34 M sucrose, 3 mM CaCl2, 2 mM MgOAc, 0.1 mM EDTA, 1 mM DTT, 0.5% Nonidet P-40 and protease inhibitors]. WCE was centrifuged at 3500× g, 15 min and, the supernatant, which represents the cytoplasmic fraction, was saved. The pellet containing the nuclei was resuspended, lysed by mechanical homogenization in lysis buffer [20 mM HEPES (pH 7.9), 1.5 mM MgCl2, 150 mM KOAc, 3 mM EDTA, 10% glycerol, 1 mM DTT, 0.1% Nonidet P-40 and protease inhibitors] and, centrifuged at 15000× g, 30 min. The supernatant, which corresponds to the nucleoplasmic fraction, was saved. The chromatin pellet was then minced with a scalpel in nuclease incubation buffer [150 mM Hepes (pH 7.9), 1.5 mM MgCl2, 150 mM KOAc, 10% glycerol, and protease inhibitors] and disrupted mechanically using a glass homogenizer. Nuclease was then added and the chromatin fraction was digested overnight [0.15 unit/μL benzonase (Novagen), 0.44 unit/mL RNase A and 6.25 units/mL DNaseI]. Cytoplasmic and nucleoplasmic fractions were centrifuged at 124000× g and dialyzed overnight in dialysis buffer [10 mM Hepes (pH 7.9), 0.1 mM EDTA (pH 8), 0.1 mM DTT, 0.1 M KOAc and 10% glycerol]. The following day, the three fractions were clarified by centrifugation at 20000× g for 30 min, and the supernatants containing the solubilized proteins were collected.
Tandem Affinity Purification
WCE prepared from induced stable EcR-293 cell lines was subjected to purification by the TAP procedure as previously described.20 The eluates were precipitated with trichloroacetic acid and stored at −80 °C until analysis by LC–MS/MS. In parallel for some TAP experiments, part of the eluate (starting material was adjusted accordingly) were concentrated, loaded in 4–12% bis-Tris gradient PAGE, and colored by silver staining.
Protein Digestion with Trypsin
Protein extracts were then resolubilized in 10 μL of a 6 M urea buffer. Proteins were reduced by adding 2.5 μL of the reduction buffer (45 mM DTT, 100 mM ammonium bicarbonate) for 30 min at 37 °C, and then alkylated by adding 2.5 μL of the alkylation buffer (100 mM iodoacetamide, 100 mM ammonium bicarbonate) for 20 min at 24 °C in the dark. Prior to trypsin digestion, 20 μL of water was added to reduce the urea concentration to 2 M. Ten microliters of the trypsin solution (5 ng/μL of trypsin sequencing grade from Promega, 50 mM ammonium bicarbonate) was added to each sample. Protein digestion was performed at 37 °C for 18 h and stopped with 5 μL of 5% formic acid. Protein digests were dried down in vacuum centrifuge and stored at −20 °C until LC–MS/MS analysis.
LC–MS/MS
Prior to LC–MS/MS, protein digests were resolubilized under agitation for 15 min in 10 μL of 0.2% formic acid. Desalting/cleanup of the digests was performed using C18 ZipTip pipet tips (Millipore, Billerica, MA). Eluates were dried down in vacuum centrifuge and then resolubilized under agitation for 15 min in 10 μL of 2% ACN/1% formic acid. The LC column was a C18 reversed phase column packed with a high-pressure packing cell. A 75 μm i.d. Self-Pack PicoFrit fused silica capillary column (New Objective, Woburn, MA) of 15 cm long was packed with the C18 Jupiter 5 μm 300 Å reverse-phase material (Phenomenex, Torrance, CA). This column was installed on the Easy-nLC II system (Proxeon Biosystems, Odense, Denmark) and coupled to the LTQ Orbitrap Velos (ThermoFisher Scientific, Bremen, Germany) equipped with a Proxeon nanoelectrospray ion source. The buffers used for chromatography were 0.2% formic acid (buffer A) and 100% acetonitrile/0.2% formic acid (buffer B). During the first 12 min, 5 μL of sample were loaded on the column to a flow rate of 600 nL/min and, subsequently, the gradient went from 2–80% buffer B in 110 min at a flow rate of 250 nL/min and then came back to 600 nL/min and 2% buffer B for 10 min. LC–MS/MS data acquisition was accomplished using a eleven scan event cycle comprised of a full scan MS for scan event 1 acquired in the Orbitrap. The mass resolution for MS was set to 60000 (at m/z 400) and used to trigger the ten additional MS/MS events acquired in parallel in the linear ion trap for the top ten most intense ions. Mass over charge ratio range was from 380 to 2000 for MS scanning with a target value of 1 000 000 charges and from ~1/3 of parent m/z ratio to 2000 for MS/MS scanning with a target value of 10000 charges. The data dependent scan events used a maximum ion fill time of 100 ms and 1 microscan. Target ions already selected for MS/MS were dynamically excluded for 25 s. Nanospray and S-lens voltages were set to 0.9–1.8 kV and 50 V, respectively. Capillary temperature was set to 250 °C. MS/MS conditions were: normalized collision energy, 35 V; activation q, 0.25; activation time, 10 ms.
Protein Identification
Protein database searching was performed with Mascot 2.2 (Matrix Science) against the human NCBInr protein database. The mass tolerances for precursor and fragment ions were set to 15 ppm and 0.6 Da, respectively. Trypsin was used as the enzyme allowing for up to 2 mis-cleavages. Carbamidomethylation of cysteine residues was set as a fixed modification and oxidation of methionine was allowed as a variable modification.
Dilution Experiments and Tandem Mass Spectrometry
Due to the increasing sensitivity of mass spectrometers, and the fairly low complexity of typical AP-MS/MS or even less complex MCC-AP-MS/MS experiments, the amount of protein digests injected in the mass spectrometer is now a concern. If a too large amount is injected in the LC–MS/MS system, peptide saturation is likely to occur. This could cause very abundant proteins to mask less abundant ones. When saturation happens, the mass spectrometer sampling frequency is not sufficiently fast to analyze the entirety of the sample, therefore causing a great variability between replicated experiments. We therefore tested sample dilution to ensure accurate modeling of the contaminants present with a reasonable number of controls. Dilution experiments aimed at verifying saturation of the LC–MS/MS system were performed by analyzing 6 different dilutions of a protein solution, (1/2, 1/4, 1/8, 1/16, 1/32, 1/64). Upon visual inspection of the results, the highest volume yielding no saturation was chosen and used for all LC–MS/MS runs. 1/2 of the eluates obtained from the chromatin and cytoplasmic fractions were used for LC–MS/MS, while the entirety of the nucloplasmic eluate was kept.
Data Set
A total of 15 MCC-AP-MS/MS experiments have been performed with the following baits: POLR2A (×2), CDK9 (×2), RPAP4 (×2), PPARG2 (×2) KLF14 (×2), FTO, IRS1, RPAP2, RPAP3, and JAZF1, where (×2) signifies that the experiment has been done in two biological replicates. A set of 9 MCC-AP-MS/MS experiments of empty expression vector pMZI were performed as controls (Supplementary Table 1, Supporting Information). Three of them were excluded from the main training set since they showed an unexpectedly high variance in both the set of observed proteins and their abundance.
COMPUTATIONAL ANALYSIS
Many tools have been proposed to identify high quality PPIs in AP-MS/MS data.8,22–24 We elected to use a modified version of our Decontaminator software18 to calculate the False Discovery Rate (FDR) for each individual bait-prey interaction. The existing version of Decontaminator required matched induced and noninduced expression vector AP-MS/MS experiments for its training procedure. We generalized the implementation of Decontaminator so that any number of empty pMZI vector controls can be used. The only requirement is that both controls and experiments are performed under the same conditions and that the number of high quality controls is sufficient (at least 3, but 6 were used in our case) to model the contaminants.
Control Training Set
To improve the modeling of contaminants and thus the specificity of our approach, a number of modifications were made to the Decontaminator algorithm. Previously, each interaction was assigned a p-value based on the Mascot score25 obtained by the prey in the pull-down compared to those obtained for the same protein in control experiments performed under the same conditions (in our case, the same cellular fraction). Because the set of controls available is sometimes relatively small, a second set of controls is also considered, which consists of the union of the controls obtained for each of the three fractions, including the controls with very large variance mentioned previously. A second p-value is then computed based on this larger set of controls. The final p-value reported is the largest of the fraction-specific p-value and the pooled p-value. This approach has the advantage of accurately modeling contaminants that are not fraction-specific (based on a large set of pooled controls), while allowing those that are fraction-specific to also be identified. This approach maximizes the specificity of the predictions by making the best use of all available control experiments. Although this may in theory be at the cost of a loss of sensitivity, this loss seems to be negligible in our data set (data not shown).
FDR Estimation
For the purpose of estimating FDRs for each cellular fraction, we used a set of selected baits that are known to be localized to (at least) that fraction, based on the Gene Ontology26 (Cellular Component GO terms: cytoplasm, nucleus (used as a proxy for chromatin), and nucleoplasm). GO electronic annotations were disregarded, except in the case of the cytoplasm cellular component where too few curated annotations were available. This process ensures an automatic unbiased selection of the baits used to compute the FDRs in each cell fraction. The baits selected for the FDR estimation of the chromatin fraction were: CDK9 (×2), POLR2A (×2), PPARG2 (×2), FTO, and IRS1. Those chosen for the nucleoplasmic fraction were: POLR2A (×2), CDK9 (×2), and PPARG2 (×2). Finally, the experiments selected for the cytoplasmic fraction were: RPAP4 (×2), CDK9 (×2), PPARG2 (×2) and IRS1.
Implementation and Availability
The proposed computational methods are implemented in a platform independent Java program (Decontaminator). Given a set of control MCC-AP-MS/MS experiments, Decontaminator assigns FDRs to all interactions in all cell fractions according to the methods described previously. Of note, Mascot scores can in principle be interchanged by any other mass spectrometry derived confidence scores (i.e., Spectral counts, SEQUEST Xcorr,27 Peptide counts). Also, since the FDR calculation is performed independently for each p-value, it is possible that the function mapping p-values to FDRs is not monotonic. This was addressed by setting the FDR associated to a given p-value p to the minimum between its calculated FDR and the minimal FDR of all p-values larger than p. Decontaminator is available for download at www.cs.mcgill.ca/~blanchem/MCC_Decontaminator.
RESULTS
Cell Compartment Specific Interactions
We started by assessing the ability of the MCC-AP-MS/MS method to reliably identify interactions that are specific to each cell compartment. In order to do so, we used three proteins with relatively well studied interactions as baits: (i) POLR2A, a subunit of RNAP II, expected to be present in all three cell compartments, but mainly in the chromatin fraction,5,28,29 (ii) CDK9, a mainly nucleoplasmic cyclin-dependent kinase that is a subunit of the positive transcription elongation factor P-TEFb, involved in transcription with potential additional localization to the cytoplasm and the chromatin,30,31 and (iii) RPAP4, a mainly cytoplasmic protein involved in the nuclear import of RNAP II, through a mechanism that involves RPAP4 shuttling between the nucleus and the cytoplasm, implying its transit in the nucleoplasm.5 Interaction partners were identified using the MCC-AP-MS/MS experimental/computational pipeline for each bait in each of the three fractions, in biological duplicates (Supplementary Table 2, Supporting Information). For comparison, interactions were also detected using soluble WCE to identify interactions taking place in the soluble fraction. Figure 2 shows SDS gels of affinity purifications using a soluble WCE, a cytoplasmic fraction, a nucleoplasmic fraction, a chromatin fraction, and their associated controls for all three baits. Visual inspection revealed dramatic differences in the band distribution across the different fractions for any given bait. For instance, the chromatin fraction for RPAP4 is poorly populated when compared to its cytoplasmic and nucleoplasmic counterparts, as expected based on the literature.5 As for CDK9 and POLR2A, it can be seen that each fraction, excluding the WCE, has at least one exclusive band, which is not observed in its control. These gels clearly demonstrate that different interaction partners can be identified in each fraction.
Figure 2.

Precast acrylamide 4–12% gels of eluates from MCC-AP-MS/MS and AP-MS/MS using RPAP4, CDK9 and POLR2A. WCE, whole-cell extract; CYT, cytoplasm; NUP, nucleoplasm; CHR, chromatin. Arrowheads point to bands corresponding to the baits. Full arrows indicate examples of exclusive bands in the various fractions for each bait.
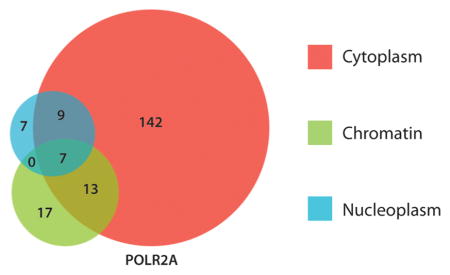
To further evaluate these differences, we compared the set of high confidence PPIs found in each fraction for RPAP4, POLR2A and CDK9. Figure 3 shows the overlap between the sets of high confidence partners identified in each fraction (at least one replicate with FDR < 10%). Due to an increased sensitivity in the cytoplasmic fraction (see below), the number of interactors identified in this particular fraction exceeds that of the other two fractions (see Discussion). However, as expected, of the three baits, POLR2A has a larger number of interactors in the chromatin fraction (37), as compared to nonchromatin associated CDK9 and RPAP4 (12 and 8 interactors, respectively). To further confirm the fraction specificity of our approach, we analyzed interactions that are well documented and whose localization has been characterized. Most of the RNAP II subunits were found in the chromatin, but also in the cytoplasmic and nucleoplasmic fractions (Supplementary Table 3, Supporting Information). This is in agreement with the transcriptional function of RNAP II, but also with the findings revealing POLR2A interactions with other RNAP II subunits in the cytoplasm.5,32 Also, for example, 18 of the 26 subunits of the mediator complex were found to interact with POLR2A in the chromatin fraction, but almost none were seen in the other two fractions. This is consistent with the previously documented role of the mediator complex.33 Finally, POLR2A interaction partners RPAP3, PIH1D1, UXT and WDR92, all members of the RPAP3/R2TP/PFDL complex, were found to be exclusive to the cytoplasmic fraction and, by the same mean, to match previous results showing that RPAP3 is involved in the assembly/nuclear import of RNAP II.5,17
Figure 3.
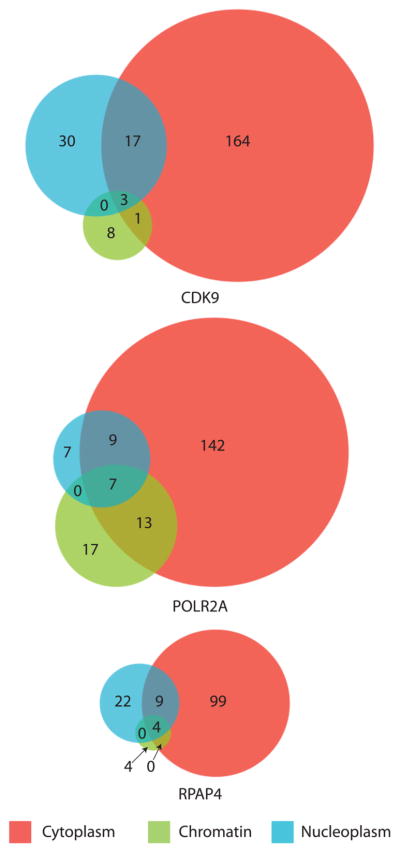
Number of preys obtained in each cell compartment (FDR < 10% in at least one of the duplicates) for each bait (CDK9, POLR2A, and RPAP4).
On the other hand, the mainly nucleoplasmic protein CDK9 has a large number of interactors in the nucleoplasmic fraction (50). This is significantly more than what is observed for the mainly chromatin-bound POLR2A (23) and slightly more than nucleoplasm-cytoplasm shuttling RPAP4 (35). As for POLR2A, our results are in agreement with the literature for the bait CDK9 (Supplementary Table 4, Supporting Information), which interacts with BRD4, a positive regulator of the P-TEFb complex, with high confidence on chromatin,34,35 but not in the nucleoplasm and cytoplasm. CDK9 is also found to interact with very high confidence with HEXIM1 and HEXIM2, LARP7 and MEPCE in the nucleoplasmic and cytoplasmic fractions, but not in the chromatin fraction. These proteins are known to interact with P-TEFb and the 7SK snRNA to inhibit P-TEFb function, therefore supporting our observations.7,36 Even though some interactors of RPAP4 are not well characterized proteins, our findings that RPAP4 interacts with RNAP II subunits in the cytoplasm and nucleoplasm, as well as with RPAP3 in the cytoplasm (Supplementary Table 2, Supporting Information), are in agreement with our previous results showing that RPAP4 plays a role in the nuclear import of RNAP II.5
To confirm that the preys discovered by MCC-AP-MS/MS were indeed specific to the fraction in which they were identified, we considered the set of all high-confidence preys identified for at least one bait in a given cellular fraction and calculated the proportion of those proteins that are known to be localized to a certain GO cellular compartment (Figure 4). High-confidence interactors (FDR < 10%) identified by MCC-AP-MS/MS in the chromatin fractions are indeed generally annotated as being localized to the nucleus. Similarly, the interactors obtained in the nucleoplasmic fraction are annotated as nuclear, but to a lesser extent (Figure 4A). The results for the nucleoplasm cellular compartment were very similar to those of the nucleus (data not shown). Finally, those identified in the cytoplasmic fraction are often annotated as such (Figure 4B). On the other hand, interactors found in the cytoplasmic fractions are much more rarely localized to the nucleus according to GO, but much more often in the cytoplasm than those identified in the two noncytoplasmic fractions. Interestingly, the fraction of proteins obtained by MCC-AP-MS/MS of the nucleoplasmic fraction that are annotated to be cytoplasmic is also always higher than for the chromatin fraction at the same FDR threshold, suggesting that multiple proteins present in the nucleoplasm are shuttling to the cytoplasm. It is expected that an important portion of the nucleoplasmic proteins are related to the import or export of proteins to the nucleus. Shuttling of protein is also a major way to regulate the activity of a protein in time and space and the outcome of signaling pathway activation. Also, as the FDR thresholds are allowed to increase, the level of false-positives becomes higher, resulting in the drop of enrichments to background level.
Figure 4.

Proportion of the set of preys identified for the 15 baits in each cellular fraction (chromatin, cytoplasm, and nucleus) that are annotated with a GO cellular component term (A) “Nucleus” and (B) “Cytoplasm”. Because “Chromatin” is a poorly populated cellular localization annotation in GO, “Nucleus” was used as a surrogate. The unexpectedly large proportion of preys from the cytoplasmic fractions with a “Nucleus” GO cellular component is caused by the important number of POLR2A interactions that take place in both the nucleus and the cytoplasm. Similarly, the sudden decrease of the proportion for all compartments at low FDRs for the GO term “Cytoplasm” can be explained again by the large number of POLR2A interactions that take place in both the nucleus and the cytoplasm, but for which the preys are not annotated to be localized in the cytoplasm in GO.
MCC-AP-MS/MS is Reproducible
An important aspect of a PPI detection approach is its reproducibility. We analyzed biological replicates of MCC-AP-MS/MS for all three baits (POLR2A, CDK9 and RPAP4) (Table 1). We define an interaction as being strictly reproduced if it obtained a FDR below 10% in both replicates, and partially reproduced if it obtained a FDR below 10% in one replicate and below 20% in the other. A prey that obtains FDRs above 10% in both replicates is considered a likely contaminant. The data show very high levels of reproducibility for POLR2A, especially in the chromatin fraction (92%). However, when a bait is not localized to the fraction under consideration (e.g., RPAP4 in the chromatin fraction (43%)), we generally detected a smaller number of interactions, that tend to be less reproducible. We also observed that reproducibility is generally lower for the nucleoplasmic fraction. Fewer proteins were identified in general in that fraction for all three baits when compared to the other fractions (Supplementary Table 5, Supporting Information). In addition, the abundances of the nucleoplasmic proteins were also lower than those of the proteins identified in the other cell fractions, as indicated by the peptide counts (Supplementary Table 5). This hints toward the fact that the nucleoplasmic fraction may contain less material, which may therefore affect mass spectrometry detectability of the proteins contained in it, ultimately leading to a reduced reproducibility.
Table 1.
Reproducibility Results between Duplicate MCC-AP-MS/MS Experiments of POLR2A, CDK9 and RPAP4a
| Fraction | POLR2A
|
CDK9
|
RPAP4
|
||||||
|---|---|---|---|---|---|---|---|---|---|
| chromatin | cytoplasm | nucleoplasm | chromatin | cytoplasm | nucleoplasm | chromatin | cytoplasm | nucleoplasm | |
| Strictly Reproduced Interactions | 21 | 69 | 6 | 5 | 42 | 9 | 1 | 43 | 7 |
| Partially Reproduced Interactions | 13 | 28 | 3 | 1 | 16 | 2 | 2 | 11 | 2 |
| Non Reproduced Interactions | 3 | 74 | 14 | 6 | 127 | 39 | 4 | 58 | 26 |
| Reproduced Contaminants Detected | 2057 | 2274 | 1901 | 3142 | 2722 | 2165 | 1802 | 2271 | 1684 |
| Fraction of Very High Confidence Interactions Strictly Reproduced | 0.57 | 0.40 | 0.26 | 0.42 | 0.23 | 0.18 | 0.14 | 0.38 | 0.20 |
| Fraction of Very High Confidence Interactions Partially Reproduced | 0.92 | 0.57 | 0.39 | 0.50 | 0.31 | 0.22 | 0.43 | 0.48 | 0.26 |
Results are shown for the resolubilized chromatin, cytoplasmic and nucleoplasmic fractions.
MCC-AP-MS/MS Has Greater Interactome Coverage than Whole Cell Extract AP-MS/MS
Having established the specificity and reproducibility of our method, we compared the sensitivity of the classic AP-MS/MS (based on WCE) and MCC-AP-MS/MS approaches under the same experimental conditions (see Experimental Procedures). Figure 5 shows that the vast majority of the high confidence interactions obtained through AP-MS/MS are also recovered by MCC-AP-MS/MS. To ensure that very high confidence interactions were being compared, only proteins found in each replicate of both protocols were used to produce this figure. Indeed, if one were to perform AP-MS/MS after MCC-AP-MS/MS, it would only yield an increase in the number of interactors by 9% for POLR2A, 20% for CDK9, and 10% for RPAP4. Conversely, MCC-AP-MS/MS yields a 180–335% increase in the number of interactions detected when compared to AP-MS/MS alone. This gain in sensitivity is in part due to the separation of the sample into three fractions, which improves the sensitivity of MS/MS protein identification for each of the three fractions. In AP-MS/MS using WCE, low abundance PPIs localized to the nucleoplasm are likely to be masked by higher abundance cytoplasmic interactions. By separating samples in three different fractions, sample complexity is reduced, which improves the performance of the mass spectrometer, much the same way as sample fractionation through gel or liquid chromatography improves classical AP-MS/MS sensitivity. Remarkably, the set of 28 interactions detected by both AP-MS/MS and MCC-AP-MS/MS were all found in (at least) the cytoplasmic fraction by MCC-AP-MS/MS, suggesting that AP-MS/MS based on WCE is largely confined to identifying cytoplasmic interactions.
Figure 5.
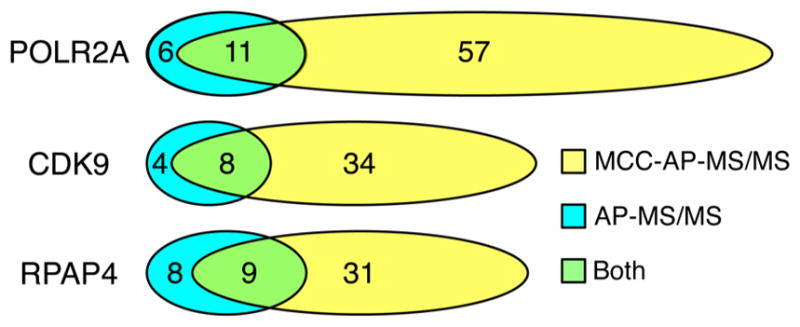
Number of interacting partners found in both replicated experiments of MCC-AP-MS/MS (FDR < 10%) and AP-MS/MS (FDR < 20%) for each bait (POLR2A, CDK9 and RPAP4). We allowed a higher FDR threshold for AP-MS/MS derived interactions to match previous studies.17 This only advantages AP-MS/MS over MCC-AP-MS/MS in this comparison.
To further test the sensitivity of MCC-AP-MS/MS, we calculated the recall values for each of the three baits against human protein–protein interactions deposited in the BioGRID database (Release 3.1.93)37 that were obtained through affinity capture methods coupled to mass spectrometry (Figure 6). For each bait, MCC-AP-MS/MS obtains significantly higher recall values than AP-MS/MS at any FDR threshold, therefore showing that MCC-AP-MS/MS not only detects more PPIs than AP-MS/MS, but also that these PPIs were found independently by other laboratories. We also measured the recall of both methods using the top X preys for each bait ranked by their FDRs, for a varying value of X (Figure 6). MCC-AP-MS/MS shows an improvement in recall over AP-MS/MS for any value of X for both POLR2A and RPAP4, and comparable recall for CDK9. The latter observation may suggest that the AP-MS/MS FDRs for this bait may have been overestimated. Interestingly, recall values of MCC-AP-MS/MS for all three proteins keep increasing with the FDR threshold, reaching almost 1.0 at a very high FDR threshold. This shows that MCC-AP-MS/MS has the potential for excellent sensitivity, and that the current limitations are at the level of the experimental and computational filtering of contaminants, and mass spectrometry detectability.
Figure 6.

Recall values of MCC-AP-MS/MS and AP-MS/MS for varying FDR thresholds and number of top preys (ranked by their FDRs) against human PPIs listed in BioGRID that were obtained through affinity capture coupled to mass spectrometry. Recall values were calculated by taking the union of the preys identified in each bait replicated experiment. When a prey was detected in both replicates, its smallest FDR was used.
MCC-AP-MS/MS Improved Sensitivity Leads to Discovery of New Protein–Protein Interactions
The increased sensitivity of MCC-AP-MS/MS and its ability to detect fraction-specific interactions allow it to discover new potentially biologically important interactions and hint at the mechanisms/processes they may be involved in. Here, we discuss one such example. Among the interactors of POLR2A in the chromatin fraction are 5 proteins with RNAP II carboxyl-terminal domain (CTD) interacting domains (CID): RPRD1A, RPRD1B, RPRD2, PCF11 and SCAF4 (Table 2). Ni and colleagues recently reported the discovery of the interaction of the first three with RNAP II through AP-MS/MS in HEK293 cells,38 but interactions with PCF11 and SCAF4 were not detected. PCF11 was computationally predicted to interact with POLR2A,39 but this interaction like the one involving SCAF4, had not been detected in vivo. Strikingly, the 3 proteins that were identified in both the Ni et al. study and our own study were observed in the cytoplasmic fraction of MCC-AP-MS/MS. However, all 5 proteins were found with high or very high confidence in the chromatin fraction, with PCF11 and SCAF4 only being detected in this fraction. This may explain why Ni et al. could not identify PCF11 and SCAF4 as interactors of RNAP II. A classic AP-MS/MS could potentially simply not reach this space of the interactome for POLR2A.
Table 2.
CID Proteins Found in Union of the MCC-AP-MS/MS Experiments of POLR2Aa
| Prey | Chromatin | Cytoplasm | Reported by Ni et al. |
|---|---|---|---|
| RPRD1A | 0.07 | 0.00 | Yes |
| RPRD1B | 0.00 | 0.00 | Yes |
| RPRD2 | 0.00 | 0.37 | Yes |
| PCF11 | 0.00 | N/O | No |
| SCAF4 | 0.12 | N/O | No |
Minimum FDR scores of the preys obtained in the two chromatin and cytoplasmic fraction experiments are color-coded.
DISCUSSION AND CONCLUSION
Over the years, the AP-MS/MS methodology has proven to be successful at discovering interaction partners for a large number of proteins.4–9 To date, large-scale AP-MS/MS-based PPI mapping efforts used the soluble fraction of the cell, limiting the discovery and interpretation of compartment-specific interactions. We introduce here the multiple cell compartment AP-MS/MS (MCC-AP-MS/MS) experimental/computation pipeline to detect interactions occurring in the cytoplasmic, the nucleoplasmic or the chromatin fraction, while using the same starting material. To minimize the number of contaminants and indirect interactions that may occur through DNA binding for the chromatin fraction, we performed a complete DNA digestion combined with tandem affinity purification. We have shown that MCC-AP-MS/MS generates a significant gain in sensitivity over classical AP-MS/MS, identifies compartment-specific interactions, and is reproducible. As an illustration, we demonstrated that MCC-AP-MS/MS reveals novel interactions for POLR2A, despite the fact that interactions for this protein have been intensively analyzed in the past.7,38,40–42
The type of compartment-specific assays performed by MCC-AP-MS/MS would be impossible to perform in the context of a Y2H system due to the nature of the protocol. PCA techniques could potentially be modified to localize interactions, but this would not be scalable to a large-scale study. Therefore, to our knowledge, MCC-AP-MS/MS is the first PPI mapping technique that can both accurately map interactions and specify their localization in the cell. Given the fact that cell fractionation always leads to some cross-contamination of the fractions, which is estimated to be minimal according to our Western blotting analysis (see Supplementary Figure S1, Supporting Information), MCC-AP-MS/MS cannot be used to decisively conclude on the presence or absence of an interaction (or interactor) in any given compartment. However, as described above, MCC-AP-MS/MS presents major advantages as compared to classical AP-MS/MS. When larger scale MCC-AP-MS/MS PPI mapping data become available, the development of computational approaches predicting protein complex components in different cell fractions will be possible.
Another aspect of our results deserves further discussion. One might be surprised by the fact that a bait such as POLR2A detects more interactors in the cytoplasmic than the chromatin fraction. However, a number of recent studies revealed the complexity of the cellular machinery required for the assembly and nuclear import of RNAP II.5,17,43,44 This machinery comprises several proteins that interact with the RNAP II subunits in the cytoplasm. It is therefore not surprising that an important number of high confidence cytoplasmic partners are identified. Moreover, most newly synthesized proteins are in one way or another present in the cytoplasm where they critically interact with proteins such as chaperones, transporters, inhibitors or activators.
Knowing in which compartment an interaction is occurring deconvolutes the complex PPI networks produced by AP-MS/MS and provides useful information on the context in which it is taking place. We believe that methods such as MCC-AP-MS/MS will significantly change the sensitivity and interpretability of future protein–protein interactions network mapping efforts.
Supplementary Material
Acknowledgments
We are grateful to the members of our laboratories for helpful discussions and comments. This work is supported by grants from the Canadian Institutes for Health Research (CIHR) and Fonds de la recherche en santé du Québec (FRSQ). M.L.A. holds a studentship from NSERC.
Footnotes
Notes
The authors declare no competing financial interest.
Supplementary tables and figures. This material is available free of charge via the Internet at http://pubs.acs.org.
References
- 1.Ito T, et al. A comprehensive two-hybrid analysis to explore the yeast protein interactome. Proc Natl Acad Sci US A. 2001;98:4569–4574. doi: 10.1073/pnas.061034498. [DOI] [PMC free article] [PubMed] [Google Scholar]
- 2.Walhout AJ, Vidal M. High-throughput yeast two-hybrid assays for large-scale protein interaction mapping. Methods. 2001;24:297–306. doi: 10.1006/meth.2001.1190. [DOI] [PubMed] [Google Scholar]
- 3.Remy I, Michnick SW. A highly sensitive protein-protein interaction assay based on Gaussia luciferase. Nat Methods. 2006;3:977–979. doi: 10.1038/nmeth979. [DOI] [PubMed] [Google Scholar]
- 4.Krogan NJ, et al. Global landscape of protein complexes in the yeast Saccharomyces cerevisiae. Nature. 2006;440:637–643. doi: 10.1038/nature04670. [DOI] [PubMed] [Google Scholar]
- 5.Forget D, et al. The protein interaction network of the human transcription machinery reveals a role for the conserved GTPase RPAP4/GPN1 and microtubule assembly in nuclear import and biogenesis of RNA polymerase II. Mol Cell Proteomics. 2010;9:2827–2839. doi: 10.1074/mcp.M110.003616. [DOI] [PMC free article] [PubMed] [Google Scholar]
- 6.Washburn MP, Wolters D, Yates JR., 3rd Large-scale analysis of the yeast proteome by multidimensional protein identification technology. Nat Biotechnol. 2001;19:242–247. doi: 10.1038/85686. [DOI] [PubMed] [Google Scholar]
- 7.Jeronimo C, et al. Systematic analysis of the protein interaction network for the human transcription machinery reveals the identity of the 7SK capping enzyme. Mol Cell. 2007;27:262–274. doi: 10.1016/j.molcel.2007.06.027. [DOI] [PMC free article] [PubMed] [Google Scholar]
- 8.Breitkreutz A, et al. A global protein kinase and phosphatase interaction network in yeast. Science. 2010;328:1043–1046. doi: 10.1126/science.1176495. [DOI] [PMC free article] [PubMed] [Google Scholar]
- 9.Gavin AC, et al. Proteome survey reveals modularity of the yeast cell machinery. Nature. 2006;440:631–636. doi: 10.1038/nature04532. [DOI] [PubMed] [Google Scholar]
- 10.Rigaut G, et al. A generic protein purification method for protein complex characterization and proteome exploration. Nat Biotechnol. 1999;17:1030–1032. doi: 10.1038/13732. [DOI] [PubMed] [Google Scholar]
- 11.Pestov NB, Rydstrom J. Purification of recombinant membrane proteins tagged with calmodulin-binding domains by affinity chromatography on calmodulin-agarose: example of nicotinamide nucleotide transhydrogenase. Nat Protoc. 2007;2:198–202. doi: 10.1038/nprot.2006.456. [DOI] [PubMed] [Google Scholar]
- 12.Lambert JP, Pawson T, Gingras AC. Mapping physical interactions within chromatin by proteomic approaches. Proteomics. 2012;12:1609–1622. doi: 10.1002/pmic.201100547. [DOI] [PubMed] [Google Scholar]
- 13.Lambert JP, Mitchell L, Rudner A, Baetz K, Figeys D. A novel proteomics approach for the discovery of chromatin-associated protein networks. Mol Cell Proteomics. 2009;8:870–882. doi: 10.1074/mcp.M800447-MCP200. [DOI] [PMC free article] [PubMed] [Google Scholar]
- 14.Foltz DR, et al. The human CENP-A centromeric nucleosome-associated complex. Nat Cell Biol. 2006;8:458–469. doi: 10.1038/ncb1397. [DOI] [PubMed] [Google Scholar]
- 15.Du YC, et al. The dynamic alterations of H2AX complex during DNA repair detected by a proteomic approach reveal the critical roles of Ca(2+)/calmodulin in the ionizing radiation-induced cell cycle arrest. Mol Cell Proteomics. 2006;5:1033–1044. doi: 10.1074/mcp.M500327-MCP200. [DOI] [PubMed] [Google Scholar]
- 16.Adelmant G, Marto JA. Protein complexes: the forest and the trees. Expert Rev Proteomics. 2009;6:5–10. doi: 10.1586/14789450.6.1.5. [DOI] [PubMed] [Google Scholar]
- 17.Cloutier P, et al. High-resolution mapping of the protein interaction network for the human transcription machinery and affinity purification of RNA polymerase II-associated complexes. Methods. 2009;48:381–386. doi: 10.1016/j.ymeth.2009.05.005. [DOI] [PMC free article] [PubMed] [Google Scholar]
- 18.Lavallee-Adam M, Cloutier P, Coulombe B, Blanchette M. Modeling contaminants in AP-MS/MS experiments. J Proteome Res. 2011;10:886–895. doi: 10.1021/pr100795z. [DOI] [PMC free article] [PubMed] [Google Scholar]
- 19.Zeghouf M, et al. Sequential Peptide Affinity (SPA) system for the identification of mammalian and bacterial protein complexes. J Proteome Res. 2004;3:463–468. doi: 10.1021/pr034084x. [DOI] [PubMed] [Google Scholar]
- 20.Jeronimo C, et al. RPAP1, a novel human RNA polymerase II-associated protein affinity purified with recombinant wild-type and mutated polymerase subunits. Mol Cell Biol. 2004;24:7043–7058. doi: 10.1128/MCB.24.16.7043-7058.2004. [DOI] [PMC free article] [PubMed] [Google Scholar]
- 21.Aygun O, Svejstrup J, Liu Y. A RECQ5-RNA polymerase II association identified by targeted proteomic analysis of human chromatin. Proc Natl Acad Sci US A. 2008;105:8580–8584. doi: 10.1073/pnas.0804424105. [DOI] [PMC free article] [PubMed] [Google Scholar]
- 22.Sardiu ME, et al. Probabilistic assembly of human protein interaction networks from label-free quantitative proteomics. Proc Natl Acad Sci US A. 2008;105:1454–1459. doi: 10.1073/pnas.0706983105. [DOI] [PMC free article] [PubMed] [Google Scholar]
- 23.Sowa ME, Bennett EJ, Gygi SP, Harper JW. Defining the human deubiquitinating enzyme interaction landscape. Cell. 2009;138:389–403. doi: 10.1016/j.cell.2009.04.042. [DOI] [PMC free article] [PubMed] [Google Scholar]
- 24.Dazard JE, Saha S, Ewing RM. ROCS: A reproducibility index and confidence score for interaction proteomics. BMC Bioinform. 2012;13:128. doi: 10.1186/1471-2105-13-128. [DOI] [PMC free article] [PubMed] [Google Scholar]
- 25.Perkins DN, Pappin DJ, Creasy DM, Cottrell JS. Probability-based protein identification by searching sequence databases using mass spectrometry data. Electrophoresis. 1999;20:3551–3567. doi: 10.1002/(SICI)1522-2683(19991201)20:18<3551::AID-ELPS3551>3.0.CO;2-2. [DOI] [PubMed] [Google Scholar]
- 26.Ashburner M, et al. Gene ontology: tool for the unification of biology. The Gene Ontology Consortium. Nat Genet. 2000;25:25–29. doi: 10.1038/75556. [DOI] [PMC free article] [PubMed] [Google Scholar]
- 27.Eng JK, McCormack AL, Yates JR., III An approach to correlate tandem mass spectral data of peptides with amino acid sequences in a protein database. J Am Soc Mass Spectrom. 1994;5:976–989. doi: 10.1016/1044-0305(94)80016-2. [DOI] [PubMed] [Google Scholar]
- 28.Kershnar E, Wu SY, Chiang CM. Immunoaffinity purification and functional characterization of human transcription factor IIH and RNA polymerase II from clonal cell lines that conditionally express epitope-tagged subunits of the multiprotein complexes. J Biol Chem. 1998;273:34444–34453. doi: 10.1074/jbc.273.51.34444. [DOI] [PubMed] [Google Scholar]
- 29.Lolli G. Binding to DNA of the RNA-polymerase II C-terminal domain allows discrimination between Cdk7 and Cdk9 phosphorylation. Nucleic Acids Res. 2009;37:1260–1268. doi: 10.1093/nar/gkn1061. [DOI] [PMC free article] [PubMed] [Google Scholar]
- 30.Liu H, Herrmann CH. Differential localization and expression of the Cdk9 42k and 55k isoforms. J Cell Physiol. 2005;203:251–260. doi: 10.1002/jcp.20224. [DOI] [PubMed] [Google Scholar]
- 31.Fu TJ, Peng J, Lee G, Price DH, Flores O. Cyclin K functions as a CDK9 regulatory subunit and participates in RNA polymerase II transcription. J Biol Chem. 1999;274:34527–34530. doi: 10.1074/jbc.274.49.34527. [DOI] [PubMed] [Google Scholar]
- 32.Nikolov DB, Burley SK. RNA polymerase II transcription initiation: a structural view. Proc Natl Acad Sci US A. 1997;94:15–22. doi: 10.1073/pnas.94.1.15. [DOI] [PMC free article] [PubMed] [Google Scholar]
- 33.Taatjes DJ. The human Mediator complex: a versatile, genome-wide regulator of transcription. Trends Biochem Sci. 2010;35:315–322. doi: 10.1016/j.tibs.2010.02.004. [DOI] [PMC free article] [PubMed] [Google Scholar]
- 34.Zhou M, et al. Bromodomain protein Brd4 regulates human immunodeficiency virus transcription through phosphorylation of CDK9 at threonine 29. J Virol. 2009;83:1036–1044. doi: 10.1128/JVI.01316-08. [DOI] [PMC free article] [PubMed] [Google Scholar]
- 35.Jang MK, et al. The bromodomain protein Brd4 is a positive regulatory component of P-TEFb and stimulates RNA polymerase II-dependent transcription. Mol Cell. 2005;19:523–534. doi: 10.1016/j.molcel.2005.06.027. [DOI] [PubMed] [Google Scholar]
- 36.Krueger BJ, et al. LARP7 is a stable component of the 7SK snRNP while P-TEFb, HEXIM1 and hnRNP A1 are reversibly associated. Nucleic Acids Res. 2008;36:2219–2229. doi: 10.1093/nar/gkn061. [DOI] [PMC free article] [PubMed] [Google Scholar]
- 37.Stark C, et al. The BioGRID Interaction Database: 2011 update. Nucleic Acids Res. 2011;39:D698–704. doi: 10.1093/nar/gkq1116. [DOI] [PMC free article] [PubMed] [Google Scholar]
- 38.Ni Z, et al. Control of the RNA polymerase II phosphorylation state in promoter regions by CTD interaction domain-containing proteins RPRD1A and RPRD1B. Transcription. 2011;2:237–242. doi: 10.4161/trns.2.5.17803. [DOI] [PMC free article] [PubMed] [Google Scholar]
- 39.McDowall MD, Scott MS, Barton GJ. PIPs: human protein-protein interaction prediction database. Nucleic Acids Res. 2009;37:D651–656. doi: 10.1093/nar/gkn870. [DOI] [PMC free article] [PubMed] [Google Scholar]
- 40.Krum SA, Miranda GA, Lin C, Lane TF. BRCA1 associates with processive RNA polymerase II. J Biol Chem. 2003;278:52012–52020. doi: 10.1074/jbc.M308418200. [DOI] [PubMed] [Google Scholar]
- 41.Acker J, et al. Interactions between the human RNA polymerase II subunits. J Biol Chem. 1997;272:16815–16821. doi: 10.1074/jbc.272.27.16815. [DOI] [PubMed] [Google Scholar]
- 42.Pan G, Aso T, Greenblatt J. Interaction of elongation factors TFIIS and elongin A with a human RNA polymerase II holoenzyme capable of promoter-specific initiation and responsive to transcriptional activators. J Biol Chem. 1997;272:24563–24571. doi: 10.1074/jbc.272.39.24563. [DOI] [PubMed] [Google Scholar]
- 43.Czeko E, Seizl M, Augsberger C, Mielke T, Cramer P. Iwr1 directs RNA polymerase II nuclear import. Mol Cell. 2011;42:261–266. doi: 10.1016/j.molcel.2011.02.033. [DOI] [PubMed] [Google Scholar]
- 44.Carre C, Shiekhattar R. Human GTPases associate with RNA polymerase II to mediate its nuclear import. Mol Cell Biol. 2011;31:3953–3962. doi: 10.1128/MCB.05442-11. [DOI] [PMC free article] [PubMed] [Google Scholar]
Associated Data
This section collects any data citations, data availability statements, or supplementary materials included in this article.