


Abstract
High-Throughput (HT) SELEX combines SELEX (Systematic Evolution of Ligands by EXponential Enrichment), a method for aptamer discovery, with massively parallel sequencing technologies. This emerging technology provides data for a global analysis of the selection process and for simultaneous discovery of a large number of candidates but currently lacks dedicated computational approaches for their analysis. To close this gap, we developed novel in-silico methods to analyze HT-SELEX data and utilized them to study the emergence of polymerase errors during HT-SELEX. Rather than considering these errors as a nuisance, we demonstrated their utility for guiding aptamer discovery. Our approach builds on two main advancements in aptamer analysis: AptaMut—a novel technique allowing for the identification of polymerase errors conferring an improved binding affinity relative to the ‘parent’ sequence and AptaCluster—an aptamer clustering algorithm which is to our best knowledge, the only currently available tool capable of efficiently clustering entire aptamer pools. We applied these methods to an HT-SELEX experiment developing aptamers against Interleukin 10 receptor alpha chain (IL-10RA) and experimentally confirmed our predictions thus validating our computational methods.
INTRODUCTION
Systematic Evolution of Ligands by EXponential Enrichment (SELEX) is an experimental technique allowing for the identification of aptamers—short (20–100 nucleotides), synthetic, single-stranded (ribo)-nucleic molecules selected to bind specifically to almost any molecular target of interest (1,2). The binding targets aimed at with SELEX vary from small organic molecules (3,4), through transcription factors (5–8) and other proteins and protein complexes (9), to viruses (10,11) and cells (12,13). Aptamers thus have potential applications in situations where so far antibodies have been deployed. Aptamers moreover have important advantages over antibodies, particularly in the development of therapeutics. Unlike antibodies, which are biologics, aptamers are chemically synthesized, can be well characterized by analytical methods, have limited toxicity and are expected to be less or non-immunogenic in the patient. Selectively engaging biological targets is of immense clinical utility; for example, almost half of all protein-therapeutics approved by the FDA since 2009 have been monoclonal antibody based (14). It is therefore not surprising that aptamers, which bring the advantages of small molecule chemistry to applications previously limited to biologics, are rapidly making inroads into many therapeutic areas. One aptamer-based therapy has been approved for clinical use (15) while at least nine more are under different stages of clinical development (16). The raising of antibodies is dependent on a biological system and is consequently a process where one has little control over specificity and affinity. Until recently, the generation of aptamers also took a black box approach where a traditional SELEX procedure iterates over four basic steps that together define one selection cycle: incubation and binding, partitioning and washing, target-bound elution and amplification (Figure 1a). The process starts with a sequence library of 107- 1015 random molecules of fixed length flanked by constant primer sites to aid amplification. At the beginning of each cycle, such an RNA/ssDNA pool is incubated with a target of interest. At the end of each cycle, lower affinity binders are removed from the solution whereas bound aptamer molecules are eluted and amplified, forming the input for the consecutive round. The aptamer molecules that persist until the final cycle are then evaluated experimentally for binding affinity and optimized for specific properties, such as size or stability, depending on the intended application. Such an approach runs the risk of either not being able to develop an aptamer to a specific target or the selection of a sub-optimal aptamer.
Figure 1.
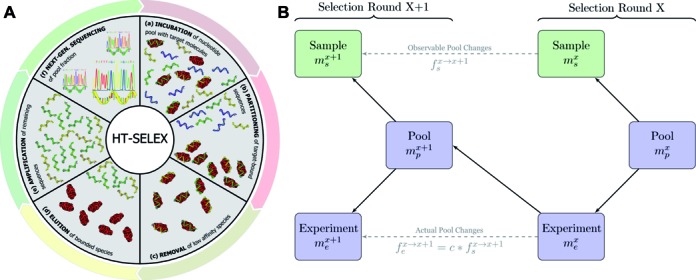
Overview of the principles of HT-SELEX. (A) Schematic of the steps defining one selection cycle (clockwise): incubation of a sequence pool with the target, binding of target affine species, partitioning of target-bound and low-affinity species, target-bound elution and amplification followed by high-throughput sequencing. (B) Visualization of the model used to estimate the significance of enrichment between the selection rounds. Here, only the sample sets (green) are observable quantities whereas the pool and experiment sets are hidden. Each selection round is partitioned into three sets denoted as pool, representing the remaining sequences after selection and amplification, sample, describing the established, sequenced portion of this pool and experiment, denoting the unknown species forming the input for the next cycle.  ,
,  and
and  , stand for the frequency of a sequence in the sets sample, experiment and pool, respectively. The enrichment of the sequence between selection cycles is defined as
  for the sample sets and as
  for the experiment sets.
Massively parallel sequencing technologies have the potential to revolutionize the SELEX protocol by allowing sequencing of entire aptamer pools (17) leading to a new protocol referred to as High-Throughput SELEX (HT-SELEX). In an HT-SELEX procedure some (or all) selection rounds are sequenced and computationally analyzed for potential binders, effectively reducing the number of required selection cycles and in turn leading to a substantial reduction of unwanted experimental effects such as polymerase chain reaction (PCR) biases, time and expense. More precisely, a sample of the aptamer pool is sequenced while another fraction serves as the input for the next cycle (Figure 1a and b). Thus, unlike the traditional SELEX approaches in which only a handful of aptamers are sequenced and analyzed after the last cycle, HT-SELEX provides data for a global analysis of the selection properties and for the simultaneous discovery of a large number of candidates. This large amount of information has utility only in conjunction with suitable computational methods to analyze the data, sort the potential aptamers and identify candidate aptamers with properties consistent with the intended application. The latter is important because besides merely binding the biological target (with the highest affinity possible) more sophisticated applications for aptamers have been envisaged. As a case in point, aptamers are being exploited as potent antithrombotics which can be actively controlled, allowing high levels of anticoagulation when needed followed by rapid or graded titration of the effect (18). Traditional SELEX is well suited to developing aptamers with high affinity but more nuanced methods are required where multiple candidates to modulate a complex biological process are needed. In this context, the importance of computational analysis has been increasingly recognized for HT-SELEX data (19–21). However, current computational methods utilized to analyze this type of data, with a notable exception of HT-SELEX based methods to uncover transcription factor binding motifs (17,22), are limited and mostly based on simple counting of aptamer species. Thus the potential of the HT-SELEX data is rarely realized and moreover often does not justify the time and expense of HT sequencing. At the same time, the development of efficient computational methods require to be informed by an improved understanding of the properties of the HT-SELEX process.
We were particularly interested in understanding the role of mutations, by which we understand nucleotide sequence errors arising at any stage of the selection experiment, including amplification, and for RNA aptamers, transcription. While the principles of mutagenesis during traditional SELEX (23–25), and as a means of post-selection optimization of binding affinity (26), have previously been described, the lack of high-throughput sequencing of entire aptamer pools posed a natural limit to the resolution of the available data and consequent analysis.
We Specifically asked: (i) is the distribution of mutants consistent with the random mutation model, and (ii) is it possible to computationally identify mutations that improve binding affinity. Our study was informed by high-throughput sequencing data from five rounds of HT-SELEX developing aptamers against the Interleukin 10 receptor alpha chain (IL-10RA). IL-10 is considered to be a master regulator of immunity to infection and is an important therapeutic molecular target (27). To address the first question, we utilized our new clustering algorithm, AptaCluster, which is, to the best of our knowledge, the only currently available tool capable of efficiently clustering entire aptamer pools of more than 20 Million unique sequences. In addition, we derived a mathematical estimator of the expected number of aptamers that originated from the initial pool as opposed to those arising by a mutation and that are above a specific similarity threshold with respect to an aptamer of interest. We used this estimator together with the AptaCluster method to obtain families of aptamer sequences related to each other by mutations. Interestingly, we found that similar to a number of phenomena in life and social sciences, the distribution of aptamers in these families follows a scale-free distribution (28). We obtained the same distribution using an in-silico aptamer evolution program, AptaSim, which we have developed. We discuss the practical implications of these findings for predicting binding affinity.
To address the second question, we developed AptaMut—a method to identify mutations that improve binding affinity. AptaMut identified several such mutations and we have confirmed these predictions experimentally. Furthermore, we discovered that in one particular cluster, mutations conferring the biggest change in the binding affinity stabilized a specific hairpin.
Our results demonstrate that new computational methods cannot only aid the elucidation of under-appreciated properties of the SELEX procedure but can ultimately lead to uncovering new practical predictive methods and aptamers of desired binding affinity. Therefore, aiming at providing comprehensive HT-SELEX data-analysis software, we developed a full software package called AptaTools, that contains, in addition to the AptaCluster and AptaMut algorithms, numerous additional useful tools for data preprocessing, tracking the changes of aptamer families throughout selection cycles, computing cycle-to-cycle enrichment and secondary structure prediction.
Taken together, we demonstrated that HT-SELEX data sets contain previously untapped information and provided methods for their utilization. We expect that these new methods along with our complete AptaTools package will become indispensable for guiding aptamer selection and for uncovering additional general properties of the selection process, hence jointly contributing to a better utilization of HT-SELEX results.
MATERIALS AND METHODS
The AptaCluster algorithm
The relevance of clustering of individual species into families in HT-SELEX data is increasingly recognized, prompting the need for developing approaches that can take advantage of high-throughput sequencing data. Current algorithms are mainly based on ad-hoc counting techniques (17) or adaptations of traditional, all-vs-all clustering schemes using a variety of similarity functions such as the Levenshtein distance (29,30) or k-mer counting (22) (see (31) for a recent survey). While these methods can be optimized to cope with moderately large data sizes (∼ 1 Mio unique sequences), they become computationally intractable when applied to higher resolution experiments due to their non-linear scaling properties.
In contrast, AptaCluster is an algorithm to efficiently cluster aptamer pools of over 20 Million unique items and its preliminary version was reported in (32). Below we provide a high level description of the approach and a performance analysis. Technical details related to the method are specified in Supplementary Note 1 online.
As is routinely done for aptamer analysis, identical aptamers are first counted and represented jointly by their common sequence and their frequency. The key novelty of AptaCluster is that to circumvent performing all-by-all comparison used in standard clustering methods, which would be computationally prohibitive for this data size, we developed a two-stage approach where in the first step we apply the concept of Locality Sensitive Hashing (LSH) (33) to identify all pairs of aptamers with an evidence of possible similarity (Figure 2a). The remaining pairs are expected to be unrelated. In the second step, the distances between pairs with an evidence of possible similarity are evaluated precisely. This is now possible, since this set is relatively small. The distances in the complement set are arbitrarily assumed to be infinity.
Figure 2.
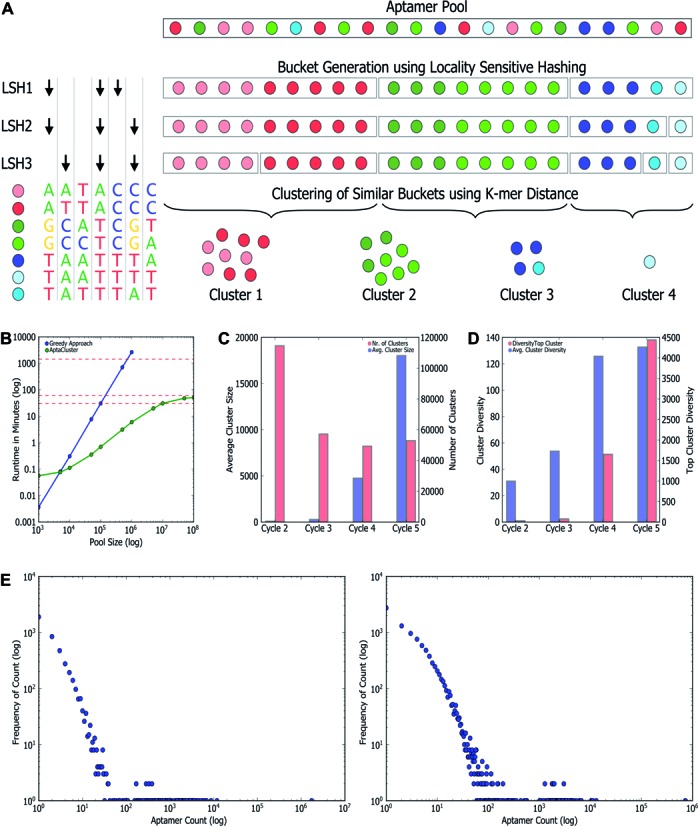
The AptaCluster algorithm, its validation and performance. (A) Algorithmic approach of AptaCluster. Each colored sphere represents a distinct sequence in the pool while similar colors stand for related sequences. To better illustrate the concept, we included identical sequences (in the actual implementation identical aptamers are represented by their sequence and corresponding count). AptaCluster iteratively partitions the pool into sets of potentially similar sequences using the concept of locality sensitive hashing. In each iteration, an input to a hash function is generated by sampling a user-defined number of nucleotide positions (black arrows). Similar sets (e.g. red buckets) from the different iterations are then combined such that sequences below a certain threshold are grouped together forming the desired clusters. (B) Runtime (wall clock) analysis of AptaCluster (green) and a greedy approach (blue) for pool sizes varying between 1000 sequences and 100 million (Mio) sequences. Horizontal red lines depict runtimes of 30 min, 60 min and 24 h, respectively. (C) Average cluster size (blue) and the number of clusters (red) reported by AptaCluster for each of the sequenced pools. (D) Average (blue) and top (red) cluster diversity for each selection round as measured by the number of unique sequences per cluster. (E) Scale free nature of the cluster composition. Shown are the distribution of aptamer frequencies as a function of their counts on the example of the top clusters from the IL-10 selection (left) and the simulated data (right) produced by AptaSim.
To efficiently identify pairs with a potential to be similar, we are considering aptamer sequences as n-dimensional vectors, where n is the length of the randomized region. Then, following the LSH protocol, we perform a randomized dimensionality reduction step and use the reduced representation as input to a hash function. Iterating this step ensures that it is unlikely that two similar sequences never produce the same hash value and thus will be falsely considered as unrelated.
Having partitioned the selection pool into pairs with an evidence of possible similarity and dissimilar pairs we then cluster the first set by repeatedly choosing the highest frequency sequence not assigned to any cluster and designating it as the seed of the new cluster. We then use a k-mer based similarity function (34) to compute the distance of the selected seed to all other sequences found as possibly similar and include each such sequence in the cluster if its k-mer distance to the seed is smaller than a user-defined cutoff.
It is theoretically possible that two relatively similar sequences will never obtain the same hash value during the iterative similarity detection step and thus their distance will be incorrectly set to ‘infinity’. The probability of such failure to detect similarity dependents on the number of LSH iterations.
The AptaMut algorithm
AptaMut aims at extracting potential affinity altering mutants based on the difference in cycle-to-cycle enrichment of the mutant relative to the enrichment of the parent sequence. To provide a formal framework, we developed a generative model mirroring the experimental design of the HT-SELEX protocol. Our model takes into account the fact that at each cycle, the sequenced aptamers only represent a fraction of the true pool size (Figure 1b).
Specifically, for each selection round, we differentiate between three sets: (i) the pool, representing the sequences obtained by selection and amplification, (ii) the sample, containing the observed (sequenced) portion of this pool and (iii) the experiment, consisting of the unobserved portion of the pool forming the input for the next cycle. Furthermore, we let  ,
,  and
and  be the frequency of a mutant in the sets sample, experiment and pool, respectively. For the sample sets, we define the observed enrichment of the parent of the mutant between selection cycles as
  . Finally, let
  refer to the probability of simultaneously observing
  mutants in sample set X and
  in sample set
  assuming the actual enrichment to be
  .
.
Our model then aims at comparing the probability of observing frequencies  ,
,  in sample sets X, X+1 of a mutant with the probability of observing the optimal frequency,
  , for the initial frequency
  and enrichment
  . Accounting for the fact that the actual enrichment is subject to stochastic variations resulting from experimental noise, we define a score
  of a mutant as:
 |
In the equation above, we model the enrichment as a continuous random variable f that follows normal distribution  . The estimation for P is based on the assumption that the sequenced aptamers in each cycle only represent a fraction of the true pool size and that the process of selecting these sequences from the pool can be described in terms of Bernoulli experiments.
Note that a log of this score near zero indicates a neutral mutant while significantly positive (respectively negative) log scores indicate a possibility of beneficial (respectively detrimental) mutants. A comprehensive description of the approach is detailed in Supplementary Note 4 online.
HT-SELEX experimental setup
Selection details
A DNA template for the selection library was ordered from IDT (Coralville, IA). 1 nM of each N40 template (5′-TCTCGATCTCAGCGAGTCGTCG-N40-CCCATCCCTCTTCCTCTC TCCC-3′) and 5′ primer (5′-GGGGGAATTCTAATACGACTCACTATAGGGAGAGAGGAAGAGG GATGGG-3′) were annealed together, extended with Taq polymerase (Life Science) and transcribed in vitro using Durascribe (in-vitro transcription) IVT kit (Illumina). The random R0 RNA was purified by denaturing PAGE and, after preclearing with human IgG-coated (Sigma) beads (GE Healthcare), used for in-vitro selection. 1 nM of R0 RNA was used in a first round of selection to coincubate with 0.3 nM of bead-bound human IL-10RA-Fc fusion protein (Novus Biologicals) in 100 mM NaCl selection buffer. After washes, a recovered bound RNA fraction was reverse transcribed using the cloned AMV RT kit (Life Science). cDNA was amplified by either emulsion or open PCR using Platinum Taq PCR kit (Life Science) as described below. The DNA template was used to IVT RNA for the next round. During subsequent rounds, amount of protein was reduced 25\% each time, while concentration of NaCl was gradually increased to 150 mM.
Emulsion PCR
cDNA was amplified using Platinum Taq PCR kit with addition of 10% PCRx enhancer solution and following primers: 5′-GGGGGAATTCTAATACGACTCACTATAGGGAG AGAGGAAGAGGG ATGGG-3′ and 5′-TCTCGATCTCAGCGAGTCGTCG-3′. After preparing the master mix PCR reaction solution, it was separated to 100 μL aliquots and each aliquot was mixed with 600 μL ice-cold oil fraction assembled from components supplied with emulsion PCR kit (EURx) according to manufacturer's instructions. Water and oil mixture was emulsified by 5′ vortexing at +4C and amplified in standard PCR machine for 25 cycles. Control open PCR reaction was carried with aqueous phase only for 16 cycles.
Preparing libraries for high-throughput sequencing
After four rounds of selection, 3 nM of RNA was prepared for round 5. The RNA was pre-cleared using IgG-coated beads and separated into three identical aliquots. Each aliquot was incubated with either human IL10RA protein, murine IL10RA protein or human IgG. After standard washes, bound RNA fraction was extracted from beads and reverse transcribed as described previously. A cDNA generated from round 5 bound fractions, as well as RNA recovered from bound fractions at rounds 2, 3 and 4, was amplified by emulsion PCR with two sets of primers as described previously (9). Amplified DNA was purified by 2% agarose gel electrophoresis and sequenced using Illumina's HiSeq 2500 device with 100-cycle paired-end sequencing protocol.
Binding assays details
In vitro measurements of affinities of the candidate aptamers to their respected targets were performed using double filter binding assay (35). In vitro transcribed and PAGE-purified RNAs were dephosphorylated with CIAP (New England Biolabs) and radiolabeled with PNK (New England Biolabs) using 32gamma-ATP (Perkin Elmer). Radiolabeled aptamer RNAs were incubated individually with a range of concentrations of target or control proteins at 37C in the binding buffer. Complex formation was determined by passing the mixture through stacked nitrocellulose and NYLon membranes (Whatman) with subsequent measurement of the radioactivity retained on nitrocellulose (bound RNA fraction) and NYLon (unbound fraction) using phosphoimager screen (Kodak) and Typhoon instrument (Amersham bioscience). Kds were calculated as concentrations of the protein required to retain half of the RNA in the RNA:protein complex.
RESULTS
Our results combine the development of dedicated computational methods and insights into the HT-SELEX process gained using these methods. On the methodological side, we developed AptaTools as a general software suite to analyze HT-SELEX that includes AptaGUI—a graphical user interface for data visualization, tools for data preprocessing, clustering the aptamer pools, tracking the changes in aptamer families over selection cycles, computing cycle-to-cycle enrichment for individual sequences and sequence families and secondary structure prediction. Alongside we report the results of the effort to identify aptamers targeting IL-10RA that was supported by our computational methods, as well as general insights into the selection process obtained with these analyses.
The AptaCluster algorithm, its validation and performance
We tested the accuracy and the reproducibility of our approach with respect to the distance computations using data from our IL-10RA experiment. Specifically, we used the 20 top clusters reported by AptaCluster and determined the k-mer distances of all the cluster seeds to all other aptamers in the pool for different values of LSH iterations. We then calculated the false negatives rate (FNR) where a sequence pair considered a false negative refers to a sequence which has a distance to the seed below the specified clustering threshold but was assigned an ‘infinity’ value. We found an on average overly low false negative rate varying between 10−6 and 10−4 (Supplementary Figure S1).
Finally, to appreciate the advantages of our approach, we have compared its performance to a member of the general class of ( computational time) clustering algorithms. We implemented a sample algorithm in this class which considers aptamers in decreasing order of their counts, computes their distance to all other aptamers in the pool and assigns the aptamer to the seeds cluster if the distance is below a user-defined threshold. While our approach can handle over 100 million sequences in a little more than 1 h, this naive approach is unable to handle 1 million items within one day (Figure 2b) on identical hardware.
Identification and analysis of families of sequences related to each other by mutagenesis
The errors during the amplification step of the SELEX procedure can introduce new sequences into the selection pool. Importantly, the sequences that are selected for and thus appear in higher copy numbers in the selection pools are most likely to produce mutants. Since the randomized region is typically relatively long, the coverage of a randomized pool of 107–1015 initial sequences is sparse and such mutants might help to provide additional sampling of the sequence space around the sequences that are selected for. To better understand the initial sequence diversity, we started by estimating the expected number sequences with at least K% sequence identity in an initial pool of M random molecules and with a randomized region of length n. This number is given by
 |
which, as formally shown in Supplementary Note 2, decreases exponentially with n and where 1/k is the percent divergence, that is K = 1–1/k (see Supplementary Figure S2).
Based on this formula, we set the clustering parameters (see Supplementary Note 1) such that, with high probability, all cluster members are obtained as a result of polymerase errors from a common ‘founder sequence’—the seed of the cluster. We confirmed that these putative mutants were indeed absent from early pools (Supplementary Table S1). In addition, tracing the clusters over several selection rounds, we observed that not only the number of clusters decreases while the average number of the sequences per cluster increases, but also the variability of the sequences within the clusters increases, consistent with mutagenesis based cluster evolution (Figure 2c and d). Importantly, similar to many evolutionary processes (28), the aptamer counts in each cluster followed approximately a scale-free distribution (Figure 2e). To confirm that this distribution is indeed expected, we developed AptaSim—a simulator of HT-SELEX that includes error-prone amplification. In order to accurately represent the initial randomized pool in terms of base composition and dependencies within consecutive nucleotides, both possible technology-dependent artifacts, we used a first order Markov Model (MM) trained with all aptamers from the earliest sequenced IL10 round. Additional design details of AptaSim are provided in Supplementary Note 3 online. The results obtained with AptaSim confirmed that the distribution of sequences related to a given ‘seed sequence’ by mutations is consistent with distribution within the sequence families obtained with AptaCluster (Figure 2e).
AptaMut—combining cycle-to-cycle enrichment with a probabilistic model to identify binding-improving mutations
We note that some of the mutated sequences might be better binders than the sequence they are derived from. Such sequences would not only provide additional candidates for further in-vitro testing and refinement, but also reveal crucial information about the relevance of the nucleotide position as a function of binding affinity. However, due to the late introduction to the pool, their count is low excluding the use of an aptamer sequence's frequency as a predictor of their binding affinity. Since aptamers with advantageous binding properties are expected to be selected in consecutive SELEX rounds at a higher rate as compared to less affine species, one can therefore use cycle-to-cycle enrichment to predict the relative ordering of aptamers with respect to binding strength (36–38). We tested the utility of cycle-to-cycle enrichment of aptamer frequencies, i.e. their relative increase in multiplicity, as a predictor of binding affinity and found it to be a better predictor than the simple aptamer count (Figure 3a and b). Specifically, we experimentally tested 30 sequences for binding including the most frequent aptamers from our IL-10RA experiment of cycle 5 and a number of arbitrarily selected sequences with lower number frequency. All sequences tested originated from the initial pool. For these sequences, we measured the dissociation constant Kd in nano Mol (nM). We found that sorting by cycle-to-cycle enrichment for the last selection cycle produces a sophisticated partition between binders and non-binders as compared to sorting by aptamer frequency (Figure 3a and b).
Figure 3.
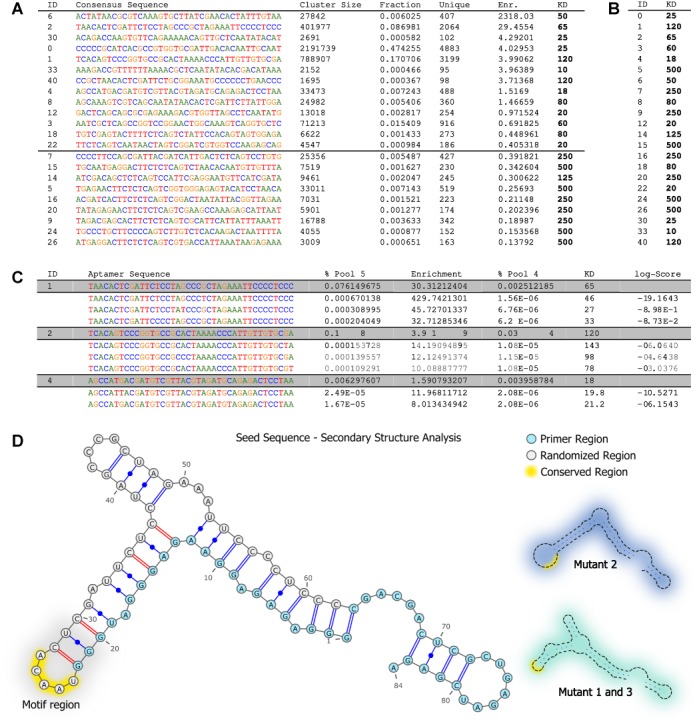
Cycle-to-cycle enrichment analysis and AptaMut results. (A and B) Cycle-to-cycle enrichment as a superior predictor for binding affinity and mutant analysis results. Top 20 clusters reported by AptaCluster sorted by their enrichment from cycle 4–5. Shown are the cluster identification (ID), consensus sequence, cluster size in round 5 (Cluster Size), the percentage of a cluster with respect the remaining pool (pool fraction), the cluster diversity (Unique), cycle-to-cycle enrichment and the Kd values of the most frequent aptamer. Cycle-to-cycle enrichment successfully partitions the clusters into binders and non-binders. The black line at 125 nM indicates the threshold used to visually separate strong binders from weak binders. In contrast, panel (b) depicts the same aptamer families if sorted by cluster size only which cannot discriminate between target-affine binders and non-binders. (C) Selection of mutants belonging to three clusters of interest reported by AptaMut and tested for binding affinity (Kd). The last column displays the log score of the mutants’ enrichment with respect to the seed sequence (grayed rows). All but one mutant show higher binding affinities compared to their parent sequence. (D) Structural analysis of the mutants of seed with ID 1 showing a conserved hairpin (indicated in yellow). The hairpin showed significantly less mutations in the set of top beneficial mutants compared to the mutation rates in the set of degenerative mutants. Structures were predicted using MFold (39) with standard parameters. Alternative structures induced by nucleotide substitutions are highlighted in blue and aquamarine, respectively. The mutant with the highest improvement in binding affinity (Mutant 2) correlates with the most stable stem loop.
Having confirmed the utility of cycle-to-cycle enrichment as a predictor of binding affinity, it might be tempting to apply this strategy to mutants as well. However the implicit assumption of the cycle-to-cycle enrichment strategy is that the fraction of the pool that is used for sequencing is a good representative of the fraction that is used as the input for the next cycle. This is a reasonable assumption for abundant sequences but can be incorrect for the less frequent mutants whose count in the sequenced pool is strongly affected by stochastic variations during pool partitioning and PCR amplification. Therefore, we developed an approach that directly models the fact that at each cycle, the sequenced aptamers represent a fraction of the true pool size. Specifically, assuming that the partition into sequenced and experiment pool follows a Bernoulli process, we can compute the probability of observing a given number of sequence copies in the sequenced pools under the assumption of a particular enrichment value. After appropriate normalization, we obtain a score reflecting the likelihood of observing the counts of a mutant in consecutive cycles relative to the expected counts under the assumption of having the same enrichment as the parent sequence. In this model, a log of this score near zero indicates a neutral mutant while significantly positive (respectively negative) log scores indicate a possibility of beneficial (respectively detrimental) mutants. Note that all scores are computed relative to the parent sequence, and it is possible that a sequence with a detrimental mutation shows cycle-to-cycle enrichment. The mathematical details of the test are provided in the Supplementary Note 4 online.
AptaMut—experimental and computational validation
We used AptaMut to identify favorable mutants from three representative clusters identified by AptaCluster of selection cycle 5 and whose binding affinities of their seed sequences had been determined to represent strong (Kd = 27 nM), intermediate (Kd = 65 nM) and weak target (Kd = 120 nM) binding. We scored these mutants by their significance of enrichment, and experimentally tested a total of eight candidates for their binding affinity. All but one mutant showed either comparable Kd values or an increased binding affinity with respect to their parent sequence (up to 3-fold when starting with a seed with intermediate Kd value). Interestingly, mutants from the strongest target-binding seed did not show improvement whereas significant better binders could be found in the two remaining categories (Figure 3c) suggesting that the sequence with intermediate Kd value was easiest to improve upon.
We noted that cluster 1 contained several mutants that were experimentally confirmed to improve binding affinity. Therefore we asked if these mutants collectively provide insight into the mechanism behind this improvement and if the analysis of mutants allows for the identification of the binding motifs approximate location. To see if this might be the case, we predicted the secondary structures of the seed and potentially beneficial mutants using MFold (39), selected based on having a log-score of less than −0.5 (30 in total), as well as the secondary structures of mutants with the highest depletion rate at the same cutoff (top degenerative mutants, 10 in total). We identified a hairpin loop that showed significantly less mutations in the set of beneficial mutants as compared to the set of degenerative mutants (p-value = 0.025, Fisher exact test) suggesting its importance for binding (Figure 3d). Interestingly some of the predicted beneficial mutations, including one experimentally confirmed to improve binding affinity (Mutant 2), were found to induce a conformational change in the structure while still exposing the conserved loop region. Coincidentally, the mutant with the highest change in affinity (Mutant 1 − Kd = 27 nM) was also predicted to contain the most stable stem loop region. In addition, a global search for the hairpin loop in all sequenced pools (supported by the pattern search option implemented within AptaTools) uncovered this motif in unstructured regions in at least two additional aptamer families which also showed cycle-to-cycle enrichment but with smaller values as compared to cluster 1. A detailed list of all analyzed mutants can be found in Supplementary Table S2.
We performed a similar analysis for Cluster 2 identifying a total of 46 mutants with log-score smaller than −0.5 for each, the beneficial and degenerative sets, respectively (see Supplementary Table S3). Out of the three putatively beneficial mutants that we have experimentally tested for binding, two confirmed our prediction of increased affinity to the target as compared to the seed sequence. In this case, manual analysis did not reveal any clearly conserved single stranded regions or other striking properties that would by eye distinguish beneficial and degenerative mutants. This prompted us to use additional computational analysis to confirm the consistency of our predictions. Interestingly, more than half (24/46) of the sequences belonging to the degenerative set had two mutations per sequence, allowing us to construct a phylogenetic tree using PAUP* (40). Our null hypothesis was that if our predictions were random, the positive and negative sets would be arbitrarily mixed in the tree's braches. This however was not what observed. Rather, except for the subtree containing the false negative experimentally tested for binding affinity, the beneficial and degenerative mutants formed separated branches in the tree (see Supplementary Figure S3). This clustering of mutants, either of the positive set or the negative set to the same evolutionary branches, validated that AptaMuts scoring assignment is consistent with aptamer evolution and not a random pattern.
DISCUSSION
In this study we focused on the evolution of sequences in the context of an HT-SELEX experiment. HT SELEX can generate billions of data points, and a full utilization of these data calls for advanced computational analyses. However even the key step in data analysis—clustering the complete aptamer pool based on sequence similarity—could not be performed in reasonable time (up to two days for one million sequences) using classical clustering algorithms. Our new AptaCluster algorithm which we developed breaks this barrier and allows for efficient clustering of entire selection pools in only hours.
The analysis of the sequence landscape has to start from an understanding of the properties of the initial pool. If all possible sequences were present in the pool and no polymerase errors or any type of biases occurred, we would expect that consecutive iterations of the SELEX procedure will converge to optimal binders (Figure 4a). However, contrary to these theoretical predictions, and consistent with other reports (41,42) we found the most frequent aptamers are not necessarily the best binders. It is important to appreciate that if the randomized sequence region is relatively long, then the initial pool covers the universe of all possible sequences very sparsely. We provided a general formula that allows an estimate of how sparse the sampling is. This observation has two consequences. First, in the initial cycles, the process of partitioning into the pool that is sequenced and the pool that goes to the next cycle is expected to be very noisy and this noise is amplified in subsequent cycles. Therefore cycle-to-cycle enrichment, which is independent on the starting point but rather captures the enrichment of already abundant sequences, would be a better predictor of binding propensity than the current norm of using absolute counts. We provided an experimental proof-of-concept for this hypothesis (Figure 3a). The second consequence of the scarcity is that it is rather unlikely that any given sequence from the initial pool is ‘optimal’ with respect to binding no matter how frequent it is (Figure 4b). Instead, they merely mark the sequence neighborhood where the good binders might be. Incidentally, polymerase errors can help to explore these neighborhoods (Figure 4c). Thus it is important to be able to predict which mutated sequences are likely to improve the binding.
Figure 4.
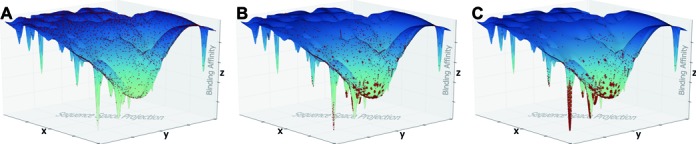
Visualization of an aptamer landscape at different rounds of selection. Red points on the plane represent individual aptamers and their distance to each other indicates their similarity. The z-axis corresponds to the binding affinity to the target. (A) The pool composition at the initial state of SELEX. Sequences in the initial pool are a uniform but scarce sample from all 4n possible species. (B) As the selection progresses, non-binders (high z-values) are competed out of the pool, whereas target-affine species (low z-values) are amplified, introducing mutants into the pool that explore the topological neighborhood around their parent sequence. (C) Landscape at the final round of selection, showing the final aptamer families as the result of repeated selection and error-prone amplification.
Our AptaMut procedure is designed, and experimentally and computationally validated, to serve this purpose. The consequences of identifying such beneficial mutations go beyond identifying a better binder. We have demonstrated that the analysis of these mutants can help to identify important features related to binding, such as structural stability or sequence properties. Such subtleties are critical to many increasingly sophisticated applications for aptamers. Currently there are no methods, either experimental or computational, that address such requirements. Thus, with proper computational tools, polymerase errors can be leveraged to increase sampling density around the most important points of the sequence landscape and to provide valuable information about sequence properties that are important for binding.
AptaMut and AptaCluster are implemented as a part of our user-friendly software suite AptaTools that we continue to develop to fully exploit the scientific and technological potential of HT-SELEX.
AVAILABILITY
http://www.ncbi.nlm.nih.gov/CBBresearch/Przytycka/index.cgi#aptatools.
SUPPLEMENTARY DATA
Supplementary Data are available at NAR Online.
FUNDING
Intramural Research Program of the National Institutes of Health, National Library of Medicine [J.H., P.D., T.M.P., in part]; Laboratory of Hemostasis and the Center for Biologics Evaluation and Research, Food and Drug Administration's Chief Scientist Challenge Grant [Z.E.S., in part]; Dodson estate and the Sylvester Comprehensive Cancer Center, Medical School, University of Miami [A.B., E.G., in part]. Funding for open access charge: National Institutes of Health. The funders had no role in study design, data collection and analysis, decision to publish or preparation of the manuscript. The findings and conclusions in this article have not been formally disseminated by the Food and Drug Administration and should not be construed to represent any Agency determination or policy.
Conflict of interest statement. None declared.
REFERENCES
- 1.Ellington A.D., Szostak J.W. In vitro selection of RNA molecules that bind specific ligands. Nature. 1990;346:818–822. doi: 10.1038/346818a0. [DOI] [PubMed] [Google Scholar]
- 2.Tuerk C., Gold L. Systematic evolution of ligands by exponential enrichment: RNA ligands to bacteriophage T4 DNA polymerase. Science. 1990;249:505–510. doi: 10.1126/science.2200121. [DOI] [PubMed] [Google Scholar]
- 3.Baker B.R., Lai R.Y., Wood M.S., Doctor E.H., Heeger A.J., Plaxco K.W. An electronic, aptamer-based small-molecule sensor for the rapid, label-free detection of cocaine in adulterated samples and biological fluids. J. Am. Chem. Soc. 2006;128:3138–3139. doi: 10.1021/ja056957p. [DOI] [PubMed] [Google Scholar]
- 4.Zuo X., Xiao Y., Plaxco K.W. High specificity, electrochemical sandwich assays based on single aptamer sequences and suitable for the direct detection of small-molecule targets in blood and other complex matrices. J. Am. Chem. Soc. 2009;131:6944–6945. doi: 10.1021/ja901315w. [DOI] [PMC free article] [PubMed] [Google Scholar]
- 5.Riley T.R., Slattery M., Abe N., Rastogi C., Liu D., Mann R.S., Bussemaker H.J. SELEX-seq: A Method for Characterizing the Complete Repertoire of Binding Site Preferences for Transcription Factor Complexes. Methods Mol. Biol. 2014;1196:255–278. doi: 10.1007/978-1-4939-1242-1_16. [DOI] [PMC free article] [PubMed] [Google Scholar]
- 6.Ishihama A., Kori A., Koshio E., Yamada K., Maeda H., Shimada T., Makinoshima H., Iwata A., Fujita N. Intracellular concentrations of 65 species of transcription factors with known regulatory functions in Escherichia coli. J. Bacteriol. 2014;196:2718–2727. doi: 10.1128/JB.01579-14. [DOI] [PMC free article] [PubMed] [Google Scholar]
- 7.Kurata T., Katayama A., Hiramatsu M., Kiguchi Y., Takeuchi M., Watanabe T., Ogasawara H., Ishihama A., Yamamoto K. Identification of the set of genes, including nonannotated morA, under the direct control of ModE in Escherichia coli. J. Bacteriol. 2013;195:4496–4505. doi: 10.1128/JB.00304-13. [DOI] [PMC free article] [PubMed] [Google Scholar]
- 8.Rivera-Cancel G., Motta-Mena L.B., Gardner K.H. Identification of natural and artificial DNA substrates for light-activated LOV-HTH transcription factor EL222. Biochemistry. 2012;51:10024–10034. doi: 10.1021/bi301306t. [DOI] [PMC free article] [PubMed] [Google Scholar]
- 9.Berezhnoy A., Stewart C.A., McNamara J.O. 2nd, Thiel W., Giangrande P., Trinchieri G., Gilboa E. Isolation and optimization of murine IL-10 receptor blocking oligonucleotide aptamers using high-throughput sequencing. Mol. Ther. 2012;20:1242–1250. doi: 10.1038/mt.2012.18. [DOI] [PMC free article] [PubMed] [Google Scholar]
- 10.Binning J.M., Wang T., Luthra P., Shabman R.S., Borek D.M., Liu G., Xu W., Leung D.W., Basler C.F., Amarasinghe G.K. Development of RNA aptamers targeting Ebola virus VP35. Biochemistry. 2013;52:8406–8419. doi: 10.1021/bi400704d. [DOI] [PMC free article] [PubMed] [Google Scholar]
- 11.Park J.-W., Jin Lee S., Choi E.-J., Kim J., Song J.-Y., Bock Gu M. An ultra-sensitive detection of a whole virus using dual aptamers developed by immobilization-free screening. Biosens. Bioelectron. 2014;51:324–329. doi: 10.1016/j.bios.2013.07.052. [DOI] [PubMed] [Google Scholar]
- 12.Shi H., Cui W., He X., Guo Q., Wang K., Ye X., Tang J. Whole cell-SELEX aptamers for highly specific fluorescence molecular imaging of carcinomas in vivo. PloS One. 2013;8:e70476. doi: 10.1371/journal.pone.0070476. [DOI] [PMC free article] [PubMed] [Google Scholar]
- 13.Cerchia L., Hamm J., Libri D., Tavitian B., de Franciscis V. Nucleic acid aptamers in cancer medicine. FEBS Lett. 2002;528:12–16. doi: 10.1016/s0014-5793(02)03275-1. [DOI] [PubMed] [Google Scholar]
- 14.Kariolis M.S., Kapur S., Cochran J.R. Beyond antibodies: using biological principles to guide the development of next-generation protein therapeutics. Curr. Opin. Biotechnol. 2013;24:1072–1077. doi: 10.1016/j.copbio.2013.03.017. [DOI] [PubMed] [Google Scholar]
- 15.Gragoudas E.S., Adamis A.P., Cunningham E.T. Jr, Feinsod M., Guyer D.R., VEGF Inhibition Study in Ocular Neovascularization Clinical Trial Group Pegaptanib for neovascular age-related macular degeneration. N. Engl. J. Med. 2004;351:2805–2816. doi: 10.1056/NEJMoa042760. [DOI] [PubMed] [Google Scholar]
- 16.Sundaram P., Kurniawan H., Byrne M.E., Wower J. Therapeutic RNA aptamers in clinical trials. Eur. J. Pharm. Sci. 2013;48:259–271. doi: 10.1016/j.ejps.2012.10.014. [DOI] [PubMed] [Google Scholar]
- 17.Kupakuwana G.V., Crill J.E. 2nd, McPike M.P., Borer P.N. Acyclic identification of aptamers for human alpha-thrombin using over-represented libraries and deep sequencing. PloS One. 2011;6:e19395. doi: 10.1371/journal.pone.0019395. [DOI] [PMC free article] [PubMed] [Google Scholar]
- 18.Rusconi C.P., Scardino E., Layzer J., Pitoc G.A., Ortel T.L., Monroe D., Sullenger B.A. RNA aptamers as reversible antagonists of coagulation factor IXa. Nature. 2002;419:90–94. doi: 10.1038/nature00963. [DOI] [PubMed] [Google Scholar]
- 19.Thiel W.H., Thiel K.W., Flenker K.S., Bair T., Dupuy A.J., McNamara J.O. 2nd, Miller F.J., Giangrande P.H. Cell-internalization SELEX: method for identifying cell-internalizing RNA aptamers for delivering siRNAs to target cells. Methods Mol. Biol. 2015;1218:187–199. doi: 10.1007/978-1-4939-1538-5_11. [DOI] [PMC free article] [PubMed] [Google Scholar]
- 20.Jiang P., Meyer S., Hou Z., Propson N.E., Soh H.T., Thomson J.A., Stewart R. MPBind: a Meta-motif-based statistical framework and pipeline to Predict Binding potential of SELEX-derived aptamers. Bioinformatics. 2014;30:2665–2667. doi: 10.1093/bioinformatics/btu348. [DOI] [PMC free article] [PubMed] [Google Scholar]
- 21.Beier R., Boschke E., Labudde D. New strategies for evaluation and analysis of SELEX experiments. Biomed. Res. Int. 2014;2014:849743. doi: 10.1155/2014/849743. [DOI] [PMC free article] [PubMed] [Google Scholar]
- 22.Hoon S., Zhou B., Janda K.D., Brenner S., Scolnick J. Aptamer selection by high-throughput sequencing and informatic analysis. Biotechniques. 2011;51:413–416. doi: 10.2144/000113786. [DOI] [PubMed] [Google Scholar]
- 23.Joyce G.F. Amplification, mutation and selection of catalytic RNA. Gene. 1989;82:83–87. doi: 10.1016/0378-1119(89)90033-4. [DOI] [PubMed] [Google Scholar]
- 24.Nieuwlandt D., Wecker M., Gold L. In vitro selection of RNA ligands to substance P. Biochemistry. 1995;34:5651–5659. doi: 10.1021/bi00016a041. [DOI] [PubMed] [Google Scholar]
- 25.Stoltenburg R., Reinemann C., Strehlitz B. SELEX–a (r)evolutionary method to generate high-affinity nucleic acid ligands. Biomol. Eng. 2007;24:381–403. doi: 10.1016/j.bioeng.2007.06.001. [DOI] [PubMed] [Google Scholar]
- 26.Eaton B.E., Gold L., Hicke B.J., Janjic N., Jucker F.M., Sebesta D.P., Tarasow T.M., Willis M.C., Zichi D.A. Post-SELEX combinatorial optimization of aptamers. Bioorg. Med. Chem. 1997;5:1087–1096. doi: 10.1016/s0968-0896(97)00044-8. [DOI] [PubMed] [Google Scholar]
- 27.Couper K.N., Blount D.G., Riley E.M. IL-10: the master regulator of immunity to infection. J. Immunol. 2008;180:5771–5777. doi: 10.4049/jimmunol.180.9.5771. [DOI] [PubMed] [Google Scholar]
- 28.Barabasi A.L., Albert R. Emergence of scaling in random networks. Science. 1999;286:509–512. doi: 10.1126/science.286.5439.509. [DOI] [PubMed] [Google Scholar]
- 29.Ditzler M.A., Lange M.J., Bose D., Bottoms C.A., Virkler K.F., Sawyer A.W., Whatley A.S., Spollen W., Givan S.A., Burke D.H. High-throughput sequence analysis reveals structural diversity and improved potency among RNA inhibitors of HIV reverse transcriptase. Nucleic Acids Res. 2013;41:1873–1884. doi: 10.1093/nar/gks1190. [DOI] [PMC free article] [PubMed] [Google Scholar]
- 30.Alam K.K., Chang J.L., Burke D.H. FASTAptamer: A Bioinformatic Toolkit for High-throughput Sequence Analysis of Combinatorial Selections. Mol. Ther. Nucleic Acids. 2015;4:e230. doi: 10.1038/mtna.2015.4. [DOI] [PMC free article] [PubMed] [Google Scholar]
- 31.Blind M., Blank M. Aptamer selection technology and recent advances. Mol. Ther. Nucleic Acids. 2015;4:e223. doi: 10.1038/mtna.2014.74. [DOI] [PMC free article] [PubMed] [Google Scholar]
- 32.Hoinka J., Berezhnoy A., Sauna Z.E., Gilboa E., Przytycka T.M. 18th Annual International Conference on Research in Computational Molecular Biology. Pittsburgh, Pennsylvania: Springer; 2014. AptaCluster – A Method to Cluster HT-SELEX Aptamer Pools and Lessons from Its Application; pp. 115–128. [DOI] [PMC free article] [PubMed] [Google Scholar]
- 33.Gionis A., Indyk P., Motwani R. Similarity Search in High Dimensions via Hashing. Proceedings of the 25th International Conference on Very Large Data Bases. 1999;99:518–529. [Google Scholar]
- 34.Yang K., Zhang L. Performance comparison between k-tuple distance and four model-based distances in phylogenetic tree reconstruction. Nucleic Acids Res. 2008;36:e33. doi: 10.1093/nar/gkn075. [DOI] [PMC free article] [PubMed] [Google Scholar]
- 35.Layzer J.M., Sullenger B.A. Simultaneous generation of aptamers to multiple gamma-carboxyglutamic acid proteins from a focused aptamer library using DeSELEX and convergent selection. Oligonucleotides. 2007;17:1–11. doi: 10.1089/oli.2006.0059. [DOI] [PubMed] [Google Scholar]
- 36.Schutze T., Wilhelm B., Greiner N., Braun H., Peter F., Morl M., Erdmann V.A., Lehrach H., Konthur Z., Menger M., et al. Probing the SELEX process with next-generation sequencing. PloS One. 2011;6:e29604. doi: 10.1371/journal.pone.0029604. [DOI] [PMC free article] [PubMed] [Google Scholar]
- 37.Cho M., Xiao Y., Nie J., Stewart R., Csordas A.T., Oh S.S., Thomson J.A., Soh H.T. Quantitative selection of DNA aptamers through microfluidic selection and high-throughput sequencing. Proc. Natl. Acad. Sci. 2010;107:15373–15378. doi: 10.1073/pnas.1009331107. [DOI] [PMC free article] [PubMed] [Google Scholar]
- 38.Thiel W.H., Bair T., Peek A.S., Liu X., Dassie J., Stockdale K.R., Behlke M.A., Miller F.J. Jr, Giangrande P.H. Rapid identification of cell-specific, internalizing RNA aptamers with bioinformatics analyses of a cell-based aptamer selection. PloS One. 2012;7:e43836. doi: 10.1371/journal.pone.0043836. [DOI] [PMC free article] [PubMed] [Google Scholar]
- 39.Zuker M., Jacobson A.B. Using reliability information to annotate RNA secondary structures. RNA. 1998;4:669–679. doi: 10.1017/s1355838298980116. [DOI] [PMC free article] [PubMed] [Google Scholar]
- 40.Swofford D.L. 2003 4.0 ed. Sinauer Associates, Sunderland, Massachusetts, pp. PAUP. Phylogenetic Analysis Using Parsimony (and Other Methods) [Google Scholar]
- 41.Cho M., Xiao Y., Nie J., Stewart R., Csordas A.T., Oh S.S., Thomson J.A., Soh H.T. Quantitative selection of DNA aptamers through microfluidic selection and high-throughput sequencing. Proc. Natl. Acad. Sci. 2010;107:15373–15378. doi: 10.1073/pnas.1009331107. [DOI] [PMC free article] [PubMed] [Google Scholar]
- 42.Ozer A., Pagano J.M., Lis J.T. New Technologies Provide Quantum Changes in the Scale, Speed, and Success of SELEX Methods and Aptamer Characterization. Mol. Ther. Nucleic Acids. 2014;3:e183. doi: 10.1038/mtna.2014.34. [DOI] [PMC free article] [PubMed] [Google Scholar]
Associated Data
This section collects any data citations, data availability statements, or supplementary materials included in this article.