

Abstract
Irritable bowel syndrome (IBS) is the most common chronic visceral pain disorder. The pathophysiology of IBS is incompletely understood, however evidence strongly suggests dysregulation of the brain-gut axis. The aim of this study was to apply multivariate pattern analysis to identify an IBS-related morphometric brain signature which could serve as a central biological marker and provide new mechanistic insights into the pathophysiology of IBS. Parcellation of 165 cortical and subcortical regions was performed using Freesurfer and the Destrieux and Harvard-Oxford atlases. Volume, mean curvature, surface area and cortical thickness were calculated for each region. Sparse partial least squares-discriminant analysis was applied to develop a diagnostic model using a training set of 160 females (80 healthy controls, 80 IBS). Predictive accuracy was assessed in an age matched holdout test set of 52 females (26 health controls, 26 IBS). A two-component classification algorithm comprised of the morphometry of 1) primary somato-sensory and motor regions, and 2) multimodal network regions, explained 36% of the variance. Overall predictive accuracy of the classification algorithm was 70%. Small effect size associations were observed between the somatosensory and motor signature and non-gastrointestinal somatic symptoms. The findings demonstrate the predictive accuracy of a classification algorithm based solely on regional brain morphometry is not sufficient but they do provide support for the utility of multivariate pattern analysis for identifying meaningful neurobiological markers in IBS.
Perspective
This article presents the development, optimization, and testing of a classification algorithm for discriminating female IBS patients from healthy controls using only brain morphometry data. The results provide support for utility of multivariate pattern analysis for identifying meaningful neurobiological markers in IBS.
Keywords: Structural magnetic resonance imaging, brain, females, abdominal pain, classification
Introduction
Multivariate pattern analyses (MVPA) employ supervised and unsupervised machine learning algorithms and projection techniques to identify, model and/or predict spatial and temporal patterns in neuroimaging data that discriminate between cognitive tasks or groups [6]. MVPA has been applied to describe and predict acute pain state and perception based on functional brain data [57]. In addition, MVPA based on functional and structural neuroimaging data has been applied to discriminate healthy controls (HCs) from persons with chronic pain including chronic low back pain [62], functional dyspepsia [47; 55], and interstitial cystitis/bladder pain syndrome[4]. These analyses have provided important information regarding the possible brain mechanisms underlying chronic pain states. Eventually, the results from these analyses may translate into identification of novel therapeutic targets and development of individualized pain therapies based on brain signatures[57].
The utility of classification algorithms are limited by the method used for assessing accuracy of prediction [34; 59]. Due to the scarcity of large neuroimaging datasets and the desire to train a classification model on the largest number of subjects available, most neuroimaging researchers have opted for employing internal cross-validation procedures including leave one out and m-fold cross validation to determine predictive accuracy. However, testing the accuracy of an algorithm on a holdout test sample or independent data not used to train the classifier is considered to be the best approach for testing the generalizability and performance of the classifier [6; 34]. This external validation procedure tests the generalizability of the predictive algorithm to the general population of interest that may vary with respect to demographics, affective and clinical characteristics. Given the known heterogeneity among patients with chronic pain diagnoses, external validation is extremely important when making any inferences about the predictive utility of a classification algorithm.
Irritable bowel syndrome (IBS), the most common chronic abdominal pain syndrome, is thought to result from alterations in brain gut interactions, including alterations in central pain modulation, and autonomic nervous system responses [49]. IBS also has a high comorbidity with other chronic pain and affective disorders [64]. Multiple alterations in the central nervous system as measured by structural and functional brain imaging have been demonstrated in IBS compared to HCs and these alterations correlate with self-reported symptom severity measures [18; 23; 25; 29; 37; 60]. Here, we apply MVPA to an objective biological marker, brain morphometry, in order to provide new mechanistic insights into IBS. Our biological systems based approach uses large-scale brain multivariate imaging processing pipelines, integrated visualization and supervised learning/classification algorithms. We aimed to test the hypothesis that IBS is associated with a specific morphometric brain signature which could represent a central biological marker for the disease. Such morphological brain alterations could be a predisposing factor for IBS development, or could reflect the longstanding input of increased visceral afferent signals to the brain. Furthermore we examined whether the brain signatures derived from a training data set could be used to accurately predict IBS in a holdout test sample.
Methods
Participants
The sample was comprised of a total of 216 female subjects, (HC n=108 and IBS n= 108) enrolled in neuroimaging studies at the Center for Neurobiology of Stress between 2007 and 2013. IBS subjects met Rome II or III symptom criteria for IBS [17]. A gastroenterologist or nurse practitioner obtained a medical history and physical exam to confirm the IBS diagnosis. IBS patients with any bowel habit were included. The Mini-International Neuropsychiatric Interview was used to identify past or current psychiatric illness [58]. The average age for IBS and HCs were similar, 30.0 years (SD=±9.2) and 28.1 years (±9.4), respectively. Average symptom duration in IBS subjects was 10.6 (±8.3) years. IBS subjects reported an average of overall symptoms in the past week of 9.9 (±4.5) on a 21 point numeric rating scale (0= no pain, 20= the most intense symptoms imaginable). Usual symptom severity reported by IBS subjects was 3.2 (±.61) as measured on an ordinal scale where 1 = None, 2 = Mild, 3 = Moderate, 4 = Severe, and 5 = Very Severe.
Exclusionary criteria for all subjects included: (1) serious medical conditions or taking medications which could compromise interpretation of the brain imaging; (2) ongoing major psychiatric diagnoses or use of psychotropic medications in the past 6 months (subjects were not excluded for lifetime incidence of psychiatric disorders or for intake of low-dose tricyclic antidepressants for non-psychiatric indications); and (3) excessive physical exercise (e.g., marathon runners). All procedures complied with the principles of the Declaration of Helsinki and were approved by the Institutional Review Board at our institution.
Case-control matching based on age was performed using the fuzzy algorithm in SPSS v.22. This resulted in a balanced matched sample of 108 HCs and 108 IBS patients. To test the generalizability of the predictive model, we used a hold out procedure via a random 80/20 split on HC data (along with their age-matched IBS subjects). This resulted in a training data set (N=160) and a test set (N=56).
Questionnaires
The Hospital Anxiety and Depression Scale [HADs] ([66] and the Patient Health Questionnaire-15 [PHQ] were obtained prior to the MRI [36]. The PHQ was scored without the 3 gastrointestinal symptom items due to their overlap with IBS symptoms. [36] These measures of somatic symptoms and nonclinical levels of anxiety were used to assess their association with the obtained classification results.
Structural MRI
HCs and IBS female subjects were scanned on a 3.0T Siemens Trio MRI after a sagittal scout was used to position the head. Structural scans were obtained from 1 of 6 different acquisition sequences using a high-resolution 3-dimensional T1-weighted, sagittal magnetization-prepared rapid gradient echo protocol as described in supplemental Table 1. Acquisition protocols only were included if they were used with both IBS and HC subjects. A general linear model controlling for age indicated that protocol 1 and 2 were similar to each other but had lower total gray matter volumes than the remaining protocols (see supplemental Figure 1, for graph of parameter estimates and 95% confidence intervals). Based on these results, we classified protocols into protocol A (1, 2) and protocol B (3, 4, 6, 7). Fisher’s two-sided exact test indicated that the distribution of groups across the protocols was not significantly different (Protocol 1, 48 HC, 36 IBS; Protocol 2, 60 HCs, 72 IBS). Furthermore, there was no evidence that the distribution of the protocols in the test and training samples for each group was unbalanced (HC, p=.52; IBS, p=.49).
Neuroimaging, segmentation and parcellation
T1-image segmentation and regional parcellation were conducted using FreeSurfer [11; 21; 22] following the nomenclature described in Destrieux atlas and the Harvard-Oxford subcortical atlas [13; 15]. For each cerebral hemisphere, a set of 74 cortical structures were labeled in addition to 7 subcortical structures and the cerebellum. Segmentation results from a sample subject are shown in Figure 1. One additional midline structure (the brain stem) was also included, for a complete set of 165 parcellations for the entire brain. Table 1 contains a description of the regions and their abbreviations. Four representative but distinct morphological measures were computed for each cortical parcellation: gray matter volume, surface area, mean cortical thickness, and mean curvature.
Figure 1.
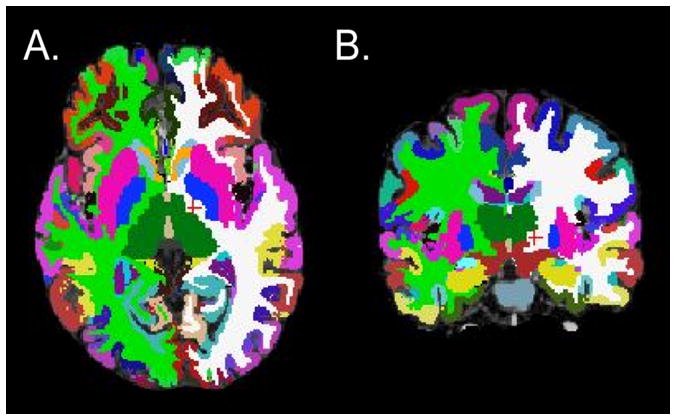
Axial (A) and coronal (B) views of regional parcellations based on the Destrieux and Harvard-Oxford subcortical atlas in a representative subject.
Table 1.
List of regions and abbreviations for Destrieux and Harvard-Oxford Atlas Regions
| Abbr | Full name |
|---|---|
| L_CeB | L cerebellum |
| L_Tha | L Thalamus |
| L_CaN | L Caudate |
| L_Pu | L Putamen |
| L_Pal | L Pallidum |
| Bstem | Brain-Stem |
| L_Hip | L Hippocampus |
| L_Amg | L Amygdala |
| L_Nacc | L Nucleus Accumbens |
| R_CeB | R Cerebellum |
| R_Tha | R Thalamus |
| R_CaN | R Caudate |
| R_Pu | R Putamen |
| R_Pal | R Pallidum |
| R_Hip | R Hippocampus |
| R_Amg | R Amygdala |
| R_Nacc | R Nucleus Accumbens |
| L_FMarG/S | L Fronto-marginal gyrus (of Wernicke) and sulcus |
| L_InfOcG/S | L Inferior occipital gyrus (O3) and sulcus |
| L_PaCL/S | L Paracentral lobule and sulcus |
| L_SbCG/S | L Subcentral gyrus (central operculum) and sulci |
| L_TrFPoG/S | L Transverse frontopolar gyri and sulci |
| L_ACgG/S | L Anterior part of the cingulate gyrus and sulcus (ACC) |
| L_MACgG/S | L Middle-anterior part of the cingulate gyrus and sulcus (aMCC) |
| L_MPosCgG/S | L Middle-posterior part of the cingulate gyrus and sulcus (pMCC) |
| L_PosDCgG | L Posterior-dorsal part of the cingulate gyrus (dPCC) |
| L_PosVCgG | L Posterior-ventral part of the cingulate gyrus (vPCC, isthmus of the cingulate gyrus) |
| L_cun | L Cuneus |
| L_InfFGOpp | L Opercular part of the inferior frontal gyrus |
| L_InfFGOrp | L Orbital part of the inferior frontal gyrus |
| L_InfFGTrip | L Triangular part of the inferior frontal gyrus |
| L_MFG | L Middle frontal gyrus |
| L_SupFG | L Superior frontal gyrus |
| L_LoInG/CInS | L Long insular gyrus and central sulcus of the insula |
| L_ShoInG | L Short insular gyri |
| L_MOcG | L Middle occipital gyrus |
| L_SupOcG | L Superior occipital gyrus |
| L_FuG | L Lateral occipito-temporal gyrus (fusiform gyrus) |
| L_LinG | L Lingual gyrus, ligual part of the medial occipito-temporal gyrus |
| L_PaHipG | L Parahippocampal gyrus, parahippocampal part of the medial occipito-temporal gyrus |
| L_OrG | L Orbital gyri |
| L_AngG | L Angular gyrus |
| L_SuMarG | L Supramarginal gyrus |
| L_SupPL | L Superior parietal lobule |
| L_PosCG | L Postcentral gyrus |
| L_PRCG | L Precentral gyrus |
| L_PrCun | L Precuneus |
| L_RG | L Straight gyrus, Gyrus rectus |
| L_SbCaG | L Subcallosal area, subcallosal gyrus |
| L_HG | L Anterior transverse temporal gyrus (of Heschl) |
| L_SupTGLp | L Lateral aspect of the superior temporal gyrus |
| L_PoPl | L Planum polare of the superior temporal gyrus |
| L_TPl | L Planum temporale or temporal plane of the superior temporal gyrus |
| L_InfTG | L Inferior temporal gyrus |
| L_MTG | L Middle temporal gyrus |
| L_ALSHorp | L Horizontal ramus of the anterior segment of the lateral sulcus (or fissure) |
| L_ALSVerp | L Vertical ramus of the anterior segment of the lateral sulcus (or fissure) |
| L_PosLS | L Posterior ramus (or segment) of the lateral sulcus (or fissure) |
| L_OcPo | L Occipital pole |
| L_Tpo | L Temporal pole |
| L_CcS | L Calcarine sulcus |
| L_CS | L Central sulcus (Rolando’s fissure) |
| L_CgSMarp | L Marginal branch (or part) of the cingulate sulcus |
| L_ACirIns | L Anterior segment of the circular sulcus of the insula |
| L_InfCirIns | L Inferior segment of the circular sulcus of the insula |
| L_SupCirInS | L Superior segment of the circular sulcus of the insula |
| L_ATrCoS | L Anterior transverse collateral sulcus |
| L_PosTrCoS | L Posterior transverse collateral sulcus |
| L_InfFS | L Inferior frontal sulcus |
| L_MFS | L Middle frontal sulcus |
| L_SupFS | L Superior frontal sulcus |
| L_JS | L Sulcus intermedius primus (of Jensen) |
| L_IntPS/TrPS | L Intraparietal sulcus (interparietal sulcus) and transverse parietal sulci |
| L_MOcS/LuS | L Middle occipital sulcus and lunatus sulcus |
| L_SupOcS/TrOcS | L Superior occipital sulcus and transverse occipital sulcus |
| L_AOcS | L Anterior occipital sulcus and preoccipital notch (temporo- occipital incisure) |
| L_LOcTS | L Lateral occipito-temporal sulcus |
| L_CoS/LinS | L Medial occipito-temporal sulcus (collateral sulcus) and lingual sulcus |
| L_LORs | L Lateral orbital sulcus |
| L_MedOrS | L Medial orbital sulcus (olfactory sulcus) |
| L_OrS | L Orbital sulci (H-shaped sulci) |
| L_POcS | L Parieto-occipital sulcus (or fissure) |
| L_PerCaS | L Pericallosal sulcus (S of corpus callosum) |
| L_PosCS | L Postcentral sulcus |
| L_InfPrCS | L Inferior part of the precentral sulcus |
| L_SupPrCs | L Superior part of the precentral sulcus |
| L_SbOrS | L Suborbital sulcus (sulcus rostrales, supraorbital sulcus) |
| L_SbPS | L Subparietal sulcus |
| L_InfTS | L Inferior temporal sulcus |
| L_SupTS | L Superior temporal sulcus (parallel sulcus) |
| L_TrTs | L Transverse temporal sulcus |
| R_FMarG/S | R Fronto-marginal gyrus (of Wernicke) and sulcus |
| R_InfOcG/S | R Inferior occipital gyrus (O3) and sulcus |
| R_PaCL/S | R Paracentral lobule and sulcus |
| R_SbCG/S | R Subcentral gyrus (central operculum) and sulci |
| R_TrFPoG/S | R Transverse frontopolar gyri and sulci |
| R_ACgG/S | R Anterior part of the cingulate gyrus and sulcus (ACC) |
| R_MACgG/S | R Middle-anterior part of the cingulate gyrus and sulcus (aMCC) |
| R_MPosCgG/S | R Middle-posterior part of the cingulate gyrus and sulcus (pMCC) |
| R_PosDCgG | R Posterior-dorsal part of the cingulate gyrus (dPCC) |
| R_PosVCgG | R Posterior-ventral part of the cingulate gyrus (vPCC, isthmus of the cingulate gyrus) |
| R_cun | R Cuneus |
| R_InfFGOpp | R Opercular part of the inferior frontal gyrus |
| R_InfFGOrp | R Orbital part of the inferior frontal gyrus |
| R_InfFGTrip | R Triangular part of the inferior frontal gyrus |
| R_MFG | R Middle frontal gyrus |
| R_SupFG | R Superior frontal gyrus |
| R_LoInG/CInS | R Long insular gyrus and central sulcus of the insula |
| R_ShoInG | R Short insular gyri |
| R_MOcG | R Middle occipital gyrus |
| R_SupOcG | R Superior occipital gyrus |
| R_FuG | R Lateral occipito-temporal gyrus (fusiform gyrus) |
| R_LinG | R Lingual gyrus, ligual part of the medial occipito-temporal gyrus |
| R_PaHipG | R Parahippocampal gyrus, parahippocampal part of the medial occipito-temporal gyrus |
| R_OrG | R Orbital gyri |
| R_AngG | R Angular gyrus |
| R_SuMarG | R Supramarginal gyrus |
| R_SupPL | R Superior parietal lobule |
| R_PosCG | R Postcentral gyrus |
| R_PRCG | R Precentral gyrus |
| R_PrCun | R Precuneus |
| R_RG | R Straight gyrus, Gyrus rectus |
| R_SbCaG | R Subcallosal area, subcallosal gyrus |
| R_HG | R Anterior transverse temporal gyrus (of Heschl) |
| R_SupTGLp | R Lateral aspect of the superior temporal gyrus |
| R_PoPl | R Planum polare of the superior temporal gyrus |
| R_TPl | R Planum temporale or temporal plane of the superior temporal gyrus |
| R_InfTG | R Inferior temporal gyrus |
| R_MTG | R Middle temporal gyrus |
| R_ALSHorp | R Horizontal ramus of the anterior segment of the lateral sulcus (or fissure) |
| R_ALSVerp | R Vertical ramus of the anterior segment of the lateral sulcus (or fissure) |
| R_PosLS | R Posterior ramus (or segment) of the lateral sulcus (or fissure) |
| R_OcPo | R Occipital pole |
| R_Tpo | R Temporal pole |
| R_CcS | R Calcarine sulcus |
| R_CS | R Central sulcus (Rolando’s fissure) |
| R_CgSMarp | R Marginal branch (or part) of the cingulate sulcus |
| R_ACirInS | R Anterior segment of the circular sulcus of the insula |
| R_InfCirIns | R Inferior segment of the circular sulcus of the insula |
| R_SupCirInS | R Superior segment of the circular sulcus of the insula |
| R_ATrCoS | R Anterior transverse collateral sulcus |
| R_PosTrCoS | R Posterior transverse collateral sulcus |
| R_InfFS | R Inferior frontal sulcus |
| R_MFS | R Middle frontal sulcus |
| R_SupFS | R Superior frontal sulcus |
| R_JS | R Sulcus intermedius primus (of Jensen) |
| R_IntPS/TrPS | R Intraparietal sulcus (interparietal sulcus) and transverse parietal sulci |
| R_MOcS/LuS | R Middle occipital sulcus and lunatus sulcus |
| R_SupOcS/TrOcS | R Superior occipital sulcus and transverse occipital sulcus |
| R_AOcS | R Anterior occipital sulcus and preoccipital notch (temporo- occipital incisure) |
| R_LOcTS | R Lateral occipito-temporal sulcus |
| R_CoS/LinS | R Medial occipito-temporal sulcus (collateral sulcus) and lingual sulcus |
| R_LORs | R Lateral orbital sulcus |
| R_MedOrS | R Medial orbital sulcus (olfactory sulcus) |
| R_OrS | R Orbital sulci (H-shaped sulci) |
| R_POcS | R Parieto-occipital sulcus (or fissure) |
| R_PerCaS | R Pericallosal sulcus (S of corpus callosum) |
| R_PosCS | R Postcentral sulcus |
| R_InfPrCS | R Inferior part of the precentral sulcus |
| R_SupPrCs | R Superior part of the precentral sulcus |
| R_SbOrS | R Suborbital sulcus (sulcus rostrales, supraorbital sulcus) |
| R_SbPS | R Subparietal sulcus |
| R_InfTS | R Inferior temporal sulcus |
| R_SupTS | R Superior temporal sulcus (parallel sulcus) |
| R_TrTs | R Transverse temporal sulcus |
Abbreviation: CT=cortical thickness, G=gyrus, L =left, MC=Mean curvature, R=right, S=sulci, SA=surface area, V=volume
Sparse Partial Least Squares for Discrimination Analysis (sPLS-DA)
The aim of this analysis was to identify the brain markers that can help predict patient status (IBS, HCs). To this end, sPLS-DA was applied to the training data set to identify potential brain endophenotypes that discriminate IBS from HCs. sPLS-DA is a variant on well know PLS algorithms that has been used to analyse brain networks in IBS [38; 39] and in several other domains [35; 50]. The sPLS-DA algorithm was selected based upon its ability to deal with a large number of predictors, small sample size, and high collinearity among predictors [40]. sPLS-DA has shown good classification performance in comparison with other methods [40]. Recently, sPLS has been successfully applied to link multivariate neuroimaging and genetic data [44].
sPLS-DA maximizes the sample covariance between the brain measures and a group difference contrast using singular value decomposition [41; 43]. This multivariate technique reduces the dimensionality of the data by finding a set of orthogonal components (also referred to as latent variables) comprised of a set of selected features. This is similar to performing a principal components analysis but restricting the solution to explaining the variance in a group difference contrast. Unlike other previous PLS applications in neuroimaging, sPLS also performs automatic feature selection [6] on the variables comprising each component by using lasso penalization [42; 43]. This is important because highly dimensional data contain lots of irrelevant variables that weaken discriminatory power. Ultimately, the algorithm selects only a few of the most important variables that contribute to the final solution (For a more a technical description of the method, readers are encouraged to read [42; 43]).
Each variable selected for a component has an associated loading, which is a measure of the importance of that variable in the component for the discrimination into the two groups [43]. In addition, variable importance in projection (VIP) scores are calculated to provide a more standardized measure that represents the contribution of each feature relative to the variance explained by all components [51]. As a rule of thumb, predictors with VIP coefficients greater than one are considered particularly important for the classification [43].
Development and optimization of the predictive model
First, the volume, cortical thickness, surface area, and mean curvature of the 165 regions were entered as potential predictor variables into the sPLS-DA. The number of components/brain signatures to identify was fixed at 2. The number of components is often dictated by the number of groups, K, and the formula K-1. However, we also tested the utility of including a second component. We specified fifty variables to be selected/retained for each component or brain signature. See [43] for a complete discussion regarding the theory associated with selecting the optimum number of components and number of variables for each component. Instead of performing one sPLS analysis and providing this solution as the final model, we first performed a stability analysis to tune the final number of components and the number and type of variables comprising those components.
Stability analysis provides information on the reliability of the selected variables comprising a component if a training set is altered [40]. Stability analysis is achieved via 10-fold cross-validation repeated 100 times. This cross-validation procedure divides the training data into 10 folds or subsamples of data (n=16 test sets). A single subsample is set aside as test data and the remaining subsamples are used to train the sPLS-DA model. This process is repeated 100 times to determine the stability of variables selected for the first component. The stability of the variables is assessed by calculating the frequency or probability of a specific variable being selected across all cross-validation runs. We applied a threshold of 90% stability for retaining variables for the final sPLS-DA. Once the number of variables showing at least 90% stability is determined for the first component, the process is repeated for the second component. Stability analysis results in a very limited set of variables to be entered as predictor variables in the final sPLS analysis used to develop the classification algorithm. We refer to the components obtained in the final solution as brain signatures that are able to differentiate the particular groups. The brain signatures are summarized using variable loadings on the individual dimensions/components and VIP coefficients. We also use graphical displays to illustrate loadings and discriminative abilities of the algorithms [40].
The predictive ability of the final model was assessed on the test set (N=52). We calculated binary classification measures: sensitivity, specificity, positive predictive value and negative predictive value. Here, the sensitivity indexes the ability of the classification algorithm to correctly identify individuals with IBS. Specificity reflects the ability of the classification algorithm to correctly identify individuals in HC. Positive predictive value reflects the proportion of sample showing the specific IBS brain signature from the classification algorithm and actually having IBS (true positive). On the other hand, negative predictive value is the probability that the test result is negative, i.e., the participant does not have the IBS-specific brain signature and the participant does not have IBS (true negative).
Statistical Analyses
We applied sPLS-DA to analyze volume, cortical thickness, surface area, and mean curvature of the brain regions described above. In addition to the morphological brain data, total gray matter was included as potential predictive variable. sPLS-DA was performed using the R package mixOmics (http://www.R-project.org). We applied Pearson’s R to examine the association between individual IBS patient scores on each brain signature and patient’s self-report of usual symptom severity and overall symptom severity in the past week. We also examined the correlation between the brain signature scores and measures of non-gastrointestinal somatic symptoms and state anxiety in all subjects. We applied false discovery rate (FDR) to correct for multiple correlational analyses for each brain signature [56]. We report p values lower than .05 and their FDR-adjusted q values.
Results
MVPA/Classification analyses
Morphometric based classification
We examined whether the volume, cortical thickness, surface area, and mean curvature of any of the 165 brain regions could be used to discriminate HCs from IBS in the training data. Based upon stability analysis (see supplemental Figure 2), 21 variables were selected for the first component and 7 variables were selected for the second. As can be seen in Figure 2, the final model demonstrates the discriminative ability of the classifier by depicting the individuals from the sample based on their scores on the two brain signatures. Table 2 contains the list of selected morphometric parameters for each brain signature comprising the discriminative algorithm along with variable loadings, VIP coefficients, and the selected morphometric phenotype. Figures 3 and 4 depict the regions of interest comprising the brain signatures depicted on an inflated brain labeled with the Destrieux Atlas.
Figure 2. Individual sample plot.
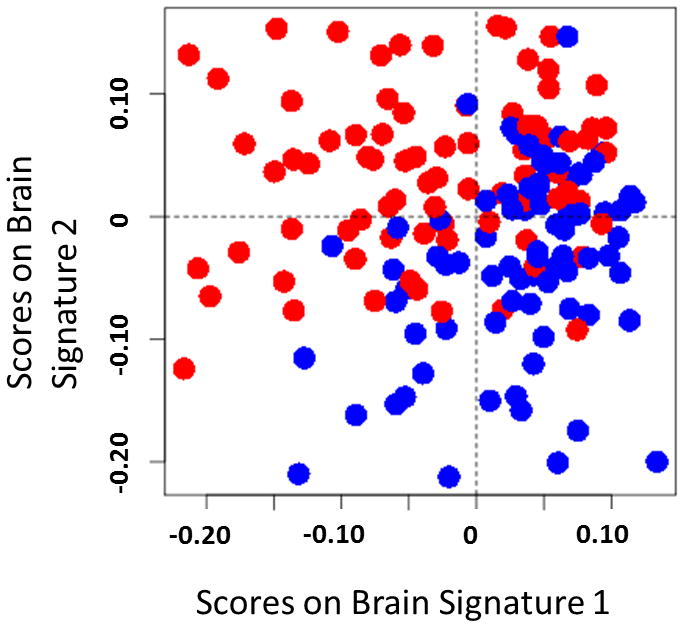
Irritable bowel syndrome (red) and healthy control (blue) are represented as point placed according to their scores on the two brain signatures derived from a sparse partial least squares-discriminative analysis. This plot suggests group discrimination can be obtained with the morphological classifier.
Table 2.
Multivariate structural brain signatures
| Brain Signature 1 | Brain Signature 2 | Brain Signature 1 | Brain Signature 2 | ||
|---|---|---|---|---|---|
| Region | Metric | Loading | Loading | VIP | VIP |
| L Paracentral lobule and sulcus | MC | −0.28 | 1.49 | 0.99 | |
| L Postcentral gyrus | CT | −0.43 | 2.30 | 1.53 | |
| L Postcentral gyrus | V | −0.28 | 1.47 | 0.98 | |
| L Precentral gyrus | V | −0.26 | 1.35 | 0.90 | |
| R Central sulcus (Rolando’s fissure) | MC | −0.26 | 1.36 | 0.91 | |
| R Paracentral lobule and sulcus | MC | −0.22 | 1.17 | 0.78 | |
| R Precentral gyrus | MC | −0.33 | 1.72 | 1.15 | |
| R Superior segment of the circular sulcus of the insula (anterior/ mid insula) | MC | −0.19 | 1.01 | 0.67 | |
| L Middle temporal gyrus | V | −0.21 | 1.13 | 0.75 | |
| L Precentral gyrus | MC | −0.19 | 1.00 | 0.67 | |
| R Superior part of the precentral sulcus | MC | −0.16 | 0.84 | 0.56 | |
| R Superior frontal gyrus | MC | −0.15 | 0.79 | 0.53 | |
| R Pericallosal sulcus (S of corpus callosum) | MC | −0.17 | 0.92 | 0.62 | |
| R Anterior segment of the circular sulcus of the insula | MC | −0.16 | 0.85 | 0.57 | |
| L Subcentral gyrus (central operculum) and sulci | CT | −0.17 | 0.91 | 0.61 | |
| L Middle-posterior part of the cingulate gyrus and sulcus (pMCC) | MC | −0.16 | 0.83 | 0.55 | |
| L Anterior segment of the circular sulcus of the insula | MC | −0.14 | 0.72 | 0.48 | |
| L Central sulcus (Rolando’s fissure) | V | −0.15 | 0.78 | 0.52 | |
| L Suborbital sulcus (sulcus rostrales, supraorbital sulcus) | MC | −0.15 | 0.78 | 0.52 | |
| L Pericallosal sulcus (S of corpus callosum) | MC | −0.13 | 0.71 | 0.47 | |
| L Middle frontal gyrus | MC | −0.12 | 0.61 | 0.41 | |
| R inferior frontal/ anterior insula sulcus | CT | −0.27 | 0.00 | 1.07 | |
| L Superior part of the precentral sulcus | CT | −0.16 | 0.00 | 0.62 | |
| L Subcallosal area, subcallosal gyrus | MC | −0.30 | 0.00 | 1.18 | |
| R Transverse temporal sulcus (primary auditory area near Heschl’s gyrus) | MC | −0.64 | 0.00 | 2.53 | |
| L Lateral occipito-temporal sulcus (fusiform gyrus) | SA | 0.33 | 0.00 | 1.31 | |
| L Intraparietal sulcus (interparietal sulcus) and transverse parietal sulci | MC | −0.53 | 0.00 | 2.07 | |
| L Posterior ramus (or segment) of the lateral sulcus (or fissure) | V | −0.12 | 0.00 | 0.46 |
Brain morphometric endophenotypes selected for each brain signature along with variable loadings on that dimension/signature. For brain signature 1, all negative loading reflect IBS >HC. For brain signature 2, negative loading reflect HC > IBS. Variable of importance to the prediction coefficients (VIP) greater than one indicate endophentotypes that are considered particularly important for the classification. Please note these VIP values change for variables comprising the first component when considering the second component due to the additional variance explained.
Morphometric endophenotype indicates whether the measure was mean curvature,(MC), Volume (V), cortical thickness (CT), or surface area (SA). The first brain signature explained 16% of the variability and the second explained an additional 20% variance in classification of IBS based on morphometric phenotype data. Abbreviations L=Left, R=right.
Figure 3. Regions comprising the Brain signature 1.
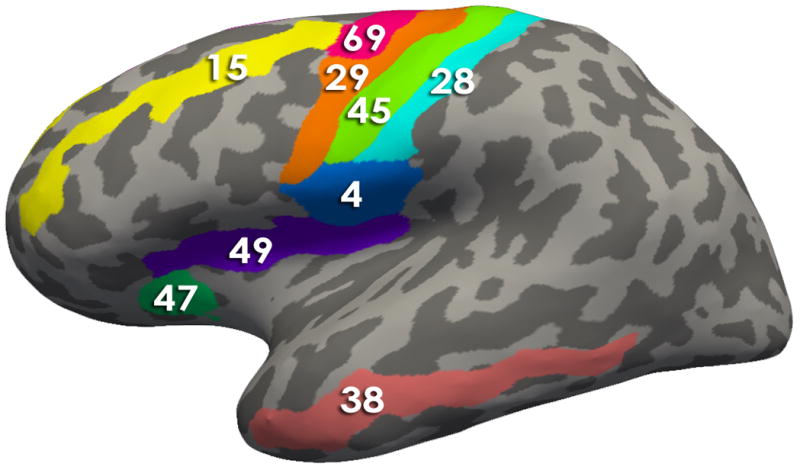
Using Freesurfer, all regions comprising the signatures are depicted on an inflated brain labeled with the Destrieux Atlas. Table 2 contains the describes the morphological measures (Volume, Cortical thickness, surface area and/or mean curvature) of the regions that contributed to the solutions
- Brain Signature 1 regions-Lateral View: 4, Subcentral Gyrus (central operculum) and Sulci; 15, Middle Frontal Gyrus (15); 28, Postcentral Gyrus; 29, Precentral Gyrus; 38, Middle Temporal Gyrus; 45, Central Sulcus (Rolando’s Fissure); 47, Anterior Segment of the Circular Sulcus of the Insula; 49, Superior Segment of the Circular Sulcus of the Insula; 69, Superior Part of the Precentral Sulcus
- Brain Signature 1 regions-Medial View : 3, Paracentral Lobule and Sulcus; 8, Middle-Posterior Part of the Cingulate Gyrus and Sulcus (pMCC); 16, Superior Frontal Gyrus 66, Pericallosal Sulcus (Sulcus of Corpus Callosum); 70, Suborbital Sulcus (Sulcus Rostrales, Supraorbital Sulcus)
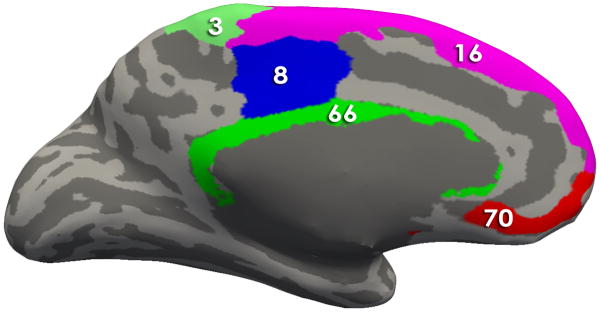
Figure 4. Regions comprising the Brain signature 2.
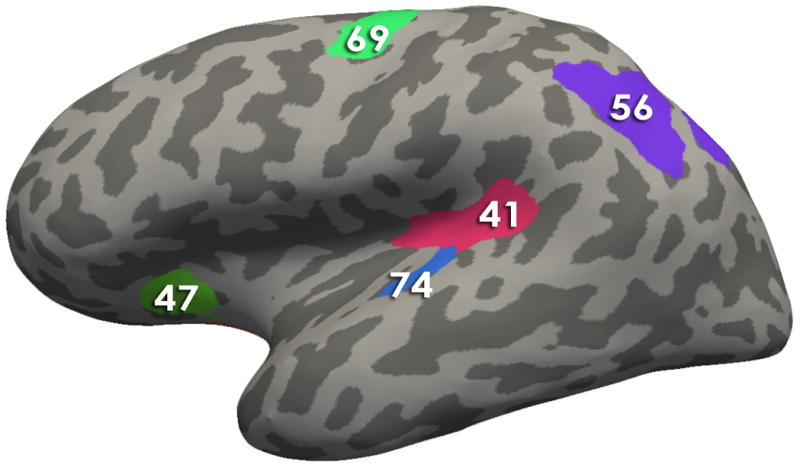
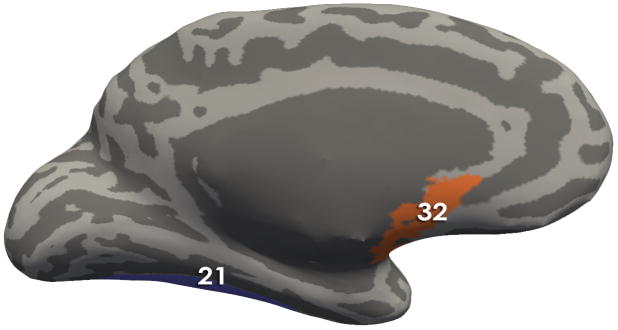
Using Freesurfer, all regions comprising the signatures are depicted on an inflated brain labeled with the Destrieux Atlas. Table 2 contains the describes the morphological measures (Volume, Cortical thickness, surface area and/or mean curvature) of the regions that contributed to the solutions
-
Brain Signature 2 regions-Lateral View:41, Posterior Ramus of the Lateral Sulcus; 47, Anterior Segment of the Circular Sulcus of the Insula; 69, Superior Part of the Precentral Sulcus; 56, Intraparietal Sulcus and Transverse Parietal Sulci ; 74, Transverse Temporal Sulcus
-
Brain Signature 2 regions- Medial View:21 Lateral Occipito-Temporal Gyrus (Fusiform Gyrus); 32, Subcallosal Area (Subcallosal Gyrus);
The first brain signature explained 16% of the variability in discriminating HCs and IBS This brain signature was comprised of morphometric alterations of several somato-sensory and motor regions (including pre and post central gyrus), interoceptive integration regions (including anterior and mid insula, the middle-posterior part of the cingulate gyrus and sulcus, and cognitive-modulatory regions (including subregions of the frontal gyrus). Ten of the 21 variables comprising the signature showed VIP coefficients greater than 1, suggesting these variables are the most influential in the predictive model. Cortical thickness of the left post central gyrus and mean curvature of the right precentral gyrus explained most of the variance in the group discrimination. As seen in Table 2, all loadings for variables on the first brain signature were negative, and associated with higher values in IBS.
The second brain signature explained 20% of the variance. This second brain signature was comprised of fronto-insular regions (right horizontal ramus of the anterior segment of the lateral sulcus), an emotion modulation region [left subcallosal area (subgenual cingulate)], a dorsal attentional region (left intraparietal sulcus and transverse parietal sulci), as well as visual (left fusiform gyrus) and auditory (right transverse temporal sulcus near Heschl’s gyrus) gyri. The signature also contained a primary motor area (left superior part of the precentral gyrus) and primary interoceptive cortex (left posterior segment of the lateral sulcus posterior insula/inferior parietal sulci), but the VIP coefficients for these two regions were quite small indicating the least amount of influence on the discrimination of groups. Negative loadings were associated with greater values in HC compared to IBS. All loadings were negative except for the fusiform gyrus which had a greater value in IBS.
Estimating predictive accuracy of brain signatures for discriminating IBS from HCs in a test set
The classification algorithm developed in the training set was used to predict cases from the test set (N=52) and calculate binary classification measures. The algorithm had a sensitivity of 68% and a specificity of 71%. The negative predictive value was 69% and the positive predictive value was 70%. Overall classification accuracy in this independent test set was 70%. We also applied 10-fold cross validation 100 times and leave-one-out cross validation on the original training set. Cross validation estimated that the model performance had a sensitivity of 65%, specificity of 75%, negative predictive value of 68%, and positive predictive value of 72%. This resulted in an overall accuracy of 70%. Leave-one-out cross validation indicated a sensitivity of 65%, specificity of 74%, negative predictive value of 68%, and positive predictive value of 71%. This also resulted in an overall accuracy of 70%.
Correlations between morphometric brain signature scores and clinical variables
Correlations of brain signatures with behavioral and clinical variables in IBS were small and none of them survived correction for multiple comparisons. However, patient reports of usual symptom severity showed a trend for a small positive correlation with their scores on the second multimodal morphological signature, (r (108) =.20, p=.036, q=.072). Across IBS and HC, extra-gastrointestinal somatic symptoms across HC and IBS were associated with the somatosensory and motor brain signature, r (199) =−.19, p=.007, q=.028. No correlations were found between the brain signatures and state anxiety.
Discussion
The aim of this study was to determine whether a central biological signature of IBS could be identified based on a high resolution structural MRI brain image. Using large-scale pre-processing and analytic pipelines, a training data set, and applying sPLS-DA, we developed a predictive algorithm based on multivariate morphometric metrics. We then tested the accuracy of this predictive algorithm in an independent test sample to avoid biased estimation. We demonstrated that two morphological brain signatures discriminated female IBS subjects from HCs with 70% overall predictive accuracy. The predictive accuracy achieved with sPLS-DA was comparable to the predictive accuracy obtained using support vector machines and whole brain voxel-based morphometry data for discriminating HCs from subjects with a condition often comorbid with IBS, interstitial cystitis/bladder pain syndrome [4].
Brain signatures which discriminate IBS from HCs
The first component/brain signature explained 16% variance and was largely a somato-sensory and motor signature given that the most influential regions for the discrimination were pre- and post-central gyrus and the bilateral paracentral lobule. The paracentral lobule has been implicated in the regulation of motor activity related to defecation and micturition, and in motor sensory regulation of the lower extremity. This region has also been found to show altered functional connectivity with the midbrain in bladder pain syndrome/interstitial cystitis, a functional disorder with frequent overlap with IBS [31]. Other sensorimotor regions included the mid-insula, subcentral gyrus (central operculum) and sulci that connect the inferior parts of the pre- and post-central gyri and the middle-posterior part of the cingulate gyrus and sulcus. Although a part of this brain signature, regions associated with the salience network including the anterior insula and the closely connected medial frontal and middle temporal gyri were least influential in the discrimination. The morphometric values of all regions comprising this signature were higher in IBS, e.g. they had higher volume, cortical thickness, greater complexity, and/or larger surface area in IBS. Indirect evidence from retrograde tracing studies suggests that primary and secondary motor cortices provide input to central sympathetic control regions, and may therefore be able to modulate gastrointestinal motility and secretion [45]. Dysregulation of sympathetic nervous system activity has been demonstrated in IBS [48; 61] and in other disorders of chronic pain, such as fibromyalgia and temporomandibular disorder [46]. Recent structural MRI investigations in IBS have demonstrated similar increases in cortical thickness and volume in these sensorimotor areas confirming the relevance of the regions identified [29; 37]. Compared to the previously used parcellation based on the LBP40 atlas, the parcellation based on the Destrieux atlas used here provided greater resolution to identify more specific regions within the sensorimotor, cingulate, insular, and prefrontal cortices. Increased volume and cortical thickness in the somatosensory and motor regions have been reported in other chronic pain conditions including interstitial cystitis/painful bladder syndrome [30], trigeminal neuralgia [14], migraine [12] and temporomandibular disorders [53; 54]. Cortical thickening in primary somato-sensensory regions and posterior midcingulate cortex in healthy subjects has been associated with greater sensitivity to experimental temperature and pain stimuli [20]. Recent investigations of resting state data demonstrate an alteration in the salience and sensorimotor networks of IBS patients [23; 25; 26]. Resting state functional alterations in sensorimotor network regions have also been noted in females with other comorbid diseases including vulvodynia [24], fibromyalgia [33] and interstitial cystitis/bladder pain syndrome [31]. The reported alterations in these networks may mediate differences in perceptual sensitivity to visceral stimuli between HCs and IBS. When viewed together, the current findings support an important role of a gray matter signature involving sensorimotor regions in discriminating IBS from HCs.
A second independent brain signature was primarily characterized by the morphometry of regions involved in sensory (primary auditory cortex, fusiform gyrus,), emotion regulation (subgenual cingulate), dorsal attention (parietal sulci), and salience networks (inferior frontal gyrus/anterior insula). The primary viscerosensory cortex (posterior insula) and the primary motor cortex (left superior precentral gyrus) were also included in the signature but were the least influential in the discrimination of IBS and HCs. The morphometric values of all regions comprising this signature were higher in HCs with the exception of greater surface area of the fusiform gyrus in IBS. Consistent with our findings, the cortical thickness of the subgenual cingulate as well as the anterior insula has been reported as reduced in IBS compared to HCs [29]. Similar reductions have been reported in some forms of depression[16]. The subgenual cingulate is functionally and anatomically connected to a network of regions associated with autonomic nervous system and emotion regulation, including the amygdala and the vagal nucleus tractus solitarius [63]. The anterior insula is one of the core regions of the salience network, and functions as a hub integrating information from and interacting with brain networks including cognitive control/attentional, emotion regulation, and viscero- and somato-sensory networks to determine personal relevance of internal and external stimuli. In addition, anterior insula outputs to subcortical regions play an important role in adjusting descending pain modulation and autonomic nervous system responses in accordance with stimulus salience. [10; 52] [7–9; 52]. Of interest, smaller anterior insula volumes have been associated with lower rectal sensory perception thresholds in HCs [19]. Support for alterations in the processing of auditory stimuli have been reported in IBS and other functional pain disorders [2; 3]. In fact, a lack of habituation and potentiated prepulse inhibition to auditory stimuli suggest enhancement of pre-attentive processing suggestive of hypervigilance in IBS [5; 32]. Functional alterations in the dorsal attention network in IBS have also been described [27; 38]. In sum, the current data support the role of a multimodal brain signature comprised by salience, sensory, and autonomic regions in discriminating IBS from HCs.
Correlation of brain signatures with behavioral and clinical measures
We found that associations between structural brain signatures and symptom, clinical, and behavioral measures were weak. The only association that survived FDR correction was a small correlation between scores on the somato-sensory and motor signature and non-gastrointestinal somatic symptoms in HCs and IBS. Consistent with previous observations, these findings indicate that symptom based measures are poorly correlated with non-evoked morphological brain signatures. Self-reported symptoms may show stronger relationships with measures of structural or functional connectivity between brain regions as previously shown [26; 65]. One might hypothesize that structural brain signatures which develop over many years, will be more correlated with biological measures, including immune system alterations [28] rather than acute symptom severity.
Strengths and Limitations
The multivariate processing pipeline used in this study made it possible to examine not only volume and mean cortical thickness, but also additional measures including mean curvature and surface area. No one measure emerged as sufficient for discriminating the groups supporting this multivariate approach. Especially important as a morphometric measure for discriminating groups was mean curvature which represents cortical folding and indexes complexity of gyri. This exploratory analysis, combined with replication in an independent sample, compliments previous hypothesis driven approaches and provides new hypotheses regarding alterations in the processing of sensorimotor signals in IBS patients.
Whether the observed brain signatures are specific to IBS or generalizable to other, often overlapping chronic pain conditions or affective disorders remains to be tested. In the future, we hope to achieve the sample sizes necessary to generate a multiclass (multiple chronic pain disorders) discrimination algorithm using the growing Pain and Interoception Imaging Network (PAIN), a multimodal, multisite, brain-imaging repository for chronic somatic and visceral pain disorders (painrepository.org)[1]. Furthermore, this classifier has been developed in female subjects and does not provide evidence for inferences regarding IBS in males. To achieve an appropriately sized test and training set, we combined data obtained using slightly different structural acquisition parameters. Greater standardization of acquisition protocols is certainly desirable for exact parameter estimation and explaining variance in gray matter. However, despite this variability we were still able to discriminate groups, a finding that underscores the power of the technique.
Conclusion and possible pathophysiological implications
Alterations in sensorimotor regions dominated the morphometry-based classifier. Similar findings have been demonstrated in other chronic functional pain disorders suggesting a central role of these changes in the pathophysiology of chronic functional pain. It remains to be determined if these changes reflect chronically altered signaling from the viscera to the brain, if they are a vulnerability factor predating the onset of IBS symptoms, or if they play a primary role in symptom generation. Big data approaches such as MVPA provide an opportunity for new insights into pathophysiological mechanisms in IBS. This line of research, while still in its infancy, may provide information important in the future identification of therapeutic targets and in the development of tailored patient treatments. The predictive accuracy of this morphometric classifier is certainly not sufficient but provides support for the feasibility of this approach in examining central mechanisms in IBS. Future studies will examine the utility of resting state and anatomical (white matter) connectivity and network metrics in discriminating IBS from HCs.
Supplementary Material
Estimates of total gray matter volume with 95% confidence intervals for each structural MRI acquisition protocol after controlling for age in healthy controls (A) and subjects with irritable bowel syndrome (B).
Depicts the 50 most frequently selected variables across all cross-validation runs for each component. Variable are color coded. For abbreviations see Table 1. Abbreviations: CT=cortical thickness, L =left, MC=mean curvature, R=right, SA=surface area, V=Volume.
Acknowledgments
This research was supported in part by grants from the National Institutes of Health: R01 DK048351 (EAM), P50DK64539 (EAM), R01 AT007137 (KT), K23 DK073451 (KT), K08 DK071626 (JSL), R03 DK084169 (JSL). Pilot scans were provided by the Ahmanson-Lovelace Brain Mapping Center, UCLA. The authors would like to especially thank Kim-Ahn Lê Cao and the mixOmics team for their technical assistance.
Footnotes
Disclosures: The authors declare no competing financial interests
The authors report no conflict of interest.
References
- 1.Pain and Interoception Imaging Network. 2015 [Google Scholar]
- 2.Andresen V, Bach DR, Poellinger A, Tsrouya C, Stroh A, Foerschler A, Georgiewa P, Zimmer C, Monnikes H. Brain activation responses to subliminal or supraliminal rectal stimuli and to auditory stimuli in irritable bowel syndrome. Neurogastroenterology and motility : the official journal of the European Gastrointestinal Motility Society. 2005;17(6):827–837. doi: 10.1111/j.1365-2982.2005.00720.x. [DOI] [PubMed] [Google Scholar]
- 3.Andresen V, Poellinger A, Tsrouya C, Bach D, Stroh A, Foerschler A, Georgiewa P, Schmidtmann M, van der Voort IR, Kobelt P, Zimmer C, Wiedenmann B, Klapp BF, Monnikes H. Cerebral processing of auditory stimuli in patients with irritable bowel syndrome. World journal of gastroenterology : WJG. 2006;12(11):1723–1729. doi: 10.3748/wjg.v12.i11.1723. [DOI] [PMC free article] [PubMed] [Google Scholar]
- 4.Bagarinao E, Johnson KA, Martucci KT, Ichesco E, Farmer MA, Labus J, Ness TJ, Harris R, Deutsch G, Apkarian AV, Mayer EA, Clauw DJ, Mackey S. Preliminary structural MRI based brain classification of chronic pelvic pain: A MAPP network study. Pain. 2014 doi: 10.1016/j.pain.2014.09.002. [DOI] [PMC free article] [PubMed] [Google Scholar]
- 5.Berman SM, Naliboff BD, Chang L, Fitzgerald L, Antolin T, Camplone A, Mayer EA. Enhanced preattentive central nervous system reactivity in irritable bowel syndrome. The American journal of gastroenterology. 2002;97(11):2791–2797. doi: 10.1111/j.1572-0241.2002.07024.x. [DOI] [PubMed] [Google Scholar]
- 6.Bray S, Chang C, Hoeft F. Applications of multivariate pattern classification analyses in developmental neuroimaging of healthy and clinical populations. Frontiers in human neuroscience. 2009;3:32. doi: 10.3389/neuro.09.032.2009. [DOI] [PMC free article] [PubMed] [Google Scholar]
- 7.Craig AD. How do you feel? Interoception: the sense of the physiological condition of the body Nature reviews Neuroscience. 2002;3(8):655–666. doi: 10.1038/nrn894. [DOI] [PubMed] [Google Scholar]
- 8.Craig AD. How do you feel--now? The anterior insula and human awareness Nature reviews Neuroscience. 2009;10(1):59–70. doi: 10.1038/nrn2555. [DOI] [PubMed] [Google Scholar]
- 9.Craig AD. Significance of the insula for the evolution of human awareness of feelings from the body. Annals of the New York Academy of Sciences. 2011;1225:72–82. doi: 10.1111/j.1749-6632.2011.05990.x. [DOI] [PubMed] [Google Scholar]
- 10.Craig AD. An interoceptive neuroanatomical perspective on feelings, energy, and effort. The Behavioral and brain sciences. 2013;36(6):685–686. doi: 10.1017/S0140525X13001489. discussion 707–626. [DOI] [PubMed] [Google Scholar]
- 11.Dale AM, Fischl B, Sereno MI. Cortical surface-based analysis - I. Segmentation and surface reconstruction NeuroImage. 1999;9(2):179–194. doi: 10.1006/nimg.1998.0395. [DOI] [PubMed] [Google Scholar]
- 12.DaSilva AF, Granziera C, Snyder J, Hadjikhani N. Thickening in the somatosensory cortex of patients with migraine. Neurology. 2007;69(21):1990–1995. doi: 10.1212/01.wnl.0000291618.32247.2d. [DOI] [PMC free article] [PubMed] [Google Scholar]
- 13.Desikan RS, Segonne F, Fischl B, Quinn BT, Dickerson BC, Blacker D, Buckner RL, Dale AM, Maguire RP, Hyman BT, Albert MS, Killiany RJ. An automated labeling system for subdividing the human cerebral cortex on MRI scans into gyral based regions of interest. NeuroImage. 2006;31(3):968–980. doi: 10.1016/j.neuroimage.2006.01.021. [DOI] [PubMed] [Google Scholar]
- 14.Desouza DD, Moayedi M, Chen DQ, Davis KD, Hodaie M. Sensorimotor and Pain Modulation Brain Abnormalities in Trigeminal Neuralgia: A Paroxysmal, Sensory-Triggered Neuropathic Pain. PloS one. 2013;8(6):e66340. doi: 10.1371/journal.pone.0066340. [DOI] [PMC free article] [PubMed] [Google Scholar]
- 15.Destrieux C, Fischl B, Dale A, Halgren E. Automatic parcellation of human cortical gyri and sulci using standard anatomical nomenclature. NeuroImage. 2010;53(1):1–15. doi: 10.1016/j.neuroimage.2010.06.010. [DOI] [PMC free article] [PubMed] [Google Scholar]
- 16.Drevets WC, Savitz J, Trimble M. The subgenual anterior cingulate cortex in mood disorders. CNS spectrums. 2008;13(8):663–681. doi: 10.1017/s1092852900013754. [DOI] [PMC free article] [PubMed] [Google Scholar]
- 17.Drossman DA. The functional gastrointestinal disorders and the Rome III process. Gastroenterology. 2006;130(5):1377–1390. doi: 10.1053/j.gastro.2006.03.008. [DOI] [PubMed] [Google Scholar]
- 18.Ellingson BM, Mayer E, Harris RJ, Ashe-McNally C, Naliboff BD, Labus JS, Tillisch K. Diffusion tensor imaging detects microstructural reorganization in the brain associated with chronic irritable bowel syndrome. Pain. 2013;154(9):1528–1541. doi: 10.1016/j.pain.2013.04.010. [DOI] [PMC free article] [PubMed] [Google Scholar]
- 19.Elsenbruch S, Schmid J, Kullmann JS, Kattoor J, Theysohn N, Forsting M, Kotsis V. Visceral sensitivity correlates with decreased regional gray matter volume in healthy volunteers: a voxel-based morphometry study. Pain. 2014;155(2):244–249. doi: 10.1016/j.pain.2013.09.027. [DOI] [PubMed] [Google Scholar]
- 20.Erpelding N, Moayedi M, Davis KD. Cortical thickness correlates of pain and temperature sensitivity. Pain. 2012;153(8):1602–1609. doi: 10.1016/j.pain.2012.03.012. [DOI] [PubMed] [Google Scholar]
- 21.Fischl B, Salat DH, Busa E, Albert M, Dieterich M, Haselgrove C, van der Kouwe A, Killiany R, Kennedy D, Klaveness S, Montillo A, Makris N, Rosen B, Dale AM. Whole brain segmentation: automated labeling of neuroanatomical structures in the human brain. Neuron. 2002;33(3):341–355. doi: 10.1016/s0896-6273(02)00569-x. [DOI] [PubMed] [Google Scholar]
- 22.Fischl B, Sereno MI, Dale AM. Cortical surface-based analysis - II: Inflation, flattening, and a surface-based coordinate system. NeuroImage. 1999;9(2):195–207. doi: 10.1006/nimg.1998.0396. [DOI] [PubMed] [Google Scholar]
- 23.Gupta A, Kilpatrick L, Labus J, Tillisch K, Braun A, Hong JY, Ashe-McNalley C, Naliboff B, Mayer EA. Early adverse life events and resting state neural networks in patients with chronic abdominal pain: evidence for sex differences. Psychosomatic medicine. 2014;76(6):404–412. doi: 10.1097/PSY.0000000000000089. [DOI] [PMC free article] [PubMed] [Google Scholar]
- 24.Gupta A, Rapkin A, Gill Z, Kilpatrick L, Fling C, Stains J, Masghati S, Tillisch K, Mayer E, Labus J. Disease-Related Differences in Resting State Networks: A Comparison between Localized Provoked Vulvodynia, Irritable Bowel Syndrome, and Healthy Control Subjects. Pain. 2015 doi: 10.1097/01.j.pain.0000461289.65571.54. In Press. [DOI] [PMC free article] [PubMed] [Google Scholar]
- 25.Hong JY, Kilpatrick LA, Labus J, Gupta A, Jiang Z, Ashe-McNalley C, Stains J, Heendeniya N, Ebrat B, Smith S, Tillisch K, Naliboff B, Mayer EA. Patients with chronic visceral pain show sex-related alterations in intrinsic oscillations of the resting brain. The Journal of neuroscience : the official journal of the Society for Neuroscience. 2013;33(29):11994–12002. doi: 10.1523/JNEUROSCI.5733-12.2013. [DOI] [PMC free article] [PubMed] [Google Scholar]
- 26.Hong JY, Labus JS, Kilpatrick LA, Stains J, Heendeniya N, Smith SR, Katibian D, Tillisch K, Mayer EA. Patients With Irritable Bowel Syndrome Show Sex Related Differences in Resting-State Functional Connectivity. Gastroenterology. 2014;146(5):S-847. [Google Scholar]
- 27.Hubbard CS, Mayer EA, Hong JY, Ebrat B, Smith SR, Heendeniya N, Tillisch K, Naliboff B, Labus JS. IBS Patients Show Altered Behavioral and Functional Brain Responses During an Orienting Attention Task. Gastroenterology. 2012;145(5):S-547. [Google Scholar]
- 28.Irwin MR, Cole SW. Reciprocal regulation of the neural and innate immune systems. Nature reviews Immunology. 2011;11(9):625–632. doi: 10.1038/nri3042. [DOI] [PMC free article] [PubMed] [Google Scholar]
- 29.Jiang Z, Dinov ID, Labus J, Shi Y, Zamanyan A, Gupta A, Ashe-McNalley C, Hong JY, Tillisch K, Toga AW, Mayer EA. Sex-related differences of cortical thickness in patients with chronic abdominal pain. PloS one. 2013;8(9):e73932. doi: 10.1371/journal.pone.0073932. [DOI] [PMC free article] [PubMed] [Google Scholar]
- 30.Kairys AE, Schmidt-Wilcke T, Puiu T, Ichesco E, Labus JS, Martucci K, Farmer MA, Ness TJ, Deutsch G, Mayer EA, Mackey S, Apkarian AV, Maravilla K, Clauw DJ, Harris RE. Increased brain gray matter in the primary somatosensory cortex is associated with increased pain and mood disturbance in patients with interstitial cystitis/painful bladder syndrome. The Journal of urology. 2015;193(1):131–137. doi: 10.1016/j.juro.2014.08.042. [DOI] [PMC free article] [PubMed] [Google Scholar]
- 31.Kilpatrick LA, Kutch JJ, Tillisch K, Naliboff BD, Labus JS, Jiang Z, Farmer MA, Apkarian AV, Mackey S, Martucci KT, Clauw DJ, Harris RE, Deutsch G, Ness TJ, Yang CC, Maravilla K, Mullins C, Mayer EA. Alterations in Resting State Oscillations and Connectivity in Sensory and Motor Networks in Women with Interstitial Cystitis/Painful Bladder Syndrome. The Journal of urology. 2014 doi: 10.1016/j.juro.2014.03.093. [DOI] [PMC free article] [PubMed] [Google Scholar]
- 32.Kilpatrick LA, Ornitz E, Ibrahimovic H, Treanor M, Craske M, Nazarian M, Labus JS, Mayer EA, Naliboff BD. Sex-related differences in prepulse inhibition of startle in irritable bowel syndrome (IBS) Biological psychology. 2010;84(2):272–278. doi: 10.1016/j.biopsycho.2010.02.012. [DOI] [PMC free article] [PubMed] [Google Scholar]
- 33.Kim JY, Kim SH, Seo J, Han SW, Nam EJ, Kim SK, Lee HJ, Lee SJ, Kim YT, Chang Y. Increased power spectral density in resting-state pain-related brain networks in fibromyalgia. Pain. 2013;154(9):1792–1797. doi: 10.1016/j.pain.2013.05.040. [DOI] [PubMed] [Google Scholar]
- 34.Kloppel S, Abdulkadir A, Jack CR, Jr, Koutsouleris N, Mourao-Miranda J, Vemuri P. Diagnostic neuroimaging across diseases. NeuroImage. 2012;61(2):457–463. doi: 10.1016/j.neuroimage.2011.11.002. [DOI] [PMC free article] [PubMed] [Google Scholar]
- 35.Krishnan A, Williams LJ, McIntosh AR, Abdi H. Partial Least Squares (PLS) methods for neuroimaging: a tutorial and review. NeuroImage. 2011;56(2):455–475. doi: 10.1016/j.neuroimage.2010.07.034. [DOI] [PubMed] [Google Scholar]
- 36.Kroenke K, Spitzer RL, Williams JB. The PHQ-15: validity of a new measure for evaluating the severity of somatic symptoms. Psychosomatic medicine. 2002;64(2):258–266. doi: 10.1097/00006842-200203000-00008. [DOI] [PubMed] [Google Scholar]
- 37.Labus JS, Dinov ID, Jiang Z, Ashe-McNalley C, Zamanyan A, Shi Y, Hong JY, Gupta A, Tillisch K, Ebrat B, Hobel S, Gutman BA, Joshi S, Thompson PM, Toga AW, Mayer EA. Irritable bowel syndrome in female patients is associated with alterations in structural brain networks. Pain. 2014;155(1):137–149. doi: 10.1016/j.pain.2013.09.020. [DOI] [PMC free article] [PubMed] [Google Scholar]
- 38.Labus JS, Naliboff BD, Berman SM, Suyenobu B, Vianna EP, Tillisch K, Mayer EA. Brain networks underlying perceptual habituation to repeated aversive visceral stimuli in patients with irritable bowel syndrome. NeuroImage. 2009;47(3):952–960. doi: 10.1016/j.neuroimage.2009.05.078. [DOI] [PMC free article] [PubMed] [Google Scholar]
- 39.Labus JS, Naliboff BN, Fallon J, Berman SM, Suyenobu B, Bueller JA, Mandelkern M, Mayer EA. Sex differences in brain activity during aversive visceral stimulation and its expectation in patients with chronic abdominal pain: a network analysis. NeuroImage. 2008;41(3):1032–1043. doi: 10.1016/j.neuroimage.2008.03.009. [DOI] [PMC free article] [PubMed] [Google Scholar]
- 40.Lê Cao KA, Boitard S, Besse P. Sparse PLS discriminant analysis: biologically relevant feature selection and graphical displays for multiclass problems. BMC bioinformatics. 2011;12:253. doi: 10.1186/1471-2105-12-253. [DOI] [PMC free article] [PubMed] [Google Scholar]
- 41.Lê Cao KA, Gonzalez I, Dejean S. integrOmics: an R package to unravel relationships between two omics datasets. Bioinformatics. 2009;25(21):2855–2856. doi: 10.1093/bioinformatics/btp515. [DOI] [PMC free article] [PubMed] [Google Scholar]
- 42.Lê Cao KA, Lê Gall C. Integration and variable selection of ‘omics’ data sets with PLS: a survey. Journal de la Société Française de Statistique. 2011;152 (2):77–96. [Google Scholar]
- 43.Lê Cao KA, Rossouw D, Robert-Granie C, Besse P. A sparse PLS for variable selection when integrating omics data. Statistical applications in genetics and molecular biology. 2008;7(1):Article 35. doi: 10.2202/1544-6115.1390. [DOI] [PubMed] [Google Scholar]
- 44.Le Floch E, Guillemot V, Frouin V, Pinel P, Lalanne C, Trinchera L, Tenenhaus A, Moreno A, Zilbovicius M, Bourgeron T, Dehaene S, Thirion B, Poline JB, Duchesnay E. Significant correlation between a set of genetic polymorphisms and a functional brain network revealed by feature selection and sparse Partial Least Squares. NeuroImage. 2012;63(1):11–24. doi: 10.1016/j.neuroimage.2012.06.061. [DOI] [PubMed] [Google Scholar]
- 45.Levinthal DJ, Strick PL. The motor cortex communicates with the kidney. The Journal of neuroscience : the official journal of the Society for Neuroscience. 2012;32(19):6726–6731. doi: 10.1523/JNEUROSCI.0406-12.2012. [DOI] [PMC free article] [PubMed] [Google Scholar]
- 46.Light KC, Bragdon EE, Grewen KM, Brownley KA, Girdler SS, Maixner W. Adrenergic dysregulation and pain with and without acute beta-blockade in women with fibromyalgia and temporomandibular disorder. The journal of pain : official journal of the American Pain Society. 2009;10(5):542–552. doi: 10.1016/j.jpain.2008.12.006. [DOI] [PMC free article] [PubMed] [Google Scholar]
- 47.Liu PQW, Wang J, Zeng F, Zhou G, Wen H, von Deneen KM, Liang F, Gong Q, Tian J. Identifying neural patterns of functional dyspepsia using multivariate pattern analysis: a resting-state FMRI study. PLoS One 2013. 2013;8(7):e68205. doi: 10.1371/journal.pone.0068205. [DOI] [PMC free article] [PubMed] [Google Scholar]
- 48.Liu Q, Wang EM, Yan XJ, Chen SL. Autonomic functioning in irritable bowel syndrome measured by heart rate variability: a meta-analysis. Journal of digestive diseases. 2013;14(12):638–646. doi: 10.1111/1751-2980.12092. [DOI] [PubMed] [Google Scholar]
- 49.Mayer EA, Tillisch K. The brain-gut axis in abdominal pain syndromes. Annual review of medicine. 2011;62:381–396. doi: 10.1146/annurev-med-012309-103958. [DOI] [PMC free article] [PubMed] [Google Scholar]
- 50.McIntosh AR, Bookstein FL, Haxby JV, Grady CL. Spatial pattern analysis of functional brain images using partial least squares. NeuroImage. 1996;3(3 Pt 1):143–157. doi: 10.1006/nimg.1996.0016. [DOI] [PubMed] [Google Scholar]
- 51.Mehmood T, Liland K, Snipen L, Solve S. A review of variable selection methods in Partial Least Squares Regression. Chemometrics and Intelligent Laboratory Systems. 2012;118:62–69. [Google Scholar]
- 52.Menon V, Uddin LQ. Saliency, switching, attention and control: a network model of insula function. Brain structure & function. 2010;214(5–6):655–667. doi: 10.1007/s00429-010-0262-0. [DOI] [PMC free article] [PubMed] [Google Scholar]
- 53.Moayedi M, Weissman-Fogel I, Crawley AP, Goldberg MB, Freeman BV, Tenenbaum HC, Davis KD. Contribution of chronic pain and neuroticism to abnormal forebrain gray matter in patients with temporomandibular disorder. NeuroImage. 2011;55(1):277–286. doi: 10.1016/j.neuroimage.2010.12.013. [DOI] [PubMed] [Google Scholar]
- 54.Moayedi M, Weissman-Fogel I, Salomons TV, Crawley AP, Goldberg MB, Freeman BV, Tenenbaum HC, Davis KD. Abnormal gray matter aging in chronic pain patients. Brain research. 2012;1456:82–93. doi: 10.1016/j.brainres.2012.03.040. [DOI] [PubMed] [Google Scholar]
- 55.Nan J, Liu J, Li G, Xiong S, Yan X, Yin Q, Zeng F, von Deneen KM, Liang F, Gong Q, Qin W, Tian J. Whole-brain functional connectivity identification of functional dyspepsia. PloS one. 2013;8(6):e65870. doi: 10.1371/journal.pone.0065870. [DOI] [PMC free article] [PubMed] [Google Scholar]
- 56.Pike N. Using false discovery rates for multiple comparisons in ecology and evolution. Methods in ecology and Evolution. 2010;2(3):278–282. [Google Scholar]
- 57.Rosa MJ, Seymour B. Decoding the matrix: benefits and limitations of applying machine learning algorithms to pain neuroimaging. Pain. 2014;155(5):864–867. doi: 10.1016/j.pain.2014.02.013. [DOI] [PubMed] [Google Scholar]
- 58.Sheehan DV, Lecrubier Y, Sheehan KH, Amorim P, Janavs J, Weiller E, Hergueta T, Baker R, Dunbar GC. The Mini-International Neuropsychiatric Interview (M.I.N.I): the development and validation of a structured diagnostic psychiatric interview for DSM-IV and ICD-10. The Journal of clinical psychiatry. 1998;59 (Suppl 20):22–33. quiz 34–57. [PubMed] [Google Scholar]
- 59.Taylor JM, Ankerst DP, Andridge RR. Validation of biomarker-based risk prediction models. Clinical cancer research : an official journal of the American Association for Cancer Research. 2008;14(19):5977–5983. doi: 10.1158/1078-0432.CCR-07-4534. [DOI] [PMC free article] [PubMed] [Google Scholar]
- 60.Tillisch K, Mayer EA, Labus JS. Quantitative meta-analysis identifies brain regions activated during rectal distension in irritable bowel syndrome. Gastroenterology. 2011;140(1):91–100. doi: 10.1053/j.gastro.2010.07.053. [DOI] [PMC free article] [PubMed] [Google Scholar]
- 61.Tillisch K, Mayer EA, Labus JS, Stains J, Chang L, Naliboff BD. Sex specific alterations in autonomic function among patients with irritable bowel syndrome. Gut. 2005;54(10):1396–1401. doi: 10.1136/gut.2004.058685. [DOI] [PMC free article] [PubMed] [Google Scholar]
- 62.Ung H, Brown JE, Johnson KA, Younger J, Hush J, Mackey S. Multivariate Classification of Structural MRI Data Detects Chronic Low Back Pain. Cereb Cortex. 2012 doi: 10.1093/cercor/bhs378. [DOI] [PMC free article] [PubMed] [Google Scholar]
- 63.Van Hoesen GW, Morecraft RJ, Vogt BA. Connections of the monkey cingulate cotex. In: Vogt BA, GM, editors. Neurobiology of the cingulate and limbic thalamus. Boston: Birkhäuser; 1993. pp. 249–284. [Google Scholar]
- 64.Whitehead WE, Palsson O, Jones KR. Systematic review of the comorbidity of irritable bowel syndrome with other disorders: what are the causes and implications? Gastroenterology. 2002;122(4):1140–1156. doi: 10.1053/gast.2002.32392. [DOI] [PubMed] [Google Scholar]
- 65.Wiech K, Jbabdi S, Lin CS, Andersson J, Tracey I. Differential structural and resting state connectivity between insular subdivisions and other pain-related brain regions. Pain. 2014 doi: 10.1016/j.pain.2014.07.009. [DOI] [PMC free article] [PubMed] [Google Scholar]
- 66.Zigmond AS, Snaith RP. The hospital anxiety and depression scale. Acta psychiatrica Scandinavica. 1983;67(6):361–370. doi: 10.1111/j.1600-0447.1983.tb09716.x. [DOI] [PubMed] [Google Scholar]
Associated Data
This section collects any data citations, data availability statements, or supplementary materials included in this article.
Supplementary Materials
Estimates of total gray matter volume with 95% confidence intervals for each structural MRI acquisition protocol after controlling for age in healthy controls (A) and subjects with irritable bowel syndrome (B).
Depicts the 50 most frequently selected variables across all cross-validation runs for each component. Variable are color coded. For abbreviations see Table 1. Abbreviations: CT=cortical thickness, L =left, MC=mean curvature, R=right, SA=surface area, V=Volume.