

Background: Targeting of proteins requires a signal recognition particle (SRP) and multiple protein interactions.
Results: We observed a decrease in the structural dynamics of cpSRP43 and an increase in substrate affinity upon its binding to cpSRP54.
Conclusion: Changes in domain dynamics induced by cpSRP subunit interactions mediate substrate affinity.
Significance: Relating structure and dynamics of SRP proteins allows for a better understanding of vectorial targeting within cells.
Keywords: chloroplast, isothermal titration calorimetry (ITC), membrane transport, molecular dynamics, protein dynamic, protein targeting, signal recognition particle (SRP), single molecule biophysics
Abstract
Protein targeting is critical in all living organisms and involves a signal recognition particle (SRP), an SRP receptor, and a translocase. In co-translational targeting, interactions among these proteins are mediated by the ribosome. In chloroplasts, the light-harvesting chlorophyll-binding protein (LHCP) in the thylakoid membrane is targeted post-translationally without a ribosome. A multidomain chloroplast-specific subunit of the SRP, cpSRP43, is proposed to take on the role of coordinating the sequence of targeting events. Here, we demonstrate that cpSRP43 exhibits significant interdomain dynamics that are reduced upon binding its SRP binding partner, cpSRP54. We showed that the affinity of cpSRP43 for the binding motif of LHCP (L18) increases when cpSRP43 is complexed to the binding motif of cpSRP54 (cpSRP54pep). These results support the conclusion that substrate binding to the chloroplast SRP is modulated by protein structural dynamics in which a major role of cpSRP54 is to improve substrate binding efficiency to the cpSRP.
Introduction
Protein targeting in cells occurs via a wide variety of sorting pathways depending on both the synthesis site and target location of the protein. Some proteins are targeted co-translationally with central involvement of the ribosome, whereas other proteins are targeted post-translationally. For example, in chloroplasts, nuclearly encoded thylakoid proteins are routed from the stroma to the thylakoid membrane following their import from the cytosol via multiple pathways (1, 2). The multiple pathways accommodate the various transport requirements of a broad range of proteins that function in the thylakoid lumen or in the lipid bilayer. One of the most important of these nuclearly encoded proteins is the light-harvesting chlorophyll-binding proteins (LHCPs).4 A unique chloroplast signal recognition particle (cpSRP) pathway has evolved in the stroma to target this protein without the need for the ribosome to coordinate the sequence of targeting events. Similar to SRPs in the cytosol of pro- and eukaryotes, cpSRP in the stroma contains a conserved 54-kDa GTPase (cpSRP54), although an RNA moiety is conspicuously absent (3). Fractionation of chloroplast stroma proteins demonstrated that cpSRP54 is present in two pools (4). One pool is associated with ribosomes and appears to function in co-translational targeting of proteins to the chloroplast. A second cpSRP54 pool is present in a heterodimeric complex bound to cpSRP43, a 43-kDa protein that is unique to chloroplasts (5–7). The cpSRP heterodimer functions post-translationally to bind and target full-length LHCP targeting substrates to the thylakoid membrane by a ribosome-independent mechanism (3). cpSRP43 therefore appears to take on the role of the ribosome in coordinating the sequence of protein targeting events.
The only known targeting substrates of the post-translational cpSRP localization pathway are LHCPs, a protein family encoded by lhca and lhcb genes in Arabidopsis. LHCPs coordinate pigment binding in peripheral photosystem 1 and 2 light-harvesting complexes. The importance of the post-translational cpSRP-based targeting mechanism is apparent when considering that LHCPs can account for up to 50% of the bulk protein in thylakoids, making them one of the most abundant membrane proteins on earth (8). Like other nuclearly encoded thylakoid proteins, LHCPs are synthesized in the cytosol as full-length precursor proteins and imported into the chloroplast stroma as directed by a cleavable N-terminal chloroplast-targeting domain (1, 2). Processing of the chloroplast targeting peptide yields a mature sized LHCP in the stroma that is targeted to thylakoid membranes as a soluble cpSRP-LHCP complex termed “transit complex” (4, 7, 9).
Binding of LHCP to cpSRP serves to maintain the solubility and insertion competence of LHCPs (10). In vitro studies demonstrate that addition of LHCPs to heterodimeric cpSRP, but not to cpSRP54 or cpSRP43 alone, reconstitutes transit complex formation and supports LHCP insertion into isolated thylakoids by a mechanism that requires GTP, the protein insertase Albino3 (Alb3), and cpFtsY, a GTPase homologue of the SRP receptor in bacteria (3, 11). Cross-linking studies indicate that cpSRP54 interacts with LHCPs in transit complex (6), but cpSRP54 alone shows no binding to LHCPs. In contrast, cpSRP43 alone and in transit complex binds LHCPs because of its interaction with a conserved LHCP motif, termed L18 (12, 13). This interaction is required for transit complex formation and for ATP-independent chaperone activity exhibited by cpSRP43 alone (14, 15). The cpSRP43 chaperone activity is likely important for efficient transit complex formation that leads to additional interaction of LHCP transmembrane domains 2 and 3 with cpSRP43 (16, 17). Vectorial light-harvesting complex targeting to the thylakoid membrane relies on both cpSRP subunits. cpSRP54 exhibits affinity for lipid-bound cpFtsY (18), and cpSRP43 interacts with Alb3 (19–21). The timing of both LHCP release from cpSRP and release of cpSRP from its membrane-bound receptor is triggered by interaction between cpSRP43 with Alb3 (19). The central importance of cpSRP43 is underscored by its range of interaction partners and the abundance of interaction domains that dominate its structure: three chromatin-binding domains (CDs) and four Ankyrin repeats (Anks) (3). We hypothesize that the order of these interactions will be controlled through changes in cpSRP43 structural dynamics that alter the relative position of these domains in response to association of cpSRP43 with each of its binding partners. It is this hypothesis that forms the basis of the present study.
Single molecule fluorescence has proven to be extremely powerful for studying the biophysics of complex biological systems, such as folding of proteins and RNA (22–26), biomolecular diffusion on membranes and cells (27–30), protein-protein interactions (31), and protein conformational dynamics (32–34). In this study, we used single molecule FRET (smFRET) (35, 36) to probe the interdomain conformational dynamics of cpSRP43 and how they are affected by binding cpSRP54. We used the crystal (17, 37) and NMR structures (38) as well as SAXS data (15) of cpSRP43 to design mutants for site-specific labeling within its various domains for the smFRET studies. All-atom and coarse grained molecular dynamics simulations are used to support the smFRET data and provide more detailed structural models. Our results show that cpSRP43 alone exhibits wide interdomain conformational dynamic heterogeneity (i.e. high flexibility) but upon binding to cpSRP54 shows reduced regional flexibility. We hypothesized that this reduced flexibility favors binding of LHCP targeting substrates, and this was then tested using isothermal titration calorimetry (ITC). We found that the affinity of cpSRP43 for L18 increased by ∼3-fold when cpSRP43 was complexed with a cpSRP54 peptide that corresponds to the cpSRP43 binding site on cpSRP54. Together, these findings support a model in which cpSRP54 modulates the structural dynamics of cpSRP43, which is critical for the promotion of efficient binding and localization of LHCP targeting substrates.
Experimental Procedures
Protein Cloning, Expression, Purification, and Quantification
For our smFRET experiments, we designed six cpSRP43 constructs, each having two cysteine residues for specifically labeling with Alexa Fluor 488 and Alexa Fluor 594 or Alexa Fluor 546 (see Table 1). Among the six double Cys cpSRP43 proteins, P1, P2, P3, P4, and P5 are full-length cpSRP43 (GenBank accession number AAD01509, residues 60–376), and P4Δ contains only the CD2 and CD3 domains (residues 268–376). Endogenous Cys residues are found at positions 179 (Ank2) and 301 (CD2); these sites were mutated to Ala when the Cys residues were desired in a different location. Additional Cys residues were introduced at amino acid positions 89 (CD1), 181 (Ank2), 265 (Ank4), and 333 (CD3). Briefly, primer-encoded point mutations were introduced into the coding sequence of mature cpSRP43 (starting with amino acid sequence AAVQRN) by PCR. The resulting product was cloned into pGEX-6P-2 (GE Healthcare) using BamHI and EcoRI sites. All constructs were sequence-verified by Molecular Resource Laboratory, University of Arkansas for Medical Sciences, Little Rock, AR. Each plasmid was then transformed into BL21 Star for isopropyl 1-thio-β-d-galactopyranoside-induced expression followed by affinity purification and tag cleavage as described previously (19). The concentration of purified protein was estimated by Coomassie Blue staining using bovine serum albumin as a standard.
TABLE 1.
Mature cpSRP43 (mcpSRP43) mutants used in this study
| Designation | Site descriptions | Domains labeled |
|---|---|---|
| P1 | mcpSRP43 C179A, R181C, C301A, R333C | Ank2/CD3 |
| P2 | mcpSRP43 Cys-179, V265C, C301A | Ank2/Ank4 |
| P3 | mcpSRP43 wild type, Cys-179, Cys-301 | Ank2/CD2 |
| P4 | mcpSRP43 C179A, Cys-301, R333C | CD2/CD3 |
| P4Δ | CD2CD3, Cys-301, R333C | CD2/CD3 |
| P5 | mcpSRP43 E89C, Cys-179, C301A | CD1/Ank2 |
Fluorescence Labeling
Two labeling strategies were used for our experiments. First, to determine whether labeling affects the integration efficiency, we used a large dye:protein ratio to ensure that no unlabeled protein was left but with the possibility of increasing nonspecific labeling. Second, since smFRET experiments require that there be as little nonspecific labeling as possible, and because unlabeled proteins do not interfere with the smFRET assay, underlabeling is preferable to overlabeling. Thus, to label cpSRP43 for testing the integration efficiency, 20 μm single cysteine mutants of cpSRP43 were incubated with 2 mm Alexa Fluor 488-C5-maleimide in pH 6.8 PBS buffer at room temperature for 30 min. To label double cysteine mutants of cpSRP43 for smFRET experiments, 20 μm double-cysteine mutants of cpSRP43 were incubated with 0.1 mm Alexa Fluor 488-C5-maleimide and 0.2 mm Alexa Fluor 594-C5-maleimide (or 0.2 mm Alexa Fluor 546-C5-maleimide) in pH 6.8 PBS buffer at room temperature for 30 min. A cysteine-free mutant of cpSRP43 was used to test for nonspecific dye labeling. In all cases, labeled cpSRP43 was then separated from excess free dyes using a Bio-Gel P-6DG desalting gel filtration column and HKM elution buffer (10 mm HEPES, 10 mm MgCl2, and 100 mm KCl). The ensemble fluorescence spectra were measured with a PerkinElmer Life Sciences LS55 fluorometer with excitation at 485 nm. The average labeling efficiency (dye:protein ratio) upon using the large excess of dyes to ensure maximal labeling for the integration assays was consistent for all mutants and found to be ∼1:1.7, suggesting some degree of nonspecific binding at this high dye concentration. For the FRET-labeled cpSRP43, it can be expected that there is a mixture of single donor- or single acceptor-labeled protein, double donor- or double acceptor-labeled protein, and single donor-acceptor (FRET-labeled) protein due to simultaneous statistical dye labeling. Because single or double donor only-labeled proteins contribute to the zero FRET peak, the dye concentrations were chosen to ensure a low amount of donor only-labeled protein compared with acceptor only-labeled protein. The average labeling efficiency for using the lower dye:protein ratios was similar for all double cysteine mutants and found to be ∼1:0.2:0.4 (protein:donor:acceptor), ensuring that underlabeling did indeed occur. Control experiments confirmed that single or double acceptor only-labeled cpSRP43 proteins are not detectable in our single molecule experiments due to the low excitation probability of the acceptor dye with 485 nm light.
Integration Activity of Labeled Proteins
Labeled proteins were examined for their ability to support integration as described previously (18). Briefly, thylakoids were isolated from 10–12-day-old pea seedlings and salt-washed. In vitro transcribed LHCP was translated using [35S]methionine in a wheat germ system to produce radiolabeled LHCP (translation product). Salt-washed thylakoids, translation product, recombinant cpSRP54, recombinant cpFtsY, GTP, and appropriate cpSRP43 construct were incubated at 25 °C for 30 min under light. Thylakoids were reisolated, washed, and protease-treated for analysis by SDS-PAGE and phosphorimaging. The shift in size of the translation product to a smaller fragment is characteristic of LHCP that is properly inserted into the thylakoid membrane and hence partially protease-protected.
Single Molecule FRET Experiments and Data Analysis
smFRET experiments were performed in pH 8.0 HKM buffer using a MicroTime 200 microscope (Picoquant GmbH, Berlin, Germany) controlled by SymPhoTime software from Picoquant, collecting fluorescence on a photon-by-photon basis. A water immersion objective with a numerical aperture of 1.3 was used for collecting single molecule fluorescence with a 100-μm pinhole used in the fluorescence detection path to suppress out-of-focus fluorescence. The excitation laser wavelength was 485 nm at a power of 75 microwatts. A dichroic mirror (FF562-Di03) was used for splitting the Alexa Fluor 488 and Alexa Fluor 594 or Alexa Fluor 546 fluorescence signals into two avalanche photodiode detectors. High quality fluorescence emission filters 520/35 and 620/60 or 605/55 were placed in front of each avalanche photodiode detector, respectively, for collecting the Alexa Fluor 488 and Alexa Fluor 594 or Alexa Fluor 546 fluorescence. The donor to acceptor leak-through was calculated to be 6% using Alexa Fluor 594 as the acceptor and 10% using Alexa Fluor 546 as the acceptor with a γ correction factor of 0.5. γ is used to balance the donor and acceptor signals and was determined by measuring the fluorescence intensities in the donor channel of bulk Alexa Fluor 488 solution and in the acceptor channel of bulk Alexa Fluor 594 or Alexa Fluor 546 solution that has the same A at 485 nm using the same experimental setup as for smFRET experiments. For smFRET experiments, the fluorescently labeled cpSRP43 protein concentration was ∼200 pm. The femtoliter confocal laser focus was placed ∼30 μm above the number 1 glass coverslip surface, collecting 20-min-long burst traces.
Diffusion smFRET experiments measured the fluorescence burst intensities of donor and acceptor dye-labeled single cpSRP43 proteins that diffuse through the femtoliter confocal laser focus with a diffusion time of ∼1–2 ms. The single molecule data analysis for obtaining smFRET histograms was performed on 1-ms binned two-color fluorescence traces generated from the SymPhoTime software from photon-by-photon data. Using home-made Matlab codes, the single protein bursts were selected out from the traces only when the total burst intensity meets the threshold of 15 counts/ms, and then the FRET value was calculated by E = IA/(IA + γID) with γ empirically determined to be 0.5. The smFRET histogram was then obtained from compiling the FRET values for all the detected bursts.
To check the rotational freedom of the dyes after being conjugated to the protein, the polarization of the emission from Alexa Fluor 488-labeled cpSRP43 proteins was measured using the same setup as FRET except that a polarizing beam splitter was placed in the emission pathway instead of the dichroic mirror. Because the exciting laser is polarized, the two detectors therefore measure the intensity of horizontal and vertical polarized emission following polarized excitation.
Fluorescence Correlation Spectroscopy
Fluorescence correlation spectroscopy experiments were carried out in the microscope with parameters identical to those in the smFRET experiments except that the labeled cpSRP43 was diluted to 1 nm concentration and then unlabeled, wild-type cpSRP54 was titrated in up to 3 μm concentration. The data were fit to a single diffusing species in the absence of cpSRP54 and when 3 μm cpSRP54 was added to obtain diffusion coefficients for the unbound cpSRP43 and bound complex, respectively. For intermediate concentrations, two diffusing species were fit with these fixed diffusion coefficients but with varying relative amplitudes from which the fraction of bound complex could be calculated.
Protein Immobilization
Alexa Fluor 488 and Alexa Fluor 546 FRET-labeled cpSRP43 proteins were subsequently labeled with biotin and purified using a Bio-Gel P-6DG desalting gel filtration column. cpSRP43 was then immobilized onto PEG-modified glass surfaces to enable the recording of two-color fluorescence traces from single cpSRP43 proteins. 10 μm FRET-labeled cpSRP43 was incubated with 20-fold molar excess sulfo-NHS-LC-LC-biotin (Thermo Scientific) at pH 8.0 for 2 h at 4 °C. The reaction mixture was then passed through a Bio-Gel P-6DG desalting gel filtration column to remove excess biotin. The PEG-modified glass surface was freshly made by adding 20 μl of 30 mg/ml silane-PEG-biotin and silane-PEG (Nanocs) at a 1:100 molar ratio in ethanol:water (95%:5% (v/v)) to a flow cell made of thoroughly cleaned glass coverslips bound by double-sided Scotch tape. The flow cells were allowed to incubate for 2 h at 4 °C and then thoroughly washed with Millipore water. Fluorescence images were taken before performing the single molecule FRET experiment to ensure that the background fluorescence from the surface was negligible.
All-atom Molecular Dynamics Simulations
The crystal structure for cpSRP43 CD1-CD2 (Protein Data Bank code 3UI2) was used for the 100-ns simulations (37). Two different structures were prepared, one containing the cpSRP54 peptide and one with the peptide removed. Both were equilibrated separately. Another construct in which the NMR CD3 structure (Protein Data Bank code 1X3P) was attached to the C terminus of the 3UI2 structure was produced (38). For this, structure 18 of 1X3P was submitted to the ModRefine server followed by energy minimization in SYBYL-X using the AMBER-FF99 force field. Next, the CD1-CD2 3UI2 structure and the refined CD3 structure were aligned with the cpSRP43 SAXS density produced from the dummy atom model (provided by the Shan group, Caltech) with Situs using a combination of manual and automated fitting in UCSF Chimera (15, 39, 40). Because fitting required adjusting the linking region between Ank4 and CD2 such that CD2 is distant from Ank4, and to keep the structure modifications to a minimum, this fitting was used as a guide to attach CD3 to CD2 in the unaltered 3UI2 structure. This structure was used in the simulations needed to prepare the shape-based coarse grained (SBCG) model.
After an initial minimization of the structure, the protein was solvated, leaving a minimum of 10-Å distance between the protein and the solvent box edge. The system was neutralized with NaCl, and the effective salt concentration was set to 0.150 m. To prepare the structure for production runs, the system was subjected to several refinement steps to relax the backbone, side chains, and surrounding water molecules and ions. Equilibration of the system was carried out in the NPT ensemble using NAMD 2.9 and the CHARMM27 force field (41, 42). A temperature of 300 K was maintained using Langevin dynamics with a damping coefficient of 1 ps−1. A constant pressure of 1 atm was maintained using the Langevin piston method with a period of 100 fs and a decay time of 50 fs. Long range electrostatic interactions were computed using the particle mesh Ewald method with periodic boundary conditions. Electrostatic and van der Waals interactions were cut off beyond a distance of 12 Å using switching functions beginning at 10 Å. All hydrogen atoms were kept rigid. The simulation time step was 1 fs unless stated otherwise. In the first step of preparation, the protein side chains were minimized for 10,000 steps with the backbone atoms fixed in the absence of water and ions. The resulting structure was solvated as described above. To facilitate the relaxation of water around the protein, all protein atoms were fixed, and the system was subjected to 1,500 steps of minimization and 50 ps of dynamics. For further relaxation of the solvent system around the protein, harmonic constraints were used on the protein atoms with a force constant of 1 kcal/(mol Å2). In the final step before production runs, a gradual temperature increase from 0 to 300 K was implemented. Temperature reassignment by an increment of 10 K every 2 ps was used to reach 300 K followed by 250 ps of dynamics. Production run preparedness was determined based upon leveling of the root mean square deviations and energy fluctuations.
To evaluate flexible regions in the 3UI2 proteins, simulations of 100 ns were performed. A 2-fs time step was used for these runs with all other parameters identical to the last 250 ps of the final equilibration run. Backbone root mean square deviations were evaluated using the root mean square deviation trajectory tool and the simulations visualized and Cα distances measured in VMD (43). The full-length cpSRP43 structure was simulated similarly for a total of 5 ns with harmonic restraints on the backbone atoms of CD3 with a force constant of 1 kcal/(mol Å2). Restraints were used because of instability of the CD3 domain observed in prior simulations.
SBCG Modeling
The minimized cpSRP43 from the all-atom cpSRP43 CD1–CD3 run was used for the SBCG building. The coarse grained model building methods are as described (44). The VMD CGTools plug-in was used to build a 30-bead model using 25,000 iterations following the chain connectivity of the all-atom structure. The mass and charge of each bead was determined based upon the atoms assigned to them. Hydrophobic interactions were modeled via a Lennard-Jones potential with the parameters determined from the all-atom structure, setting the maximum well depth to 10 kcal/mol and adding an additional 1 Å to the Lennard-Jones radius. Bonded interactions were modeled via a harmonic potential. For further refinement, the appropriate values were extracted from the restrained all-atom simulation. Briefly, several iterations of short SBCG simulation were run to determine the effective force constants in the coarse model that were individually adjusted between iterations to improve the agreement with the values obtained from the all-atom simulation.
A temperature of 300 K was maintained using Langevin dynamics with a damping coefficient of 2 ps−1. Periodic boundary conditions were used with a cut-off beyond a distance of 35 Å using switching functions beginning at 20 Å. Boundaries were selected such that the beads in the adjacent systems would be non-interacting. The simulation time step for simulations was 100 fs. To improve sampling of configurational space, each construct was simulated a total of 20 μs 12 times using different random number seeds in each simulation.
Isothermal Titration Calorimetry
All isothermal titration calorimetric experiments were performed at 25 °C using a VP-ITC (MicroCal Inc., Northampton, MA). The concentration of protein samples used in the isothermal titration calorimetry was estimated using the Bradford micro-dye binding assay. The concentration of the peptides (cpSRP54pep and L18 peptide) was estimated by the Scopes method using 205 nm absorbance (45). Protein and peptide samples were centrifuged at 4 °C at 13,000 rpm for 15 min prior to the ITC experiments to remove any aggregated or precipitated material(s). All sample solutions were degassed under vacuum and equilibrated for 30 min prior to titration. 0.025 mm cpSRP43 (10 mm HEPES, 10 mm MgCl2 buffer, pH 8.0) was placed in a reaction cell and titrated with 0.25 mm L18 peptide dissolved in the same buffer. The contents of the syringe (L18 peptide) were added sequentially in 6-μl aliquots to the reaction cell (0.025 mm cpSRP43 alone or a 5:1 mixture of cpSRP54pep and cpSRP43) at an interval of 120 s. The titration curves were corrected by performing appropriate blank titrations. The data were analyzed using Origin (MicroCal Inc.). The raw ITC data were individually fitted to the one-set-of-sites binding model.
Results and Discussion
Cysteine Mutation and Adding Fluorescent Labels to cpSRP43 Do Not Hinder Integration of LHCP
To study the interdomain dynamics of cpSRP43 by smFRET, double cysteine mutants were labeled using commercially available maleimide-functionalized dyes; Alexa Fluor 488 was used as the donor, and either Alexa Fluor 546 or Alexa Fluor 594 was used as the acceptor dye. Two acceptors were used to verify that the results were independent of the choice of dye pair (data not shown as they are identical to Fig. 4). Fig. 1a shows the domain structure of cpSRP43. Wild-type cpSRP43 has two endogenous cysteines, one in Ank2 and the other in CD2. Hence, labeling of the CD2 and Ank2 domains was accomplished using the wild-type cysteine positions. Other double cysteine mutants were designed, expressed, and purified as described in Table 1 to result in cpSRP43 with one cysteine residue in each domain of interest. The various domain combinations examined by donor/acceptor labeling of endogenous or introduced cysteine residues are shown in Fig. 1b: Ank2/CD3 (P1), Ank2/Ank4 (P2), Ank2/CD2 (wild type, P3), CD2/CD3 (P4), and CD1/Ank2 (P5). Additionally, we also produced a truncated version of cpSRP43 in which only the CD2-CD3 domains were expressed (i.e. the domains CD1-Ank4 were deleted) but where the same labeling sites as P4 were used that we refer to here as P4Δ.
FIGURE 4.
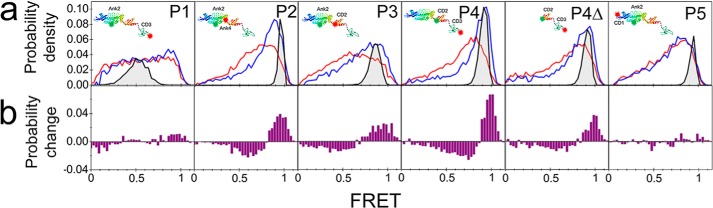
a, smFRET histograms of cpSRP43 proteins without (red) and with (blue) bound cpSRP54. The expected Poisson noise-limited smFRET histograms from the average FRET based on the SAXS structure are overlaid (gray). Insets are schematic representations of the labeled proteins. b, calculated difference histograms of the cpSRP43 proteins after binding cpSRP54.
FIGURE 1.

a, the arrangement of domains in cpSPR43. b, the amino acid positions used for fluorescence labeling highlighted in red for five double Cys cpSRP43 proteins (labeled P1–P5). The structure for the CD1-Ank1–4-CD2 region is taken from Protein Data Bank code 3UI2, and the structure for CD3 is taken from Protein Data Bank code 1X3P. c, LHCP integration assays confirming that fluorescently labeled cpSRP43 is able to transport and integrate LHCP into thylakoid membranes. TP, translation product; +, positive control with native cpSRP43/54; −, negative control with no cpSPR43/54; Ank2, WT cpSRP54 + Ank2 labeled cpSRP43; Ank4, WT cpSRP54 + Ank4 labeled cpSRP43; CD2, WT cpSRP54 + CD2 labeled cpSRP43; CD3, WT cpSRP54 + CD3 labeled cpSRP43.
Fig. 1c shows the results of LHCP integration assays, in which fluorescently labeled single cysteine mutants of cpSRP43 that had been incubated with a 100-fold excess of dye were used to reconstitute integration of radiolabeled LHCP into isolated thylakoids in the presence of cpSRP54, cpFtsY, and GTP. It was confirmed using HPLC-coupled electrospray ionization-MS analysis that the labeling efficiency for all single cysteine proteins was 70–100% (data not shown). Previously, Goforth et al. (46) showed that when an inactive fraction of cpSRP43 is present in the sample the integration efficiency of LHCP decreases, demonstrating that labeling of cpSRP43 with fluorescent tags at the designed sites had no detectable influence on cpSRP43-mediated protein interactions (i.e. cpSRP54, LHCP, and Alb3) that are required for targeting and insertion of LHCP into thylakoid membranes. This result helps ensure that the subsequent smFRET experiments probed physiologically relevant protein conformations.
Affinity of cpSRP43 to cpSRP54 Is Not Affected by Fluorescent Labeling or Truncating cpSRP43
We used fluorescence correlation spectroscopy to measure the diffusion coefficient of full-length and truncated (with the CD1-Ank4 domains deleted) cpSRP43 as a function of added cpSRP54 (Fig. 2). The fitted diffusion constant (47) of the fluorescently labeled P4 decreased from 68 to 51 μm2/s, and P4Δ decreased from 116 to 64 μm2/s upon addition of cpSRP54, verifying that both labeled full-length and truncated cpSRP43 did indeed bind cpSRP54. It is worth noting that, although the fluorescence correlation spectroscopy curves do not appear to show a significant shift as displayed, the x axis is plotted as a logarithmic scale. The shift was able to be reasonably extracted from the fits, and these diffusion coefficients are in good agreement with calculations based on the molecular weights of the proteins and protein complexes (48). cpSRP54 comprises three domains: the N-terminal domain is termed N followed by the G domain and then the M domain (4). It was previously reported that the isolated CD2 domain of cpSRP43 binds to the M domain of cpSRP54 with high affinity (38), so it was expected that the truncated cpSRP43 would still bind cpSRP54. In fact, CD2 binds to only a critical 13-residue peptide sequence from the M domain (cpSRP54pep) (49) albeit with reduced affinity. By fitting the fraction of species with the diffusion coefficient of the unbound cpSRP43 compared with the fraction of species with the diffusion coefficient of the bound cpSRP43-cpSRP54 complex for each concentration of cpSRP54 added, we were able to plot the fraction of bound complex as a function of cpSRP54 concentration to determine the Kd value. We found the Kd value of cpSRP54 to full-length cpSRP43 and to truncated cpSRP43 to be 95 ± 73 and 158 ± 32 nm, respectively. These values are in agreement with previously published ITC data (38) and show that neither labeling nor truncation of cpSRP43 significantly affects its affinity for cpSRP54.
FIGURE 2.

Fluorescence correlation spectroscopy curves of full-length (a) and truncated (trunc) (b) cpSRP43 in the absence (red lines) and presence of 100 nm (green lines) and 3 μm (blue lines) of cpSRP54 are shown. Titration curves of cpSRP54 binding to full-length (c) and truncated (d) cpSRP43 show that the affinity is not affected by either labeling or truncation of cpSRP43. ACF, autocorrelation function.
Characterizing Zero FRET Peak, Nonspecific Labeling, and Rotational Mobility of Dyes on cpSRP43
For smFRET data presentation, the zero FRET peak was subtracted. To ensure that our zero FRET subtraction did not affect the shapes of the smFRET histograms, we performed control experiments on Pro10 and Pro20 polypeptides in which cysteine residues are added at the N and C termini. The resulting smFRET histograms that we measured for these polypeptides were essentially identical with previously published data on these same polypeptides with the same FRET dye pair (50) (Fig. 3, a and b). The zero FRET peaks were the same for the polypeptides and our cpSRP43 proteins, allowing for their easy subtraction (Fig. 3, c and d). We also used a cysteine-free mutant of cpSRP43 to determine the influence of nonspecific labeling on smFRET. The cysteine-free mutant and the double cysteine mutants of cpSRP43 were diluted to the same concentration, and fluorescent bursts were collected for the same length of time. The smFRET histograms for two of our double cysteine cpSRP43 proteins overlaid with the cysteine-free cpSRP43 are shown in Fig. 3, e and f. These figures represent the minimum and maximum amount of nonspecific labeling observed. The cysteine-free mutant showed between 17 and 30% of the number of bursts compared with the double cysteine mutants, but unlike the double cysteine mutants, all these bursts showed up only in the high FRET region. Therefore, differences in the smFRET histograms of the various cpSRP43 proteins can be reasonably assigned to specifically labeled cpSRP43. More importantly, the addition of cpSRP54 did not affect the smFRET histograms of the nonspecifically labeled proteins, verifying that changes in the smFRET histograms of cpSRP43 proteins are indeed the result of cpSRP54 affecting their dynamics.
FIGURE 3.

smFRET histograms of Pro10 and Pro20 before (a) and after (b) zero FRET peak subtraction, and smFRET histograms of cpSRP43 in the absence and presence of cpSRP54 before (c) and after (d) zero FRET peak subtraction are shown. The overlay of smFRET histograms of cysteine-free mutant of cpSRP43 with double cysteine mutants labeled in the CD2-CD3 domains (P4) (e) and the Ank2-CD2 domains (P3) (f) highlights the minimum and maximum nonspecific labeling. The cysteine-free smFRET histograms are shown without (red) and with (blue) bound cpSRP54. Polarization anisotropy measurements of Alexa Fluor 488 dye free in solution as well as for cpSRP43 proteins labeled with Alexa Fluor 488 in each domain without (g) and with (h) bound cpSRP54 are shown.
Single molecule polarization anisotropy measurements were performed on all dye-labeled single cysteine proteins and compared with free dye to ensure that all attached dyes had free rotational mobility, i.e. that the κ2 values were the same for the different cpSRP43 proteins. If the transition dipole moment of the dye rotates fast compared with its emission lifetime, the average polarization anisotropy of the emission will be zero. The polarization anisotropy, r, is calculated from individual bursts (diffusing molecules) using Equation 1.
 |
The average r for each of the labeled cpSRP43 proteins is less than 0.05 (Fig. 3, g and h) with similar standard deviations, comparable with that of the free dye. These results verify that the fluorophores rotate just as fast when conjugated to the protein as they do when they are free in solution, leading to complete statistical averaging of their orientation resulting in κ2 = 2/3. Moreover, κ2 was found not to be affected by binding of cpSRP43 to cpSRP54. Although there is a slight anisotropy broadening of the dye in the Ank4 domain upon binding cpSRP54, it must be noted that 1) the average anisotropy value is still close to zero and 2) to maintain statistical averaging of the orientation factor in FRET (κ2 = 2/3) only one of the dyes need to be freely rotating because averaging of the orientation factor takes place over the axis connecting the transition dipole moments of the two dyes. This ensures that wide smFRET histograms do result from protein structural heterogeneity and not from κ2 variations.
cpSRP43 Domains Show Varying Degrees of Structural Dynamics
Using the molecular envelope structure of cpSRP43 from the published SAXS structure (15), we estimated the interfluorophore distance, R, for each of the doubly labeled proteins and using the Förster distance for the dye pairs used (Alexa Fluor 488/594, R0 = 60 Å; Alexa Fluor 488/546, R0 = 64 Å) calculated the expected FRET efficiency from Equation 2.
 |
All the proteins studied here were expected to show high FRET (>0.8) with the exception of P1 (labeled in Ank2 and CD3), which was expected to show intermediate FRET efficiencies of ∼0.55.
Fig. 4a shows the smFRET histograms obtained from each of the freely diffusing cpSRP43 proteins (P1–P5; each at 200 pm concentration) in the absence (red curves) and presence (blue curves) of excess (100 nm) cpSRP54. The insets of Fig. 4a show schematics of the labeled proteins. The donor-only peak at zero FRET has been subtracted for clarity. The gray shaded peaks that are overlaid on the histograms in Fig. 4 show the expected smFRET distributions for each protein based on a rigid configuration as measured by SAXS (15) where the only contribution to the width is the (Poisson) shot noise of the fluorescence signals. All proteins show much wider smFRET histograms than expected if cpSRP43 was rigid. Wide smFRET histograms represent variations in the measured FRET efficiency from molecule to molecule. There are two possible origins for the variations in FRET efficiency: variations in the orientation factor, κ2, between the dyes or heterogeneity in the protein structure. The data in Fig. 3 exclude the orientation factor playing a role, therefore leading to the conclusion that structural heterogeneity is responsible for the variations in FRET efficiency.
To determine whether the structural heterogeneity is static or dynamic in origin, we immobilized cpSRP43 on PEG-modified glass surfaces using a biotin-streptavidin linkage and measured the smFRET efficiency as a function of time for a number of single molecules. Fig. 5 shows typical single molecule fluorescence traces from the donor and acceptor dyes in three of the cpSRP43 proteins (P4, P4Δ, and P3) as well as their calculated time-resolved FRET efficiency. Other cpSRP43 proteins showed similar smFRET traces. It is clear that these traces are noisy and that unambiguous conclusions cannot be drawn. However, we determined the Pearson correlation coefficient for these traces to be moderately negative (∼−0.2), indicating that anticorrelated FRET processes are occurring. A more detailed analysis of such traces to extract quantitative dynamics is beyond the scope of this study and will be the subject of future studies, as will reducing the noise of such traces. However, these results provide support that single, immobilized cpSRP43 proteins undergo FRET changes, indicating that at least some of the structural heterogeneity is dynamic.
FIGURE 5.

Single molecule fluorescence traces from donor (green) and acceptor (red) dyes and their respective time-resolved FRET efficiency traces (magenta) for PEG-surface immobilized cpSRP43 proteins. a and d, P4; b and e, P4Δ; c and f, P3. Fl. Int., fluorescence intensity.
We carefully examined the shapes of the histograms of the cpSRP43 proteins in the absence of cpSRP54 (Fig. 4a, red curves; the effect of cpSRP54 binding (blue curves) will be discussed later). P1 has labels placed relatively far apart (Ank2-CD3) and was expected to show a FRET histogram centered at ∼0.55, but a whole range of FRET efficiencies was observed. This result indicates that the Ank2 and CD3 domains move close to and far from each other. This type of interdomain movement will be referred to as “flexibility” hereafter to more succinctly convey this idea. For the other proteins, the labels were all expected to be relatively close to each other and were thus expected to all show high FRET efficiencies of approximately the same value (0.85–1.0). Therefore, comparing the relative shapes of these histograms will allow us to identify regions of higher or lower flexibility; a narrower histogram implies a less flexible region. In P2, one label is placed in Ank2, and the other is placed near the end of the ∼25-Å-long α-helix at the C terminus of Ank4. We observed that P2 is more flexible than one would anticipate considering the arrangement of these domains in the crystal and SAXS structures (15, 17). When one label is kept in Ank2, but the other label is moved from Ank4 to CD2 (P3; the wild-type protein), the smFRET histogram is not any wider than that of P2, indicating that the flexibility of the Ank2-Ank4 region is about the same as that of Ank2-CD2. This suggests that the Ank4-CD2 region is relatively rigid. Placing the labels in CD2 and CD3 (P4) led to a moderately wide smFRET histogram but one that is less so than either the Ank2-Ank4 (P2) or the Ank2-CD2 (P3) histogram. Because P1 probes the combined domains of P3 and P4, it can be concluded that the extremely high flexibility observed in P1 partially arises from both flexibility between CD2 and CD3 and from flexibility in the Ank2-CD2 region, which in turn is dominated by flexibility in the Ank2-Ank4 region.
We also investigated the flexibility between the CD2 and CD3 domains in the absence of the CD1-Ank4 regions (P4Δ) to test whether any interaction between these two chromodomains and the ankyrin domains affects the observed flexibility in CD2-CD3. It was found that the smFRET histogram of the labeled CD2-CD3 truncated cpSRP43 (P4Δ) was similar to the full-length cpSRP43 (P4), indicating that the flexibility between CD2 and CD3 is not affected by potential interactions of CD2 and/or CD3 with the CD1-Ank4 region in the full-length cpSRP43. This is in agreement with the fact that cpSRP54 binds with high affinity to isolated CD2 domains (38).
Finally, placing the labels between CD1 and Ank2 (P5) showed the narrowest FRET histogram, although it is still wider than the shot noise-limited width (gray peak), which shows that this region also has moderate flexibility. Clearly, the N-terminal portion of cpSRP43 between CD1 and Ank2 does not show as much flexibility as the C-terminal portion. Because the C-terminal portion (i.e. after Ank2) has known binding sites for both cpSRP54 and LHCP, we hypothesized that the flexibility of cpSRP43 may be affected by binding cpSRP54 and in turn affect its affinity for the LHCP substrate.
Binding of cpSRP54 Reduces the Flexibility of Certain Regions of cpSRP43
The smFRET distributions of the cpSRP43 proteins after adding cpSRP54 are also shown in Fig. 4a (blue curves). The difference histograms (complexed cpSRP43-cpSRP54 minus free cpSRP43) are provided in Fig. 4b below each panel. Upon cpSRP54 binding, the Ank2-CD3 (P1) smFRET distribution remains very wide with only a slight increase in the high FRET peak. The CD1-Ank2 region of cpSRP43 (P5) also shows little to no change in the smFRET upon binding cpSRP54, indicating that the N-terminal portion of cpSRP43 is structurally unaffected by binding to cpSRP54. However, for the other proteins (P2, P3, P4, and P4Δ), there is an increase in the higher FRET values and a decrease in the lower FRET values, consistent with compaction and decreased flexibility in these regions of the protein. The M domain of cpSRP54 is known to bind strongly to the CD2 domain of cpSRP43 so it is not particularly surprising that P3 and P4 (and P4Δ) show changes in FRET. It was more surprising that the Ank2-Ank4 region (P2) showed one of the largest changes in smFRET, indicating a significant decrease in flexibility in this region of the protein upon binding cpSRP54. It is worth noting here that the Ank2-Ank4 region contains residues that bind the L18 motif of LHCP (17). The significance and implications of this will be discussed later.
Molecular Dynamics (MD) Simulations Lend Support for Multiple Conformational States in cpSRP43
All-atom and SBCG simulations were run to lend support to the observations based on FRET data that cpSRP43 is a very flexible protein. All-atom simulations were run using the crystal structure of the CD1-Ank-CD2 portion of the protein (Protein Data Bank code 3UI2) in the presence and absence of the cpSRP54 peptide for a total of 100 ns each to examine the changes in the motion(s) of CD2 relative to CD1-Ank4 upon binding to cpSRP54. Movies of these simulations are provided in the supporting information (supplemental Movie S1 and S2, respectively). From these trajectories, the interdomain distance between the Cα atoms of the labeled residues in Ank2 and CD2 was extracted as a function of time (Fig. 6a). Fig. 6a shows that the flexibility of the protein in this region is significantly reduced when the cpSRP54pep is bound.
FIGURE 6.

a, distance between the labeled residues on the Ank2 and CD2 domains (P3) as a function of time from all-atom simulations in the absence (red) and presence (blue) of cpSRP54pep. b, overlay of the all-atom structure with the SBCG model (spheres). c, the three main conformations identified from the SBCG simulations, extended, open, and closed. The closed structure for both the unrestricted (cpSRP54-unbound) and the restricted (cpSRP54-bound) simulations are shown. d, distances between the labeled residues of cpSRP43 probed in P1 (Ank2-CD3), P3 (Ank2-CD2), and P4 (CD2-CD3) during open-to-extended or open-to-closed transitions.
Shape-based coarse graining of a protein structure allows for the assignment of clusters of atoms to a set of beads that inherit the aggregate properties of the atoms assigned to it, helping to reduce the system size and achieve significantly increased simulation time scales. The SBCG simulations included CD3 and were run for 20 μs to reach time scales similar to those of the FRET experiments. The bead connectivity was adjusted to match the shape of cpSRP43. Based on the shape, the final selected construct included relatively flexible linkers between Ank4 and CD2 and between CD2 and CD3 (Fig. 6b). An additional construct was prepared via the addition of a restricting bond between the terminal Ank4 bead and a bead in CD2 to mimic the effect of the cpSRP54 peptide, which is known to bind to this region. Importantly, because of the close association of the ankyrin repeats in the crystal structure, Ank4 beads included bonds to its adjacent Ank3 beads. This was necessary due to the nature of the model building. It was not reasonable to assign Ank4 atoms to a single bead based on this structure, and it underscores a major difference in the potential of Ank4 movement versus the flexibly linked domain architecture of CD2 and CD3. Example movies of the course grained modeling are provided in the supporting information (supplemental Movies S3–S5). Three major conformations, which are denoted as “closed,” “open,” and “extended,” were identified (Fig. 6c). The open conformation bears the closest resemblance to the published SAXS structure of cpSRP43 (15). The closed structure is characterized by a strong interaction between CD3 and Ank4, and the extended structure depicts a particularly large interdomain separation between the Ank domains and CD3. The closed conformation was observed in both simulations (i.e. whether the peptide constraint between Ank4 and CD2 was applied or not; supplemental Movies S4 and S5), suggesting that binding of cpSRP54 does not hinder the ability for CD3 to interact with Ank4. However, the relative orientation of the CD2 domain to the CD3 is affected by cpSRP54 binding.
Distances between the beads representing the residues in which cpSRP43 was labeled in the smFRET experiments were measured and plotted as a function of time. Fig. 6d shows example traces highlighting transitions between the three dominant conformations. P1, which probes the distance between the Cα atoms on the labeled residues in Ank2 and CD3, shows states with distances at ∼42, 65, and 88 Å. These three distances between the labeled residues in Ank2 and CD3 describe the major conformations that we classified as closed, open, and extended, respectively. It must be noted here that the orange trace in Fig. 6 does start at a distance of 65 Å (open), but there is a rapid decrease to 42 Å (closed) within the first few bins that is not easily visible on this time scale. P3 probes the distance between residues in Ank2 and CD2 with the three major conformations at ∼40-, 50-, and 55-Å inter-residue separation. P4 shows major conformations with distances between residues in CD2 and CD3 at ∼22, 30, and 46 Å, respectively. The simulations did not identify significant distance changes between the residues labeled in Ank2-Ank4 (P2) or CD1-Ank2 (P5) due to the limitations in bead connectivity described above. Multiple transitions between the three major conformations were not observed in a single trace, indicating that these states were long lived compared with the 20-μs simulation time scales. Therefore, in this study, we limit our discussion only to the fact that the SBCG model supports the existence of various states that underlie the structural dynamics observed in smFRET without consideration of their relative stabilities. Although the three main conformations identified from the modeling may lend support, at least in part, to the fact that low, mid, and high FRET efficiencies might be observed due to the closed, open, and extended conformations, respectively, more refinements to the model are needed to make more robust conclusions. Future studies will examine the relative stabilities of the states in more detail and further refine the SBCG model toward this end.
Reducing the Flexibility of cpSRP43 upon Binding to cpSRP54 Increases Its Affinity for the LHCP Substrate
LHCP transport and integration into the thylakoid membrane is a multistep process involving both sequential and concurrent protein-protein interactions among cpSRP43, cpSRP54, LHCP, cpFtsY, and Alb3. The formation of the ternary cpSRP43-cpSRP54-LHCP transit complex in the chloroplast stroma is the first key step in this process (11). Cross-linking experiments have shown that the N-terminal portion of transmembrane domain 3 in LHCP binds to cpSRP43 independently of the presence of cpSRP54 (17). Our smFRET results showed that the regional flexibility of cpSRP43 is reduced, particularly between Ank2 and Ank4. Two hydrophobic grooves were identified in the crystal structure of cpSRP43 (17), one groove between Ank2 and Ank4 (groove 1) and the other between CD1 and Ank1 (groove 2) as shown in Fig. 7a. Residues that are known to interact with both the L18 domain of LHCP and cpSRP54pep are in the Ank2-Ank4 region of the protein. MD simulations showed that the root mean square fluctuations of the Cα atoms at the interaction sites of both L18 and cpSRP54pep in cpSRP43 decreased upon binding cpSRP54pep (Fig. 7b). smFRET experiments showed that cpSRP54pep reduces the flexibility of cpSRP43 in the Ank2-Ank4 region in a similar way to the full-length cpSRP54 (Fig. 7c) albeit to a lower extent. The combination of smFRET data and MD simulations led us to hypothesize that the affinity between cpSRP43 and the L18 domain of LHCP is increased by the reduced flexibility caused by cpSRP54 binding. To test this hypothesis, ITC experiments were performed between cpSRP43 and L18 in the absence and presence of cpSRP54pep. The ITC data for the binding of L18 to cpSRP43 in the absence and presence of cpSRP54pep is shown in Fig. 7d. There is a ∼3-fold increase in the affinity between cpSRP43 and L18 after cpSRP54pep is bound. Because cpSRP54pep changes the smFRET of cpSRP43 to a lower extent than full-length cpSRP54 (Fig. 7c), it is possible that other residues of cpSRP54 are involved in interactions with cpSRP43, and the 3-fold increase in affinity may actually be an underestimation of the effect of cpSRP54 binding on the LHCP affinity. However, it must also be noted that this change in affinity is only to the L18 loop region of LHCP, and other regions of LHCP may be involved in the interaction with cpSRP43 and/or cpSRP54 that may serve to either increase or decrease this effect. Clearly, more work on measuring the affinity changes of the other domains is needed.
FIGURE 7.

a, CD1-Ank4 region of cpSRP43 highlighting the relationship between the FRET labels in P2 and P5 with groove 1 to which the L18 motif binds and groove 2. b, root mean square fluctuations (RMSF) in the Cα atoms of residues in the Ank2-Ank4 region in the absence (red) and presence (blue) of cpSRP54pep. The L18 and cpSRP54pep interaction residues on cpSRP43 are shown on the x axis. c, smFRET histograms for P2 in the absence (red) and presence of different concentrations of cpSRP54pep (green, 100 nm; orange, 100 μm). No significant difference between adding 100 nm or 100 μm cpSRP54pep was observed, suggesting that the change in the smFRET of P2 is already saturated at 100 nm cpSRP54pep. For comparison, the smFRET of P2 + 100 nm cpSRP54 protein (blue) is shown. d, ITC data for the addition of L18 to cpSRP43 in the absence (left) and presence (right) of cpSRP54pep.
Functional Implications for LHCP Targeting
The central role of cpSRP43 in LHCP post-translational targeting has been highlighted by a range of studies. cpSRP43 alone, but not cpSRP54, is able to solubilize LHCP aggregates in vitro (15, 21). Although the CD1 domain of cpSRP43 is not required for binding LHCP in the water-soluble transit complex, it is required for LHCP integration and is involved in regulating the GTP hydrolysis rates of cpSRP54/cpFtsY (46). Clearly, cpSRP43 is absolutely necessary both for forming the water-soluble LHCP transit complex and for membrane integration. In fact, the ability of cpSRP43 to interact with both LHCP and the Alb3 integrase supports the operation of a less efficient LHCP targeting pathway that functions in the absence of cpSRP54 (19, 21). It was found that plants lacking both cpSRP54 and its membrane receptor cpFtsY recover to a great extent from the chlorotic phenotype observed when cpFtsY alone is missing (51). Hence, cpFtsY is only required when LHCP is targeted by a cpSRP43-cpSRP54 dimeric complex. Therefore, the role of the two GTPases, cpSRP54 and cpFtsY, is to increase the efficiency of LHCP routing conducted by cpSRP43 and Alb3. The data presented in this study demonstrate that one role of cpSRP54 is to promote LHCP binding to cpSRP43 by reducing interdomain protein dynamics in cpSRP43. Two grooves were identified in the crystal structure of cpSRP43 (17). Our P2 and P5 proteins were designed to separately probe these two grooves (Fig. 7a). Based on the smFRET results for P2, altering the structure of groove 1 in the Ank2-Ank4 region of cpSRP43 is a strong candidate for the source of improved binding of the LHCP substrate.
A strong interaction of CD3 with the Ank4 region was found by SBCG MD simulations to form a closed conformation. It is interesting to speculate that this interaction helps to effect a conformational change in groove 1. The interaction of cpSRP54 with cpSRP43 still allows the closed, open, and extended structures to be sampled as evidenced from the wide smFRET histogram for P1. It has been postulated that a portion of the transmembrane domain 3 helix in LHCP also binds to cpSRP54 (17). Because LHCP binding to cpSRP fails to occur when the L18 region of LHCP is mutated, LHCP binding to cpSRP is undoubtedly a multistep process initiated by L18 binding into groove 1, which cpSRP54 helps to promote. Other portions of LHCP interacting with groove 2 on cpSRP43 and cpSRP54 would follow, although the order of these interactions is uncertain. The continued flexibility of cpSRP43 after binding cpSRP54 may be necessary to allow LHCP to form these favorable interactions with both cpSRP43 and cpSRP54, extending an earlier model proposed by Sinning and co-workers (17) to include structural dynamics in the formation of the transit complex. Finally, it is speculated that downstream interactions of cpSRP43 in the transit complex with Alb3 may be connected to interdomain structural dynamics that enable both efficient binding of cpSRP43 to Alb3 and release of LHCP from cpSRP to Alb3 at the thylakoid membrane. The fact that cpSRP43 alone binds LHCP albeit with a lower affinity and subsequently integrates it into the thylakoid membrane by a cpSRP54-independent pathway could suggest that cpSRP54 may have evolved in chloroplasts after cpSRP43 as a way to improve LHCP binding to the SRP and subsequent integration efficiency. A combination of smFRET, MD simulations, and thermodynamic measurements is a powerful approach that will help further identify the roles of protein dynamics in protein targeting mechanisms.
Summary and Conclusions
We have used a combination of smFRET, MD simulations, and ITC to relate the interdomain structural dynamics of cpSRP43 to its function in post-translational targeting of LHCP. Three major conformations were speculated, open, closed, and extended, which lead to cpSRP43 showing a high degree of flexibility across the whole protein. Certain regions showed decreased flexibility upon binding to its cpSRP binding partner, cpSRP54, particularly in the Ank2-Ank4 and CD2-CD3 regions. We demonstrated that this decreased flexibility upon binding cpSRP54 is connected with an increased affinity of cpSRP43 to the L18 motif of LHCP. These results support a model in which changes in the flexibility of cpSRP43 are related to its ability to bind multiple substrates and promote its post-translational targeting function and may provide a clue that the evolutionary development of cpSRP54 in the chloroplast protein targeting pathway may have come after the cpSRP43 pathway as a way to improve targeting efficiency.
Supplementary Material
This work was supported in part by National Institutes of Health Grant P30 GM103450 through the Centers of Biomedical Research Excellence program. This work was also supported by the U.S. Department of Energy, Office of Science, Basic Energy Sciences, under Award #DE-FG02-01ER15161 (to R. L. H. and T. K. S. K.: cloning and recombinant protein production, molecular dynamics simulations, and thylakoid insertion), and the Arkansas Biosciences Institute. We thank the Arkansas Statewide Mass Spectrometry Facility for analytical support and the mass spectral data (Grant Number 1P30RR031154 from the National Center for Research Resources, a component of the NIH). MD simulations were supported in part by National Science Foundation Grants MRI 0722625 (Star of Arkansas), MRI-R2 0959124 (Razor), and ARI 0963249 and 0918970 (Cyberinfrastructure for Transformational Scientific Discovery, CI-TRAIN) and a grant from the Arkansas Science and Technology Authority with resources managed by the Arkansas High Performance Computing Center.

This article contains supplemental Movies 1–5.
- LHCP
- light-harvesting chlorophyll-binding protein
- SRP
- signal recognition particle
- cpSRP
- chloroplast signal recognition particle
- Alb3
- Albino3
- CD
- chromatin-binding domain
- Ank
- Ankyrin repeat
- smFRET
- single molecule FRET
- SAXS
- small angle x-ray scattering
- ITC
- isothermal titration calorimetry
- SBCG
- shape-based coarse grained
- MD
- molecular dynamics.
References
- 1. Cline K., Dabney-Smith C. (2008) Plastid protein import and sorting: different paths to the same compartments. Curr. Opin. Plant Biol. 11, 585–592 [DOI] [PMC free article] [PubMed] [Google Scholar]
- 2. Cline K. (2003) in Light-Harvesting Antennas in Photosynthesis (Green B., Parson W. W., eds) pp. 353–372, Kluwer Academic Publishers, Dordrecht, the Netherlands [Google Scholar]
- 3. Henry R., Goforth R. L., Schunemann D. (2007) in The Enzymes (Dalbey R. E., Koehler C. M., Tamanoi F., eds), pp. 493–521, Academic Press, San Diego, CA [Google Scholar]
- 4. Franklin A. E., Hoffman N. E. (1993) Characterization of a chloroplast homologue of the 54-kDa subunit of the signal recognition particle. J. Biol. Chem. 268, 22175–22180 [PubMed] [Google Scholar]
- 5. Payan L. A., Cline K. (1991) A stromal protein factor maintains the solubility and insertion competence of an imported thylakoid membrane protein. J. Cell Biol. 112, 603–613 [DOI] [PMC free article] [PubMed] [Google Scholar]
- 6. Li X., Henry R., Yuan J., Cline K., Hoffman N. E. (1995) A chloroplast homologue of the signal recognition particle subunit SRP54 is involved in the posttranslational integration of a protein into thylakoid membranes. Proc. Natl. Acad. Sci. U.S.A. 92, 3789–3793 [DOI] [PMC free article] [PubMed] [Google Scholar]
- 7. Schuenemann D., Gupta S., Persello-Cartieaux F., Klimyuk V. I., Jones J. D., Nussaume L., Hoffman N. E. (1998) A novel signal recognition particle targets light-harvesting proteins to the thylakoid membranes. Proc. Natl. Acad. Sci. U.S.A. 95, 10312–10316 [DOI] [PMC free article] [PubMed] [Google Scholar]
- 8. Green B.R., Salter A.H., (1996) in Molecular Genetics of Photosynthesis (Andersson B., Salter A. H., Barber J., eds) pp. 75–103, IRL Press, Oxford [Google Scholar]
- 9. Groves M. R., Mant A., Kuhn A., Koch J., Dübel S., Robinson C., Sinning I. (2001) Functional characterization of recombinant chloroplast signal recognition particle. J. Biol. Chem. 276, 27778–27786 [DOI] [PubMed] [Google Scholar]
- 10. Yuan J., Henry R., Cline K. (1993) Stromal factor plays an essential role in protein integration into thylakoids that cannot be replaced by unfolding or by heat shock protein Hsp70. Proc. Natl. Acad. Sci. U.S.A. 90, 8552–8556 [DOI] [PMC free article] [PubMed] [Google Scholar]
- 11. Henry R. L. (2010) SRP: adapting to life in the chloroplast. Nat. Struct. Mol. Biol. 17, 676–677 [DOI] [PubMed] [Google Scholar]
- 12. DeLille J., Peterson E. C., Johnson T., Moore M., Kight A., Henry R. (2000) A novel precursor recognition element facilitates posttranslational binding to the signal recognition particle in chloroplasts. Proc. Natl. Acad. Sci. U.S.A. 97, 1926–1931 [DOI] [PMC free article] [PubMed] [Google Scholar]
- 13. Tu C. J., Peterson E. C., Henry R., Hoffman N. E. (2000) The L18 domain of light-harvesting chlorophyll proteins binds to chloroplast signal recognition particle 43. J. Biol. Chem. 275, 13187–13190 [DOI] [PubMed] [Google Scholar]
- 14. Falk S., Sinning I. (2010) cpSRP43 is a novel chaperone specific for light-harvesting chlorophyll a,b-binding proteins. J. Biol. Chem. 285, 21655–21661 [DOI] [PMC free article] [PubMed] [Google Scholar]
- 15. Jaru-Ampornpan P., Shen K., Lam V. Q., Ali M., Doniach S., Jia T. Z., Shan S.-O. (2010) ATP-independent reversal of a membrane protein aggregate by a chloroplast SRP subunit. Nat. Struct. Mol. Biol. 17, 696–702 [DOI] [PMC free article] [PubMed] [Google Scholar]
- 16. Cain P., Holdermann I., Sinning I., Johnson A. E., Robinson C. (2011) Binding of chloroplast signal recognition particle to a thylakoid membrane protein substrate in aqueous solution and delineation of the cpSRP43-substrate interaction domain. Biochem. J. 437, 149–155 [DOI] [PubMed] [Google Scholar]
- 17. Stengel K. F., Holdermann I., Cain P., Robinson C., Wild K., Sinning I. (2008) Structural basis for specific substrate recognition by the chloroplast signal recognition particle protein cpSRP43. Science 321, 253–256 [DOI] [PubMed] [Google Scholar]
- 18. Marty N. J., Rajalingam D., Kight A. D., Lewis N. E., Fologea D., Kumar T. K., Henry R. L., Goforth R. L. (2009) The membrane-binding motif of the chloroplast signal recognition particle receptor (cpFtsY) regulates GTPase activity. J. Biol. Chem. 284, 14891–14903 [DOI] [PMC free article] [PubMed] [Google Scholar]
- 19. Lewis N. E., Marty N. J., Kathir K. M., Rajalingam D., Kight A. D., Daily A., Kumar T. K., Henry R. L., Goforth R. L. (2010) A dynamic cpSRP43-Albino3 interaction mediates translocase regulation of chloroplast signal recognition particle (cpSRP)-targeting components. J. Biol. Chem. 285, 34220–34230 [DOI] [PMC free article] [PubMed] [Google Scholar]
- 20. Dünschede B., Bals T., Funke S., Schünemann D. (2011) Interaction studies between the chloroplast signal recognition particle subunit cpSRP43 and the full-length translocase Alb3 reveal a membrane-embedded binding region in Alb3 protein. J. Biol. Chem. 286, 35187–35195 [DOI] [PMC free article] [PubMed] [Google Scholar]
- 21. Falk S., Ravaud S., Koch J., Sinning I. (2010) The C terminus of the Alb3 membrane insertase recruits cpSRP43 to the thylakoid membrane. J. Biol. Chem. 285, 5954–5962 [DOI] [PMC free article] [PubMed] [Google Scholar]
- 22. Jia Y., Talaga D. S., Lau W. L., Lu H. S. M., DeGrado W. F., Hochstrasser R. M. (1999) Folding dynamics of single GCN-4 peptides by fluorescence resonant energy transfer confocal microscopy. Chem. Phys. 247, 69–83 [Google Scholar]
- 23. Talaga D. S., Lau W. L., Roder H., Tang J., Jia Y., DeGrado W. F., Hochstrasser R. M. (2000) Dynamics and folding of single two-stranded coiled-coil peptides studied by fluorescent energy transfer confocal microscopy. Proc. Natl. Acad. Sci. U.S.A. 97, 13021–13026 [DOI] [PMC free article] [PubMed] [Google Scholar]
- 24. Schuler B., Lipman E. A., Eaton W. A. (2002) Probing the free-energy surface for protein folding with single-molecule fluorescence spectroscopy. Nature 419, 743–747 [DOI] [PubMed] [Google Scholar]
- 25. Kuzmenkina E. V., Heyes C. D., Nienhaus G. U. (2005) Single-molecule Foerster resonance energy transfer study of protein dynamics under denaturing conditions. Proc. Natl. Acad. Sci. U.S.A. 102, 15471–15476 [DOI] [PMC free article] [PubMed] [Google Scholar]
- 26. Zhuang X., Bartley L. E., Babcock H. P., Russell R., Ha T., Herschlag D., Chu S. (2000) A single-molecule study of RNA catalysis and folding. Science 288, 2048–2051 [DOI] [PubMed] [Google Scholar]
- 27. Nishimura S. Y., Lord S. J., Klein L. O., Willets K. A., He M., Lu Z., Twieg R. J., Moerner W. E. (2006) Diffusion of lipid-like single-molecule fluorophores in the cell membrane. J. Phys. Chem. B 110, 8151–8157 [DOI] [PMC free article] [PubMed] [Google Scholar]
- 28. Cui B., Wu C., Chen L., Ramirez A., Bearer E. L., Li W. P., Mobley W. C., Chu S. (2007) One at a time, live tracking of NGF axonal transport using quantum dots. Proc. Natl. Acad. Sci. U.S.A. 104, 13666–13671 [DOI] [PMC free article] [PubMed] [Google Scholar]
- 29. Gao F., Mei E., Lim M., Hochstrasser R. M. (2006) Probing lipid vesicles by bimolecular association and dissociation trajectories of single molecules. J. Am. Chem. Soc. 128, 4814–4822 [DOI] [PubMed] [Google Scholar]
- 30. Sharonov A., Hochstrasser R. M. (2006) Wide-field subdiffraction imaging by accumulated binding of diffusing probes. Proc. Natl. Acad. Sci. U.S.A. 103, 18911–18916 [DOI] [PMC free article] [PubMed] [Google Scholar]
- 31. Chen P., Andoy N. M., Benítez J. J., Keller A. M., Panda D., Gao F. (2010) Tackling metal regulation and transport at the single-molecule level. Nat. Prod. Rep. 27, 757–767 [DOI] [PMC free article] [PubMed] [Google Scholar]
- 32. Dickson R. M., Cubitt A. B., Tsien R. Y., Moerner W. E. (1997) On/off blinking and switching behaviour of single molecules of green fluorescent protein. Nature 388, 355–358 [DOI] [PubMed] [Google Scholar]
- 33. Lu H. P., Xun L., Xie X. S. (1998) Single molecule enzymatic dynamics. Science 282, 1877–1882 [DOI] [PubMed] [Google Scholar]
- 34. Yang H., Luo G., Karnchanaphanurach P., Louie T. M., Rech I., Cova S., Xun L., Xie X. S. (2003) Protein conformational dynamics probed by single-molecule electron transfer. Science 302, 262–266 [DOI] [PubMed] [Google Scholar]
- 35. Ha T., Enderle T., Ogletree D. F., Chemla D. S., Selvin P. R., Weiss S. (1996) Probing the interaction between two single molecules: fluorescence resonance energy transfer between a single donor and a single acceptor. Proc. Natl. Acad. Sci. U.S.A. 93, 6264–6268 [DOI] [PMC free article] [PubMed] [Google Scholar]
- 36. Roy R., Hohng S., Ha T. (2008) A practical guide to single-molecule FRET. Nat. Methods 5, 507–516 [DOI] [PMC free article] [PubMed] [Google Scholar]
- 37. Holdermann I., Meyer N. H., Round A., Wild K., Sattler M., Sinning I. (2012) Chromodomains read the arginine code of post-translational targeting. Nat. Struct. Mol. Biol. 19, 260–263 [DOI] [PubMed] [Google Scholar]
- 38. Sivaraja V., Kumar T. K., Leena P. S., Chang A.-N., Vidya C., Goforth R. L., Rajalingam D., Arvind K., Ye J.-L., Chou J., Henry R., Yu C. (2005) Three-dimensional solution structures of the chromodomains of cpSRP43. J. Biol. Chem. 280, 41465–41471 [DOI] [PubMed] [Google Scholar]
- 39. Wriggers W. (2010) Using Situs for the integration of multi-resolution structures. Biophys. Rev. 2, 21–27 [DOI] [PMC free article] [PubMed] [Google Scholar]
- 40. Pettersen E. F., Goddard T. D., Huang C. C., Couch G. S., Greenblatt D. M., Meng E. C., Ferrin T. E. (2004) UCSF Chimera—a visualization system for exploratory research and analysis. J. Comput. Chem. 25, 1605–1612 [DOI] [PubMed] [Google Scholar]
- 41. Phillips J. C., Braun R., Wang W., Gumbart J., Tajkhorshid E., Villa E., Chipot C., Skeel R. D., Kalé L., Schulten K. (2005) Scalable molecular dynamics with NAMD. J. Comput. Chem. 26, 1781–1802 [DOI] [PMC free article] [PubMed] [Google Scholar]
- 42. Brooks B. R., Brooks C. L., 3rd, Mackerell A. D., Jr., Nilsson L., Petrella R. J., Roux B., Won Y., Archontis G., Bartels C., Boresch S., Caflisch A., Caves L., Cui Q., Dinner A. R., Feig M., Fischer S., Gao J., Hodoscek M., Im W., Kuczera K., Lazaridis T., Ma J., Ovchinnikov V., Paci E., Pastor R. W., Post C. B., Pu J. Z., Schaefer M., Tidor B., Venable R. M., Woodcock H. L., Wu X., Yang W., York D. M., Karplus M. (2009) CHARMM: the biomolecular simulation program. J. Comput. Chem. 30, 1545–1614 [DOI] [PMC free article] [PubMed] [Google Scholar]
- 43. Humphrey W., Dalke A., Schulten K. (1996) VMD: visual molecular dynamics. J. Mol. Graph. 14, 33–38, 27–28 [DOI] [PubMed] [Google Scholar]
- 44. Arkhipov A., Freddolino P. L., Schulten K. (2006) Stability and dynamics of virus capsids described by coarse-grained modeling. Structure 14, 1767–1777 [DOI] [PubMed] [Google Scholar]
- 45. Scopes R. K. (1974) Measurement of protein by spectrophotometry at 205 nm. Anal. Biochem. 59, 277–282 [DOI] [PubMed] [Google Scholar]
- 46. Goforth R. L., Peterson E. C., Yuan J., Moore M. J., Kight A. D., Lohse M. B., Sakon J., Henry R. L. (2004) Regulation of the GTPase cycle in post-translational signal recognition particle-based protein targeting involves cpSRP43. J. Biol. Chem. 279, 43077–43084 [DOI] [PubMed] [Google Scholar]
- 47. Gao F., Kreidermacher A., Fritsch I., Heyes C. D. (2013) 3D imaging of flow patterns in an internally-pumped microfluidic device: redox magnetohydrodynamics and electrochemically generated density gradients. Anal. Chem. 85, 4414–4422 [DOI] [PMC free article] [PubMed] [Google Scholar]
- 48. Young M. E., Carroad P. A., Bell R. L. (1980) Estimation of diffusion coefficients of proteins. Biotechnol. Bioeng. 22, 947–955 [Google Scholar]
- 49. Kathir K. M., Rajalingam D., Sivaraja V., Kight A., Goforth R. L., Yu C., Henry R., Kumar T. K. (2008) Assembly of chloroplast signal recognition particle involves structural rearrangement in cpSRP43. J. Mol. Biol. 381, 49–60 [DOI] [PMC free article] [PubMed] [Google Scholar]
- 50. Schuler B., Lipman E. A., Steinbach P. J., Kumke M., Eaton W. A. (2005) Polyproline and the spectroscopic ruler revisited with single-molecule fluorescence. Proc. Natl. Acad. Sci. U.S.A. 102, 2754–2759 [DOI] [PMC free article] [PubMed] [Google Scholar]
- 51. Tzvetkova-Chevolleau T., Hutin C., Noël L. D., Goforth R., Carde J.-P., Caffarri S., Sinning I., Groves M., Teulon J.-M., Hoffman N. E., Henry R., Havaux M., Nussaume L. (2007) Canonical signal recognition particle components can be bypassed for posttranslational protein targeting in chloroplasts. Plant Cell 19, 1635–1648 [DOI] [PMC free article] [PubMed] [Google Scholar]
Associated Data
This section collects any data citations, data availability statements, or supplementary materials included in this article.