

Abstract
Signaling pathways can behave as switches or rheostats, generating binary or graded responses to a given cell stimulus. We evaluated whether a single signaling pathway can simultaneously encode a switch and a rheostat. We found that the kinase Hog1 mediated a bifurcated cellular response: Activation and commitment to adaptation to osmotic stress are switch-like, whereas protein induction and the resolution of this commitment are graded. Through experimentation, bioinformatics analysis, and computational modeling, we determined that graded recovery is encoded through feedback phosphorylation and a gene induction program that is both temporally staggered and variable across the population. This switch-to-rheostat signaling mechanism represents a versatile stress adaptation system, wherein a broad range of inputs generate an “all-in” response that is later tuned to allow graded recovery of individual cells over time.
INTRODUCTION
Mitogen-activated protein kinase (MAPK) pathways are dynamic signaling modules present in all eukaryotic cells. These modules are activated by an environmental input, such as the introduction of a hormone or cytotoxic stress, which generates a signal that is transmitted by sequential phosphorylation of a protein kinase cascade to a terminal MAPK. Once activated, the MAPK phosphorylates numerous protein substrates throughout the cell—effectively transmitting the input signal as a distinct pattern of protein phosphorylation events. This phosphorylation-encoded information leads to coordinated changes in protein activity, localization, and abundance—a process that ultimately decodes the input information into adaptive behavior. For example, human growth factors activate the extracellular signal–regulated kinase (ERK) MAPK module, which initiates cell division (1). Cytotoxic agents activate the p38 and c-Jun N-terminal kinase (JNK) MAPK modules, resulting in apoptosis, inflammation, or autophagy (2, 3). By deciphering how the cell encodes and decodes information using MAPK modules, we can begin to understand the molecular mechanisms driving animal development, behavior, homeostasis, and disease.
The high osmolarity glycerol (HOG) pathway of the yeast Saccharomyces cerevisiae has been used to investigate how cells encode and decode environmental information into appropriate adaptive responses (4, 5). The HOG pathway has two distinct branches, each activated by osmotic stress. The Sln1 branch is composed of a two-component system evolutionarily conserved in bacteria and yeast. The Sho1 branch is activated by an integral membrane scaffold similar to those of numerous mammalian systems. These two branches converge on a shared MAPK kinase (MAPKK), Pbs2, and the MAPK Hog1. Activation of Hog1 triggers a cascade of signaling and transcription events that promote stress adaptation through osmolyte synthesis and other responses (6). Notably, Hog1 was central in the discovery of the mammalian stress adaptation protein kinase JNK, demonstrating the conservation of MAPK function from yeast to humans (7).
MAPK signaling is a dynamic process with complexity that extends beyond mere activation and inactivation. Rather, these modules are tunable communicators of information wherein the onset, amplitude, and duration of MAPK activation combine to generate a unique signaling profile (8). These profiles directly affect how input information is encoded and ultimately decoded to change cellular behavior. For example, increasing the duration of ERK MAPK signaling causes the input used to encode cell division to instead initiate differentiation (9). Appropriate responses to stress, mitogens, and other stimuli also hinge upon producing distinct signaling profiles (10–12). However, it remains unclear how these signaling profiles are generated. Identifying the mechanisms that coordinate the onset, amplitude, and duration of MAPK activation will allow us to interpret, predict, and intervene in the information transmission processes of the cell. Such interventions may eventually include drugs that restore the MAPK signaling profile in disease states.
The terms “switch” and “rheostat” are traditionally used to describe the relationship between input and output in signaling systems. A switch produces a binary, on or off, output with no intermediary responses. A rheostat generates a graded output. Cell division uses switches to threshold checkpoints at the level of MAPK signaling (13) and cell cycle progression (14). Chemotaxis uses rheostats to flexibly track and dynamically adjust to signal amplitude and direction. In some cases, a rheostat can beget a switch (15). For example, activation of the MAPK Fus3 occurs in a graded, dose-dependent manner but leads to switch-like arrest of cell division and cell-cell fusion (16–19). Conversely, activation of Hog1 is switch-like but ultimately leads to graded outputs (18, 20–22). Unresolved are the mechanisms that can encode such diverse input-output relationships.
Here, we define the mechanisms encoding the Hog1 response and its consequences on downstream output. Our strategy uses a new method to ratiometrically quantify phosphorylation at multiple levels of the Hog1 signaling cascade over time and in response to a wide range of input concentrations. In so doing, we define a linear function that relates the stimulus dose to Hog1 activity duration, a profile we had previously termed “dose-to-duration signaling” (23). Dose-to-duration signaling describes the ability of cells to convert stimulus strength into signal duration. In this way, cells can respond to changes in a stimulus above that needed for saturation of receptors. We show that Hog1 not only rapidly engages all cells in the adaptive process but also allows individual cells to progress down a temporally graded adaptive program. Both the switch-like activation and the graded recovery depend on feedback from Hog1. Our findings reveal how a switch and rheostat can work simultaneously to ensure an appropriate response to an environmental stress.
RESULTS
Hog1 is a switch-like timer that linearly transforms dose to duration
Our goal was to identify the relationship between input strength, Hog1 activity, and signaling output. We additionally endeavored to define the proteins and processes that encode the Hog1 signaling profile. Hog1 is activated when the MAPKK Pbs2 phosphorylates the activation loop residues Thr174 and Tyr176 (24). Accordingly, activation of Hog1 has traditionally been measured using antibodies raised against the phosphorylated activation loop of a homologous MAPK, p38. Alternatively, activation of the kinase has also been measured by tracking the translocation of a fusion protein composed of Hog1 and green fluorescent protein (GFP) into the nucleus. Neither method provides simultaneous measurement of the timing and amplitude of MAPK activation. The antibody-based method does not provide the stoichiometry of activated and inactivated states and does not fully differentiate between the monophosphorylated and dually phosphorylated forms of the kinase (fig. S1). Measurements of nuclear translocation suffer from similar shortcomings. For example, monophosphorylation is sufficient for nuclear translocation but not for full activation of the kinase (24, 25). Conversely, Hog1 promotes stress resistance and mitophagy under conditions that do not normally lead to nuclear translocation (26, 27). Thus, it remains unclear the extent to which Hog1 phosphorylation and nuclear translocation are correlated. Given these limitations, we sought an alternative method to accurately measure the dynamics and stoichiometry of Hog1 phosphorylation.
Phos-tag is a metal-coordinating small molecule with a high affinity for phosphorylated serine, threonine, and tyrosine (28). Addition of Phos-tag to acrylamide gels slows the migration of polypeptides in proportion to the number of phosphorylated sites on the molecule. Accordingly, we analyzed whole-cell lysates using a modified method for Phos-tag analysis in which we optimized the bis-tris gel preparations and yeast lysate samples to resolve a wide range of protein sizes and phosphorylation states (see Materials and Methods for details).
By this optimized Phos-tag gel electrophoresis method, we found that Hog1 was unphosphorylated under basal conditions, as previously reported (29), whereas cells osmostressed with 550 mM KCl for 5 min exhibited slowed Hog1 migration (Fig. 1A). Strains harboring Hog1 with mutations T174A or Y176F exhibited faster migration, in accordance with a reduced number of phosphorylated sites on the polypeptide. Deletion of the MAPKK Pbs2 resulted in migration of Hog1 identical to that observed in unstimulated cells. We never observed accumulation of monophosphorylated Hog1 in wild-type cells. Strains lacking each of the phosphatases (Ptc1, Ptc2, Ptp2, and Ptp3) known to act on Hog1 (30) likewise produced only the dually phosphorylated species, suggesting redundant functions of the MAPK phosphatases. The ptp2/ptp3 mutant appeared to be partially activated before stimulus but fully adapted after salt stress. These results showed that the entire pool of cellular Hog1 is dually phosphorylated in response to osmotic stress.
Fig. 1. The Hog1 signaling profile is a linear transducer that converts dose to duration.
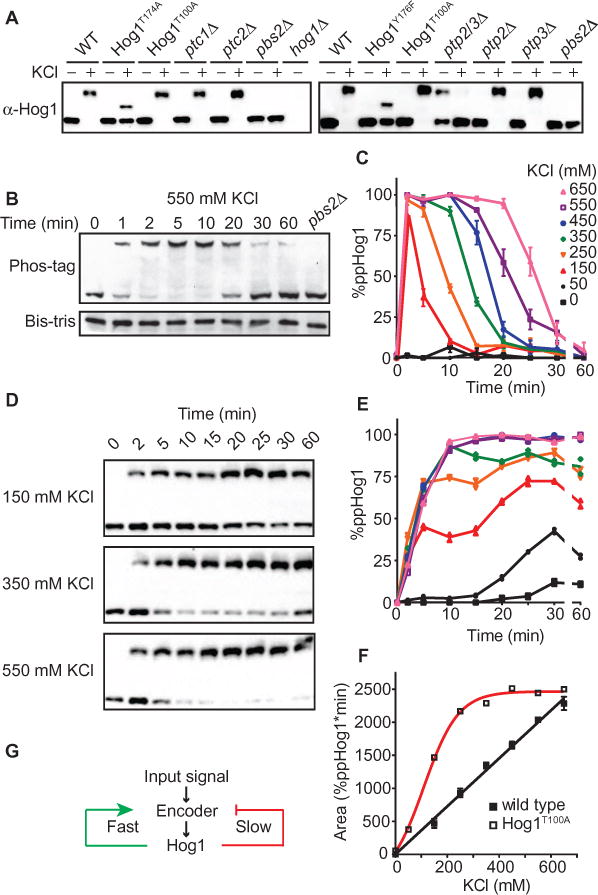
(A) Validation of the Phos-tag method for resolving dually phosphorylated and activated (top band) or nonphosphorylated and unactivated (bottom band) Hog1. Cells untreated (−) or treated for 5 min (+) with 550 mM KCl were lysed, resolved by Phos-tag SDS-PAGE, and immunoblotted with Hog1 antibodies. Hog1T174A and Hog1Y176F, mutants lacking one of two phosphorylation sites; Hog1T100A, analog-sensitive mutant; ptc1Δ and ptc2Δ, serine/threonine phosphatase mutants; ptp2Δ and ptp3Δ, tyrosine phosphatase mutants; pbs2Δ and hog1Δ, MAPKK and MAPK mutants, respectively. Data are representative of two experiments. (B) Hog1 activation over time. Wild-type (WT) cells were treated with 550 mM KCl, lysed, and probed by immunoblotting with Hog1 antibodies. Top, Phos-tag SDS PAGE. Bottom, identical samples processed by SDS-PAGE in the absence of Phos-tag. pbs2Δ cells served as a negative control. Data are representative of two experiments. (C) Hog1 signaling profile. WT cells were exposed to the indicated concentrations of KCl. Percentage of dually phosphorylated Hog1 (ppHog1) was calculated by dividing intensity of the upper band by the total intensity of all Hog1 bands in each lane. Data are means ± SEM (n > 3 experiments). (D) Hog1T100A activation by the indicated concentrations of KCl in the presence of the inhibitor 1-NA-PP1. Lysates were resolved by Phos-tag SDS-PAGE and immunoblotted with Hog1 antibodies. Data are representative of two experiments. (E) Hog1T100A signaling profile in the presence of the kinase inhibitor 1-NA-PP1 (n = 2). (F) Data from (C) and (E) are presented as area under the curve. (G) Diagram of potential positive and negative feedback represented by green and red lines, respectively.
Our next objective was to define the Hog1 signaling profile, that is, the amplitude and duration of Hog1 activation as a function of time and dose of stimulus. Detection by p38 antibodies or by nuclear translocation had previously revealed a dose-to-duration relationship for the HOG pathway (29, 31). Previous studies did not determine the stoichiometry of phosphorylation or whether dual phosphorylation was sequential (processive) or stepwise (distributive). Therefore, we performed eight time course experiments (Fig. 1, B and C) using a range of salt concentrations up to 650 mM, a dose past which cellular compression begins to restrict molecular diffusion (32). These experiments indicated that Hog1 was phosphorylated processively and that >80% of cellular pool of Hog1 was doubly phosphorylated even in response to low doses of salt (150 mM KCl). The appearance of activated Hog1 at 150 mM KCl was consistent with previous studies demonstrating that this concentration leads to transient activation of the HOG pathway (29, 31). Although activation of Hog1 occurred rapidly at all doses tested, the duration of Hog1 activity was graded, with increasing stimulus concentrations producing longer periods of Hog1 phosphorylation (defined as the percentage of doubly phosphorylated Hog1, relative to total Hog1, for any specific concentration of KCl). Additionally, deactivation of Hog1 was much slower than its activation, requiring about 10 min to go from the fully activated to the inactivated state, regardless of input strength. Thus, these results showed that the activation of Hog1 is switch-like and fast, the duration of activation is graded, and the return to baseline is slow. This signaling profile represents the capacity of the pathway to reliably convert input strength into the duration of MAPK activity.
Hog1 feedback phosphorylation encodes dose-to-duration signaling
In our previous modeling analysis, we postulated that dose-to-duration signaling is mediated by a feedback mechanism (23). The MAPK may be the origin of this feedback, conveying information through phosphorylation to tune pathway output. Positive feedback drives switch-like behavior, whereas negative feedback tunes oscillators and rheostats (33). The Hog1 profile has features of both a switch and a rheostat. Therefore, feedback in this pathway may be a combination of positive and negative feedback loops. Indeed, we previously identified two negative feedback targets of Hog1 in this pathway (34, 35). To assess the overall contribution of Hog1 feedback on the signaling profile, we blocked Hog1 activity using a variant of the kinase (Hog1T100A) (36) engineered to be sensitive to the adenosine triphosphate (ATP) analog 1-NA-PP1 [1-(1,1-dimethylethyl)-3-(1-naphthalenyl)-1H-pyrazolo[3,4-d]pyrimidin-4-amine] (37). We predicted that blocking feedback phosphorylation would disrupt the dose-to-duration relationship for Hog1 activation. Because in the absence of the inhibitor the T100A mutation has minimal effects on Hog1 activity, cells bearing Hog1T100A will phosphorylate and activate the kinase normally, but the kinase is selectively inactivated within minutes of analog addition (36). Such acute inhibition limits the opportunity for genetic adaptation or changes in basal activity of the pathway.
We pretreated the cells for 2 min with 1-NA-PP1, then exposed the cells to a range of salt concentrations, and harvested them at different times (Fig. 1D). Compared with the response of wild-type cells (Fig. 1C), acute inhibition of kinase activity decreased the rate and final amplitude of Hog1 phosphorylation (Fig. 1E). The decreased rate of phosphorylation indicated a requirement of Hog1 catalytic activity for switch-like activation of the kinase, which suggests the presence of a Hog1-mediated positive feedback loop. Moreover, rather than returning to baseline as occurred in the wild-type Hog1 cells, cells in which the analog-sensitive Hog1 was inhibited remained phosphorylated for the duration of the experiment (Fig. 1E). This persistent phosphorylation of Hog1 demonstrated a requirement of Hog1 catalytic activity for its own dephosphorylation, indicative of a Hog1-mediated negative feedback loop. As expected, loss of feedback phosphorylation disrupted the linear relationship between salt concentration and Hog1 activation that was observed for cells with wild-type Hog1 (Fig. 1F). These results point to the existence of at least two feedback mechanisms: (i) a rapid positive feedback loop that ensures switch-like activation at all doses of stimulus and (ii) a slow negative feedback loop that ensures graded inactivation over time (Fig. 1G). Thus, Hog1 feedback encodes both a switch and a rheostat, a behavior that we refer to as a tunable bifurcated response.
Hog1 feedback encodes dose as graded bits of patterned phosphorylation
For Hog1 to encode dose-to-duration signaling, some target of Hog1 must be regulated in a graded manner. Phosphorylation is the currency of MAPK signaling, and many MAPK substrates are phosphorylated at multiple sites. Such multisite phosphorylation can be compared to the binary bit language of computing (38). By this analogy, a single protein phosphorylation event shifts the bit state of the substrate amino acid from 0 (unphosphorylated) to 1 (phosphorylated). The number of potential phosphorylation sites on a protein represents its bit length. For example, Hog1 can accept two phosphorylations, and thus, it has a bit length of 2, coding 22 or 4 bit states. However, our Phos-tag analysis indicated that Hog1 only persists in 2 of its 4 potential states, unphosphorylated or dually phosphorylated. Thus, Hog1 functions as a binary switch with just two potential states, on or off. Additionally, the experiments with the analog-sensitive Hog1 showed that feedback regulation is a critical component of dose-to-duration signaling and that feedback phosphorylation converts the Hog1 switch into a tunable rheostat. We next considered how this conversion might be accomplished through bit state encoding on feedback substrates.
More than a dozen signaling components of the Hog1 pathway have been identified (6), each having multiple potential MAPK phosphorylation sites. Discerning the phosphorylation state of each feedback site and its individual contribution to dose-to-duration signaling is impractical. Additionally, no single feedback loop is likely to encode the entire complex topography of the Hog1 signaling profile. However, the relative contribution of a single loop can be investigated in isolation. The MAPK kinase kinase (MAPKKK) scaffold protein Ste50 is a substrate of Hog1 (18, 35, 39) and contains five documented sites for MAPK phosphorylation, amounting in 25 or 32 potential bit states. We used Phos-tag polyacrylamide gel electrophoresis (PAGE) to detect this rich diversity of Ste50 bit states (Fig. 2A). After exposure of the cells to 550 mM KCl, Ste50 rapidly accumulated as a high-migrating species and then relaxed back to the original migration pattern over time (Fig. 2A). Because the phosphorylated species was markedly reduced in a pbs2Δ mutant, Ste50 feedback phosphorylation depended on Hog1 activation.
Fig. 2. Feedback phosphorylation of Ste50 is dose-dependent.
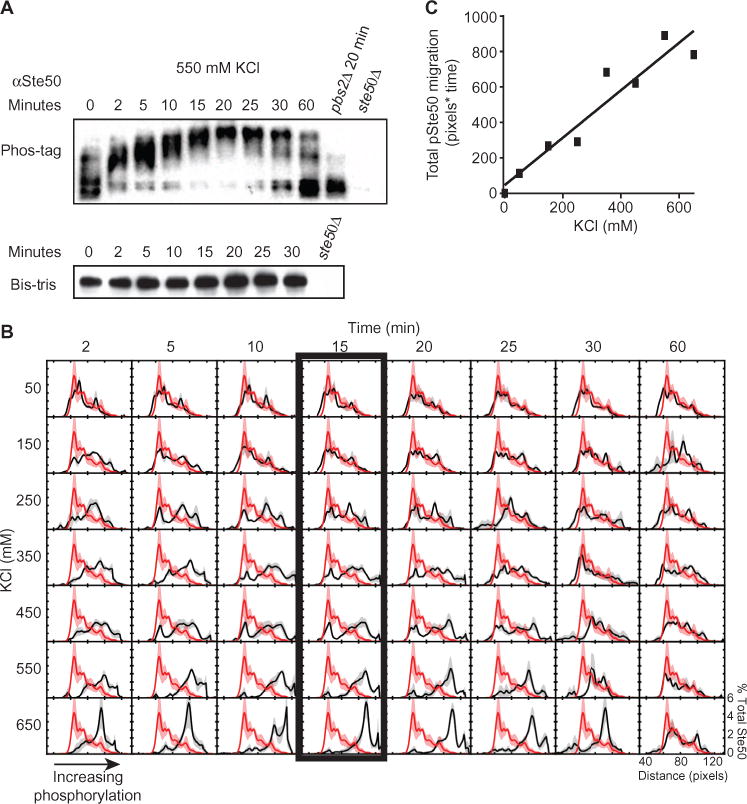
(A). Ste50 phosphorylation over time. WT and the indicated mutant strains were treated with 550 mM KCl, harvested, and immunoblotted for Ste50. Top, Phos-tag SDS PAGE. Bottom, identical samples in the absence of Phos-tag. (B) Ste50 phosphorylation profile. WT cells were treated as in (A) with the indicated concentrations of KCl. Red, mean Ste50 distribution measured from unstimulated cells; black, mean Ste50 distribution measured for each dose and time in the variable matrix. Shading, ±SEM (red and gray) (n = 3). (C) Integration of the Ste50 phosphorylation profile. Data are presented as mean area under the curve ± SEM.
To explore whether the phosphorylation of Ste50 was graded, we measured the bit states occupied by Ste50 in cells exposed to a range of concentrations of KCl and for a range of times, and then internally normalized the data for intensity and aligned the results computationally (see Materials and Methods) to generate an average bit-state occupancy histogram for each condition. This analysis revealed that Ste50 phosphorylation was graded, occupying a smaller number of increasingly higher bit states as input strength increased. These phosphorylation events occurred rapidly, with obvious shifts after 2 min of stimulus addition. Peak Ste50 phosphorylation occurred by 15 min for all stimulus concentrations (Fig. 2B, box) and returned to baseline by 30 to 60 min. By plotting and integrating the median migration distances of Ste50 in the Phos-tag PAGE, we calculated a linear relationship between input strength and the accumulation of phosphorylated Ste50 (Fig. 2C). These data showed a dose- and duration-dependent increase in Ste50 phosphorylation that mirrored activation of the kinase. Thus, Hog1 encodes dose as a pattern of graded bit-state phosphorylation events on the Ste50 substrate. Although Hog1 is phosphorylated as a switch, Ste50 is phosphorylated as a rheostat.
Ste50 is a target of positive and negative feedback
Our experimental results indicated the existence of at least two feedback loops mediated by Hog1: (i) rapid positive feedback that ensures full pathway activity for a large range of salt concentrations and (ii) delayed negative feedback that acts as a timer for converting dose to duration. We had previously published a computational model that captured the amplitude of the response to a single increased concentration of KCl, which activates Sho1 in the model (35). The model predicted that negative feedback above the level of the MAPK cascade is important for Hog1 deactivation (34). However, our previous model failed to recapitulate our current experimental data (fig. S2); in particular, the removal of negative feedback was not sufficient to produce graded Hog1 activation or a dose-dependent steady state. We hypothesized that the model failed because it did not account for Hog1-dependent positive feedback and only considered a single negative feedback loop mediated by Hog1 phosphorylation of Sho1. Therefore, we developed a new mathematical model (see Materials and Methods for details) that includes a combination of Hog1-mediated negative and positive feedback loops at the level of, or upstream of, the MAPKKK Ste11. The first negative feedback loop attenuates the signal, and the second increases the deactivation rate of the MAPKKK, Ste11. To model the delay in negative regulation, we assumed that the negative feedback is mediated by a species “X” that is activated by nuclear Hog1; for example, X could be one of the transcription factors activated by Hog1. In the new model, we assumed that the signal directly activates the Ste11/Ste50 complex and that Ste11 activation is subject to positive feedback by Hog1 and negative feedback by X. Active Ste11 activates Pbs2, which then activates Hog1. Once activated, Hog1 shuttles into the nucleus, where it activates X. Our results would not qualitatively change if, instead of activating X, Hog1 induced the expression of X; for example, X could be one of the proteins induced by Hog1 activation.
To perform parameter estimation, we used a Monte Carlo method (16). This approach identified parameter sets in which the Hog1-dependent positive feedback loop ensures rapid full activation of the MAPK, and the delayed negative feedback loop, through an intermediary target (X), generates slow adaptation to the input signal. The combined action of these feedback loops recapitulated the observed behaviors of Hog1, including switch-like activation and dose-to-duration deactivation (compare Fig. 3, A, B, and C, with Fig. 1, C, E, and F, respectively). Although the model has Ste11 as the target of positive feedback, it does not distinguish between direct phosphorylation of Ste11, its binding partner Ste50, the activating kinase Ste20, or some combination of these potential targets.
Fig. 3. Modeling positive and negative feedback by Hog1.
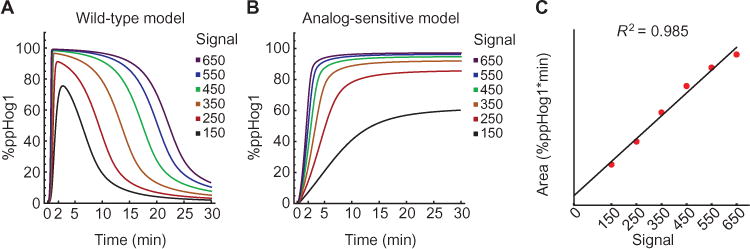
Mathematical model of activated Hog1 (ppHog1, y axis) over time (x axis) as a function of six input signal strengths. (A) Hog1 signaling profile. Model includes Hog1 activation that induces feedback. (B) Hog1T100A signaling profile. Model allows Hog1 activation but has no feedback. (C) Integration of Hog1 signaling profile. The total amount of activated Hog1 produced for each input signal (x axis) is computed by integrating each curve in (A) (y axis).
Ste50 is an established target of negative feedback regulation by Hog1 (18, 35, 39). However, we considered whether Ste50 also functions as a target for positive feedback regulation, and whether graded feedback to Ste50 contributed to the dose-to-duration signal. We replaced all five documented Hog1 phosphorylation sites on Ste50 and determined the Hog1 signaling profile for this mutant. Ablation of Ste50 feedback phosphorylation disrupted the linearity of the Hog1 dose-to-duration response (Fig. 4A) and decreased the duration of Hog1 activity (Fig. 4B) (signal returned to baseline within 30 min in the Ste505A mutant cells exposed to 550 mM KCl; wild-type cells required more than 30 min) without affecting the amplitude of the signal (fig. S3). In contrast, the Ste50 mutant did not alter pathway output when measured with a Hog1-dependent promoter fused to the β-galactosidase gene (CRE-lacZ) (40) (Fig. 4C). Thus, these data revealed a time- and dose-dependent increase in Ste50 phosphorylation. Moreover, the Phos-tag analysis indicated that Ste50 phosphorylation results in positive feedback at low concentrations of KCl and negative feedback at high concentrations (Fig. 4A).
Fig. 4. Hog1 encodes dose-to-duration signaling through graded phosphorylation.
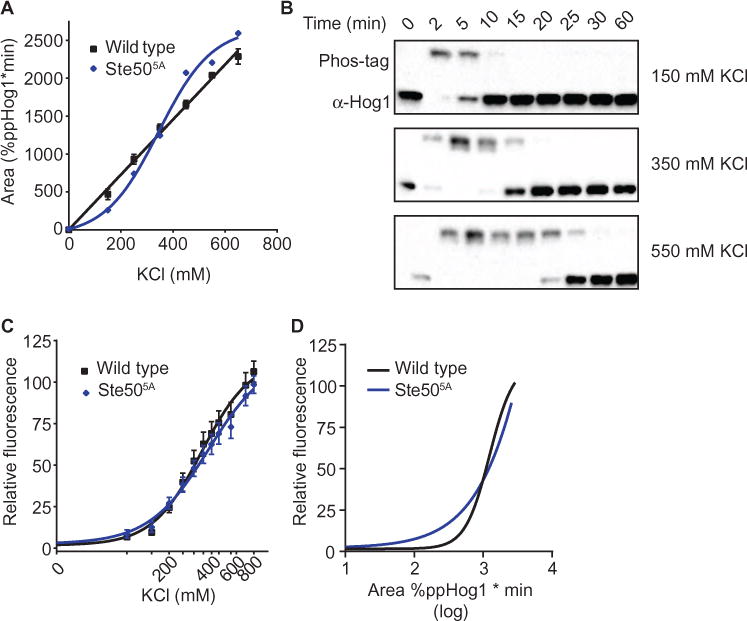
(A) Integration of the Hog1 signaling profile for the Ste505A strain. WT is shown for reference (see Fig. 1). Data from fig. S3 are presented as area under the curve for Ste505A. (B) Representative data from the signaling in (A). Lysates were resolved by Phos-tag SDS-PAGE and immunoblotted for Hog1. (C) Transcription reporter data for WT and Ste505A. Data are mean relative fluorescence ± SEM (n > 4). 0, untreated control. (D) Comparison of transcriptional output to total Hog1 activity. Computational transformation of data in (C), where x-axis values are replaced using Hog1 duration as determined in (A) for WT and Ste505A. See also fig. S3 for the Hog1 signaling profile for the Ste505A strain used to compute (A).
The Hog1 signaling profile is encoded by multiple upstream components
Our data showed that Hog1 functions by converting input strength to the duration of Hog1 activity, in part through feedback at the level of Ste50. The importance of Ste50 phosphorylation in tuning the osmotic stress response was evident from direct observation of Hog1 activity (Fig. 4A) but not from the transcription reporter assay (Fig. 4C), and this difference was evident when the two are plotted against each other (Fig. 4D).
To explore the dependence of transcription on Hog1 activity and salt concentration, we monitored pathway output using the transcriptional reporter CRE-lacZ in cells in which we individually deleted each of 14 nonessential upstream components of the Hog1 pathway (Fig. 5A), measured transcriptional output as a function of KCl concentration, and compared this to the response of wild-type cells (Fig. 5, B and C). CRE-lacZ induction in wild-type cells required a minimum of 200 mM KCl and exhibited a Hill slope of ~3 (Fig. 6A). We used the difference in the Hill slope and the EC50 (the concentration of KCl needed to stimulate 50% of the maximal amount of doubly phosphorylated Hog1) to compare the relative change in reporter output between these strains. Compared to wild type, deletion of SSK1, SSK2, SHO1, STE20, or STE50 increased the EC50; deletion of SSK1 or SSK2 also increased the Hill slope (Figs. 5C and 6A). These changes in CRE-lacZ activity revealed several components that act as potential encoders of Hog1-mediated transcription.
Fig. 5. The Hog1 signaling profile can be reengineered through component gene deletions.
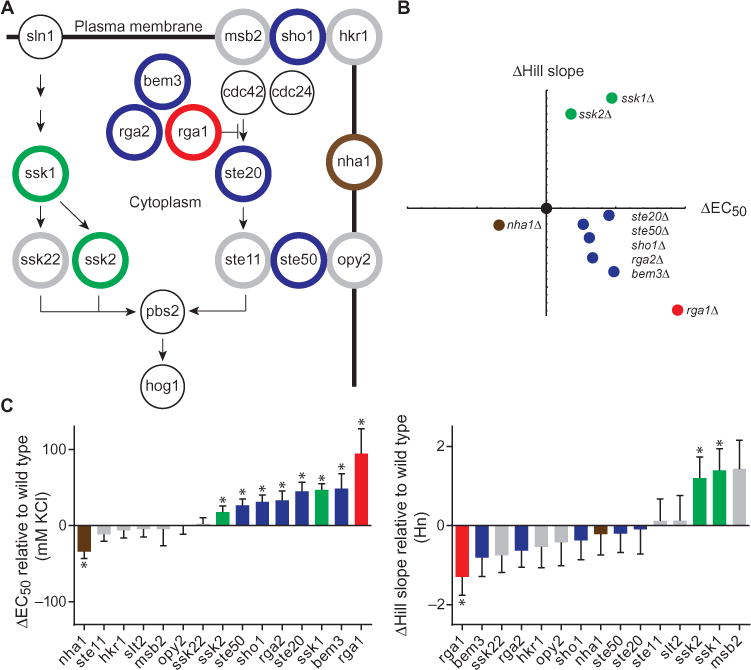
(A) Diagram of the Hog1 signaling pathway. Gray circles, pathway component deletions without effect. Black circles, essential pathway components that were not evaluated. The other colored circles represent genes that altered either the Hill slope, EC50, or both for the transcriptional reporter response. (B) Summary of transcription reporter data. 8XCRE-LacZ Hill slope and EC50 for each mutant strain plotted relative to WT (black dot) and color-coded as in (A). Only significant (P < 0.05) changes are displayed. (C) Rank order of change in transcription reporter EC50 and Hill slope for each mutant strain relative to WT. Data are mean relative fluorescence ± SEM (n > 4). Statistical significance was calculated by two-tailed t test (*P < 0.05).
Fig. 6. The Hog1 signaling profile is insufficient to predict downstream output.
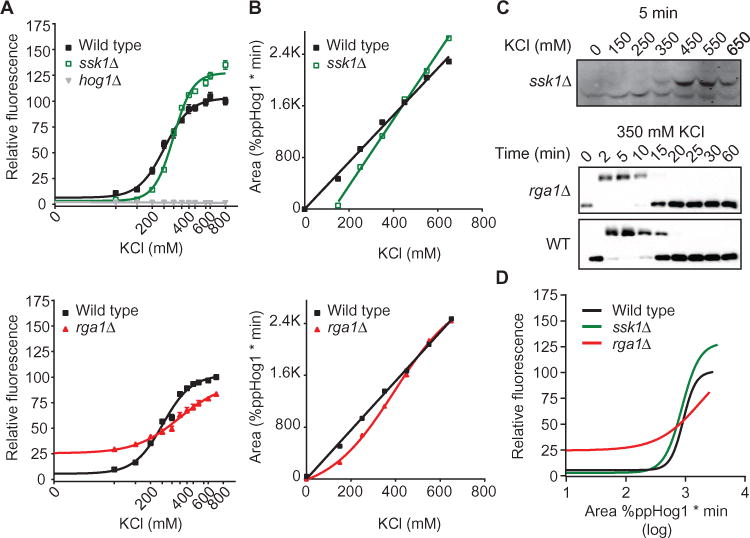
(A) Transcription reporter dose-response curves for WT, ssk1Δ, rga1Δ, and hog1Δ strains. Data are mean relative fluorescence ± SEM (n > 4). (B) Integration of Hog1 signaling profiles for ssk1Δ (top) and rga1Δ (bottom) strains. WT is shown for reference (see Fig. 1). (C) Top, representative data from (B). Bottom, representative time course for WT and rga1Δ strains in the nonlinear range for the mutant. Lysates were resolved by Phos-tag SDS-PAGE and immunoblotted for Hog1. (D) Comparison of transcriptional output to total Hog1 activity. Computational transformation of data in (A), where x-axis values correspond to the Hog1 duration values determined in (B) for WT, ssk1Δ, and rga1Δ.
We also assessed the contribution of the three guanosine triphosphatase–activating proteins (GAPs) for Cdc42, which are encoded by RGA1, RGA2, and BEM3 (41–44). Cdc42 is essential for the activity of Sho1 branch of the HOG pathway (45). To the best of our knowledge, no one has reported any differences among these GAPs in the regulation of Cdc42 in any cellular process. Of the Cdc42 regulators, deletion of RGA1 had the largest effect on transcription reporter activity, increasing the EC50 and decreasing the Hill slope substantially (Figs. 5C and 6A), suggesting a previously unrecognized role of Rga1 in the Hog1 signaling pathway.
We selected Ssk1 and Rga1 for in-depth analysis of their involvement in linking Hog1 activity to transcriptional output. Ssk1 is essential for the Sln1 branch of the HOG pathway (46). Rga1 affects the Sho1 branch of the pathway presumably through Cdc42. Deletion of these components had the most pronounced effects on both the Hill slope and EC50 for the transcriptional reporter (Fig. 5, B and C). By the Phos-tag method, deletion of SSK1 produced a delay in maximal Hog1 activation (fig. S4A). Deletion of RGA1 shortened the duration of Hog1 activity at low concentrations of KCl and prolonged activity at high concentrations (Fig. 6, B and C, and fig. S4B). Integration of these signaling profiles, defined as the area under the curve for each graph, revealed that both deletions affected the relationship between stimulus intensity and duration for Hog1 activity. Deletion of SSK1 preserved the linear relationship but produced a steeper slope and an x-intercept that was right-shifted as compared to wild type (Fig. 6, B and C), confirming that Hog1 activity was no longer activated at low doses of salt (29). Deletion of RGA1 produced a sigmoidal relationship, with less total Hog1 activity at low concentrations of KCl and greater Hog1 activity at high concentrations of KCl (Fig. 6, B and C). Thus, the Ssk1 data indicated that the Sln1 branch increases the dynamic range of the path-way by allowing Hog1 to become activated at low stimulus intensities and limits the duration of Hog1 activation at high stimulus intensities. The Rga1 data indicated that the Sho1 branch establishes the linearity of the input-output relationship for theHog1pathway.
We also compared duration of Hog1 activation and transcriptional output (Fig. 6D). This comparison confirmed that the duration of Hog1 activity fully accounted for the changes in transcriptional output in this system, thus highlighting the complex relationship between Hog1 activation and transcriptional output.
Hog1 activity duration coordinates a tiered adaptive program
Switch-like signals classically underlie commitment to binary outputs. Prominent examples include cell division (47), neuronal potentiation and backfiring (48, 49), and cell differentiation (50, 51). These processes have high energy costs, are often irreversible, and must produce a consistent set of outputs. Therefore, most switches are carefully regulated by graded inputs that either (i) overcome dose thresholds to filter environmental noise or (ii) traverse a buffered signaling cascade before initiating the switch. In contrast, Hog1 uses an inverse switching regime, referred to here as a “tunable bifurcated response,” wherein commitment to adaptation is switch-like and the resolution of this commitment is graded. This is supported by multiple observations made here and in previous reports. First, we found that Hog1 was activated in a switch-like manner and that substrate phosphorylation was graded (Figs. 1 and 2). Second, the time that Hog1 spends in the nucleus correlates with the production of Hog1-regulated genes (20, 31, 52). Third, the occupancy of Hog1-regulated transcription factors to their gene promoters is time-dependent (53). However, CRE-lacZ induction does not always reflect Hog1 activation (as defined by the presence of the doubly phosphorylated form) (Figs. 4 and 6). These findings suggest that Hog1, although activated in a switch-like manner, encodes an alternative, possibly graded, transcription program.
To identify a graded Hog1-dependent transcriptional program, we analyzed an existing microarray data set (54) from cells treated with 700 mM NaCl and monitored for gene expression under continuous stimulation (database S1). In this analysis, we identified four gene clusters, each with distinct time-dependent activation thresholds (Fig. 7A). All four clusters are enriched for genes regulated by Hog1 and transcription factors regulated by Hog1-Msn2, Msn4, Sko1, and Hot1 (table S1). Each cluster dictates progressively higher levels of energy commitment, as determined by Gene Ontology (GO) analysis for enrichment of “Biological Process” terms (Fig. 7B and database S1) (55). Each cluster includes a distinct set of general stress response genes, such as those encoding heat shock proteins, chaperones, and cytotoxic response factors. In the first 15 min, the genes in cluster 1 (epitomized by the CRE promoter used in the transcriptional reporter) were stimulated. Cluster 1 genes include those encoding proteins necessary for catabolism of proteins and carbohydrates, as well as for osmolyte synthesis and energy storage. Between 15 and 30 min, cluster 2 was engaged, demarcating a change in the cellular energy landscape. Cluster 2 genes encode proteins that promote protein catabolism and energy storage and also components necessary for autophagy. This expression profile is likely responsible for the rapid conversion of freely available carbohydrates, such as glucose and fructose, to osmolytes, such as trehalose and glycerol. The genes in clusters 3 and 4 were activated in the later periods and encode proteins that promote amino acid synthesis, potentially to prepare for protein synthesis when the cell has adapted to the osmotic condition. We propose that sequential induction of these clusters tunes the adaptive response by facilitating sufficient catabolism and stress mediation while optimizing for fitness after recovery. We hypothesized that this stepwise pattern of gene induction is facilitated through dose-to-duration signaling.
Fig. 7. Hog1 executes a tiered adaptive protein induction program over time.
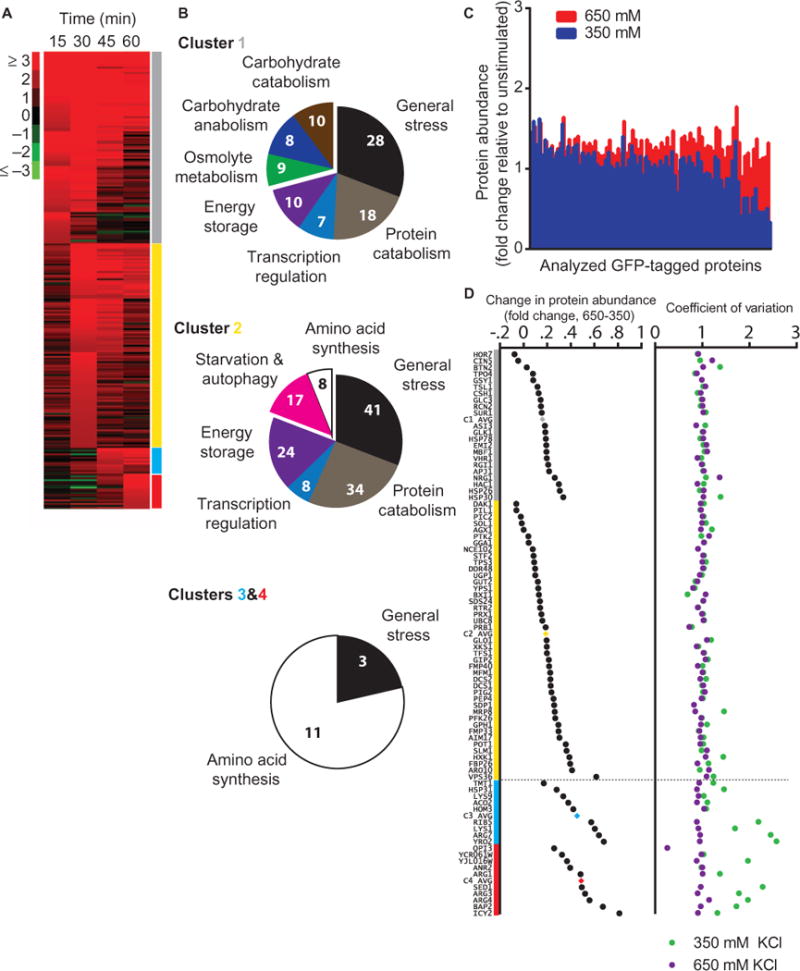
(A) mRNA content quantified from WT cells every 15 min after the initial stimulation with 700 mM NaCl (54) and sorted with respect to time until >2-fold log2 change was achieved. Scale is log2 fold change with respect to unstimulated cells. (B) GO analysis of clusters 1, 2, 3, and 4 from (A). Numerals represent total number of unique genes in each category. (C) GFP-tagged protein abundance measured by flow cytometry. Candidates were selected at random from those identified in (A) and treated with 0, 350, or 650 mM KCl for 30 min. Each data point represents change in mean GFP intensity relative to the unstimulated control for each strain; all data represent >10,000 individual cell counts. (D) Mean change in protein abundance (left) and CV (right) for cells treated with 350 or 650 mM KCl for 30 min. The parent cluster for each protein is represented by the colors gray (cluster 1), yellow (cluster 2), cyan (cluster 3), and red (cluster 4). Mean values for each cluster are indicated.
We measured induction of an unbiased subset of 95 proteins from clusters 1 to 4. Each protein was expressed from the native gene locus as a GFP fusion, and abundance was measured by fluorescence cytometry of cells exposed to 350 or 650 mM KCl (Fig. 7C and database S2), concentrations sufficient to activate Hog1 for 20 or 30 min, respectively (Fig. 1C). As predicted, the median productions of proteins from clusters 1 and 2 were nearly identical after treatment with 350 or 650 mM KCl (Fig. 7D), whereas protein productions from clusters 3 and 4 were consistently higher after treatment with 650 mM compared to those in cells exposed to 350 mM KCl. Collectively, these results indicated that translational output was graded even as Hog1 activation was switch-like.
Although the order of protein synthesis was graded, it was not uniform in all cells. For example, the 650 mM treatment group maintained tight population distributions for all proteins, whereas cells treated with 350 mM KCl exhibited an increasing co-efficient of variation (CV) for weakly induced proteins (Fig. 7D). Thus, there is an apparent cell-to-cell variability in this system occurring at the level of signal deactivation.
Collectively, these results indicate that adaptive output is ordered, but not uniform, in all cells. Rather, each cell progresses down a graded adaptation program, encoded by Hog1 duration, before deactivating. This introduces a noisy adaptive output at the level of individual cells that can be attributed to variable Hog1 deactivation.
DISCUSSION
The HOG pathway has served as a prototype for cellular stress adaptation systems. Here, we showed that Hog1 has features of both a switch and a rheostat. As a switch, Hog1 commits the cell to adaptation, regardless of input strength, thereby ensuring the fastest possible response to stress. As a rheostat, Hog1 converts a linear input of osmotic stress to a graded adaptive response. Hog1 appears to encode two rheostats, one at the level of MAPK duration and another at the level of MAPK deactivation. The first tunes induction of the adaptive program in all cells, whereas the second provides flexibility among individual cells within the population. We made four observations that accounted for these seemingly incongruous behaviors and revealed how these behaviors coordinated the stress response program.
First, we developed a method based on Phos-tag to quantify protein phosphorylation. Using this Phos-tag method, we defined the Hog1 signaling profile and used these data to calculate a linear function for Hog1 activation. Our analysis revealed that Hog1 encodes a dose-to-duration signal. Whereas Hog1 is fully activated at any concentration of salt, the duration of activation depends linearly on the strength of the stimulus.
Second, we demonstrated that Hog1 confers graded feedback regulation through bit state encoding of Ste50 phosphorylation. Although Hog1 was phosphorylated as a switch, Ste50 was phosphorylated as a rheostat. Moreover, we determined that Hog1 feedback was essential to the tunable bifurcated response. When feedback was abrogated, Hog1 activation was graded.
Third, we identified components of the HOG pathway that contributed to the dose-to-duration function and used them to demonstrate a surprising disparity in the relationship between Hog1 activation and gene induction.
Fourth, we showed that Hog1 tunes recovery through sequential and variable production of proteins needed for adaptation. Two distinct rheostats facilitated this adaptive response. The first was a dose-to-duration rheostat encoding the persistence of maximum Hog1 activity and a sequential gene induction program. The second was a rheostat encoded by cell-to-cell variability in induced protein production. This is in striking contrast to the pattern of ERK activation and mitosis in Xenopus eggs (13) where switch-like MAPK signaling was first characterized. In those experiments, measurements of whole cell populations indicated a graded response, whereas measurements of individual cells uncovered a mix of unresponsive and fully responsive (switch-like) behaviors. Our measurements of whole cell populations indicated a graded recovery, where individual cells exhibited a mix of unresponsive and responsive behaviors.
Many investigators have commented on the relative merits of MAPK pathways operating as either switches or rheostats (56–58). Whereas switches encode deterministic action, rheostats can scale responses to input strength. When a rheostat begets a switch, the system is designed to integrate information to engage a decision-making process. We showed that the Hog1 system functions in the inverse, using a switch to beget a rheostat. The switch acted to initiate adaptation before tuning the response over time. Consequently, protein content changed in a time- and dose-dependent fashion, perhaps reflecting a steady progression in energy commitment to the stress adaptation process. Some cells progressed further than others, perhaps indicating the differing needs of individuals in the population.
Just as gene induction occurred in a graded and sequential manner (Fig. 7), different posttranslational modifications may occur sequentially and thereby contribute to the graded output. Although phosphorylation has been highlighted in this study, other modifications can regulate protein activity (59). Modifications of kinases upstream of MAPKs include ubiquitination (60), acetylation (61), methylation (62), and sumoylation (63, 64), among others. Thus, although the currency of MAPK modules remains phosphorylation, this modification is likely to be a precursor to other modifications that serve to further expand the bit lengths of substrate proteins. In fact, phosphorylation is a requirement for certain ubiquitination reactions (65), and in at least one case, ubiquitination of a MAPK pathway component dictates MAPK signaling specificity (60). Comprehensive identification of Hog1 substrates and establishing the consequences of those phosphorylation events could eventually produce a complete predictive model of the pathway. Furthermore, multiple MAPK signals are likely to regulate many of the same substrates. Identification of all functions for all kinase signals, over a time-dose matrix, will be necessary to complete a deterministic model for a given cell stimulus.
An ideal stress response system is one that responds immediately, in a strictly dose-dependent manner, and in a manner that protects the population. We propose that Hog1 meets this ideal: Our data showed that Hog1 is activated rapidly and in a dose-to-duration manner, but with sufficient variability to accommodate a rapidly changing environment. Ultimately, our goal is to generate a predictive mathematical function for this MAPK transduction pathway. This will require development of new analysis techniques capable of quantifying modifications on signaling proteins. We expect that such efforts will eventually reveal new avenues for therapeutic intervention and control of disease networks.
MATERIALS AND METHODS
Strains
All yeast strains in this study were derived from BY4741 (table S2). Deletion of open reading frames was performed using standard methods, with either antibiotic or auxotrophic markers. Polymerase chain reaction was used to validate all deletions. Strains used for flow cytometry were from the GFP-tagged library (Life Technologies).
Cell culture
Strains were cultured using standard methods with minor modifications. Yeast were grown on YPD (yeast extract, peptone, and dextrose) agar medium at 30°C for 3 days. Fresh, single colonies were isolated and grown overnight in synthetic complete + dextrose (SCD) liquid medium, diluted 1:500, grown for 6 hours, and diluted again to an absorbance at 600 nm (A600nm) of 0.001. Experiments were performed the following day when the culture reached A600nm = 1.
Stress treatment and cell lysis for immunoblotting
Cells were treated and prepared for immunoblotting as described previously (34) with several exceptions. Cell cultures were split into 8 × 75–ml volumes, and 25 ml of SCD + KCl medium was added to a final concentration of 0, 50, 150, 250, 350, 450, 550, or 650 mM KCl. Where noted, 1-NA-PP1 ATP analog (Cayman Chemical, 10954) was applied to cells at 12 μM final concentration 2 min before salt stimulation, as described previously (36). At indicated time points, 10-ml samples were taken from each flask, quenched in 5% (v/v; throughout) trichloroacetic acid (TCA), and held on ice until the end of the time course. Samples were then centrifuged at 3000g for 3 min, aspirated, washed in 1 ml of 5% sodium azide, and frozen at −80°C.
Cell pellets were thawed on ice, resuspended in 200 μl of TCA lysis buffer [10 mM tris-HCl (pH 8.0), 10% TCA, 25 mM NH4OAc], and lysed by vortexing at 4°C for 10 min. Lysate was centrifuged at 13,000g at 4°C for 10 min, aspirated, and mixed with 100 μl of resuspension buffer [0.1 M tris-HCl (pH 8.5), 3% SDS]. Each sample was then heated to 90°C for 10 min, cooled at room temperature for 10 min, and centrifuged at 13,000g for 1 min. Supernatant (60 μl) was isolated, and protein concentration was determined using the Bio-Rad DC Protein Assay (500-0112) with detergent-compatible reagent. Each sample was diluted to a final concentration of 2 μg/μl in resuspension buffer and mixed 1:1 with 2× sample buffer [0.1% bromophenol blue, 2% SDS, 20% glycerol, 500 mM tris-HCl (pH 8.5), and 200 mM dithiothreitol]. Samples were run immediately or stored for use in 1 to 2 days at −80°C.
Bis-tris acrylamide gels, Phos-tag, and gel transfer for immunoblotting
Phos-tag conjugated to acrylamide has been previously reported to function best under neutral pH conditions such as those found in bis-tris SDS-PAGE gels (66). We optimized the bis-tris gel formulation to properly resolve a wide range of protein sizes and phosphorylations fromyeast whole-cell lysates. Reagents for each gel layer were added in the order listed and, importantly, were vigorously vortexed in a 14-ml screw-cap conical bottom tube for 5 s, whereindicated. Resolvinglayer; 8% 29:1 acrylamide/bis-acrylamide (Bio-Rad, 161-0156), 350 mM bis-tris (pH 6.8; Fisher Scientific, BP301100), 20 μM Phos-tag (Wako Chemical Industries, 304-93521), 40 μM Zn(NO3)2, vortex, 0.05% ammonium persulfate (APS), vortex, 0.1% tetramethylethy lenediamine (TEMED), vortex, pour immediately and very gently layer with isopropanol and polymerize for a maximum of 1 hour. Rinse resolving layer five times with 350 mM bis-tris (pH 6.8) and add stacking layer; 4% 29:1 acrylamide/bis acrylamide, 350 mM bis-tris (pH 6.8), vortex, 0.05% APS, vortex, 0.1% TEMED, vortex. Gels were cast, run, and transferred using the 1.5-mm Bio-Rad Mini-PROTEAN gel system (165-8006). Gels were used immediately or stored at 4°C in 350 mM bis-tris (pH 6.8) buffer for up to 4 weeks.
Protein samples were heated at 70°C for 10 min, allowed to cool, and loaded to 15 μg of protein lysate per lane. Then, running buffer [50 mM tris-HCl, 50 mM Mops, 0.1% SDS, 5 mM sodium bisulfite (pH 7.2)] was added, and each gel was run at a constant 150 V for 1.5 hours. Upon completion, the resolving layer was removed and equilibrated in transfer buffer [1 × NuPAGE transfer buffer (Life Technologies, NP0006-1) supplemented with 20% methanol, 2.5 mM sodium pyrophosphate, and 5 mM sodium bisulfite] with shaking at room temperature for 20 min to release phosphopeptides from Phos-tag. Wet transfer to an Immobilon-P polyvinylidene difluoride membrane (Millipore) was then performed at 4°C for 20 hours at 20 V.
Immunodetection and quantification
All blotswere incubated in blocking buffer (TBS-T; tris-buffered saline, 50 mM tris, 150 mM NaCl plus 0.05% Tween 20 with 5% nonfat dry milk) for 60 min at room temperature. Membranes were then transferred to heat-sealable pouches, filled with 3 ml of primary antibody solution (blocking buffer + primary antibody), sealed, and rocked gently for 14 hours at 4°C. The primary antibodies were directed against Hog1 (Santa Cruz Biotechnology, sc-6815; 1:500), phospho-p38 (Cell Signaling, 9216; 1:500), and Ste50 (gift of R. Brent; 1:500). Blots were washed 4 × 15 min with TBS-Tand probed with 5 ml of goat anti-rabbit (Santa Cruz Biotechnology, sc-2030; 1:50,000) or rabbit anti-goat (Santa Cruz Biotechnology, sc-2922; 1:50,000) secondary antibody solution (blocking buffer + secondary antibody) for 60 min with rocking at room temperature. Blots were again washed 4 × 15 min with TBS-T before incubating with 5 ml of Clarity Western ECL Substrate (Bio-Rad, 170-5060) for 5 min in the dark. Blots were then developed on radiography film for qualitative images or using the Bio-Rad ChemiDoc MP System (170-8280) for quantification of proteins. Briefly, enhanced chemiluminescence (ECL) images were captured over time and sequentially integrated using a charge-coupled device camera. Images were acquired until all blot lanes contained saturated pixel intensities. Images were hand selected for exposure times occurring just before pixel saturation to maximize the dynamic range of each band for quantification.
Immunoblot image quantification was performed using Fiji (67). Protein quantitation data are presented as a percentage determined by dividing the intensity value for the band identified as dually phosphorylated protein by the intensity value of all protein bands.
Microarray data analysis, transcription factor association, and gene ontogeny analysis
All microarray data were downloaded from the National Institutes of Health (NIH) Gene Expression Omnibus database, accession number GSE32196. Data were clustered on the basis of time to >2-fold log2 change in mRNA expression relative to unstimulated cells (database S1). Determination of transcription factor association was performed using the “Rank by TF” algorithm from YEASTRACT (68) scanning for binding plus expression evidence with standard statistical cutoffs calculated from whole genome background values. These genes were further clustered by their GO classification using the “Functional Annotation Clustering” algorithm from DAVID (69, 70) and then grouped by hand into broad, distinguishable classes (database S1).
Fluorescence-based flow cytometry and data analysis
Cell culture and stress treatment were performed as above, but in 96-well plate format using strains obtained from the yeast-GFP clone collection (Invitrogen). Cells were treated with 0, 350, or 650 mM KCl final concentration and incubated at 30°C for 30 min before fixing. Before fixation, cycloheximide was added to 10 μg/ml final concentration to halt protein translation. Cells were immediately centrifuged at 3000g for 2 min. Cell pellets were resuspended and fixed with 2% paraformaldehyde, 1 M phosphate buffer (PB; 5:1 ratio of K2HPO and KH2PO4, pH 7.5), and cycloheximide (10 μg/ml). Fixation was carried out at room temperature for 15 min. Plates were then recentrifuged as before and washed at room temperature two times in 150 μl of PB + 75 mM lysine HCl to quench fixative. The cell pellets were then resuspended in 100 μl of PB + 100 U of benzonase (Sigma-Aldrich) and incubated at 37°C for 15 min to cleave free nucleotides. Pellets were againwashedin150 μl of PB, then incubated with wheat germ-agglutinin (0.5 mg/ml), a yeast bud scar stain (71) conjugated to Alexa Fluor 594 (Invitrogen, W11262), for 15 min, and rinsed three times in 150 μl of PB. The fixed and stained cells were stored in the dark at 4°C. Before cytometry, cells were sonicated in a 96-well plate sonicator (“SonicMan” Brooks Life Science Systems) at power 30 for 15 s at 4°C using a SL0096-P21-SS sonication head.
Fixed cells were run on an LSRII flow cytometer (BD Biosciences) modified with a 96-well plate HTS system (BD Biosciences). A maximum of 50,000 counts were processed per run. Data were gated and analyzed using FlowJo v.10 analytic software (fig. S5).
Transcription reporter assay
The pRS416-8XCRE-LacZ plasmid was used in these studies, as described previously (40). Cells were transformed with the reporter plasmid using standard methods and evaluated as described previously (72). Single colonies were isolated and cultured as noted above, except using SCD lacking uracil to maintain selection for the reporter plasmid. Plates (96-well) were preloaded with 40 μl of SCD + KCl to achieve final experimental concentrations between 0 and 800 mM KCl. Each plate was loaded with 60 μl of cell culture per well and incubated at 30°C for 90 min. Two technical replicates for four biological replicates were conducted per plate. The assay was stopped by addition of 20 μl of development solution [135 mM Pipes, 0.25% Triton X-100, 0.5 mM fluorescein di-β-D-galactopyranoside (FDG; Marker Gene Technologies, 17817-20-8)] and incubated at 37°C for 6 hours. The A600nm and 485 nm/580 nm fluorescence ratio were measured for each plate using a Molecular Devices SpectraMax M5.
Fluorescence values were normalized using A600nm reads from unstimulated wells. Technical replicates were averaged, and a minimum of four biological replicates were plotted in Prism 6 (GraphPad Software) and fit using a log(agonist) versus response variable slope equation. Changes in EC50 and Hill slope were assessed via two-tailed t test with a P < 0.05 cutoff.
Ste50 quantification, data alignment, and statistical comparison
Ste50 was quantified as pixel intensity with respect to distance from an anchor point, a consistent nonspecific band on the immunoblot. Experimental replicates were then paired and aligned in Python.
Briefly, data set 2 was scanned past data set 1 pixel by pixel, and 2 was subtracted from 1 for each alignment. The root mean square (RMS) sum of their intensities at each scanned position was then tallied. The positional alignment scoring the lowest RMS value was then chosen as the best-fit alignment. Data set 3 was then scanned against the first two and fit similarly. All potential data set alignment orders were tested for all data sets, and each produced identical alignments; this was done to ensure that no alignment bias was injected because of operational ordering. The alignments were then averaged, and an SE was generated and displayed as black shading. For each alignment, the anchor value was omitted to ensure that only real data influenced the alignment. The median of each alignment was then computed and used to generate the plots in Fig. 2.
Dose-to-duration conversion calculations
Transcriptional reporter curve fits were converted from dose to Hog1 duration using functions fit to the Hog1 area plots. These functions were generated using the analytical software Eureqa (Nutonian) by randomly sampling basic and exponential mathematical functions. About 1 × 10¹¹ formulations were evaluated, and the function with the highest score (size versus R2) was selected for each strain.
Modeling feedback regulation
Model assumptions are as follows. Our experimental results demonstrate the existence of at least two feedback loops mediated by Hog1: (i) rapid positive feedback that ensures full pathway activity for a large range of salt concentrations and (ii) delayed negative feedback that acts as a timer for converting dose to duration. We previously established that negative feedback above the level of the MAPK cascade is important for Hog1 deactivation (34). However, our previous model failed to recapitulate our current experimental data (fig. S2), in that the removal of negative feedback was not sufficient to produce graded Hog1 activation or a dose-dependent steady state. We hypothesized that the model failed because it did not account for Hog1-dependent positive feedback and negative regulation at the level of the input signal. Therefore, we developed a new mathematical model that includes a combination of Hog1-mediated negative and positive feedback. The first negative feedback loop acts to attenuate the signal, and the second increases the deactivation rate of the MAPKKK Ste11. To model the delay in negative regulation, we assumed that the negative feedback is mediated by a species “X” that is activated by nuclear Hog1; for example, X could be one of the transcription factors activated by Hog1. Our results would not qualitatively change if, instead of activating X, Hog1 induced the expression of X; for example, X could be one of the proteins induced by Hog1 activation.
The input to our model is the external stimulus (signal) that becomes attenuated in time by active X. We assume the signal directly activates the Ste11/Ste50 complex and that Ste11 activation is subject to positive feedback by Hog1 and negative feedback by X. Active Ste11 activates Pbs2, which then activates Hog1. Once activated, Hog1 shuttles into the nucleus, where it activates X.
Model equations are as follows. We model activation and deactivation reactions using Michaelis-Menten kinetics. For simplicity, we do not consider protein degradation or synthesis. These two assumptions allow us to normalize each species in the model by its total amount. We assume that Ste11 and Ste50 are always in a complex (Ste11/Ste50). The equation for the time-dependent behavior of this complex is
| (1) |
where the first term of Eq. 1 models signal-dependent and positive feedback activation of the Ste11/Ste50 complex. The denominator of the signal term models attenuation of the signal through X-mediated negative feedback. The second term models the basal and X-dependent deactivation rates of Ste11/Ste50.
The equation for the time-dependent behavior of active Pbs2 (Pbs2*) is
| (2) |
where the first term models Ste11-dependent activation of Pbs2, and the second term models Pbs2 deactivation.
The equation that models the time-dependent behavior of cytosolic Hog1 is
| (3) |
where the first term in Eq. 3 models Pbs2-dependent Hog1 activation. Once activated, Hog1 translocates to the nucleus at a rate kn and trans-locates out of the nucleus at a rate kc. The fourth term models Hog1 deactivation, which we assume to occur only in the cytoplasm. The equation for the time-dependent behavior of nuclear Hog1 is given by
| (4) |
The equation that models time-dependent behavior of the species X is
| (5) |
where the first term models Hog1-dependent X activation, and the second term models X deactivation. See table S3 for parameter values.
Supplementary Material
Fig. S1. The antibodies generated against phosphorylated p38 recognize monophosphorylated and dually phosphorylated Hog1.
Fig. S2. Negative feedback only model fails to capture the Hog1 signaling profile.
Fig. S3. Hog1 signaling profile in the Ste505A strain.
Fig. S4. Hog1 signaling profile in ssk1Δ and rga1Δ yeast.
Fig. S5. Gating parameters for flow cytometry data.
Table S1. Transcription factor binding and interaction analysis.
Table S2. List of yeast strains used in this study.
Table S3. List of parameter values used in modeling.
Database S1. Annotated microarray data with GO analysis and organization.
Database S2. Induction of 95 proteins from clusters 1 to 4 in response to 0, 350, or 650 mM KCl.
Acknowledgments
We thank C. Der, D. Dominguez, K. Hahn, E. Kinoshita, N. Hao, D. Isom, D. Jha, G. Johnson, D. Moore, M. Nagiec, K. White, and A. Whitehurst for useful discussions and reading the manuscript. We also thank R. Brent for providing the Ste50 antibody.
Funding: This work was supported by NIH grants P30CA016086 (UNC Flow Cytometry Core Facility), RO1 GM080739 (H.G.D.), R01 GM079271 (T.C.E.), and T32 GM007040 (J.G.E.).
Footnotes
SUPPLEMENTARY MATERIALS
Author contributions: J.G.E. designed and performed the experiments, analyzed the data, and wrote the paper; J.P.S. performed the experiments; M.M. analyzed the data; P.C.M. performed the experiments, analyzed the data, and wrote the paper; T.C.E. designed the experiments; H.G.D. designed the experiments and wrote the paper.
Competing interests: The authors declare that they have no competing interests.
REFERENCES AND NOTES
- 1.Huff K, End D, Guroff G. Nerve growth factor-induced alteration in the response of PC12 pheochromocytoma cells to epidermal growth factor. J Cell Biol. 1981;88:189–198. doi: 10.1083/jcb.88.1.189. [DOI] [PMC free article] [PubMed] [Google Scholar]
- 2.Wagner EF, Nebreda ÁR. Signal integration by JNK and p38 MAPK pathways in cancer development. Nat Rev Cancer. 2009;9:537–549. doi: 10.1038/nrc2694. [DOI] [PubMed] [Google Scholar]
- 3.Webber JL, Tooze SA. Coordinated regulation of autophagy by p38a MAPK through mAtg9 and p38IP. EMBO J. 2010;29:27–40. doi: 10.1038/emboj.2009.321. [DOI] [PMC free article] [PubMed] [Google Scholar]
- 4.Brewster JL, de Valoir T, Dwyer ND, Winter E, Gustin MC. An osmosensing signal transduction pathway in yeast. Science. 1993;259:1760–1763. doi: 10.1126/science.7681220. [DOI] [PubMed] [Google Scholar]
- 5.Rouse J, Cohen P, Trigon S, Morange M, Alonso-Llamazares A, Zamanillo D, Hunt T, Nebreda AR. A novel kinase cascade triggered by stress and heat shock that stimulates MAPKAP kinase-2 and phosphorylation of the small heat shock proteins. Cell. 1994;78:1027–1037. doi: 10.1016/0092-8674(94)90277-1. [DOI] [PubMed] [Google Scholar]
- 6.Saito H, Posas F. Response to hyperosmotic stress. Genetics. 2012;192:289–318. doi: 10.1534/genetics.112.140863. [DOI] [PMC free article] [PubMed] [Google Scholar]
- 7.Galcheva-Gargova Z, Dérijard B, Wu IH, Davis RJ. An osmosensing signal transduction pathway in mammalian cells. Science. 1994;265:806–808. doi: 10.1126/science.8047888. [DOI] [PubMed] [Google Scholar]
- 8.Purvis JE, Lahav G. Encoding and decoding cellular information through signaling dynamics. Cell. 2013;152:945–956. doi: 10.1016/j.cell.2013.02.005. [DOI] [PMC free article] [PubMed] [Google Scholar]
- 9.Santos SD, Verveer PJ, Bastiaens PI. Growth factor-induced MAPK network topology shapes Erk response determining PC-12 cell fate. Nat Cell Biol. 2007;9:324–330. doi: 10.1038/ncb1543. [DOI] [PubMed] [Google Scholar]
- 10.Hao N, O’Shea EK. Signal-dependent dynamics of transcription factor translocation controls gene expression. Nat Struct Mol Biol. 2011;19:31–39. doi: 10.1038/nsmb.2192. [DOI] [PMC free article] [PubMed] [Google Scholar]
- 11.Nelson DE, Ihekwaba AE, Elliott M, Johnson JR, Gibney CA, Foreman BE, Nelson G, See V, Horton CA, Spiller DG, Edwards SW, McDowell HP, Unitt JF, Sullivan E, Grimley R, Benson N, Broomhead D, Kell DB, White MR. Oscillations in NF-κB signaling control the dynamics of gene expression. Science. 2004;306:704–708. doi: 10.1126/science.1099962. [DOI] [PubMed] [Google Scholar]
- 12.Purvis JE, Karhohs KW, Mock C, Batchelor E, Loewer A, Lahav G. p53 dynamics control cell fate. Science. 2012;336:1440–1444. doi: 10.1126/science.1218351. [DOI] [PMC free article] [PubMed] [Google Scholar]
- 13.Ferrell JE, Machleder EM. The biochemical basis of an all-or-none cell fate switch in Xenopus oocytes. Science. 1998;280:895–898. doi: 10.1126/science.280.5365.895. [DOI] [PubMed] [Google Scholar]
- 14.Justman QA, Serber Z, Ferrell JE, El-Samad H, Shokat KM. Tuning the activation threshold of a kinase network by nested feedback loops. Science. 2009;324:509–512. doi: 10.1126/science.1169498. [DOI] [PMC free article] [PubMed] [Google Scholar]
- 15.Albeck JG, Mills GB, Brugge JS. Frequency-modulated pulses of ERK activity transmit quantitative proliferation signals. Mol Cell. 2013;49:249–261. doi: 10.1016/j.molcel.2012.11.002. [DOI] [PMC free article] [PubMed] [Google Scholar]
- 16.Hao N, Nayak S, Behar M, Shanks RH, Nagiec MJ, Errede B, Hasty J, Elston TC, Dohlman HG. Regulation of cell signaling dynamics by the protein kinase-scaffold Ste5. Mol Cell. 2008;30:649–656. doi: 10.1016/j.molcel.2008.04.016. [DOI] [PMC free article] [PubMed] [Google Scholar]
- 17.Malleshaiah MK, Shahrezaei V, Swain PS, Michnick SW. The scaffold protein Ste5 directly controls a switch-like mating decision in yeast. Nature. 2010;465:101–105. doi: 10.1038/nature08946. [DOI] [PubMed] [Google Scholar]
- 18.Nagiec MJ, Dohlman HG. Checkpoints in a yeast differentiation pathway coordinate signaling during hyperosmotic stress. PLOS Genet. 2012;8:e1002437. doi: 10.1371/journal.pgen.1002437. [DOI] [PMC free article] [PubMed] [Google Scholar]
- 19.Takahashi S, Pryciak PM. Membrane localization of scaffold proteins promotes graded signaling in the yeast MAP kinase cascade. Curr Biol. 2008;18:1184–1191. doi: 10.1016/j.cub.2008.07.050. [DOI] [PMC free article] [PubMed] [Google Scholar]
- 20.Neuert G, Munsky B, Tan RZ, Teytelman L, Khammash M, van Oudenaarden A. Systematic identification of signal-activated stochastic gene regulation. Science. 2013;339:584–587. doi: 10.1126/science.1231456. [DOI] [PMC free article] [PubMed] [Google Scholar]
- 21.Proft M, Struhl K. MAP kinase-mediated stress relief that precedes and regulates the timing of transcriptional induction. Cell. 2004;118:351–361. doi: 10.1016/j.cell.2004.07.016. [DOI] [PubMed] [Google Scholar]
- 22.Schaber J, Baltanas R, Bush A, Klipp E, Colman-Lerner A. Modelling reveals novel roles of two parallel signalling pathways and homeostatic feedbacks in yeast. Mol Syst Biol. 2012;8:622. doi: 10.1038/msb.2012.53. [DOI] [PMC free article] [PubMed] [Google Scholar]
- 23.Behar M, Hao N, Dohlman HG, Elston TC. Dose-to-duration encoding and signaling beyond saturation in intracellular signaling networks. PLOS Comput Biol. 2008;4:e1000197. doi: 10.1371/journal.pcbi.1000197. [DOI] [PMC free article] [PubMed] [Google Scholar]
- 24.Bell M, Engelberg D. Phosphorylation of Tyr-176 of the yeast MAPK Hog1/p38 is not vital for Hog1 biological activity. J Biol Chem. 2003;278:14603–14606. doi: 10.1074/jbc.C300006200. [DOI] [PubMed] [Google Scholar]
- 25.Mattison CP, Ota IM. Two protein tyrosine phosphatases, Ptp2 and Ptp3, modulate the subcellular localization of the Hog1 MAP kinase in yeast. Genes Dev. 2000;14:1229–1235. [PMC free article] [PubMed] [Google Scholar]
- 26.Mao K, Wang K, Zhao M, Xu T, Klionsky DJ. Two MAPK-signaling pathways are required for mitophagy in Saccharomyces cerevisiae. J Cell Biol. 2011;193:755–767. doi: 10.1083/jcb.201102092. [DOI] [PMC free article] [PubMed] [Google Scholar]
- 27.Westfall PJ, Patterson JC, Chen RE, Thorner J. Stress resistance and signal fidelity independent of nuclear MAPK function. Proc Natl Acad Sci USA. 2008;105:12212–12217. doi: 10.1073/pnas.0805797105. [DOI] [PMC free article] [PubMed] [Google Scholar]
- 28.Kinoshita E, Kinoshita-Kikuta E, Takiyama K, Koike T. Phosphate-binding Tag, a new tool to visualize phosphorylated proteins. Mol Cell Proteomics. 2006;5:749–757. doi: 10.1074/mcp.T500024-MCP200. [DOI] [PubMed] [Google Scholar]
- 29.Macia J, Regot S, Peeters T, Conde N, Solé R, Posas F. Dynamic signaling in the Hog1 MAPK pathway relies on high basal signal transduction. Sci Signal. 2009;2:ra13. doi: 10.1126/scisignal.2000056. [DOI] [PubMed] [Google Scholar]
- 30.Saito H, Tatebayashi K. Regulation of the osmoregulatory HOG MAPK cascade in yeast. J Biochem. 2004;136:267–272. doi: 10.1093/jb/mvh135. [DOI] [PubMed] [Google Scholar]
- 31.Muzzey D, Gómez-Uribe CA, Mettetal JT, van Oudenaarden A. A systems-level analysis of perfect adaptation in yeast osmoregulation. Cell. 2009;138:160–171. doi: 10.1016/j.cell.2009.04.047. [DOI] [PMC free article] [PubMed] [Google Scholar]
- 32.Miermont A, Waharte F, Hu S, McClean MN, Bottani S, Léon S, Hersen P. Severe osmotic compression triggers a slowdown of intracellular signaling, which can be explained by molecular crowding. Proc Natl Acad Sci USA. 2013;110:5725–5730. doi: 10.1073/pnas.1215367110. [DOI] [PMC free article] [PubMed] [Google Scholar]
- 33.Tyson JJ, Chen KC, Novak B. Sniffers, buzzers, toggles and blinkers: Dynamics of regulatory and signaling pathways in the cell. Curr Opin Cell Biol. 2003;15:221–231. doi: 10.1016/s0955-0674(03)00017-6. [DOI] [PubMed] [Google Scholar]
- 34.Hao N, Behar M, Parnell SC, Torres MP, Borchers CH, Elston TC, Dohlman HG. A systems-biology analysis of feedback inhibition in the Sho1 osmotic-stress-response pathway. Curr Biol. 2007;17:659–667. doi: 10.1016/j.cub.2007.02.044. [DOI] [PubMed] [Google Scholar]
- 35.Hao N, Zeng Y, Elston TC, Dohlman HG. Control of MAPK specificity by feedback phosphorylation of shared adaptor protein Ste50. J Biol Chem. 2008;283:33798–33802. doi: 10.1074/jbc.C800179200. [DOI] [PMC free article] [PubMed] [Google Scholar]
- 36.Westfall PJ, Thorner J. Analysis of mitogen-activated protein kinase signaling specificity in response to hyperosmotic stress: Use of an analog-sensitive HOG1 allele. Eukaryot Cell. 2006;5:1215–1228. doi: 10.1128/EC.00037-06. [DOI] [PMC free article] [PubMed] [Google Scholar]
- 37.Kung C, Kenski DM, Krukenberg K, Madhani HD, Shokat KM. Selective kinase inhibition by exploiting differential pathway sensitivity. Chem Biol. 2006;13:399–407. doi: 10.1016/j.chembiol.2006.02.004. [DOI] [PMC free article] [PubMed] [Google Scholar]
- 38.Thomson M, Gunawardena J. Unlimited multistability in multisite phosphorylation systems. Nature. 2009;460:274–277. doi: 10.1038/nature08102. [DOI] [PMC free article] [PubMed] [Google Scholar]
- 39.Yamamoto K, Tatebayashi K, Tanaka K, Saito H. Dynamic control of yeast MAP kinase network by induced association and dissociation between the Ste50 scaffold and the Opy2 membrane anchor. Mol Cell. 2010;40:87–98. doi: 10.1016/j.molcel.2010.09.011. [DOI] [PubMed] [Google Scholar]
- 40.Tatebayashi K, Yamamoto K, Tanaka K, Tomida T, Maruoka T, Kasukawa E, Saito H. Adaptor functions of Cdc42, Ste50, and Sho1 in the yeast osmoregulatory HOG MAPK pathway. EMBO J. 2006;25:3033–3044. doi: 10.1038/sj.emboj.7601192. [DOI] [PMC free article] [PubMed] [Google Scholar]
- 41.Gladfelter AS, Bose I, Zyla TR, Bardes ESG, Lew DJ. Septin ring assembly involves cycles of GTP loading and hydrolysis by Cdc42p. J Cell Biol. 2002;156:315–326. doi: 10.1083/jcb.200109062. [DOI] [PMC free article] [PubMed] [Google Scholar]
- 42.Smith GR, Givan SA, Cullen P, Sprague GF. GTPase-activating proteins for Cdc42. Eukaryot Cell. 2002;1:469–480. doi: 10.1128/EC.1.3.469-480.2002. [DOI] [PMC free article] [PubMed] [Google Scholar]
- 43.Stevenson BJ, Ferguson B, De Virgilio C, Bi E, Pringle JR, Ammerer G, Sprague GF., Jr Mutation of RGA1, which encodes a putative GTPase-activating protein for the polarity-establishment protein Cdc42p, activates the pheromone-response pathway in the yeast Saccharomyces cerevisiae. Genes Dev. 1995;9:2949–2963. doi: 10.1101/gad.9.23.2949. [DOI] [PubMed] [Google Scholar]
- 44.Zheng Y, Cerione R, Bender A. Control of the yeast bud-site assembly GTPase Cdc42. Catalysis of guanine nucleotide exchange by Cdc24 and stimulation of GTPase activity by Bem3. J Biol Chem. 1994;269:2369–2372. [PubMed] [Google Scholar]
- 45.Raitt DC, Posas F, Saito H. Yeast Cdc42 GTPase and Ste20 PAK-like kinase regulate Sho1-dependent activation of the Hog1 MAPK pathway. EMBO J. 2000;19:4623–4631. doi: 10.1093/emboj/19.17.4623. [DOI] [PMC free article] [PubMed] [Google Scholar]
- 46.Posas F, Wurgler-Murphy SM, Maeda T, Witten EA, Thai TC, Saito H. Yeast HOG1 MAP kinase cascade is regulated by a multistep phosphorelay mechanism in the SLN1–YPD1–SSK1 “two-component” osmosensor. Cell. 1996;86:865–875. doi: 10.1016/s0092-8674(00)80162-2. [DOI] [PubMed] [Google Scholar]
- 47.Santos SDM, Ferrell JE. Systems biology: On the cell cycle and its switches. Nature. 2008;454:288–289. doi: 10.1038/454288a. [DOI] [PMC free article] [PubMed] [Google Scholar]
- 48.Bradshaw JM, Kubota Y, Meyer T, Schulman H. An ultrasensitive Ca2+/calmodulin-dependent protein kinase II-protein phosphatase 1 switch facilitates specificity in post-synaptic calcium signaling. Proc Natl Acad Sci USA. 2003;100:10512–10517. doi: 10.1073/pnas.1932759100. [DOI] [PMC free article] [PubMed] [Google Scholar]
- 49.Harnett MT, Makara JK, Spruston N, Kath WL, Magee JC. Synaptic amplification by dendritic spines enhances input cooperativity. Nature. 2012;491:599–602. doi: 10.1038/nature11554. [DOI] [PMC free article] [PubMed] [Google Scholar]
- 50.Goldbeter A, Wolpert L. Covalent modification of proteins as a threshold mechanism in development. J Theor Biol. 1990;142:243–250. doi: 10.1016/s0022-5193(05)80225-5. [DOI] [PubMed] [Google Scholar]
- 51.Melen GJ, Levy S, Barkai N, Shilo BZ. Threshold responses to morphogen gradients by zero-order ultrasensitivity. Mol Syst Biol. 2005;1:2005.0028. doi: 10.1038/msb4100036. [DOI] [PMC free article] [PubMed] [Google Scholar]
- 52.Pelet S, Rudolf F, Nadal-Ribelles M, de Nadal E, Posas F, Peter M. Transient activation of the HOG MAPK pathway regulates bimodal gene expression. Science. 2011;332:732–735. doi: 10.1126/science.1198851. [DOI] [PubMed] [Google Scholar]
- 53.Ni L, Bruce C, Hart C, Leigh-Bell J, Gelperin D, Umansky L, Gerstein MB, Snyder M. Dynamic and complex transcription factor binding during an inducible response in yeast. Genes Dev. 2009;23:1351–1363. doi: 10.1101/gad.1781909. [DOI] [PMC free article] [PubMed] [Google Scholar]
- 54.Guan Q, Haroon S, Bravo DG, Will JL, Gasch AP. Cellular memory of acquired stress resistance in Saccharomyces cerevisiae. Genetics. 2012;192:495–505. doi: 10.1534/genetics.112.143016. [DOI] [PMC free article] [PubMed] [Google Scholar]
- 55.Ashburner M, Ball CA, Blake JA, Botstein D, Butler H, Cherry JM, Davis AP, Dolinski K, Dwight SS, Eppig JT, Harris MA, Hill DP, Issel-Tarver L, Kasarskis A, Lewis S, Matese JC, Richardson JE, Ringwald M, Rubin GM, Sherlock G. Gene Ontology: Tool for the unification of biology. The Gene Ontology Consortium. Nat Genet. 2000;25:25–29. doi: 10.1038/75556. [DOI] [PMC free article] [PubMed] [Google Scholar]
- 56.Bardwell L. Signal transduction: Turning a switch into a rheostat. Curr Biol. 2008;18:R910–R912. doi: 10.1016/j.cub.2008.07.082. [DOI] [PMC free article] [PubMed] [Google Scholar]
- 57.Dohlman HG. A scaffold makes the switch. Sci Signal. 2008;1:pe46. doi: 10.1126/scisignal.142pe46. [DOI] [PubMed] [Google Scholar]
- 58.Ferrell JE., Jr Self-perpetuating states in signal transduction: Positive feedback, double-negative feedback and bistability. Curr Opin Cell Biol. 2002;14:140–148. doi: 10.1016/s0955-0674(02)00314-9. [DOI] [PubMed] [Google Scholar]
- 59.Pawson T, Nash P. Assembly of cell regulatory systems through protein interaction domains. Science. 2003;300:445–452. doi: 10.1126/science.1083653. [DOI] [PubMed] [Google Scholar]
- 60.Hurst JH, Dohlman HG. Dynamic ubiquitination of the mitogen-activated protein kinase kinase (MAPKK) Ste7 determines mitogen-activated protein kinase (MAPK) specificity. J Biol Chem. 2013;288:18660–18671. doi: 10.1074/jbc.M113.475707. [DOI] [PMC free article] [PubMed] [Google Scholar]
- 61.Mukherjee S, Keitany G, Li Y, Wang Y, Ball HL, Goldsmith EJ, Orth K. Yersinia YopJ acetylates and inhibits kinase activation by blocking phosphorylation. Science. 2006;312:1211–1214. doi: 10.1126/science.1126867. [DOI] [PubMed] [Google Scholar]
- 62.Andreu-Pérez P, Esteve-Puig R, de Torre-Minguela C, López-Fauqued M, Bech-Serra JJ, Tenbaum S, García-Trevijano ER, Canals F, Merlino G, Avila MA, Recio JA. Protein arginine methyltransferase 5 regulates ERK1/2 signal transduction amplitude and cell fate through CRAF. Sci Signal. 2011;4:ra58. doi: 10.1126/scisignal.2001936. [DOI] [PMC free article] [PubMed] [Google Scholar]
- 63.Huang TT, Wuerzberger-Davis SM, Wu ZH, Miyamoto S. Sequential modification of NEMO/IKKg by SUMO-1 and ubiquitin mediates NF-κB activation by genotoxic stress. Cell. 2003;115:565–576. doi: 10.1016/s0092-8674(03)00895-x. [DOI] [PubMed] [Google Scholar]
- 64.Merbl Y, Refour P, Patel H, Springer M, Kirschner MW. Profiling of ubiquitin-like modifications reveals features of mitotic control. Cell. 2013;152:1160–1172. doi: 10.1016/j.cell.2013.02.007. [DOI] [PMC free article] [PubMed] [Google Scholar]
- 65.Tang X, Orlicky S, Mittag T, Csizmok V, Pawson T, Forman-Kay JD, Sicheri F, Tyers M. Composite low affinity interactions dictate recognition of the cyclin-dependent kinase inhibitor Sic1 by the SCFCdc4 ubiquitin ligase. Proc Natl Acad Sci USA. 2012;109:3287–3292. doi: 10.1073/pnas.1116455109. [DOI] [PMC free article] [PubMed] [Google Scholar]
- 66.Kinoshita E, Kinoshita-Kikuta E. Improved Phos-tag SDS-PAGE under neutral pH conditions for advanced protein phosphorylation profiling. Proteomics. 2011;11:319–323. doi: 10.1002/pmic.201000472. [DOI] [PubMed] [Google Scholar]
- 67.Schindelin J, Arganda-Carreras I, Frise E, Kaynig V, Longair M, Pietzsch T, Preibisch S, Rueden C, Saalfeld S, Schmid B, Tinevez JY, White DJ, Hartenstein V, Eliceiri K, Tomancak P, Cardona A. Fiji: An open-source platform for biological-image analysis. Nat Methods. 2012;9:676–682. doi: 10.1038/nmeth.2019. [DOI] [PMC free article] [PubMed] [Google Scholar]
- 68.Abdulrehman D, Monteiro PT, Teixeira MC, Mira NP, Lourenço AB, dos Santos SC, Cabrito TR, Francisco AP, Madeira SC, Aires RS, Oliveira AL, Sá-Correia I, Freitas AT. YEASTRACT: Providing a programmatic access to curated transcriptional regulatory associations in Saccharomyces cerevisiae through a web services interface. Nucleic Acids Res. 2011;39:D136–D140. doi: 10.1093/nar/gkq964. [DOI] [PMC free article] [PubMed] [Google Scholar]
- 69.da Huang W, Sherman BT, Lempicki RA. Systematic and integrative analysis of large gene lists using DAVID bioinformatics resources. Nat Protoc. 2009;4:44–57. doi: 10.1038/nprot.2008.211. [DOI] [PubMed] [Google Scholar]
- 70.Huang DW, Sherman BT, Lempicki RA. Bioinformatics enrichment tools: Paths toward the comprehensive functional analysis of large gene lists. Nucleic Acids Res. 2009;37:1–13. doi: 10.1093/nar/gkn923. [DOI] [PMC free article] [PubMed] [Google Scholar]
- 71.Kurec M, Baszczynski M, Lehnert R, Mota A, Teixeira JA, Brányik T. Flow cytometry for age assessment of a yeast population and its application in beer fermentations. J Inst Brew. 2009;115:253–258. [Google Scholar]
- 72.Cappell SD, Baker R, Skowyra D, Dohlman HG. Systematic analysis of essential genes reveals important regulators of G protein signaling. Mol Cell. 2010;38:746–757. doi: 10.1016/j.molcel.2010.05.026. [DOI] [PMC free article] [PubMed] [Google Scholar]
Associated Data
This section collects any data citations, data availability statements, or supplementary materials included in this article.
Supplementary Materials
Fig. S1. The antibodies generated against phosphorylated p38 recognize monophosphorylated and dually phosphorylated Hog1.
Fig. S2. Negative feedback only model fails to capture the Hog1 signaling profile.
Fig. S3. Hog1 signaling profile in the Ste505A strain.
Fig. S4. Hog1 signaling profile in ssk1Δ and rga1Δ yeast.
Fig. S5. Gating parameters for flow cytometry data.
Table S1. Transcription factor binding and interaction analysis.
Table S2. List of yeast strains used in this study.
Table S3. List of parameter values used in modeling.
Database S1. Annotated microarray data with GO analysis and organization.
Database S2. Induction of 95 proteins from clusters 1 to 4 in response to 0, 350, or 650 mM KCl.