

Abstract
Although much prior work has focused on the known cortical pathology that defines Alzheimer’s disease (AD) histologically, recent work has additionally demonstrated substantial damage to the cerebral white matter in this condition. While there is large evidence of diffuse damage to the white matter in AD, it is unclear whether specific white matter tracts exhibit a more accelerated pattern of damage and whether the damage is associated with the classical neurodegenerative changes of AD. In this study, we investigated physiological differences in the large fascicular bundles of the cerebral white matter of individuals with AD and mild cognitive impairment (MCI), using recently developed automated diffusion tractography procedures in the Alzheimer’s disease Neuroimaging Initiative (ADNI) dataset. Eighteen major fiber bundles in a total of 36 individuals with AD, 81 MCI and 60 control participants were examined with the TRActs Constrained by UnderLying Anatomy (TRACULA) procedure available as part of the FreeSurfer image processing software package. For each fiber bundle, the mean fractional anisotropy (FA), and mean, radial and axial diffusivities were calculated. Individuals with AD had increased diffusivities in both left and right cingulum-angular bundles compared to control participants (p<0.001). Individuals with MCI also had increased axial and mean diffusivities and increased FA in both cingulum-angular bundles compared to control participants (p<0.05) and decreased radial diffusivity compared to individuals with AD (p<0.05). We additionally examined how white matter deterioration relates to hippocampal volume, a traditional imaging measure of AD pathology, and found the strongest negative correlations in AD patients between hippocampal volume and the diffusivities of the cingulum-angular and cingulum-cingulate gyrus bundles and of the corticospinal tracts (p<0.05). However, statistically controlling for hippocampal volume did not remove all group differences in white matter measures, suggesting a unique contribution of white matter damage to AD unexplained by this disease biomarker. These results suggest that 1) AD-associated deterioration of white matter fibers is greatest in tracts known to be connected to areas of pathology in AD and 2) lower white matter tract integrity is more diffusely associated with lower hippocampal volume indicating that the pathology in the white matter follows to some degree the neurodegenerative staging and progression of this condition.
Keywords: Alzheimer’s disease, mild cognitive impairment, white matter, hippocampus, cingulum and angular bundle
INTRODUCTION
Alzheimer’s disease (AD) is a neurodegenerative disorder and the most common form of dementia in older adults (Ferri et al., 2005). This condition contributes to substantial societal and economic burdens (Rice et al., 1993, Langa et al., 2001), and the pathophysiology of AD remains to be fully understood. Although much work is focused on cortical atrophy and on amyloid and neurofibrillary pathology in the cortex and subcortical gray matter (Bouras et al., 1994, Hyman, 1997, Tiraboschi et al., 2004, Jack et al., 2011), it is also clear that there is significant widespread damage to the cerebral white matter (WM) as the disease progresses, both evidenced by an increased amount of white matter abnormalities as seen on MRI (Yoshita et al., 2006), and by studies showing demyelination, microglial activation, loss of oligodendrocytes and reactive astrocytosis in the white matter (Brun and Englund, 1986, Sjobeck et al., 2005, 2006, Gouw et al., 2008). This WM damage likely plays an important role in the clinical presentation of individuals with AD, and better understanding of these changes may provide insight into alternative pathologic mechanisms contributing to AD dementia. In particular, it is of interest to understand where the strongest regional WM changes are found and whether they affect particular fiber bundles in the cerebral WM. Furthermore, it is unclear whether this damage tracks with cortical AD pathology such as hippocampal degeneration.
Several studies have used neuroimaging techniques such as volumetric measurements (Salat et al., 1999a, Salat et al., 1999b, Salat et al., 2009) and diffusion tensor imaging (DTI) (Rose et al., 2000, Bozzali et al., 2002, Choi et al., 2005, Bucur et al., 2008, Madden et al., 2009, Salat et al., 2009, Stebbins and Murphy, 2009, Gold et al., 2010, Pievani et al., 2010, Salat et al., 2010, Smith et al., 2010, Douaud et al., 2011, Nir et al., 2012, Nir et al., 2013, Rowley et al., 2013, Lim et al., 2014, Sun et al., 2014) to study WM pathology in AD and show both extensive local and diffuse damage. DTI enables the measurement of several microstructural properties of the WM tissue environment. Commonly-described DTI parameters include fractional anisotropy (FA), mean diffusivity (MD), axial diffusivity (DA), and radial diffusivity (DR), which have been respectively correlated histologically with degree of myelination (Beaulieu, 2002, Moseley, 2002, Peters, 2002), cell death and edema (Chenevert et al., 2000, Sotak, 2002), axonal injury and demyelination, loss of oligodendrocytes and reactive astrocytosis (Werring et al., 1999, Song et al., 2002, Song et al., 2003). In addition to markers of tissue integrity, diffusion-weighted imaging is a useful technique to infer local fiber orientation for the computational modeling of the major fiber bundles in the brain, referred to as ‘diffusion tractography’(Basser et al., 2000). Previous studies used a combination of DTI and tractography to study pathology in AD (Madden et al., 2009, Pievani et al., 2010, Douaud et al., 2011, Hasan et al., 2012, Nir et al., 2012, Rowley et al., 2013). We here add to this work by applying a recently developed automated probabilistic tractography procedure for whole-brain modeling of the major cerebral WM fiber bundles, TRActs Constrained by UnderLying Anatomy (TRACULA)(Yendiki et al., 2011) and examining which of the major large fascicles of the brain exhibit the greatest WM deterioration as a consequence of mild cognitive impairment (MCI) and AD. We additionally examined the association between tract integrity measured with DTI and a classical imaging marker of AD, hippocampal volume, to determine whether the WM changes are related to neurodegeneration or to a different cause. We demonstrate for the first time in a large dataset relative effects among fiber bundles showing greatest WM deterioration in cingulum-angular bundles for both MCI and AD, while the corticospinal tracts, superior and inferior longitudinal fasciculi, uncinate fasciculi, corpus callosum, and anterior thalamic radiations were relatively spared. Tract integrity was associated with hippocampal volume in individuals with AD as well as the control cohort; however, the relationship in AD was pronounced for tracts closest/with anatomical connectivity to the hippocampus. These data demonstrate that regional WM pathology tracks with hippocampal degeneration in AD. While we expected a selective loss in individuals with MCI and a more generalized effect in AD related to a greater degree of global cortical degeneration, we did not find this. Instead, we found greater diffusivity differences in AD compared to controls in the same white matter tracts where effects are seen in MCI.
2 Experimental Procedures
2.1 Participants
Data used in the preparation of this article were obtained from the Alzheimer’s Disease Neuroimaging Initiative (ADNI) database (http://adni.loni.usc.edu/). A description of ADNI as described (on the ADNI website) is provided here: The ADNI was launched in 2003 by the National Institute on Aging (NIA), the National Institute of Biomedical Imaging and Bioengineering (NIBIB), the Food and Drug Administration (FDA), private pharmaceutical companies, and non-profit organizations, as a $60 million, 5-year public–private partnership. The primary goal of ADNI has been to test whether serial MRI, PET, other biological markers, and clinical and neuropsychological assessment can be combined to measure the progression of MCI and early AD. Determination of sensitive and specific markers of very early AD progression is intended to aid researchers and clinicians to develop new treatments and monitor their effectiveness, as well as lessen the time and cost of clinical trials. The Principal Investigator of this initiative is Michael W. Weiner, MD, VA Medical Center and University of California – San Francisco. ADNI is the result of efforts of many co-investigators from a broad range of academic institutions and private corporations, and subjects have been recruited from over 50 sites across the U.S. and Canada. The initial goal of ADNI was to recruit 800 subjects but ADNI has been followed by ADNI-GO and ADNI-2. To date these three protocols have recruited over 1500 adults, ages 55–90, to participate in the research, consisting of cognitively normal older individuals, people with early or late MCI, and people with early AD. The follow-up duration of each group is specified in the protocols for ADNI-1, ADNI-2, and ADNI-GO. Subjects originally recruited for ADNI-1 and ADNI-GO had the option to be followed in ADNI-2. For up-to-date information, see www.adni-info.org.
At the time of analysis, 232 participants were found to have performed both structural and DTI scans from the ADNIGO and ADNI2 databases. In addition to magnetic resonance imaging (MRI) data, clinical profiles including age, sex, education, Mini-Mental State Examination (MMSE) and Clinical Dementia Rating (CDR) were obtained for participant characterization. Group designation of Control, Mild Cognitive Impairment (MCI), or probable AD was determined by diagnosis as specified by ADNI based on the criteria of the National Institute of Neurological and Communicative Diseases and Stroke — Alzheimer’s Disease and Related Disorders Association (McKhann et al., 1984). Clinical profiles and diagnostic information were obtained from the closest assessment to the time of brain imaging scan. Participants enrolled as generally healthy and with significant memory concern were grouped together into the control group, and participants enrolled as early and late MCI were combined into one MCI group. Overall, the 232 baseline DTI datasets available in the ADNI database included 48 individuals with AD, 99 individuals with MCI, 71 cognitively healthy control participants and 14 individuals of undetermined group (absent or incomplete clinical information for a diagnosis at the time of download).
2.2 Magnetic resonance imaging acquisition
All participants underwent whole-brain MRI scanning on 3-Tesla GE Medical Systems scanners at one or multiple visits. We utilized the high-resolution T1-weighted and DTI data from the ADNIGO and ADNI2 data sets obtained from a previously described Core MRI and DTI protocols (Jack et al., 2008) Sagittal T1-weighted 3D spoiled gradient echo images and diffusion-weighted images (b = 1000 s/mm2, 41 directions) were downloaded from the ADNI database
2.3 Automated subcortical segmentation and cortical parcellation
Automated subcortical segmentation was obtained through processing and reconstruction of the anatomical data using FreeSurfer (https://surfer.nmr.mgh.harvard.edu, software package version 5.3), as described previously (Dale et al., 1999, Fischl et al., 1999, Fischl et al., 2001, Segonne et al., 2004, Segonne et al., 2005). Although we do not discuss longitudinal analysis in this report, the FreeSurfer longitudinal stream was used for participants with multiple time points (with diffusion datasets) as this procedure is unbiased by the number of time points and more robust when multiple time points are available (Reuter et al., 2010, Reuter and Fischl, 2011, Bernal-Rusiel et al., 2012, Reuter et al., 2012, Bernal-Rusiel et al., 2013, Sabuncu et al., 2014). Measurements of both right and left hippocampal volumes and estimated intracranial volume (ICV) were performed using the automated subcortical segmentation and cortical parcellation tools available as part of FreeSurfer, as described previously (Fischl et al., 2002, Fischl et al., 2004a, Fischl et al., 2004b, Desikan et al., 2006, Han and Fischl, 2007, Fischl et al., 2008, Yeo et al., 2008, Destrieux et al., 2010). We normalized the hippocampal volume ICV [(sum of both hippocampus volume divided by ICV)*100] and the volume of the lateral ventricles to ICV [(sum of both lateral ventricle volume divided by ICV)*100] for statistical analyses. The volume of white matter signal abnormality (WMSA) was also obtained from the FreeSurfer segmentation and normalized to the total WM volume [(WMSA volume divided by total WM volume)*100].
2.4 Tractography of 18 major white matter tracts
Diffusion-weighted images were processed using TRActs Constrained by UnderLying Anatomy (TRACULA), available as a part of FreeSurfer (Yendiki et al., 2011, Yendiki et al., 2013). TRACULA is a novel method for automated global probabilistic reconstruction of 18 major white matter pathways. In order to reconstruct these white matter tracts, TRACULA utilizes prior information on the anatomy from a set of training participants where the tracts of interest were labeled manually. This prior information is the likelihood of each tract to travel through or next to each of the cortical and subcortical segmentation labels from FreeSurfer. The output of TRACULA is a probabilistic distribution for each of the 18 tracts.
Participant data was first preprocessed to correct for simple head motion and eddy currents by aligning the diffusion weighted images to an average of the b = 0, T2-weighted images. The gradient vectors were rotated accordingly. FreeSurfer’s bbregister (Greve and Fischl, 2009) was used for affine intra-subject registration between the diffusion-weighted and anatomical images, and to an MNI152 template (Talairach and Tournoux, 1988). Using FSL’s dtifit (http://www.fmrib.ox.ac.uk/fsl), a least squares tensor estimation was completed creating the FA, MD, DA, and DR volumes. FSL’s bedpostX (Behrens et al., 2007) was used to apply the ball-and-stick model of diffusion, using one isotropic and two anisotropic compartments per voxel. TRACULA then uses the individual participant’s ball-and-stick model of local diffusion orientations, as well as the participant’s cortical and subcortical segmentation labels, combined with prior information on each tract’s position relative to these labels based on the training set to estimate the probability distributions of each tract. This allows the reconstruction of volumetric distributions of the 18 major white-matter pathways included in the atlas and the extraction of tensor-based measures (FA, MD, DA and DR) for each of the reconstructed pathways. The 18 major WM pathways include the corticospinal tract, inferior longitudinal fasciculus, uncinated fasciculus, anterior thalamic radiation, cingulum-cingulate gyrus bundle, cingulum-angular bundle, superior longitudinal fasciculus-parietal bundle, superior longitudinal fasciculus-temporal bundle, corpus callosum’s forceps major and forceps minor.
2.5 Assessment of head motion
Participant motion has been demonstrated to be a confounding factor in prior imaging work leading to spurious group differences in diffusion MRI (Yendiki et al., 2013) as well as other imaging domains (Power et al., 2012). We therefore assessed participant motion using a feature of the TRACULA processing pipeline (Yendiki et al., 2011, Yendiki et al., 2013) to obtain the average score of head translation and rotation for each diffusion-weighted volume. For participants with multiple diffusion datasets (177 out of 232), we used this information to select the participant’s diffusion dataset with the least translation motion for all of our processing and analyses. No significant differences in motion measures were found between diffusion datasets chosen from individuals with a unique diffusion dataset and individuals with multiple diffusion datasets (not shown).
2.6 Quality assessment and exclusion
Among 232 participants, a total of 177 images were fully processed through TRACULA and included in the final group analyses: 11 were not processed due to an unsuccessful or inaccurate FreeSurfer reconstruction, 30 were not included due to failure of reconstruction of at least 2 major tracts. In total, twelve AD, 18 MCI and 11 controls as well as the 14 participants with undetermined grouping were excluded from the initial 232 individual datasets downloaded from the ADNI database.
Visual inspection suggested that the participants without successful reconstruction were individuals with severely degenerated brain tissue. We therefore compared the motion scores, normalized WMSA volume, normalized volume of the lateral ventricles between the included and excluded participants to determine whether any of these parameters accounted for the reconstruction failures, using Student t- test. While there was no difference in motion scores between the two groups, there were significantly greater normalized WMSA volume and normalized volume of the lateral ventricles in the excluded subjects (not shown).
Although these datasets could have been included with additional effort, the results demonstrate that the current dataset provides adequate statistical power to detect the strongest disease effects despite the exclusion of participants with excessive tissue damage including WM damage and/or ventricular enlargement. Therefore, it is important to note that this exclusion may over-emphasize the degree of selectivity of the results as the excluded individuals would have increased statistical power to detect more diffuse damage as observed previously in voxelwise and region-of-interest studies.
2.7 Statistical Analyses
Statistical analyses were performed using JMP version 10 statistical software (SAS Institute Inc., Cary, NC, U.S.A.). Analysis of variance was used to compare age, education, MMSE, ICV, volume of hippocampus, the normalized hippocampal volume, the average score of head translation and rotation among control, MCI, and AD. The mean DTI parameters of control, MCI, and AD individuals were compared using the Kruskal-Wallis test. When there were significant differences (p<0.05), post-hoc analyses were also performed. We used the student t-test to compare the mean of motion scores between participants with a single diffusion dataset and participants with multiple diffusion datasets, and to compare motion scores, normalized WMSA volume, normalized volume of lateral ventricles between participants that were included and participants that were excluded.
We also tested the associations between normalized hippocampal volume and the DTI parameters of all 18 major tracts using the Pearson’s correlation test, respectively. These analyses were applied to the control, MCI and AD participant to understand the relationship between the damage classically attributed in AD (declining hippocampal volume) and the deterioration of the white matter tracts with the disease, and show whether these two phenomena can be potentially attributed to a linked disease pathway. A general linear model including age, gender, education and motion measures as covariates was used to investigate any significant group differences in the associations between DTI metrics and hippocampal volume. A general linear model including age, gender, education, hippocampal volume and motion measures as covariates was also used to identify any remaining group differences when accounting for hippocampal volume.
3 Results
The reconstructed tracts for one typical dataset in a control participant are shown in Figure 1. Demographics are summarized in Table 1. There were no significant differences in age, education, and ICV between groups. MMSE and the normalized hippocampal volume showed significant differences between groups (p<0.001) (Table 1), as has been extensively shown before (Seab et al., 1988, Galasko et al., 1990, Convit et al., 1997, Bobinski et al., 2000).
Fig. 1.

Radiological views of the 18 reconstructed white matter tracts overlaid on fractional anisotropy map in a control participant [coronal (A), sagittal (B) and axial (C)], and 3D anatomical view (D). CCG=cingulum-cingulate gyrus bundle; CST=corticospinal tract; FM=corpus callosum-forceps major; Fm= corpus callosum-forceps minor; SLFP=superior longitudinal fasciculus-parietal endings; SLFT=superior longitudinal fasciculus-temporal endings; ILF=inferior longitudinal faciculus; CAB=cingulum-angular bundle; UNC= uncinate fasciculus; ATR=anterior thalamic radiations.
Table 1.
Demographics, neuropsychological assessment and volumetric data of controls, MCI and AD participants.
| Control | MCI | AD | ANOVA (P) | |
|---|---|---|---|---|
| number | 60 | 81 | 36 | - |
| F:M | 40:20 | 32:49 | 15:21 | - |
| Age | 73.1 ± 5.7 | 73.0 ± 7.6 | 74.6 ± 8.4 | NS |
| Education | 16.4 ± 2.5 | 16.0 ± 2.7 | 15.0 ± 2.9 | NS |
| MMSE | 29.0 ± 1.4 | 27.9 ± 1.8 | 23.1 ± 2.2 | <0.001 |
| ICV (mm3) | 1427437 ± 115805 | 1478155 ± 153093 | 1450952 ± 175106 | NS |
| Normalized hippocampus volume (%) | 0.53 ± 0.062 | 0.46 ± 0.086 | 0.39 ± 0.059 | <0.0001 |
MMSE=mini mental status examination; ICV=intracranial volume; MCI: mild cognitive impairment; AD: Alzheimer’s disease; NS= not significant; ‘−’=not applicable; Normalized hippocampal volume meaned percent of hippocampal volume to intracranial volume (ICV)[(sum of both hippocampi volume divided by ICV)*100].
3.1 Groups differences in tract white matter integrity
Diffusion parameters (FA, MD, DA and DR) were extracted for each of the reconstructed pathways. We used the Kruskal-Wallis test to compare the mean of diffusion parameters among groups. Significant group differences were found using ANOVA for the left cingulum-angular bundle (FA, MD, DR, DA: p<0.05), right cingulum-angular bundle (FA, MD, DR, DA: p<0.001), left corticospinal tract (FA: p<0.05), right inferior longitudinal fasciculus (DR: p<0.05), left superior longitudinal fasciculus-temporal bundle (FA: p<0.05), and left UNC (DA: p<0.05), as shown in Figure 2.
Fig. 2.
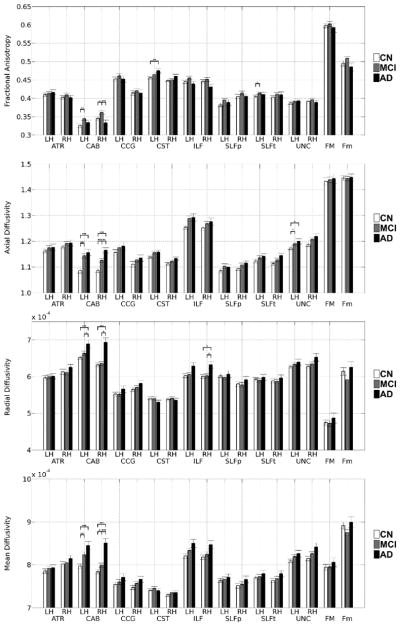
Group comparisons of FA, DA, DR and MD between controls, MCI and AD participants for each tract. Error bars show the standard error from the mean.
LH=left; RH=right; ATR=anterior thalamic radiations; CAB=cingulum-angular bundle; CCG=cingulum-cingulate gyrus bundle; CST=corticospinal tract; ILF=inferior longitudinal faciculus; SLFP=superior longitudinal fasciculus-parietal endings; SLFT=superior longitudinal fasciculus-temporal endings; UNC= uncinate fasciculus; FMAJOR=corpus callosum-forceps major; FMINOR= corpus callosum-forceps minor. *, ** and *** indicate p<0.05, p<0.001 and p<0.0001, respectively.
Post-hoc analyses showed higher diffusivity in AD participants than controls in the left cingulum-angular bundle (MD, DR, DA: p<0.001), right cingulum-angular bundle (MD, DR, DA: p<0.001), right inferior longitudinal fasciculus (DR: p<0.05) and left uncinated fasciculus (DA: p<0.05). Higher FA in AD participants than controls was also observed in the left corticospinal tract (FA: p<0.01). MCI participants had higher diffusivity and FA than controls in the left cingulum-angular bundle (DA, MD: p<0.001; FA: p<0.01), right cingulum-angular bundle (DA: p<0.001; MD, FA: p<0.05), left superior longitudinal fasciculus-temporal bundle (FA: p<0.05) and left uncinated fasciculus (DA: p<0.05). Higher diffusivity and lower FA were found in AD participants when compared to MCI participants in the left cingulum-angular bundle (DR: p<0.05), right cingulum-angular bundle (FA, MD, DR: p<0.001; DA: p<0.01) and right inferior longitudinal fasciculus (DR: p<0.05).
3.2 Associations between hippocampal volume and DTI parameters
Weak or moderate associations were found between the normalized hippocampus volume and DTI parameters in control, MCI, and AD participants in several white matter tracts, as shown in Table 2. The associations between normalized hippocampus volume and FA were only significant for two different unilateral tracts while significant associations between normalized hippocampus volume and diffusivities were found for most white matter tracts, especially in the controls. Of note, several significant associations remained strong in individuals with AD, such as for MD in both cingulum-angular bundles, cingulum-cingulate gyrus bundles, corticospinal tracts, and the right inferior longitudinal fasciculus. Notably, AD also preserved a strong association between hippocampal volume and DA of the corpus callosum-forceps minor, and both cingulum-angular bundles. MCI showed less and weaker associations compared to controls and AD. Scatterplots of the associations between the DTI metrics of the right cingulum-angular bundle and normalized hippocampal volume are shown in Figure 3 for the three groups. A general linear model including age, gender, education and motion measures as covariates found no significant slope differences between groups, except for the left and right anterior thalamic radiations (not shown). A general linear model including age, gender, education, hippocampal volume and motion measures as covariates also found remaining significant group differences in the left (higher DA in MCI compared to controls, p<0.05) and right (higher DA, p<0.05, FA, p<0.01, in MCI compared to controls; higher MD and DR, p<0.001, and higher DA, p<0.05, in AD compared to controls; higher MD and DR, p<0.001, in AD compared to MCI) cingulum angular bundles even when accounting for hippocampal volume in the model.
Table 2.
Correlation coefficients for significant associations between the normalized hippocampal volume [(sum of both hippocampi volume)/ICV*100] and DTI parameters for each tract.
| Normalized hippocampus volume
|
||||||||||||
|---|---|---|---|---|---|---|---|---|---|---|---|---|
| FA | MD | DR | DA | |||||||||
|
| ||||||||||||
| Control | MCI | AD | Control | MCI | AD | Control | MCI | AD | Control | MCI | AD | |
| FM | 0.21 | −0.04 | 0.13 | −0.10 | −0.16 | −0.30 | −0.21 | −0.05 | −0.24 | 0.04 | −0.20 | −0.16 |
| Fm | 0.02 | 0.16 | −0.14 | −0.23 | −0.15 | −0.15 | −0.12 | −0.16 | −0.01 | −0.30* | −0.06 | −0.39* |
| LT_ATR | 0.03 | 0.15 | 0.11 | −0.46** | 0.01 | −0.30 | −0.33* | −0.08 | −0.29 | −0.47** | 0.11 | −0.19 |
| RT_ATR | 0.04 | 0.28* | 0.21 | −0.39** | −0.17 | −0.32 | −0.27* | −0.26* | −0.34* | −0.45** | 0.08 | −0.16 |
| LT_CAB | −0.26* | 0.10 | −0.06 | −0.35** | −0.36** | −0.34* | −0.16 | −0.33** | −0.25 | −0.40** | −0.30** | −0.37* |
| RT_CAB | −0.12 | 0.05 | 0.06 | −0.31* | −0.21 | −0.36* | −0.18 | −0.16 | −0.28 | −0.35** | −0.19 | −0.46** |
| LT_CCG | −0.09 | 0.18 | 0.03 | −0.29* | −0.23* | −0.38* | −0.17 | −0.27* | −0.27 | −0.25* | −0.04 | −0.32 |
| RT_CCG | 0.03 | 0.14 | 0.03 | −0.19 | −0.17 | −0.38* | −0.16 | −0.22* | −0.25 | −0.11 | −0.03 | −0.29 |
| LT_CST | 0.07 | 0.14 | 0.15 | −0.39** | −0.13 | −0.36* | −0.26* | −0.16 | −0.29 | −0.42** | −0.03 | −0.24 |
| RT_CST | 0.02 | 0.13 | 0.15 | −0.25 | −0.23 | −0.41* | −0.18 | −0.22* | −0.31 | −0.29* | −0.15 | −0.32 |
| LT_ILF | 0.09 | 0.06 | 0.21 | −0.31* | −0.12 | −0.32 | −0.26* | −0.12 | −0.32 | −0.24 | −0.07 | −0.18 |
| RT_ILF | −0.01 | 0.09 | 0.15 | −0.35** | −0.22* | −0.36* | −0.22 | −0.19 | −0.34* | −0.34** | −0.17 | −0.27 |
| LT_SLFP | −0.01 | 0.17 | 0.20 | −0.28* | −0.15 | −0.33 | −0.19 | −0.17 | −0.29 | −0.28* | −0.07 | −0.27 |
| RT_SLFP | −0.14 | 0.11 | 0.29 | −0.24 | −0.23* | −0.28 | −0.09 | −0.17 | −0.29 | −0.42** | −0.22* | −0.15 |
| LT_SLFT | −0.12 | 0.16 | 0.06 | −0.43** | −0.11 | −0.32 | −0.28* | −0.14 | −0.28 | −0.43** | −0.05 | −0.27 |
| RT_SLFT | −0.07 | 0.01 | 0.18 | −0.24 | −0.27* | −0.26 | −0.14 | −0.17 | −0.23 | −0.32* | −0.33** | −0.16 |
| LT_UNC | −0.02 | 0.07 | −0.13 | −0.39** | −0.20 | −0.17 | −0.27* | −0.17 | −0.08 | −0.37** | −0.17 | −0.26 |
| RT_UNC | −0.06 | 0.17 | 0.05 | −0.21 | −0.36** | −0.30 | −0.13 | −0.32** | −0.25 | −0.24 | −0.27* | −0.32 |
FA=fractional anisotropy; MD=mean diffusivity; DR=radial diffusivity; DA=axial diffusivity; hippo=hippocampus; ICV=intracranial volume; FM=corpus callosum-forceps majors; Fm=corpus callosum-forceps minor; CST=corticospinal tract; ILF=inferior longitudinal fasciculus; UNC=uncinate fasciculus; ATR=anterior thalamic radiation; CCG=cingulum-cingulate gyrus bundle; CAB=cingulum-angular bundle; SLFP=superior longitudinal fasciculus-parietal bundle; SLFT=superior longitudinal fasciculus-temporal bundle; Normalized hippocampal volume meaned percent of hippocampal volume to intracranial volume (ICV)[(sum of both hippocampi volume divided by ICV)*100].
indicate p<0.05, p<0.01 and p<0.001, respectively.
Fig. 3.
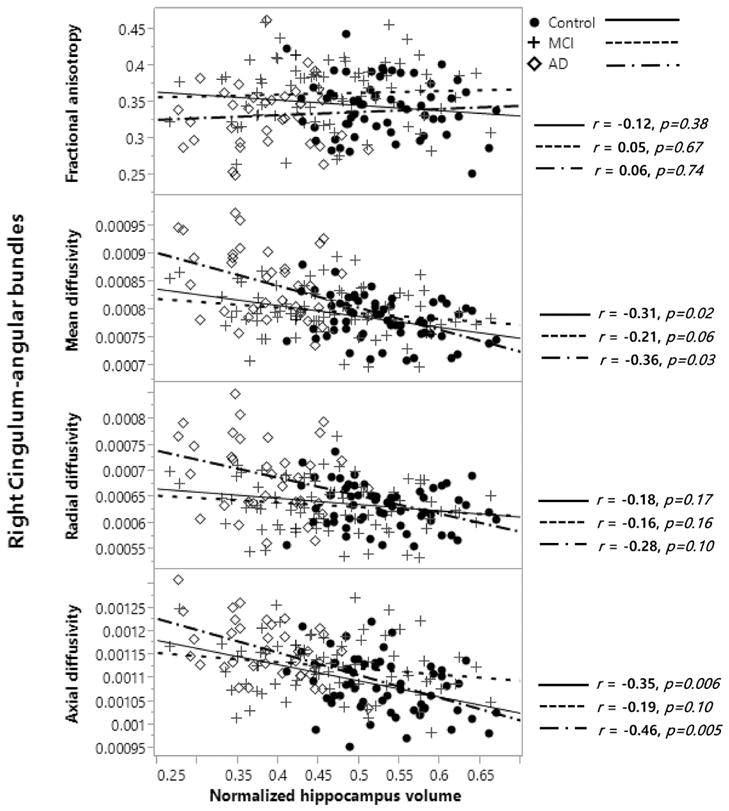
Example of the association between DTI parameters and normalized hippocampal volume [(sum of both hippocampi volume)/ICV*100] in the right cingulum-angular bundle in control, MCI, and AD participants, using the Pearson’s correlation test.
FA=fractional anisotropy; MD=mean diffusivity; DR=radial diffusivity; DA=axial diffusivity; normalized hippocampal volume = (sum of hippocampal volume)/ICV*100; MCI: mild cognitive impairment; AD: Alzheimer’s disease. “r” indicates the correlation coefficient.
4 Discussion
We demonstrate here relative degenerative changes in the cingulum-angular bundles of a large sample of individuals with MCI and AD from the ADNI database. We find that the cingulum-angular bundles of MCI and AD participants show deterioration in white matter integrity compared to controls mainly through increases in diffusivity values, while corticospinal tracts, superior and inferior longitudinal fasciculi, uncinate fasciculi, corpus callosum, and anterior thalamic radiations were relatively preserved, but still demonstrated (non-significant) increased diffusivity values in AD (except for the corticospinal tracts). This is suggestive of greater deterioration associated with AD cortical pathology given that the cingulum-angular bundle connects to the hippocampus, one of the structures most affected by AD. Furthermore, increases in diffusivities are associated with cell death and edema (Chenevert et al., 2000, Sotak, 2002), which are expected following neurodegeneration. To investigate this link further, we examined the associations between the integrity of each major fascicle and a traditional marker of AD pathology, hippocampal volume. This was significant for the cingulum-angular bundles, but also for several other fascicles, indicating that hippocampal volume and cortical AD pathology might still have an effect on white matter integrity more broadly, even if absolute group differences in DTI parameters were not statistically significant. Furthermore, we investigated whether there were group differences that are unexplained by hippocampal volume and age. We indeed still found significant group differences in DTI parameters of the left and right cingulum angular bundles, even when correcting for age, sex, education, hippocampal volume and motion measures. This suggests that the increases in diffusivity values (and changes in FA) in MCI and AD are not solely dependent on age and hippocampal neurodegeneration, and that there might be additional processes that could explain these remaining differences, such as co-existing vascular injuries in AD participants, or even possibly vascular injuries that are part of the AD pathogenesis itself, which were not investigated in this study.
Several prior studies have examined the influence of AD and MCI on white matter measured by DTI (Choi et al., 2005, Bucur et al., 2008, Madden et al., 2009, Salat et al., 2009, Stebbins and Murphy, 2009, Gold et al., 2010, Pievani et al., 2010, Salat et al., 2010, Smith et al., 2010, Douaud et al., 2011, Nir et al., 2012, Nir et al., 2013, Rowley et al., 2013, Lim et al., 2014, Sun et al., 2014). Our aim here was to apply a newly developed technique for reconstructing discrete large fascicles throughout the cerebral white matter in a large sample to determine the relative effects across these anatomical units which are known to have functional specificity. Overall, the fiber bundles demonstrating most significant alterations are known to support memory and these results confirm prior work using whole brain, region of interest, and more selective tractography (Acosta-Cabronero et al., 2010, Salat et al., 2010, Douaud et al., 2011, Liu et al., 2011, Hasan et al., 2012). However, it is also different from similar prior work (Pievani et al., 2010) using tractography in a smaller sample in that if finds a stronger effect to these systems (cingulum-angular bundles), instead of greater diffusivity values for all tracts in AD compared to controls. It has to be noted however that diffusivity values of most tracts generally increased with progression of the disease, despite not achieving significant group differences. We also observed a significant increase in the FA of the cingulum-angular bundles in MCI participants compared to controls and AD subjects (and non-significant increase in several other tracts), which is a behavior that has been observed before (Douaud et al., 2011). This behaviour is related to an increase in axial diffusivity in MCI compared to controls that is unmatched by an increase in radial diffusivity, generating a higher FA in MCI. An increase is then observed in radial diffusivity in AD and explains the lower FA observed in AD compared to MCI. This can be potentially attributed to the relative neurodegeneration of one fiber bundle while crossing fibers from another bundle are spared; however it is unclear whether the fibers of the cingulum-angular bundle undergo axonal changes in MCI or whether fibers crossing this bundle are undergoing radial changes such as demyelination that would appear as an increase of axial diffusivity. It is not surprising to see this behavior given several studies have shown that most of the white matter fiber bundles in the brain are crossing with other fibers (Wedeen et al., 2012, Jeurissen et al., 2013); however, at this time, the increase in diffusivity in MCI remains unclear and neuropathological and histological studies are needed to better inform this phenomenon and correctly understand it.
While there were generally no significant group differences in the association between tracts’ DTI metrics and hippocampal volume, controls had a negative correlation between tracts’ DTI metrics and hippocampal volume in most tracts for diffusivities. AD similarly had a negative correlation between tracts’ DTI metrics and hippocampal volume in most tracts, especially the forceps minor and the cingulum-angular bundles for both axial and mean diffusivity. A negative correlation between hippocampal volume and mean diffusivity of the cingulum-cingulate gyrus bundle and of the corticospinal tracts was also found in AD. This hints at a relationship in the controls that is largely driven by normal individual variation where individuals in good health will tend to have both a larger hippocampal volume and greater integrity of their white matter tracts, while in AD the relationship is more specific and related to the disease that affects hippocampal volume to a much larger extent than normal variation within the controls. This effect was more diffuse than the group differences observed. One limitation of this study is the exclusion of participants with excessive tissue damage including WM damage and/or ventricular enlargement, which biases this study towards finding less white matter damage and over-emphasizing the degree of selectivity of the results as the excluded individuals would have increased statistical power to detect more diffuse damage as observed previously in voxelwise and region-of-interest studies. Therefore, individuals with FreeSurfer cortical reconstructions and anatomical segmentations in need of manual correction were excluded for this study. Another limitation is that the remainder of the participants did not undergo any manual correction, though the FreeSurfer anatomical segmentation is known to be robust and highly correlated with manual segmentations (Cherbuin et al., 2009, Morey et al., 2009, Pardoe et al., 2009, Wenger et al., 2014).
The pathophysiologic link between white matter damage and cortical changes in AD is currently unclear. It is possible that these greatest WM changes observed are secondary to cortical deterioration and the overall loss of fibers following neurodegeneration. Alternatively, it is possible that some other cause generates both the white matter and cortical damage observed in AD, or that an independent influence on white matter damage is also present in addition to secondary events to neurodegeneration, such as vascular injuries co-existing or part of AD pathology. It is possible that therapeutic interventions specifically targeting processes related to white matter deterioration could at least slow the progression of disease and should therefore be considered.
Highlights.
Automated tractography tool TRACULA was used to measure the integrity of WM.
Deterioration of fibers is greatest in tracts known to be connected to areas of pathology in AD.
Individuals with MCI also had higher fractional anisotropy in the cingulum-angular bundles.
Lower WM integrity is more diffusely associated with lower hippocampal volume.
Acknowledgments
This study was funded by the National Institutes of Health grant R01NR010827, and was carried out at the Athinoula A. Martinos Center for Biomedical Imaging at the Massachusetts General Hospital, using resources provided by the National Institutes of Health grants R01NR010827, NS042861, NS058793 and by the Center for Functional Neuroimaging Technologies, P41RR14075, a P41 Regional Resource supported by the Biomedical Technology Program of the National Center for Research Resources (NCRR), National Institutes of Health. This work also involved the use of instrumentation supported by the NCRR Shared Instrumentation Grant Program and/or High-End Instrumentation Grant Program; specifically, grant numbers S10RR021110, S10RR023401, S10RR019307, S10RR019254 and S10RR023043. Seung-Hwan Lee was funded by Kangwon National University and Kangwon National University Hospital. Jean-Philippe Coutu was funded by the Fonds Québécois de la Recherche –Santé.
Data collection and sharing for this project was funded by the Alzheimer’s Disease Neuroimaging Initiative (ADNI) (National Institutes of Health Grant U01 AG024904) and DOD ADNI (Department of Defense award number W81XWH-12-2-0012). ADNI is funded by the National Institute on Aging, the National Institute of Biomedical Imaging and Bioengineering, and through generous contributions from the following: Alzheimer’s Association; Alzheimer’s Drug Discovery Foundation; Araclon Biotech; BioClinica, Inc.; Biogen Idec Inc.; Bristol-Myers Squibb Company; Eisai Inc.; Elan Pharmaceuticals, Inc.; Eli Lilly and Company; EuroImmun; F. Hoffmann-La Roche Ltd and its affiliated company Genentech, Inc.; Fujirebio; GE Healthcare; ; IXICO Ltd.; Janssen Alzheimer Immunotherapy Research & Development, LLC.; Johnson & Johnson Pharmaceutical Research & Development LLC.; Medpace, Inc.; Merck & Co., Inc.; Meso Scale Diagnostics, LLC.; NeuroRx Research; Neurotrack Technologies; Novartis Pharmaceuticals Corporation; Pfizer Inc.; Piramal Imaging; Servier; Synarc Inc.; and Takeda Pharmaceutical Company. The Canadian Institutes of Health Research is providing funds to support ADNI clinical sites in Canada. Private sector contributions are facilitated by the Foundation for the National Institutes of Health (www.fnih.org). The grantee organization is the Northern California Institute for Research and Education, and the study is coordinated by the Alzheimer’s Disease Cooperative Study at the University of California, San Diego. ADNI data are disseminated by the Laboratory for Neuro Imaging at the University of Southern California.
Abbreviations
- AD
Alzheimer’s disease
- ADNI
Alzheimer’s disease Neuroimaging Initiative
- CDR
Clinical Dementia Rating
- DA
axial diffusivity
- DR
radial diffusivity
- DTI
diffusion tensor imaging
- FA
fractional anisotropy
- ICV
intracranial volume
- MCI
mild cognitive impairment
- MD
mean diffusivity
- MMSE
Mini-Mental State Examination
- MRI
magnetic resonance imaging
- TRACULA
TRActs Constrained by UnderLying Anatomy
- WM
white matter
- WMSA
white matter signal abnormality
Footnotes
Data used in preparation of this article were obtained from the Alzheimer’s Disease Neuroimaging Initiative (ADNI) database (adni.loni.usc.edu). As such, the investigators within the ADNI contributed to the design and implementation of ADNI and/or provided data but did not participate in analysis or writing of this report. A complete listing of ADNI investigators can be found at: http://adni.loni.usc.edu/wp-content/uploads/how_to_apply/ADNI_Acknowledgement_List.pdf
Conflict of Interest
There was no conflict of interest
Contributors
All authors contributed to the manuscript. SL, JPC, PW, AY, HDR, DHS participated in the research preparation including conception and organization. SL, JPC, PW, DHS performed the experiments. SL, JPC, DHS performed the statistics. SL, JPC, DHS wrote the manuscript. AY, HDR performed review and critique. All authors have approved the final article.
Publisher's Disclaimer: This is a PDF file of an unedited manuscript that has been accepted for publication. As a service to our customers we are providing this early version of the manuscript. The manuscript will undergo copyediting, typesetting, and review of the resulting proof before it is published in its final citable form. Please note that during the production process errors may be discovered which could affect the content, and all legal disclaimers that apply to the journal pertain.
References
- Acosta-Cabronero J, Williams GB, Pengas G, Nestor PJ. Absolute diffusivities define the landscape of white matter degeneration in Alzheimer’s disease. Brain : a journal of neurology. 2010;133:529–539. doi: 10.1093/brain/awp257. [DOI] [PubMed] [Google Scholar]
- Basser PJ, Pajevic S, Pierpaoli C, Duda J, Aldroubi A. In vivo fiber tractography using DT-MRI data. Magnetic resonance in medicine : official journal of the Society of Magnetic Resonance in Medicine / Society of Magnetic Resonance in Medicine. 2000;44:625–632. doi: 10.1002/1522-2594(200010)44:4<625::aid-mrm17>3.0.co;2-o. [DOI] [PubMed] [Google Scholar]
- Beaulieu C. The basis of anisotropic water diffusion in the nervous system - a technical review. NMR in biomedicine. 2002;15:435–455. doi: 10.1002/nbm.782. [DOI] [PubMed] [Google Scholar]
- Behrens TE, Berg HJ, Jbabdi S, Rushworth MF, Woolrich MW. Probabilistic diffusion tractography with multiple fibre orientations: What can we gain? NeuroImage. 2007;34:144–155. doi: 10.1016/j.neuroimage.2006.09.018. [DOI] [PMC free article] [PubMed] [Google Scholar]
- Bernal-Rusiel JL, Greve DN, Reuter M, Fischl B, Sabuncu MR. Statistical analysis of longitudinal neuroimage data with Linear Mixed Effects models. NeuroImage. 2012;66C:249–260. doi: 10.1016/j.neuroimage.2012.10.065. [DOI] [PMC free article] [PubMed] [Google Scholar]
- Bernal-Rusiel JL, Reuter M, Greve DN, Fischl B, Sabuncu MR. Spatiotemporal linear mixed effects modeling for the mass-univariate analysis of longitudinal neuroimage data. NeuroImage. 2013;81:358–370. doi: 10.1016/j.neuroimage.2013.05.049. [DOI] [PMC free article] [PubMed] [Google Scholar]
- Bobinski M, de Leon MJ, Wegiel J, Desanti S, Convit A, Saint Louis LA, Rusinek H, Wisniewski HM. The histological validation of post mortem magnetic resonance imaging-determined hippocampal volume in Alzheimer’s disease. Neuroscience. 2000;95:721–725. doi: 10.1016/s0306-4522(99)00476-5. [DOI] [PubMed] [Google Scholar]
- Bouras C, Hof PR, Giannakopoulos P, Michel JP, Morrison JH. Regional distribution of neurofibrillary tangles and senile plaques in the cerebral cortex of elderly patients: a quantitative evaluation of a one-year autopsy population from a geriatric hospital. Cerebral cortex (New York, NY : 1991) 1994;4:138–150. doi: 10.1093/cercor/4.2.138. [DOI] [PubMed] [Google Scholar]
- Bozzali M, Falini A, Franceschi M, Cercignani M, Zuffi M, Scotti G, Comi G, Filippi M. White matter damage in Alzheimer’s disease assessed in vivo using diffusion tensor magnetic resonance imaging. Journal of neurology, neurosurgery, and psychiatry. 2002;72:742–746. doi: 10.1136/jnnp.72.6.742. [DOI] [PMC free article] [PubMed] [Google Scholar]
- Brun A, Englund E. A white matter disorder in dementia of the Alzheimer type: a pathoanatomical study. Annals of neurology. 1986;19:253–262. doi: 10.1002/ana.410190306. [DOI] [PubMed] [Google Scholar]
- Bucur B, Madden DJ, Spaniol J, Provenzale JM, Cabeza R, White LE, Huettel SA. Age-related slowing of memory retrieval: contributions of perceptual speed and cerebral white matter integrity. Neurobiology of aging. 2008;29:1070–1079. doi: 10.1016/j.neurobiolaging.2007.02.008. [DOI] [PMC free article] [PubMed] [Google Scholar]
- Chenevert TL, Stegman LD, Taylor JM, Robertson PL, Greenberg HS, Rehemtulla A, Ross BD. Diffusion magnetic resonance imaging: an early surrogate marker of therapeutic efficacy in brain tumors. Journal of the National Cancer Institute. 2000;92:2029–2036. doi: 10.1093/jnci/92.24.2029. [DOI] [PubMed] [Google Scholar]
- Cherbuin N, Anstey KJ, Reglade-Meslin C, Sachdev PS. In vivo hippocampal measurement and memory: a comparison of manual tracing and automated segmentation in a large community-based sample. PloS one. 2009;4:e5265. doi: 10.1371/journal.pone.0005265. [DOI] [PMC free article] [PubMed] [Google Scholar]
- Choi SJ, Lim KO, Monteiro I, Reisberg B. Diffusion tensor imaging of frontal white matter microstructure in early Alzheimer’s disease: a preliminary study. Journal of geriatric psychiatry and neurology. 2005;18:12–19. doi: 10.1177/0891988704271763. [DOI] [PubMed] [Google Scholar]
- Convit A, De Leon MJ, Tarshish C, De Santi S, Tsui W, Rusinek H, George A. Specific hippocampal volume reductions in individuals at risk for Alzheimer’s disease. Neurobiology of aging. 1997;18:131–138. doi: 10.1016/s0197-4580(97)00001-8. [DOI] [PubMed] [Google Scholar]
- Dale AM, Fischl B, Sereno MI. Cortical surface-based analysis. I. Segmentation and surface reconstruction. NeuroImage. 1999;9:179–194. doi: 10.1006/nimg.1998.0395. [DOI] [PubMed] [Google Scholar]
- Desikan RS, Segonne F, Fischl B, Quinn BT, Dickerson BC, Blacker D, Buckner RL, Dale AM, Maguire RP, Hyman BT, Albert MS, Killiany RJ. An automated labeling system for subdividing the human cerebral cortex on MRI scans into gyral based regions of interest. NeuroImage. 2006;31:968–980. doi: 10.1016/j.neuroimage.2006.01.021. [DOI] [PubMed] [Google Scholar]
- Destrieux C, Fischl B, Dale A, Halgren E. Automatic parcellation of human cortical gyri and sulci using standard anatomical nomenclature. NeuroImage. 2010;53:1–15. doi: 10.1016/j.neuroimage.2010.06.010. [DOI] [PMC free article] [PubMed] [Google Scholar]
- Douaud G, Jbabdi S, Behrens TE, Menke RA, Gass A, Monsch AU, Rao A, Whitcher B, Kindlmann G, Matthews PM, Smith S. DTI measures in crossing-fibre areas: increased diffusion anisotropy reveals early white matter alteration in MCI and mild Alzheimer’s disease. NeuroImage. 2011;55:880–890. doi: 10.1016/j.neuroimage.2010.12.008. [DOI] [PMC free article] [PubMed] [Google Scholar]
- Ferri CP, Prince M, Brayne C, Brodaty H, Fratiglioni L, Ganguli M, Hall K, Hasegawa K, Hendrie H, Huang Y, Jorm A, Mathers C, Menezes PR, Rimmer E, Scazufca M. Global prevalence of dementia: a Delphi consensus study. Lancet. 2005;366:2112–2117. doi: 10.1016/S0140-6736(05)67889-0. [DOI] [PMC free article] [PubMed] [Google Scholar]
- Fischl B, Liu A, Dale AM. Automated manifold surgery: constructing geometrically accurate and topologically correct models of the human cerebral cortex. IEEE transactions on medical imaging. 2001;20:70–80. doi: 10.1109/42.906426. [DOI] [PubMed] [Google Scholar]
- Fischl B, Rajendran N, Busa E, Augustinack J, Hinds O, Yeo BT, Mohlberg H, Amunts K, Zilles K. Cortical folding patterns and predicting cytoarchitecture. Cerebral cortex (New York, NY : 1991) 2008;18:1973–1980. doi: 10.1093/cercor/bhm225. [DOI] [PMC free article] [PubMed] [Google Scholar]
- Fischl B, Salat DH, Busa E, Albert M, Dieterich M, Haselgrove C, van der Kouwe A, Killiany R, Kennedy D, Klaveness S, Montillo A, Makris N, Rosen B, Dale AM. Whole brain segmentation: automated labeling of neuroanatomical structures in the human brain. Neuron. 2002;33:341–355. doi: 10.1016/s0896-6273(02)00569-x. [DOI] [PubMed] [Google Scholar]
- Fischl B, Salat DH, van der Kouwe AJ, Makris N, Segonne F, Quinn BT, Dale AM. Sequence-independent segmentation of magnetic resonance images. NeuroImage. 2004a;23(Suppl 1):S69–84. doi: 10.1016/j.neuroimage.2004.07.016. [DOI] [PubMed] [Google Scholar]
- Fischl B, Sereno MI, Dale AM. Cortical surface-based analysis. II: Inflation, flattening, and a surface-based coordinate system. NeuroImage. 1999;9:195–207. doi: 10.1006/nimg.1998.0396. [DOI] [PubMed] [Google Scholar]
- Fischl B, van der Kouwe A, Destrieux C, Halgren E, Segonne F, Salat DH, Busa E, Seidman LJ, Goldstein J, Kennedy D, Caviness V, Makris N, Rosen B, Dale AM. Automatically parcellating the human cerebral cortex. Cerebral cortex (New York, NY : 1991) 2004b;14:11–22. doi: 10.1093/cercor/bhg087. [DOI] [PubMed] [Google Scholar]
- Galasko D, Klauber MR, Hofstetter CR, Salmon DP, Lasker B, Thal LJ. The Mini-Mental State Examination in the early diagnosis of Alzheimer’s disease. Archives of neurology. 1990;47:49–52. doi: 10.1001/archneur.1990.00530010061020. [DOI] [PubMed] [Google Scholar]
- Gold BT, Powell DK, Xuan L, Jicha GA, Smith CD. Age-related slowing of task switching is associated with decreased integrity of frontoparietal white matter. Neurobiology of aging. 2010;31:512–522. doi: 10.1016/j.neurobiolaging.2008.04.005. [DOI] [PMC free article] [PubMed] [Google Scholar]
- Gouw AA, Seewann A, Vrenken H, van der Flier WM, Rozemuller JM, Barkhof F, Scheltens P, Geurts JJ. Heterogeneity of white matter hyperintensities in Alzheimer’s disease: post-mortem quantitative MRI and neuropathology. Brain : a journal of neurology. 2008;131:3286–3298. doi: 10.1093/brain/awn265. [DOI] [PubMed] [Google Scholar]
- Greve DN, Fischl B. Accurate and robust brain image alignment using boundary-based registration. NeuroImage. 2009;48:63–72. doi: 10.1016/j.neuroimage.2009.06.060. [DOI] [PMC free article] [PubMed] [Google Scholar]
- Han X, Fischl B. Atlas renormalization for improved brain MR image segmentation across scanner platforms. IEEE transactions on medical imaging. 2007;26:479–486. doi: 10.1109/TMI.2007.893282. [DOI] [PubMed] [Google Scholar]
- Hasan MK, Lee W, Park B, Han K. Bio-Inspired Computing and Applications. Springer; Berlin Heidelberg: 2012. Connectivity Analysis of Hippocampus in Alzheimer’s Brain Using Probabilistic Tractography; pp. 521–529. [Google Scholar]
- Hyman BT. The neuropathological diagnosis of Alzheimer’s disease: clinical-pathological studies. Neurobiology of aging. 1997;18:S27–32. doi: 10.1016/s0197-4580(97)00066-3. [DOI] [PubMed] [Google Scholar]
- Jack CR, Jr, Albert MS, Knopman DS, McKhann GM, Sperling RA, Carrillo MC, Thies B, Phelps CH. Introduction to the recommendations from the National Institute on Aging-Alzheimer’s Association workgroups on diagnostic guidelines for Alzheimer’s disease. Alzheimer’s & dementia : the journal of the Alzheimer’s Association. 2011;7:257–262. doi: 10.1016/j.jalz.2011.03.004. [DOI] [PMC free article] [PubMed] [Google Scholar]
- Jack CR, Jr, Bernstein MA, Fox NC, Thompson P, Alexander G, Harvey D, Borowski B, Britson PJ, JLW, Ward C, Dale AM, Felmlee JP, Gunter JL, Hill DL, Killiany R, Schuff N, Fox-Bosetti S, Lin C, Studholme C, DeCarli CS, Krueger G, Ward HA, Metzger GJ, Scott KT, Mallozzi R, Blezek D, Levy J, Debbins JP, Fleisher AS, Albert M, Green R, Bartzokis G, Glover G, Mugler J, Weiner MW. The Alzheimer’s Disease Neuroimaging Initiative (ADNI): MRI methods. Journal of magnetic resonance imaging : JMRI. 2008;27:685–691. doi: 10.1002/jmri.21049. [DOI] [PMC free article] [PubMed] [Google Scholar]
- Jeurissen B, Leemans A, Tournier JD, Jones DK, Sijbers J. Investigating the prevalence of complex fiber configurations in white matter tissue with diffusion magnetic resonance imaging. Human brain mapping. 2013;34:2747–2766. doi: 10.1002/hbm.22099. [DOI] [PMC free article] [PubMed] [Google Scholar]
- Langa KM, Chernew ME, Kabeto MU, Herzog AR, Ofstedal MB, Willis RJ, Wallace RB, Mucha LM, Straus WL, Fendrick AM. National estimates of the quantity and cost of informal caregiving for the elderly with dementia. Journal of general internal medicine. 2001;16:770–778. doi: 10.1111/j.1525-1497.2001.10123.x. [DOI] [PMC free article] [PubMed] [Google Scholar]
- Lim JS, Park YH, Jang JW, Park SY, Kim S. Differential white matter connectivity in early mild cognitive impairment according to CSF biomarkers. PloS one. 2014;9:e91400. doi: 10.1371/journal.pone.0091400. [DOI] [PMC free article] [PubMed] [Google Scholar]
- Liu Y, Spulber G, Lehtimaki KK, Kononen M, Hallikainen I, Grohn H, Kivipelto M, Hallikainen M, Vanninen R, Soininen H. Diffusion tensor imaging and tract-based spatial statistics in Alzheimer’s disease and mild cognitive impairment. Neurobiology of aging. 2011;32:1558–1571. doi: 10.1016/j.neurobiolaging.2009.10.006. [DOI] [PubMed] [Google Scholar]
- Madden DJ, Spaniol J, Costello MC, Bucur B, White LE, Cabeza R, Davis SW, Dennis NA, Provenzale JM, Huettel SA. Cerebral white matter integrity mediates adult age differences in cognitive performance. Journal of cognitive neuroscience. 2009;21:289–302. doi: 10.1162/jocn.2009.21047. [DOI] [PMC free article] [PubMed] [Google Scholar]
- McKhann G, Drachman D, Folstein M, Katzman R, Price D, Stadlan EM. Clinical diagnosis of Alzheimer’s disease: report of the NINCDS-ADRDA Work Group under the auspices of Department of Health and Human Services Task Force on Alzheimer’s Disease. Neurology. 1984;34:939–944. doi: 10.1212/wnl.34.7.939. [DOI] [PubMed] [Google Scholar]
- Morey RA, Petty CM, Xu Y, Hayes JP, Wagner HR, 2nd, Lewis DV, LaBar KS, Styner M, McCarthy G. A comparison of automated segmentation and manual tracing for quantifying hippocampal and amygdala volumes. NeuroImage. 2009;45:855–866. doi: 10.1016/j.neuroimage.2008.12.033. [DOI] [PMC free article] [PubMed] [Google Scholar]
- Moseley M. Diffusion tensor imaging and aging - a review. NMR in biomedicine. 2002;15:553–560. doi: 10.1002/nbm.785. [DOI] [PubMed] [Google Scholar]
- Nir T, Jahanshad N, Jack CR, Weiner MW, Toga AW, Thompson PM. Small world network measures predict white matter degeneration in patients with early-stage mild cognitive impairment. Proceedings / IEEE International Symposium on Biomedical Imaging: from nano to macro IEEE International Symposium on Biomedical Imaging; 2012. pp. 1405–1408. [DOI] [PMC free article] [PubMed] [Google Scholar]
- Nir TM, Jahanshad N, Villalon-Reina JE, Toga AW, Jack CR, Weiner MW, Thompson PM. Effectiveness of regional DTI measures in distinguishing Alzheimer’s disease, MCI, and normal aging. NeuroImage Clinical. 2013;3:180–195. doi: 10.1016/j.nicl.2013.07.006. [DOI] [PMC free article] [PubMed] [Google Scholar]
- Pardoe HR, Pell GS, Abbott DF, Jackson GD. Hippocampal volume assessment in temporal lobe epilepsy: How good is automated segmentation? Epilepsia. 2009;50:2586–2592. doi: 10.1111/j.1528-1167.2009.02243.x. [DOI] [PMC free article] [PubMed] [Google Scholar]
- Peters A. The effects of normal aging on myelin and nerve fibers: a review. Journal of neurocytology. 2002;31:581–593. doi: 10.1023/a:1025731309829. [DOI] [PubMed] [Google Scholar]
- Pievani M, Agosta F, Pagani E, Canu E, Sala S, Absinta M, Geroldi C, Ganzola R, Frisoni GB, Filippi M. Assessment of white matter tract damage in mild cognitive impairment and Alzheimer’s disease. Human brain mapping. 2010;31:1862–1875. doi: 10.1002/hbm.20978. [DOI] [PMC free article] [PubMed] [Google Scholar]
- Power JD, Barnes KA, Snyder AZ, Schlaggar BL, Petersen SE. Spurious but systematic correlations in functional connectivity MRI networks arise from subject motion. NeuroImage. 2012;59:2142–2154. doi: 10.1016/j.neuroimage.2011.10.018. [DOI] [PMC free article] [PubMed] [Google Scholar]
- Reuter M, Fischl B. Avoiding asymmetry-induced bias in longitudinal image processing. NeuroImage. 2011;57:19–21. doi: 10.1016/j.neuroimage.2011.02.076. [DOI] [PMC free article] [PubMed] [Google Scholar]
- Reuter M, Rosas HD, Fischl B. Highly accurate inverse consistent registration: a robust approach. NeuroImage. 2010;53:1181–1196. doi: 10.1016/j.neuroimage.2010.07.020. [DOI] [PMC free article] [PubMed] [Google Scholar]
- Reuter M, Schmansky NJ, Rosas HD, Fischl B. Within-subject template estimation for unbiased longitudinal image analysis. NeuroImage. 2012;61:1402–1418. doi: 10.1016/j.neuroimage.2012.02.084. [DOI] [PMC free article] [PubMed] [Google Scholar]
- Rice DP, Fox PJ, Max W, Webber PA, Lindeman DA, Hauck WW, Segura E. The economic burden of Alzheimer’s disease care. Health affairs (Project Hope) 1993;12:164–176. doi: 10.1377/hlthaff.12.2.164. [DOI] [PubMed] [Google Scholar]
- Rose SE, Chen F, Chalk JB, Zelaya FO, Strugnell WE, Benson M, Semple J, Doddrell DM. Loss of connectivity in Alzheimer’s disease: an evaluation of white matter tract integrity with colour coded MR diffusion tensor imaging. Journal of neurology, neurosurgery, and psychiatry. 2000;69:528–530. doi: 10.1136/jnnp.69.4.528. [DOI] [PMC free article] [PubMed] [Google Scholar]
- Rowley J, Fonov V, Wu O, Eskildsen SF, Schoemaker D, Wu L, Mohades S, Shin M, Sziklas V, Cheewakriengkrai L, Shmuel A, Dagher A, Gauthier S, Rosa-Neto P. White matter abnormalities and structural hippocampal disconnections in amnestic mild cognitive impairment and Alzheimer’s disease. PloS one. 2013;8:e74776. doi: 10.1371/journal.pone.0074776. [DOI] [PMC free article] [PubMed] [Google Scholar]
- Sabuncu MR, Bernal-Rusiel JL, Reuter M, Greve DN, Fischl B For the Alzheimer’s Disease Neuroimaging I. Event time analysis of longitudinal neuroimage data. Neuroimage. 2014;97C:9–18. doi: 10.1016/j.neuroimage.2014.04.015. [DOI] [PMC free article] [PubMed] [Google Scholar]
- Salat DH, Greve DN, Pacheco JL, Quinn BT, Helmer KG, Buckner RL, Fischl B. Regional white matter volume differences in nondemented aging and Alzheimer’s disease. NeuroImage. 2009;44:1247–1258. doi: 10.1016/j.neuroimage.2008.10.030. [DOI] [PMC free article] [PubMed] [Google Scholar]
- Salat DH, Kaye JA, Janowsky JS. Prefrontal gray and white matter volumes in healthy aging and Alzheimer disease. Archives of neurology. 1999a;56:338–344. doi: 10.1001/archneur.56.3.338. [DOI] [PubMed] [Google Scholar]
- Salat DH, Stangl PA, Kaye JA, Janowsky JS. Sex differences in prefrontal volume with aging and Alzheimer’s disease. Neurobiology of aging. 1999b;20:591–596. doi: 10.1016/s0197-4580(99)00067-6. [DOI] [PubMed] [Google Scholar]
- Salat DH, Tuch DS, van der Kouwe AJ, Greve DN, Pappu V, Lee SY, Hevelone ND, Zaleta AK, Growdon JH, Corkin S, Fischl B, Rosas HD. White matter pathology isolates the hippocampal formation in Alzheimer’s disease. Neurobiology of aging. 2010;31:244–256. doi: 10.1016/j.neurobiolaging.2008.03.013. [DOI] [PMC free article] [PubMed] [Google Scholar]
- Seab JP, Jagust WJ, Wong ST, Roos MS, Reed BR, Budinger TF. Quantitative NMR measurements of hippocampal atrophy in Alzheimer’s disease. Magnetic resonance in medicine : official journal of the Society of Magnetic Resonance in Medicine / Society of Magnetic Resonance in Medicine. 1988;8:200–208. doi: 10.1002/mrm.1910080210. [DOI] [PubMed] [Google Scholar]
- Segonne F, Dale AM, Busa E, Glessner M, Salat D, Hahn HK, Fischl B. A hybrid approach to the skull stripping problem in MRI. NeuroImage. 2004;22:1060–1075. doi: 10.1016/j.neuroimage.2004.03.032. [DOI] [PubMed] [Google Scholar]
- Segonne F, Grimson E, Fischl B. A genetic algorithm for the topology correction of cortical surfaces. Information processing in medical imaging : proceedings of the conference. 2005;19:393–405. doi: 10.1007/11505730_33. [DOI] [PubMed] [Google Scholar]
- Sjobeck M, Haglund M, Englund E. Decreasing myelin density reflected increasing white matter pathology in Alzheimer’s disease--a neuropathological study. International journal of geriatric psychiatry. 2005;20:919–926. doi: 10.1002/gps.1384. [DOI] [PubMed] [Google Scholar]
- Sjobeck M, Haglund M, Englund E. White matter mapping in Alzheimer’s disease: A neuropathological study. Neurobiology of aging. 2006;27:673–680. doi: 10.1016/j.neurobiolaging.2005.03.007. [DOI] [PubMed] [Google Scholar]
- Smith CD, Chebrolu H, Andersen AH, Powell DA, Lovell MA, Xiong S, Gold BT. White matter diffusion alterations in normal women at risk of Alzheimer’s disease. Neurobiology of aging. 2010;31:1122–1131. doi: 10.1016/j.neurobiolaging.2008.08.006. [DOI] [PMC free article] [PubMed] [Google Scholar]
- Song SK, Sun SW, Ju WK, Lin SJ, Cross AH, Neufeld AH. Diffusion tensor imaging detects and differentiates axon and myelin degeneration in mouse optic nerve after retinal ischemia. NeuroImage. 2003;20:1714–1722. doi: 10.1016/j.neuroimage.2003.07.005. [DOI] [PubMed] [Google Scholar]
- Song SK, Sun SW, Ramsbottom MJ, Chang C, Russell J, Cross AH. Dysmyelination revealed through MRI as increased radial (but unchanged axial) diffusion of water. NeuroImage. 2002;17:1429–1436. doi: 10.1006/nimg.2002.1267. [DOI] [PubMed] [Google Scholar]
- Sotak CH. The role of diffusion tensor imaging in the evaluation of ischemic brain injury - a review. NMR in biomedicine. 2002;15:561–569. doi: 10.1002/nbm.786. [DOI] [PubMed] [Google Scholar]
- Stebbins GT, Murphy CM. Diffusion tensor imaging in Alzheimer’s disease and mild cognitive impairment. Behavioural neurology. 2009;21:39–49. doi: 10.3233/BEN-2009-0234. [DOI] [PMC free article] [PubMed] [Google Scholar]
- Sun X, Salat D, Upchurch K, Deason R, Kowall N, Budson A. Destruction of White Matter Integrity in Patients With Mild Cognitive Impairment and Alzheimer Disease. Journal of investigative medicine : the official publication of the American Federation for Clinical Research. 2014 doi: 10.1097/JIM.0000000000000102. [DOI] [PMC free article] [PubMed] [Google Scholar]
- Talairach J, Tournoux P. Co-Planar Stereotaxic Atlas of the Human Brain. New York: Thieme Medical Publishers; 1988. [Google Scholar]
- Tiraboschi P, Hansen LA, Thal LJ, Corey-Bloom J. The importance of neuritic plaques and tangles to the development and evolution of AD. Neurology. 2004;62:1984–1989. doi: 10.1212/01.wnl.0000129697.01779.0a. [DOI] [PubMed] [Google Scholar]
- Wedeen VJ, Rosene DL, Wang R, Dai G, Mortazavi F, Hagmann P, Kaas JH, Tseng WY. The geometric structure of the brain fiber pathways. Science (New York, NY) 2012;335:1628–1634. doi: 10.1126/science.1215280. [DOI] [PMC free article] [PubMed] [Google Scholar]
- Wenger E, Martensson J, Noack H, Bodammer NC, Kuhn S, Schaefer S, Heinze HJ, Duzel E, Backman L, Lindenberger U, Lovden M. Comparing manual and automatic segmentation of hippocampal volumes: reliability and validity issues in younger and older brains. Human brain mapping. 2014;35:4236–4248. doi: 10.1002/hbm.22473. [DOI] [PMC free article] [PubMed] [Google Scholar]
- Werring DJ, Clark CA, Barker GJ, Thompson AJ, Miller DH. Diffusion tensor imaging of lesions and normal-appearing white matter in multiple sclerosis. Neurology. 1999;52:1626–1632. doi: 10.1212/wnl.52.8.1626. [DOI] [PubMed] [Google Scholar]
- Yendiki A, Koldewyn K, Kakunoori S, Kanwisher N, Fischl B. Spurious group differences due to head motion in a diffusion MRI study. NeuroImage. 2013;88C:79–90. doi: 10.1016/j.neuroimage.2013.11.027. [DOI] [PMC free article] [PubMed] [Google Scholar]
- Yendiki A, Panneck P, Srinivasan P, Stevens A, Zollei L, Augustinack J, Wang R, Salat D, Ehrlich S, Behrens T, Jbabdi S, Gollub R, Fischl B. Automated probabilistic reconstruction of white-matter pathways in health and disease using an atlas of the underlying anatomy. Frontiers in neuroinformatics. 2011;5:23. doi: 10.3389/fninf.2011.00023. [DOI] [PMC free article] [PubMed] [Google Scholar]
- Yeo BT, Sabuncu MR, Desikan R, Fischl B, Golland P. Effects of registration regularization and atlas sharpness on segmentation accuracy. Medical image analysis. 2008;12:603–615. doi: 10.1016/j.media.2008.06.005. [DOI] [PMC free article] [PubMed] [Google Scholar]
- Yoshita M, Fletcher E, Harvey D, Ortega M, Martinez O, Mungas DM, Reed BR, DeCarli CS. Extent and distribution of white matter hyperintensities in normal aging, MCI, and AD. Neurology. 2006;67:2192–2198. doi: 10.1212/01.wnl.0000249119.95747.1f. [DOI] [PMC free article] [PubMed] [Google Scholar]