

Abstract
Ribosomal proteins are encoded by a gene family, members of which are overexpressed in human cancers. Many of them have been found, using oligonucleotide microarray hybridization, to be differentially expressed in the faeces of patients with various stages of col-orectal cancer (CRC). The gene encoding ribosomal protein L19 (RPL19), a prognostic marker for human prostate cancer, is differentially expressed in CRC patients. Measurement of faecal RPL19 mRNA might improve prognostic prediction for CRC patients. Using quantitative real-time reverse transcription PCR, levels of RPL19 mRNA were detected in samples of colonic tissues from 44 CRC patients, in the faeces of 54 CRC patients and 15 controls, and in 11 colonic cell lines. Seven of 24 patients with late-stage CRC (Dukes' stages C and D) expressed over 2-fold more RPL19 in colonic tumour tissues than in corresponding normal tissues (P= 0.038). The mean faecal RPL19 mRNA levels of late-staged patients were higher than those of controls (P= 0.003) and early-staged patients (P= 0.008). Patients with both high serum levels of carcinoembryonic antigen (CEA; >5 ng/mL) and high-faecal RPL19 mRNA (≥0.0069) had higher risk (odds ratio, 8.0; P= 0.015) and lower overall 48-month survival (33.8 ± 13.7%, P= 0.013). Oligonucleotide microarray hybridization analysis of faecal molecules identified gene transcripts differentially present in faeces. In conclusion, faecal RPL19 expression is associated with advanced tumour stages and addictive to serum CEA in predicting prognosis of CRC patients.
Keywords: colorectal cancer, oligonucleotide microarray, ribosomal protein L19, overall 48-month survival, prognostic marker
Introduction
Cancer development and progression involve a complex process with multiple genetic changes [1]. Genome-wide approaches have accelerated the large-scale discovery of cancer-related molecules [2–4], including genes with altered expression, in a variety of malignant tumours [5, 6]. In colorectal cancer (CRC), a predominant gastrointestinal malignancy and multi-gene disease [7–9], clarification of the roles of oncogenes and other genes responsible for tumourigenesis is critical for the development of therapeutic strategies [10].
Ribosomal proteins (RPs) are a major component of the ribo-some, and are involved in the cellular process of translation [11]. Their activity is required for the growth and maintenance of all cell types [12]. Deregulation of the molecular mechanisms controlling cell growth can alter cell sizes, and may contribute to a variety of pathological conditions, including cancer [13]. Therefore, genes for RPs might be ‘cancer genes’ in humans, reflecting the potential importance of ribosomal function and translational control in tumour progression [14, 15]. Many studies have evaluated specific RPs in some gastrointestinal malignancies [16, 17]. Thus, the role of RPs in cancer prevention, prognosis prediction and therapy is becoming increasingly important.
Recent studies suggested that a molecular test of faecal material might elucidate the molecular pathogenesis of CRC [18–20]. In our previously faecal studies, we used advanced microarray technology to define global changes in gene expression detectable in faeces [21] and found many RPs were differentially expressed. Changes in the expression of a series of RPs were demonstrated in CRC patients [16, 22]. In addition, one of RPs, ribosomal protein L19 (RPL19), was up-regulated in human breast tumours [23]. Overexpression of this protein is also considered to be a valuable marker in prostate cancer diagnosis and patient management [24]. Accordingly, the expression of RPL19 in CRC and the effects of faecal RPL19 on the prognosis of CRC patients are very interesting issues.
In this study, we specifically quantified transcripts of RPL19 using quantitative real-time reverse transcription–PCR (qRT–PCR), and clarified its prognostic value in association with other clinicopatholog-ical parameters.
Materials and methods
Patients
One hundred and nine CRC patients divided into three groups for clinical sampling (Table 1) were enrolled at Cathay General Hospital and Taipei Veterans General Hospital, Taipei, Taiwan. Follow-up data were obtained prospectively. The initial tumour stages and serum levels of carcinoembry-onic antigen (CEA) of the patients were determined. The mean follow-up time of 54 patients whose faeces were analysed by quantitative RT-PCR was 26.9 months (SD, 17.3; median, 28.7). The study was approved by the Institutional Review Board of Cathay General Hospital as a research study.
Table 1.
Applications of clinical samples
| Analysis | Sample | Case number | Age range (years) |
|---|---|---|---|
| Microarray hybridization | Faeces | 11 | 33–84 |
| Quantitative real-time RT-PCR | Faeces | 54 | 41–90 |
| Tissues | 44 | 37–95 |
Total faecal RNA extraction and mRNA purification
Faecal samples from 54 patients (41–90 years old) and 15 healthy controls (30–70 years old) were obtained and preserved in specific preservation buffer until total RNA was purified as described in our previous report [25]. For the oligonucleotide microarray analysis, another 11 CRC patients (patients 01 to 11: two at Dukes' stage A, three at stage B, three at stage C, and three at stage D; 33–84 years old) and another five healthy controls (two men, 31 and 42 years old; three women, 33–38 years old) who were undergoing voluntary colonoscopic examination were sampled for 2–4 g of fresh faeces, from which total faecal RNA was purified. Normal pool 1 (NP01) was the pool of total faecal RNA from the two healthy men and normal pool 2 (NP02) was that from the three healthy women. Each 100 μg of quality-confirmed total faecal RNA from patients 01 to 11, NP01 and NP02 was then purified to mRNA using the Oligotex mRNA kit (Qiagen, Valencia, CA, USA), according to the manufacturer's protocol.
Total RNA extraction from colonic cell lines and tissue samples from CRC patients
Eleven colon cell lines (CCD-18Co, ATCC CRL-1459; CCD-112CoN, ATCC CRL-1541; DLD-1, ATCC CCL-221; SW480, ATCC CCL-228; HT-29, ATCC HTB-38; LoVo, ATCC CCL-229; Caco-2, ATCC HTB-37; HCT 116, ATCC CCL-247; COLO 205, ATCC CCL-222; SW 1116, ATCC CCL-233; and T84, ATCC CCL-248) [26–29] were purchased from either the American Type Culture Collection (ATCC, Manassas, VA, USA) or the Bioresource Collection and Research Center (BCRC, Hsinchu, Taiwan). The Dukes' stages of these colon cell lines were determined [21] or are described on the websites of the ATCC (http://www.atcc.org). All cultured cells were maintained in Dulbecco's modified Eagle's medium with 5 mM glutamine, with routine culture procedures. Tumour tissues and the corresponding normal tissues from the 44 CRC patients (37–95 years old) were immediately immersed in RNA later (Ambion, Austin, TX, USA) and stored according to the manufacturer's instructions. Total RNA was extracted from the tissues with TRIzol reagent (Invitrogen, Carlsbad, CA, USA), according to the manufacturer's instructions.
Oligonucleotide microarray hybridization and data extraction
The methods for synthesizing fluorescently labelled cRNA, microarray hybridizations, and data extraction were described in our previous report [21]. The quantified signal and background intensity for each transcript were substantially normalized using the rank-consistency-filtering LOWESS method [30]. Significant differences in the expression of faecal gene products between groups (healthy controls and patients at different Dukes' stages) were identified with Student's t-test (≥ twofold differences, P < 0.01). Statistical comparisons were made with the highest mean intensities [31]. Average-linkage hierarchical clustering of an uncentered Pearson correlation similarity matrix was applied with the program Cluster (version 2.11), and the results analysed. Figures were generated with the program TreeView (version 1.60) [32].
Detection of RPL19 expression levels in cell lines, tissues, and faecal samples
All cDNAs were generated as previously described [18, 21]. In cell lines, tissue or faecal samples, the relative levels of expressed RPL19 mRNA were quantified using qRT–PCR in the presence of a TaqMan probe and TaqMan Master Mix (Roche Diagnostics GmbH, Mannheim, Germany), according to the manufacturer's instructions. Amplification primers for RPL19 (X63527) were 5′–ATCCACAAGCTGAAGGCAGA–3′ (forward) and 5′–GCGTGCTTCCTTGGTCTTA–3′ (reverse), used with Universal Probe No.64 (Roche Diagnostics). The primers for 18s rRNA (X03205) were 5′–CTCAACACGGGAAACCTCAC–3′ (forward) and 5′–CGCTCCACCAAC-TAAGAACG–3′ (reverse), used with Universal Probe No.77 (Roche Diagnostics). LightCycler Software (version 4.05, Roche Diagnostics) was used to analyse the PCR kinetics and to calculate the quantitative data when performing qRT–PCR [33]. For each tissue or faecal sample, the expression level of RPL19 mRNA was normalized by dividing it by that for 18s rRNA. To acquire the relative RPL19 expression in CRC tissues, the ratio of RPL19 mRNA expression in the tumour and in the corresponding normal tissue was calculated.
Statistical analysis
Statistical analyses were performed to determine differences in the relative RPL19 mRNA level among the various clinical samples using the Mann-Whitney U test or the chi-square test. To clarify the clinical significance of the faecal RPL19 and serum markers combined into a diagnostic panel as the prognostic predictor, odds ratios (OR) and 95% confidence intervals (95% CI) were derived from binary logistic regression. Survival probabilities were estimated with the Kaplan–Meier method and compared using the log-rank test (P < 0.05). These analyses were performed with SPSS (SPSS, Chicago, IL, USA). A P-value < 0.05 was considered statistically significant.
Results
Differentially expressed RPs in the faeces of 11 CRC patients and five normal controls
Forty-six RPs and their related genes, including 11 large- and 14 small-ribosomal protein transcripts, and 21 mitochondrial forms, were differentially detected in faeces (fold change ≥2, P≥ 0.01). Average-linkage hierarchical clustering of these 46 RPs was performed based on the gene expression levels ascertained from microarray data to identify genes that are probably associated with similar clinical phenotypes. The 11 CRC patients and two distinct pools of normal participants were clustered into two groups (Fig. 1A). Group I was 80% late Dukes' stages (one Dukes' stage C and three stage D). Group II was composed of two pools of normal participants and 67% early Dukes' stages (two Dukes' stage A and two stage B). As compared to group II, group I contained 22 genes (region A) with elevated expression, including RPL19 (X63527) and RPS13 (D88010), and 24 genes (region B) with reduced expression, including RPS27L (BC047648), RPL26 (AB061829), and RPS3 (AB061838) (Fig. 1B).
Fig 1.
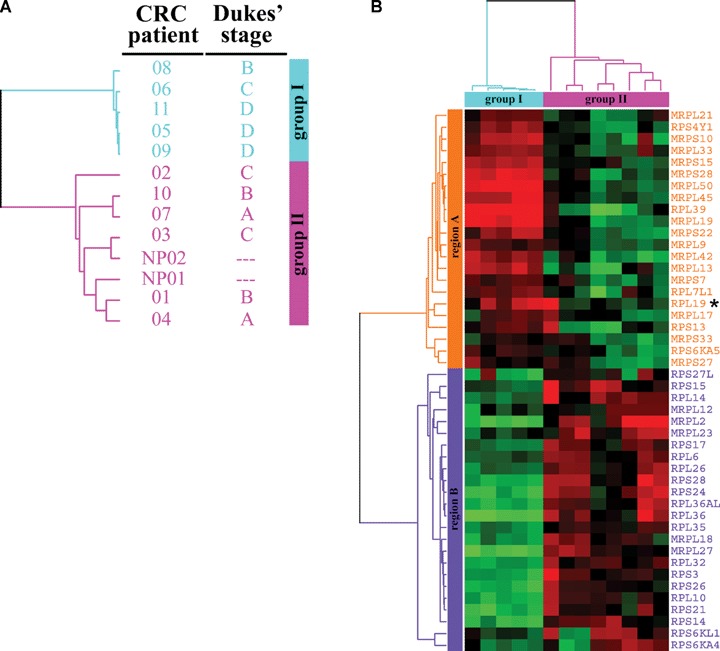
Differentially expressed RPs in the faeces of 11 CRC patients and five normal controls. Forty-six genes for RPs and their related transcripts were generated with statistically significant difference (fold change ≥2, P < 0.01) from pooling each comparison and grouped by average-linkage hierarchical clustering. Each row represents a gene and each column a sample. (A) A dendrogram depicting the groups of the cases. A group cluster depicts the cases with a similar pattern of gene expressions. Group I: five patients, one Dukes' stage B (patient 08), one stage C (patient 06) and three stage D (patients 11, 05 and 09). Group II: two normal control pools, NP01 and NP02; and six patients, two Dukes' stage A (patients 07 and 04), two stage B (patients 10 and 01), two stage C (patients 02 and 03). NP01, pooled by two healthy men; NP02, pooled by three healthy women. (B) The classification of 46 genes. A region cluster depicts the genes based on the similarity between their expressions in cases. High expression is shown in red, low expression in green. Region A (orange) contained 22 genes whose expressions were up in group I (light blue) and down in group II (pink). Region B (violet) contained 24 genes whose expressions were down in group I and up in group II. *RPL19 (X63527), the transcript for ribosomal protein L19.
Quantitation of RPL19 expression in colon cell lines and CRC tissues
The expressions of RPL19 from colon cell lines were quantified by real-time PCR with RPL19-specific primers. As shown in Fig. 2, the expression of RPL19 mRNA was elevated in the colon cell lines LoVo, Caco-2, HCT 116 and HT-29, which are classified as late-stage lines [21]. In normal cell lines (CCD-18Co and CCD-112CoN), the expression of RPL19was slightly lower than that in other CRC cell lines. To further validate the change in RPL19 expression in CRC patients, RPL19 expression was quantified in cancer tissues relative to that in the corresponding non-cancerous tissues of 44 variously staged patients (20 in the earlier stages, Dukes' stages A and B; 24 in the later stages, Dukes' stages C and D) (Table 2). The qRT–PCR results revealed that up-regulated RPL19 expression was differentially detected in cancer tissues from patients at late stages (seven of 24, P = 0.038, chi-square test) with statistical significance. In particular, one patient at Dukes' stage D displayed extremely elevated RPL19 expression in the colonic cancer tissue at 26.4-fold relative to that in the individual non-cancerous tissue.
Fig 2.
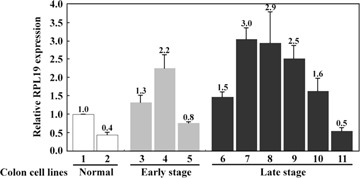
Relative cellular RPL19 expression levels from colon cell lines with quantitative real-time PCR. Quantitative real-time PCR was performed using LightCycler 2.0 from 11 colonic cell lines. The expression level of RPL19 mRNA was normalized by dividing it by that for 18s rRNA for each line. Bar 1, CCD-18Co; bar 2, CCD-112CoN; bar 3, SW 1116; bar 4, SW480; bar 5, HCT 116; bar 6, DLD-1; bar 7, LoVo; bar 8, Caco-2; bar 9, HT-29; bar 10, COLO 205; bar 11, T84.
Table 2.
Changes of RPL19 expression in colonic tumour tissues of 44 CRC patients
| Features | Value of T/N ≥ 2* | P-value** |
|---|---|---|
| Age (years)*** | ||
| <71 | 6/22 (27.3%) | 0.118 |
| ≥71 | 2/22 (9.1%) | |
| Gender | ||
| Male | 5/21 (23.8%) | 0.355 |
| Female | 3/23 (13.0%) | |
| Tumour location**** | ||
| Right | 3/13 (23.1%) | 0.508 |
| Left | 2/18 (11.1%) | |
| Rectum | 3/11 (27.3%) | |
| Dukes' stage | ||
| A+B | 1/20 (5.0%) | 0.038 |
| C+D | 7/24 (29.2%) | |
| CEA (ng/ml)**** | ||
| <5 | 3/20 (15.0%) | 0.571 |
| ≥5 | 5/23 (21.7%) | |
*Value of T/N ≥2, the expression ratio of RPL19 in colonic tumour tissue (T) and its corresponding normal tissue (N) is over 2.0; **P values of less than 0.05 were considered statistically significant by chi-square test; ***median age of 44 patients, 71 years; ****tumour location, 42 available and CEA, 43 available.
Significance of faecal RPL19 in CRC patients at various stages
The median relative faecal RPL19 expression value was 0.0029 in normal individuals (n = 15), 0.0052 in patients with early-stage CRC (n = 26) and 0.0102 in patients with late-stage CRC (n = 28). As shown in Fig. 3, late-staged patients had significantly higher median faecal RPL19 expression compared with that of normal individuals (P= 0.003, Mann-Whitney U test) or early-staged patients (P= 0.008, Mann-Whitney U test). To determine the cut-off value for faecal RPL19 expression for late-staged patients with CRC, the sensitivity and specificity were calculated. The cut-off value of 0.0069 (mean value of patients with early-stage CRC) resulted in 67.9% (95% CI, 59.1–76.7) sensitivity and 69.2% (95% CI, 60.1–78.3) specificity. Specifically, more late-staged patients (70.4%versus 33.3%, P= 0.006, chi-square test) were found in the RPL19+ group (≥0.0069) than in the RPL19– group (<0.0069).
Fig 3.
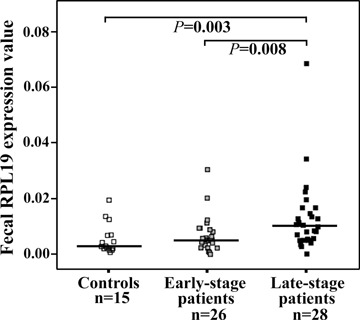
Relative faecal RPL19 expression levels from different populations with quantitative real-time PCR. Quantitative real-time PCR was performed using LightCycler 2.0 from healthy individuals (n= 15), patients with early-stage colorectal cancer (CRC) (Dukes' stages A and B; n= 26), and patients with late-stage CRC (Dukes' stages C and D; n= 28). The expression level of RPL19 mRNA was normalized by dividing it by that for 18s rRNA for each faecal sample. A significant difference (P < 0.05) determined by Mann-Whitney U test is directly indicated as P value. The horizontal lines represent the median values.
Significance of faecal RPL19 in combination with serum CEA in CRC patients
Patients with CEA− and RPL19− (n= 18) showed the highest overall 48-month survival (70.6 ± 17.0%). Moreover, in the 27 patients of higher faecal RPL19 expressions, 14 patients with CEA−/RPL19+ demonstrated significantly higher overall 48-month survival (44.4±21.1%) than patients with CEA+ and RPL19+ (n= 13) (33.8 ± 13.7%, P= 0.013, log-rank test) (Fig. 4). These 13 patients with CEA+/RPL19+ also had poor prognosis (OR, 8.0; 95% CI, 1.5–42.5, P= 0.015) than patients who were only considered serum CEA+ (n= 21; OR, 3.8; 95% CI, 1.1–12.5, P= 0.030) or faecal RPL19+ (n= 26; OR, 2.8; 95% CI, 0.9–9.1, P = 0.088).
Fig 4.
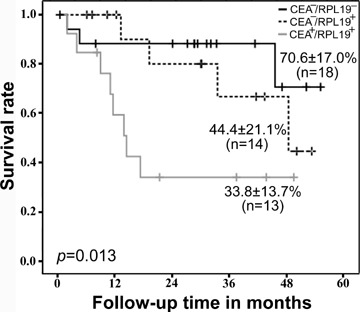
Kaplan–Meier survival curves of CRC patients based on the levels of serum CEA and relative faecal RPL19 expression. Patients with low-serum CEA and low-faecal RPL19 expression (CEA−/RPL19−): n= 18; overall 48-month survival: 70.6 ± 17.0%. Patients with low serum CEA and high-faecal RPL19 expression (CEA−/RPL19+): n= 14; overall 48-month survival: 44.4 ± 21.1%. Patients with high-serum CEA and high-faecal RPL19 expression (CEA+/RPL19+): n= 13; overall 48-month survival: 33.8 ± 13.7%. RPL19−, relative faecal RPL19 expression value <0.0069 (mean value of 26 patients with early-stage CRC); RPL19+, relative faecal RPL19 expression value ≥ 0.0069. The P-value was determined using the log rank test.
Discussion
CRC is one of the commonest causes of cancer death among men of 40–79 years and older [34]. This risk rises sharply at the age of 50–55 years [35]. However, the survival of patients with CRC is closely related to its early detection [36] and the mortality rate would decrease with access to regular high-quality screening [34]. Therefore, the identification of candidate markers for CRC has become an importantly preventative strategy.
Since CRC is a molecular genetic disease, the recognition of cancer genes and the direct quantification of their expression in colonic cells will be a key to the development of successful therapies and the earlier detection of CRC [10, 37]. Recent studies suggested that the molecular analysis of faecal material elucidates the molecular pathogenesis of CRC [19, 38].
Further, the fact that exfoliated colonic cells in faeces can be isolated and cultured implies the clinical utility of faeces in non-invasive CRC screening with molecular approaches [39, 40]. These cells provide a diverse class of candidate faecal markers to distinguish colorectal neoplasia from normal [41]. Faecal analysis showed that the expression of many genes is altered in CRC patients at different Dukes' stages [37, 42, 43]. Therefore, the direct evaluation of exfoliated colonocytes should demonstrate the potential of faeces as a useful platform for CRC-associated bio-markers on target cells [37, 44].
Assuming free RNA can be predictably recovered from faeces and stabilized during faecal storage, then this approach would have the merits of simplicity and potentially high-diagnostic discrimination [41], as reviewed by Osborn and Ahlquist. Accordingly, we previously reported that the presence of faecal RNA molecules is significantly associated with clinical CRC characteristics [18, 25]. In our studies, we used advanced microarray technology to define global changes in gene expression in faeces [21]. Vogelstein et al. reported that CRC progression is driven by the accumulation of genetic changes and consequent changes in gene expression patterns [9]. Therefore, genes identified as having altered expression patterns in the faecal colonic cells provide non-invasive targets for early diagnosis, CRC treatment strategies and prognostic indicators.
In this study, we identified a series of RPs with altered expression in the faeces of CRC patients using oligonucleotide microar-ray hybridization. Recently, many RP genes have been shown to be cancer genes in zebrafish [14]. An increasing number of RPs have been studied as cancer-related molecules by others. These studies have included examinations of the role of RPS3 in the onset of cancer [45], the promotion by RPS13 or RPL23 of multi-drug resistance in gastric cancer [17] and the contribution of RPL36 to the multi-factorial mechanisms of cisplatin resistance [46]. The genes for RPS7, RPL23, RPL11, RPL5, RPL26 and RPS27L were also shown to be p53-related molecules [47, 48].
Reports of RPL19 were few until Bee et al. recently demonstrated its overexpression in patients with malignant prostate cancer, and showed its association with shorter patient survival [24]. RPL19 is also co-expressed with ErbB-2 in breast cancer [23, 49]. Here, we report for the first time that RPL19 is differentially expressed in CRC patients and this aberrant expression of RPL19 can be detected easily in faeces by qRT–PCR with a TaqMan probe. We found that the up-regulated RPL19 expression in CRC tissues of late-stage patients can be identified in the faeces of patients at the same stages. Furthermore, together with levels of serum CEA, the prognosis of CRC patients was markedly worse when these two molecules were simultaneously over the cut-off values. It highlights the serum CEA when considered with faecal RPL19. Our results are similar to those reported for the same molecule in prostate cancer and for RPS6 in chondrosarcomas [24, 50]. Forty-six percent (21 of 46) of our differentially expressed RPs were mitochondrial forms. Mitochondrial RPL41 (MRPL41, not one of our faecal candidate gene products) was recently found to regulate the cell cycle under growth inhibitory conditions [51]. The clinical significance of most mitochondrial RPs warrants investigation.
Gene expression profiling analysis using microarray technology has been widely applied to the classification of cancers at the molecular level [52]. qRT–PCR is often used to confirm the findings of microarray analyses [53]. We first used these two advanced approaches to characterize molecules detectable in faeces. It has been suggested that faecal RPL19 contributes to the prognosis of CRC. Therefore, the presence of tumour cells in the stool is increasingly regarded as a clinically relevant prognostic factor. In conclusion, the differential expression of faecal molecules can be directly quantified by qRT–PCR. The expression of faecal RPL19 is associated with advanced tumour stage and addictive to serum CEA in predicting prognosis of CRC patients.
Acknowledgments
This study was supported by grants from the National Science Council, Taiwan (NSC94-2320-B-281-001) and the Cathay General Hospital and Taipei Medical University (95CGH-TMU-13).
References
- 1.Sugimura T, Terada M, Yokota J, Hirohashi S, Wakabayashi K. Multiple genetic alterations in human carcinogenesis. Environ Health Perspect. 1992;98:5–12. doi: 10.1289/ehp.92985. [DOI] [PMC free article] [PubMed] [Google Scholar]
- 2.Baak JP, Path FR, Hermsen MA, Meijer G, Schmidt J, Janssen EA. Genomics and proteomics in cancer. Eur J Cancer. 2003;39:1199–215. doi: 10.1016/s0959-8049(03)00265-x. [DOI] [PubMed] [Google Scholar]
- 3.Chin KV, Alabanza L, Fujii K, Kudoh K, Kita T, Kikuchi Y, Selvanayagam ZE, Wong YF, Lin Y, Shih WC. Application of expression genomics for predicting treatment response in cancer. Ann N Y Acad Sci. 2005;1058:186–95. doi: 10.1196/annals.1359.025. [DOI] [PubMed] [Google Scholar]
- 4.Cowell JK, Hawthorn L. The application of microarray technology to the analysis of the cancer genome. Curr Mol Med. 2007;7:103–20. doi: 10.2174/156652407779940387. [DOI] [PubMed] [Google Scholar]
- 5.Fenech M. Biomarkers of genetic damage for cancer epidemiology. Toxicology. 2002;181-182:411–6. doi: 10.1016/s0300-483x(02)00480-8. [DOI] [PubMed] [Google Scholar]
- 6.Jones PA. DNA methylation and cancer. Oncogene. 2002;21:5358–60. doi: 10.1038/sj.onc.1205597. [DOI] [PubMed] [Google Scholar]
- 7.Bardelli A, Velculescu VE. Mutational analysis of gene families in human cancer. Curr Opin Genet Dev. 2005;15:5–12. doi: 10.1016/j.gde.2004.12.009. [DOI] [PubMed] [Google Scholar]
- 8.Rozen P. Cancer of the gastrointestinal tract: early detection or early prevention? Eur J Cancer Prev. 2004;13:71–5. doi: 10.1097/00008469-200402000-00011. [DOI] [PubMed] [Google Scholar]
- 9.Vogelstein B, Fearon ER, Hamilton SR. Genetic alterations during colorectal-tumor development. N Engl J Med. 1988;319:525–32. doi: 10.1056/NEJM198809013190901. [DOI] [PubMed] [Google Scholar]
- 10.Allegra C, Sargent D. Molecular diagnostics: assays, tissues, progress, and pitfalls. J Clin Oncol. 2003;21:395–6. doi: 10.1200/JCO.2003.11.073. [DOI] [PubMed] [Google Scholar]
- 11.Ramakrishnan V, Moore PB. Atomic structures at last: the ribosome in 2000. Curr Opin Struct Biol. 2001;11:144–54. doi: 10.1016/s0959-440x(00)00184-6. [DOI] [PubMed] [Google Scholar]
- 12.Wool IG. The structure and function of eukaryotic ribosomes. Annu Rev Biochem. 1979;48:719–54. doi: 10.1146/annurev.bi.48.070179.003443. [DOI] [PubMed] [Google Scholar]
- 13.Holland EC, Sonenberg N, Pandolfi PP, Thomas G. Signaling control of mRNA translation in cancer pathogenesis. Oncogene. 2004;23:3138–44. doi: 10.1038/sj.onc.1207590. [DOI] [PubMed] [Google Scholar]
- 14.Amsterdam A, Sadler KC, Lai K, Farrington S, Bronson RT, Lees JA, Hopkins N. Many ribosomal protein genes are cancer genes in zebrafish. PLoS Biol. 2004;2:E139. doi: 10.1371/journal.pbio.0020139. [DOI] [PMC free article] [PubMed] [Google Scholar]
- 15.Clemens MJ. Targets and mechanisms for the regulation of translation in malignant transformation. Oncogene. 2004;23:3180–8. doi: 10.1038/sj.onc.1207544. [DOI] [PubMed] [Google Scholar]
- 16.Kobayashi T, Sasaki Y, Oshima Y, Yamamoto H, Mita H, Suzuki H, Toyota M, Tokino T, Itoh F, Imai K, Shinomura Y. Activation of the ribosomal protein L13 gene in human gastrointestinal cancer. Int J Mol Med. 2006;18:161–70. [PubMed] [Google Scholar]
- 17.Shi Y, Zhai H, Wang X, Han Z, Liu C, Lan M, Du J, Guo C, Zhang Y, Wu K, Fan D. Ribosomal proteins S13 and L23 promote multidrug resistance in gastric cancer cells by suppressing drug-induced apoptosis. Exp Cell Res. 2004;296:337–46. doi: 10.1016/j.yexcr.2004.02.009. [DOI] [PubMed] [Google Scholar]
- 18.Chien CC, Chen SH, Liu CC, Lee CL, Yang RN, Yang SH, Huang CJ. Correlation of K-ras codon 12 mutations in human feces and ages of patients with colorectal cancer (CRC) Transl Res. 2007;149:96–102. doi: 10.1016/j.trsl.2006.09.006. [DOI] [PubMed] [Google Scholar]
- 19.Davies RJ, Miller R, Coleman N. Colorectal cancer screening: prospects for molecular stool analysis. Nat Rev Cancer. 2005;5:199–209. doi: 10.1038/nrc1569. [DOI] [PubMed] [Google Scholar]
- 20.Haug U, Brenner H. A simulation model for colorectal cancer screening: potential of stool tests with various performance characteristics compared with screening colonoscopy. Cancer Epidemiol Biomarkers Prev. 2005;14:422–8. doi: 10.1158/1055-9965.EPI-04-0411. [DOI] [PubMed] [Google Scholar]
- 21.Chien CC, Chang CC, Yang SH, Chen SH, Huang CJ. A homologue of the Drosophila headcase protein, HECA, is a novel tumor marker for early-stage colorectal cancer. Oncol Rep. 2006;15:919–26. [PubMed] [Google Scholar]
- 22.Kasai H, Nadano D, Hidaka E, Higuchi K, Kawakubo M, Sato TA, Nakayama J. Differential expression of ribosomal proteins in human normal and neoplastic col-orectum. J Histochem Cytochem. 2003;51:567–74. doi: 10.1177/002215540305100502. [DOI] [PubMed] [Google Scholar]
- 23.Dressman MA, Baras A, Malinowski R, Alvis LB, Kwon I, Walz TM, Polymeropoulos MH. Gene expression profiling detects gene amplification and differentiates tumor types in breast cancer. Cancer Res. 2003;63:2194–9. [PubMed] [Google Scholar]
- 24.Bee A, Ke Y, Forootan S, Lin K, Beesley C, Forrest SE, Foster CS. Ribosomal protein 119 is a prognostic marker for human prostate cancer. Clin Cancer Res. 2006;12:2061–5. doi: 10.1158/1078-0432.CCR-05-2445. [DOI] [PubMed] [Google Scholar]
- 25.Yang SH, Chien CC, Chen CW, Li SY, Huang CJ. Potential of faecal RNA in diagnosing colorectal cancer. Cancer Lett. 2005;226:55–63. doi: 10.1016/j.canlet.2004.11.005. [DOI] [PubMed] [Google Scholar]
- 26.Balavenkatraman KK, Jandt E, Friedrich K, Kautenburger T, Pool-Zobel BL, Ostman A, Böhmer FD. DEP-1 protein tyrosine phosphatase inhibits proliferation and migration of colon carcinoma cells and is upregulated by protective nutrients. Oncogene. 2006;25:6319–24. doi: 10.1038/sj.onc.1209647. [DOI] [PubMed] [Google Scholar]
- 27.Campbell SE, Stone WL, Lee S, Whaley S, Yang H, Qui M, Goforth P, Sherman D, McHaffie D, Krishnan K. Comparative effects of RRR-alpha- and RRR-gamma-tocopherol on proliferation and apoptosis in human colon cancer cell lines. BMC Cancer. 2006;6:13. doi: 10.1186/1471-2407-6-13. [DOI] [PMC free article] [PubMed] [Google Scholar]
- 28.Kondoh N, Schweinfest CW, Henderson KW, Papas TS. Differential expression of S19 ribosomal protein, laminin-binding protein, and human lymphocyte antigen class I messenger RNAs associated with colon carcinoma progression and differentiation. Cancer Res. 1992;52:791–6. [PubMed] [Google Scholar]
- 29.Shoji Y, Takahashi M, Kitamura T, Watanabe K, Kawamori T, Maruyama T, Sugimoto Y, Negishi M, Narumiya S, Sugimura T, Wakabayashi K. Downregulation of prostaglandin E receptor subtype EP3 during colon cancer development. Gut. 2004;53:1151–8. doi: 10.1136/gut.2003.028787. [DOI] [PMC free article] [PubMed] [Google Scholar]
- 30.Charbonnier Y, Gettler B, Francois P, Bento M, Renzoni A, Vaudaux P, Schlegel W, Schrenzel J. A generic approach for the design of whole-genome oligoarrays, validated for genomotyping, deletion mapping and gene expression analysis on Staphylococcus aureus. BMC Genomics. 2005;6:95–106. doi: 10.1186/1471-2164-6-95. [DOI] [PMC free article] [PubMed] [Google Scholar]
- 31.Tusher VG, Tibshirani R, Chu G. Significance analysis of microarrays applied to the ionizing radiation response. Proc Natl Acad Sci USA. 2001;98:5116–21. doi: 10.1073/pnas.091062498. [DOI] [PMC free article] [PubMed] [Google Scholar]
- 32.Selaru FM, Zou T, Xu Y, Shustova V, Yin J, Mori Y, Sato F, Wang S, Olaru A, Shibata D, Greenwald BD, Krasna MJ, Abraham JM, Meltzer SJ. Global gene expression profiling in Barrett's esophagus and esophageal cancer: a comparative analysis using cDNA microarrays. Oncogene. 2002;21:475–8. doi: 10.1038/sj.onc.1205111. [DOI] [PubMed] [Google Scholar]
- 33.Pfaffl MW. A new mathematical model for relative quantification in real-time RT-PCR. Nucleic Acids Res. 2001;29:e45. doi: 10.1093/nar/29.9.e45. [DOI] [PMC free article] [PubMed] [Google Scholar]
- 34.Jemal A, Siegel R, Ward E, Murray T, Xu J, Smigal C, Thun MJ. Cancer statistics, 2006. CA Cancer J Clin. 2006;56:106–30. doi: 10.3322/canjclin.56.2.106. [DOI] [PubMed] [Google Scholar]
- 35.Srivastava S, Verma M, Henson DE. Biomarkers for early detection of colon cancer. Clin Cancer Res. 2001;7:1118–26. [PubMed] [Google Scholar]
- 36.Eschrich S, Yang I, Bloom G, Kwong KY, Boulware D, Cantor A, Coppola D, Kruhoffer M, Aaltonen L, Orntoft TF, Quackenbush J, Yeatman TJ. Molecular staging for survival prediction of colorectal cancer patients. J Clin Oncol. 2005;23:3526–35. doi: 10.1200/JCO.2005.00.695. [DOI] [PubMed] [Google Scholar]
- 37.Lagerholm S, Lagerholm S, Dutta S, Nair P. Non-invasive detection of c-myc p64, c-myc p67 and c-erbb-2 in colorectal cancer. Scand J Gastroenterol. 2005;40:1343–50. doi: 10.1080/00365520510023549. [DOI] [PubMed] [Google Scholar]
- 38.Haug U, Wente MN, Seiler CM, Rothenbacher D, Buchler MW, Brenner H. Tumor M2 pyruvate kinase as a stool marker for colorectal cancer: stability at room temperature and implications for application in the screening setting. Clin Chem. 2006;52:782–4. doi: 10.1373/clinchem.2005.062752. [DOI] [PubMed] [Google Scholar]
- 39.Kamra A, Kessie G, Chen JH, Kalavapudi S, Shores R, McElroy I, Gireesh T, Sudhakaran PR, Dutta SK, Nair PP. Exfoliated colonic epithelial cells: surrogate targets for evaluation of bioactive food components in cancer prevention. J Nutr. 2005;135:2719–22. doi: 10.1093/jn/135.11.2719. [DOI] [PubMed] [Google Scholar]
- 40.Loktionov A. Cell exfoliation in the human colon: Myth, reality and implications for colorectal cancer screening. Int J Cancer. 2007;120:2281–9. doi: 10.1002/ijc.22647. [DOI] [PubMed] [Google Scholar]
- 41.Osborn NK, Ahlquist DA. Stool screening for colorectal cancer: molecular approaches. Gastroenterology. 2005;128:192–206. doi: 10.1053/j.gastro.2004.10.041. [DOI] [PubMed] [Google Scholar]
- 42.Kanaoka S, Yoshida K, Miura N, Sugimura H, Kajimura M. Potential usefulness of detecting cyclooxygenase 2 messenger RNA in feces for colorectal cancer screening. Gastroenterology. 2004;127:422–7. doi: 10.1053/j.gastro.2004.05.022. [DOI] [PubMed] [Google Scholar]
- 43.Kawada M, Mizuno M, Nasu J, Uesu T, Okazaki H, Okada H, Shimomura H, Yamamoto K, Tsuji T, Fujita T, Shiratori Y. Release of decay-accelerating factor into stools of patients with colorectal cancer by means of cleavage at the site of gly-cosylphosphatidylinositol anchor. J Lab Clin Med. 2003;142:306–12. doi: 10.1016/S0022-2143(03)00137-9. [DOI] [PubMed] [Google Scholar]
- 44.Alexander RJ, Raicht RF. Purification of total RNA from human stool samples. Dig Dis Sci. 1998;43:2652–8. doi: 10.1023/a:1026699126899. [DOI] [PubMed] [Google Scholar]
- 45.Hegde V, Yadavilli S, Deutsch WA. Knockdown of ribosomal protein S3 pro-tects human cells from genotoxic stress. DNA Repair. 2007;6:94–9. doi: 10.1016/j.dnarep.2006.09.004. [DOI] [PubMed] [Google Scholar]
- 46.Shen DW, Liang XJ, Suzuki T, Gottesman MM. Identification by functional cloning from a retroviral cDNA library of cDNAs for ribosomal protein L36 and the 10-kDa heat shock protein that confer cisplatin resistance. Mol Pharmacol. 2006;69:1383–8. doi: 10.1124/mol.105.017525. [DOI] [PMC free article] [PubMed] [Google Scholar]
- 47.Chen D, Zhang Z, Li M, Wang W, Li Y, Rayburn E, Hill DL, Wang H, Zhang R. Ribosomal protein S7 as a novel modulator of p53-MDM2 interaction: binding to MDM2, stabilization of p53 protein, and activation of p53 function. Oncogene. 2007;26:5029–37. doi: 10.1038/sj.onc.1210327. [DOI] [PubMed] [Google Scholar]
- 48.Takagi M, Absalon MJ, McLure KG, Kastan MB. Regulation of p53 translation and induction after DNA damage by ribo-somal protein L26 and nucleolin. Cell. 2005;123:49–63. doi: 10.1016/j.cell.2005.07.034. [DOI] [PubMed] [Google Scholar]
- 49.Leirdal M, Shadidy M, Rosok O, Sioud M. Identification of genes differentially expressed in breast cancer cell line SKBR3: potential identification of new prognostic bio-markers. Int J Mol Med. 2004;14:217–22. [PubMed] [Google Scholar]
- 50.Rozeman LB, Szuhai K, Schrage YM, Rosenberg C, Tanke HJ, Taminiau AH, Cleton-Jansen AM, Bovee JV, Hogendoorn PC. Array-comparative genomic hybridization of central chon-drosarcoma: identification of ribosomal protein S6 and cyclin-dependent kinase 4 as candidate target genes for genomic aberrations. Cancer. 2006;107:380–8. doi: 10.1002/cncr.22001. [DOI] [PubMed] [Google Scholar]
- 51.Kim MJ, Yoo YA, Kim HJ, Kang S, Kim YG, Kim JS, Yoo YD. Mitochondrial ribo-somal protein L41 mediates serum starvation-induced cell-cycle arrest through an increase of p21(WAF1/CIP1) Biochem Biophys Res Commun. 2005;338:1179–84. doi: 10.1016/j.bbrc.2005.10.064. [DOI] [PubMed] [Google Scholar]
- 52.Aburatani H. Discovery of a new bio-marker for gastroenterological cancers. J Gastroenterol. 2005;40:1–6. doi: 10.1007/BF02990571. [DOI] [PubMed] [Google Scholar]
- 53.Qin LX, Beyer RP, Hudson FN, Linford NJ, Morris DE, Kerr KF. Evaluation of methods for oligonucleotide array data via quantitative real-time PCR. BMC Bioinformatics. 2006;7:23. doi: 10.1186/1471-2105-7-23. [DOI] [PMC free article] [PubMed] [Google Scholar]