Summary
Lipid mediators influence immunity in myriad ways. For example, circulating sphingosine 1-phosphate (S1P) is a key regulator of lymphocyte egress1,2. Although the majority of plasma S1P is bound to apolipoprotein M (ApoM) in the high-density lipoprotein (HDL) particle3, immunological functions of the ApoM-S1P complex are unknown. Here, we show that ApoM-S1P is dispensable for lymphocyte trafficking yet restrains lymphopoiesis by activating the S1P1 receptor on bone marrow (BM) lymphocyte progenitors. Mice that lacked ApoM (Apom−/−) had increased proliferation of Lin−Sca1+cKit+ hematopoietic progenitor cells (LSK) and common lymphoid progenitors (CLP) in BM. Pharmacologic activation or genetic overexpression of S1P1 suppressed LSK and CLP proliferation in vivo. ApoM was stably associated with BM CLPs, which showed active S1P1 signaling in vivo4. Moreover, ApoM+HDL, but not albumin-bound S1P, inhibited lymphopoiesis in vitro. Upon immune stimulation, Apom−/− mice developed more severe experimental autoimmune encephalomyelitis5, characterized by increased lymphocytes in the central nervous system (CNS) and breakdown of the blood-brain barrier. Thus, the ApoM-S1P-S1P1 signaling axis restrains the lymphocyte compartment and subsequently, adaptive immune responses. Unique biological functions imparted by specific S1P chaperones could be exploited for novel therapeutic opportunities.
Sphingosine 1-phosphate (S1P), a bioactive lysophospholipid mediator, interacts with vertebrate-specific S1P receptors to regulate various physiological functions6. Most cells express one or more of the G protein-coupled S1P receptors (S1P1-5), which mediate cellular responses such as cell migration, adhesion, and survival7. A unique feature of this signaling system is the enrichment of the ligand, S1P, in lymph and blood compared to interstitial fluids1,2. The majority (~65%) of plasma S1P is complexed with apolipoprotein M (ApoM), whereas the remainder is found in the lipoprotein-free fraction, presumably associated with albumin4. Circulating ApoM is predominantly associated with a specific population of HDL particles (ApoM+HDL)8,9. S1P bound to ApoM+HDL maintains pulmonary vascular barrier function and migration of endothelial cells in vitro3,10.
Activation of S1P1 receptor on immune cells residing in secondary lymphoid organs and thymus is critical for lymphocyte egress into circulation1,2,11. FTY720 (Fingolimod, Gilenya™), the first oral treatment for relapsing-remitting multiple sclerosis (RRMS), targets this pathway, inducing lymphopenia and diminishing infiltration of autoreactive lymphocytes into the central nervous system (CNS)12. Emerging evidence indicates that S1P1 also regulates T cell differentiation, including T helper 17 (TH17) and T helper 1 (TH1) / Treg balance13,14. However, the role of S1P signaling in lymphocyte development, homeostasis, and activation remain unclear. Additionally, given the poor aqueous solubility of S1P, it is unknown whether chaperones impart specificity to S1P signals in lymphocytes, resulting in distinct immune responses.
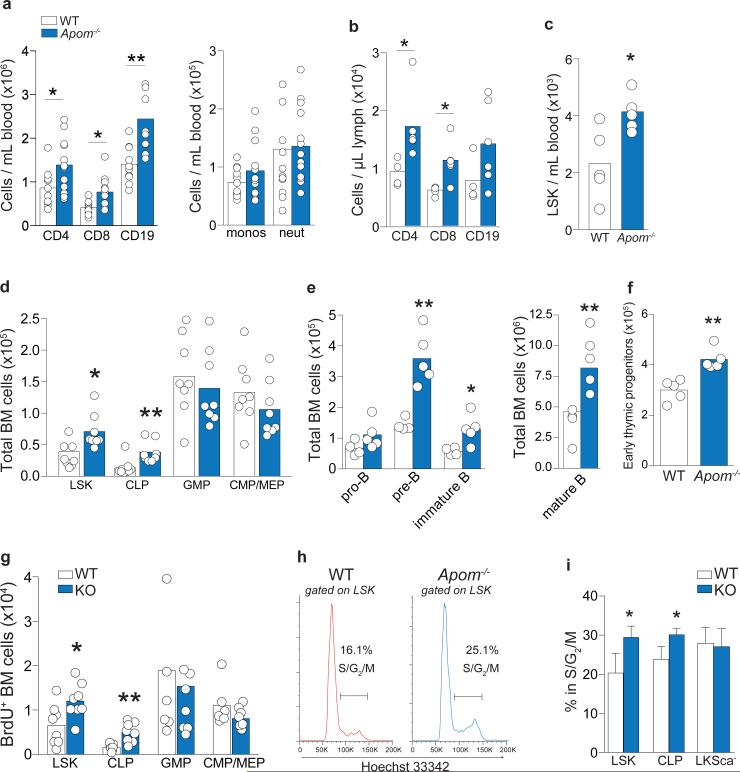
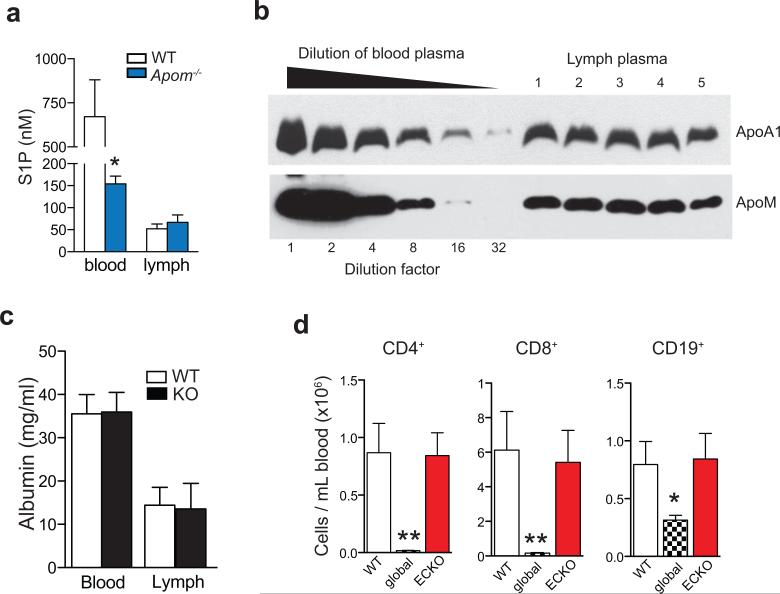
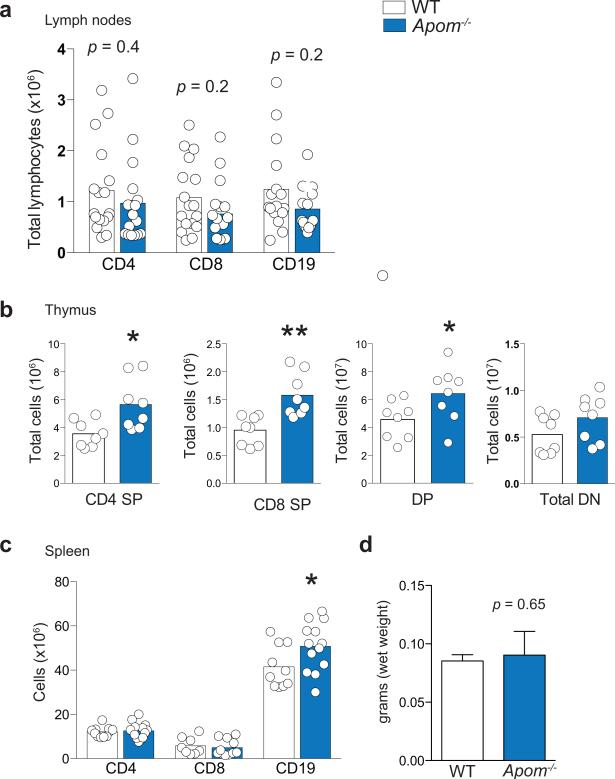
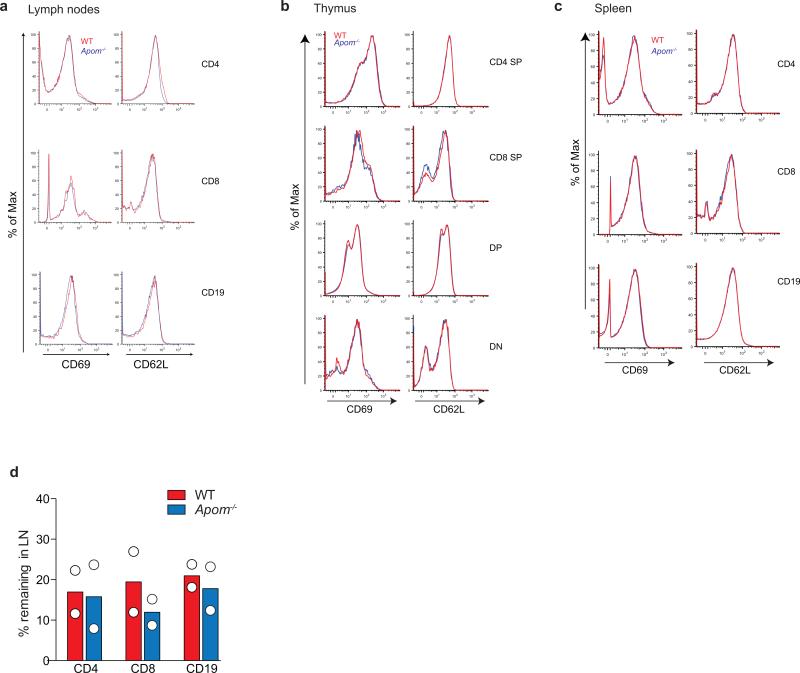
We determined if ApoM levels affected the S1P concentrations in blood and lymph, which are known to be important for lymphocyte egress. Although plasma S1P was decreased by ~ 60%3, lymph S1P concentrations were not changed in Apom−/− mice (Extended Data Fig. 1a). ApoM in lymph was estimated to be approximately half of plasma levels (Extended Data Fig. 1b). Albumin concentrations in blood and lymph were similar between WT and Apom−/− mice (Extended Data Fig. 1c). Analysis of peripheral blood revealed a surprising increase of CD4+ and CD8+ T cells and CD19+ B cells in Apom−/− mice (Fig. 1a), whereas circulating monocyte and neutrophil numbers were similar. Numbers of CD4, CD8, and CD19 cells were also increased in lymph (Fig. 1b). Lymphocytosis was not caused by a loss of endothelial cell S1P1 signaling, since inducible endothelial cell-specific deletion of S1pr1 (S1P1 ECKO)15 did not affect blood lymphocyte numbers (Extended Data Fig. 1d). In contrast, global knockout of S1pr1 resulted in severe lymphopenia, consistent with a requirement for S1P1 in lymphocyte egress from secondary lymphoid organs (SLO) and thymus (Extended Data Fig. 1d)1. While examination of lymph nodes (brachial and inguinal) revealed similar lymphocyte numbers in Apom−/− mice compared to WT (Extended Data Fig 2a), thymi of Apom−/− mice contained significantly more CD4+CD8+ double positive (DP) and CD4+ or CD8+ single positive (SP) cells (Extended Data Fig 2b). B cell populations in spleens of Apom−/− mice were slightly increased but there were no differences in the T cell populations or spleen weights (Extended Data Fig 2c, d). Surface expression of lymphocyte activation markers CD69 and CD62L were unchanged in the LN, thymus or spleen (Extended Data Fig 3a-c). Administration of anti-integrin antibodies, which block lymphocyte entry into lymph nodes, had similar effects on WT and Apom−/− lymph node cell numbers (Extended Data Fig 3d), implying that ApoM+HDL is not critical for lymphocyte egress.
Figure 1. Increased lymphocytes and their progenitors in Apom−/− mice.
a, CD4 and CD8 T cells, CD19 B cells, monocytes, and neutrophils in blood or b, lymph from WT (white) and Apom−/− (blue) mice. c, LSK cells in blood of WT and Apom−/− mice. d Stem and progenitor cell populations in bone marrow (BM) of WT and Apom−/−. e, Pro-pre, immature, and mature B cell populations in BM of WT and Apom−/− mice. f, Early thymic progenitors (ETP) in thymi of WT and Apom−/− mice. g, h, Proliferation of progenitors in BM of WT and Apom−/− mice determined by BrdU incorporation. (a-g) Circles indicate values from individual mice and bars represent means. Data are compiled from two (b, c, e, f) or four (a, d, g) independent experiments. h, Representative histograms of Hoechst 33342-stained LSK bone marrow cells from WT and Apom−/− mice demonstrating entry into cell cycle. Numbers above bars represent percentage of cells in S/G2/M phase. i, Quantification of cycling LSK, CLP, and LKSca− subsets in WT and Apom−/− mice. Bars represent means ± SD. n = 4. Graphs are representative of at least two experiments. *p < 0.05, **p < 0.005 as compared to WT.
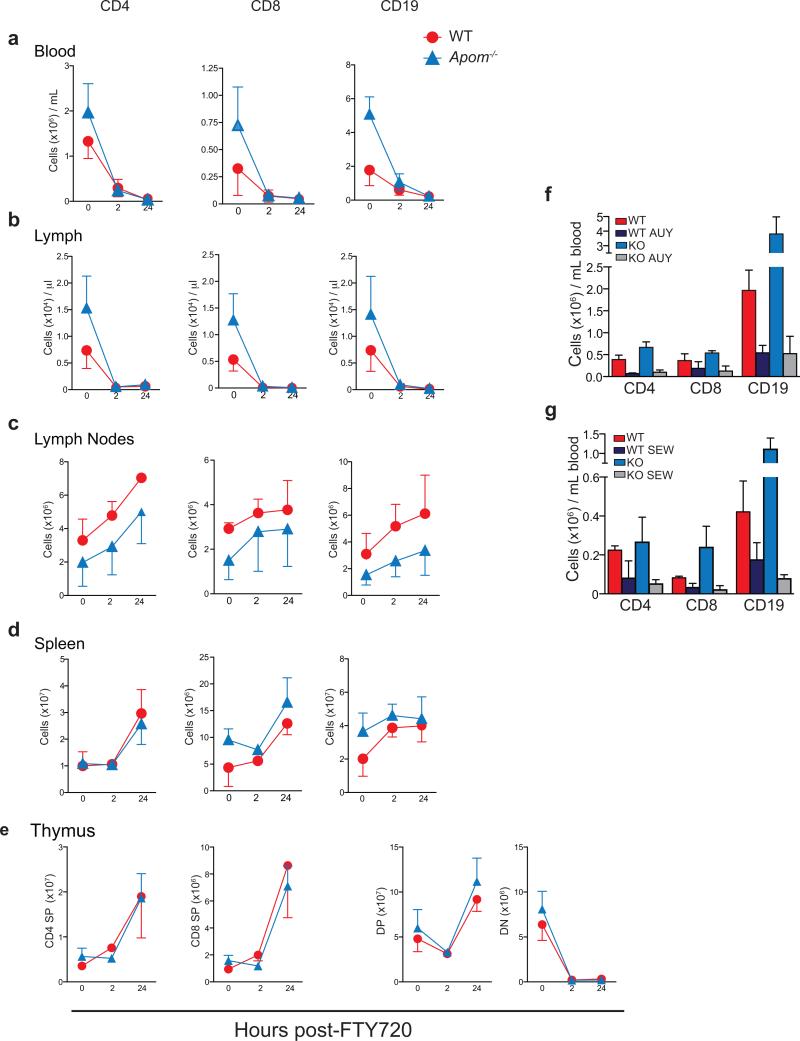
FTY720, which induces internalization of S1P1, induces lymphopenia1,12. In both WT and Apom−/− mice, administration of FTY720 resulted in marked lymphopenia in blood and lymph 2h post-administration, with similar retention patterns of increased CD4, CD8, and CD19 cells in LN and spleen (Extended Data Fig. 4 a-d). Double negative (DN) thymocytes were decreased whereas DP and SP cells increased in thymi of both WT and Apom−/− mice (Extended Data Fig. 4e). Similar degree of lymphopenia was seen using two S1P1-selective agonists, AUY954 and SEW2871 (Extended Data Fig. 4f, g)16,17. Collectively, these data suggest that lymphocyte trafficking out of thymus and SLO into blood and lymph is not dependent on ApoM+HDL.
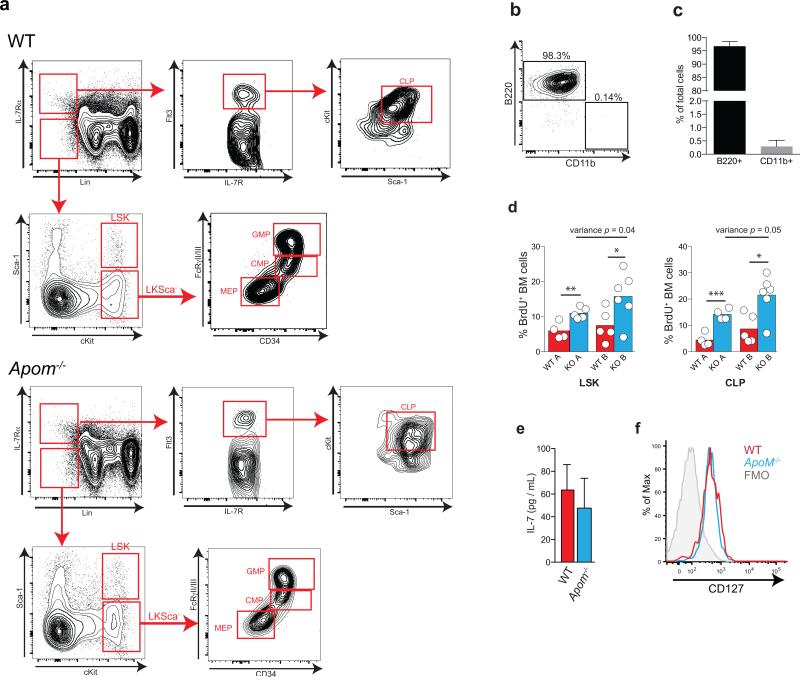
To determine the cause of lymphocytosis seen in Apom−/− mice, we examined hematopoietic cell populations in blood and BM (Extended Data Fig. 5a-c). Lin−Sca1+cKit+ (LSK) cells, a designation encompassing several distinct hematopoietic stem and progenitor populations, were more abundant in blood and BM of Apom−/− mice (Fig. 1c). BM of Apom−/− mice also contained increased numbers of common lymphoid progenitors (CLP; Lin−Flt3+IL7Rα+cKit+) whereas granulocyte macrophage progenitors (GMP; LKSca-1− CD34+ FcγRII/IIIhi), common myeloid progenitors (CMP; LKSca-1− CD34+ FcγRII/IIIlo/−), and megakaryocyte/erythrocyte progenitors (MEP; LKSca-1− CD34− FcγRII/IIIlo/−) were unchanged (Fig. 1d)18-20. Pre-, immature, and mature B cells in the BM (Fig. 1e) and early thymic progenitors (ETP) / double negative 1 (DN1; CD4− CD8− CD3− cKit+ CD44+ CD25−) in the thymus were increased in Apom−/− mice (Fig. 1f). Although S1P may have a role in LSK recirculation from tissues to BM19, B cell BM egress, which is insensitive to pertussis toxin, is likely not involved in the lymphocytosis seen in Apom−/− mice21. 2.5 hours after bromodeoxyuridine (BrdU) injection, Apom−/− LSK and CLP had significantly more BrdU incorporation compared to WT cells (Fig. 1g; Extended Data Fig. 5d). No measurable difference was detected in myeloid progenitors. Cell cycle analysis demonstrated increased fractions of LSK and CLP, but not LKS−, in S/G2/M phase in Apom−/− BM (Fig. 1h, i)18. These data suggested that ApoM restrained cell cycle entry specifically in BM progenitors destined for lymphoid lineages.
Genetic deletion of the cholesterol transporters ATP-binding cassette (ABC) ABCA1 and ABCG1, which interact with HDL to export cellular cholesterol, results in significant increases in LSK and myeloid progenitor cells18,22. ABCG1 single knockout23 or deletion of scavenger receptor (SR)-B124, a high-affinity HDL receptor, resulted in increased mature T or B cell, respectively, while not affecting their progenitors. Our findings suggested a BM compartment-specific function of ApoM+HDL in lymphocyte ontogeny. We next investigated whether IL-7, a key regulator of lymphopoiesis20, was influenced by ApoM-S1P signaling. IL-7 concentrations in the BM (Extended Data Fig. 5e) and CLP IL-7Rα surface expression (Extended Data Fig. 5f) were similar between WT and Apom−/−mice. Thus, modulation of the IL-7 / IL-7Rα interaction is unlikely to be responsible for ApoM-mediated suppression of lymphopoiesis.
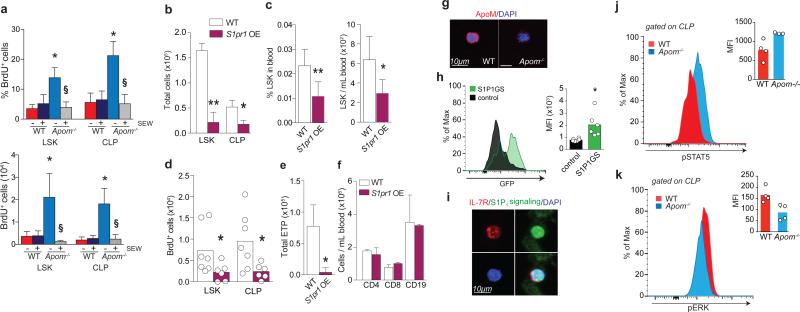
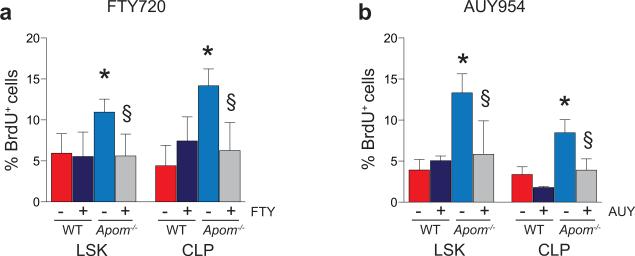
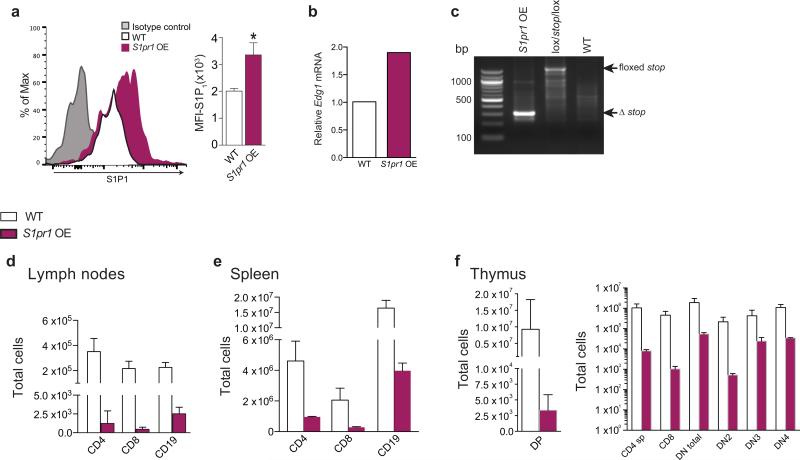
To examine the role of S1P in progenitor proliferation regulated by ApoM+HDL, WT and Apom−/− mice were treated with SEW2871 and BM cell BrdU incorporation examined (Fig. 2a). SEW2871 treatment suppressed BrdU incorporation in Apom−/− LSK and CLP but not in WT counterparts. Treatment with AUY954 or FTY720 also had similar effects (Extended Data Fig 6a, b), suggesting that pharmacologic activation of S1P1 on LSK and CLP suppresses their proliferation. We next determined LSK and CLP numbers in BM of mice with an inducible S1pr1 transgene (S1pr1 OE; Extended Data Fig. 7a-c)15. Induction of S1P1 expression led to decreased numbers of LSK and CLP (Fig. 2b). Blood LSK numbers were also reduced, ruling out increased BM egress of hematopoietic progenitors (Fig. 2c). Both LSK and CLP populations showed decreased BrdU incorporation (Fig. 2d). S1P1 over-expression also resulted in decreased ETP in thymus (Fig. 2e). Mature T and B cell numbers in blood were unchanged and SLO had reduced cell numbers (Fig. 2f; Extended Data Fig 7d-f), suggesting increased egress of mature lymphocytes from lymphoid organs upon S1P1 overexpression. These pharmacologic and genetic data further confirm that ApoM+HDL signaling via BM progenitor cell S1P1 restrains lymphopoiesis.
Figure 2. ApoM/ S1P/ S1P1 signaling suppresses LSK and CLP expansion.
a, % BrdU incorporation (left panel) and total BrdU+ (right panel) LSK and CLP in WT and Apom−/− BM 24 hours post-treatment with SEW 2871. n = 6. *p < 0.05 versus WT; §p < 0.05 versus vehicle-treated control. b, LSK and CLP in BM and c, percentage and total number of LSK in blood of S1pr1 OE mice and WT littermates. S1pr1 OE, n = 6; WT, n = 7. d, BrdU incorporation by BM LSK and CLP of WT and S1pr1 OE mice. e, ETP, or f, blood CD4+, CD8+, and CD19+ cells from WT and S1pr1 OE mice. S1pr1 OE, n = 6; WT, n = 7. g, Immunofluorescence of ApoM (red) bound to the surface of Lin− Sca1+ (LSK and CLP) cells from WT or Apom−/− BM. DAPI nuclear counter stain, blue. h, Representative histogram and quantitative median fluorescence intensity (MFI) of GFP expression by CLP from BM of S1P1 GFP signaling (green) or control (black) mice. i, Immunofluorescence of IL-7R (red) expression of GFP (green) by CLP. DAPI nuclear counter stain, blue. j. Representative flow cytometry histograms of p-Stat5 and k, p-ERK1/2 in WT (red) and Apom−/− (blue) CLPs. MFI of p-Stat5 and p-ERK1/2 in CLP of 3-4 WT or Apom−/− mice are shown in inset. (d, h-k) Bars represent means and circles represent values from individual animals. (b, c, e, f) Bars represent means ± SD. *p < 0.05; **p < 0.005 versus WT or control. (a-c, e, f, h, j) Data are combined from two experiments. (d) Data are combined from three experiments. (g and i), Data are representative of at least four experiments.
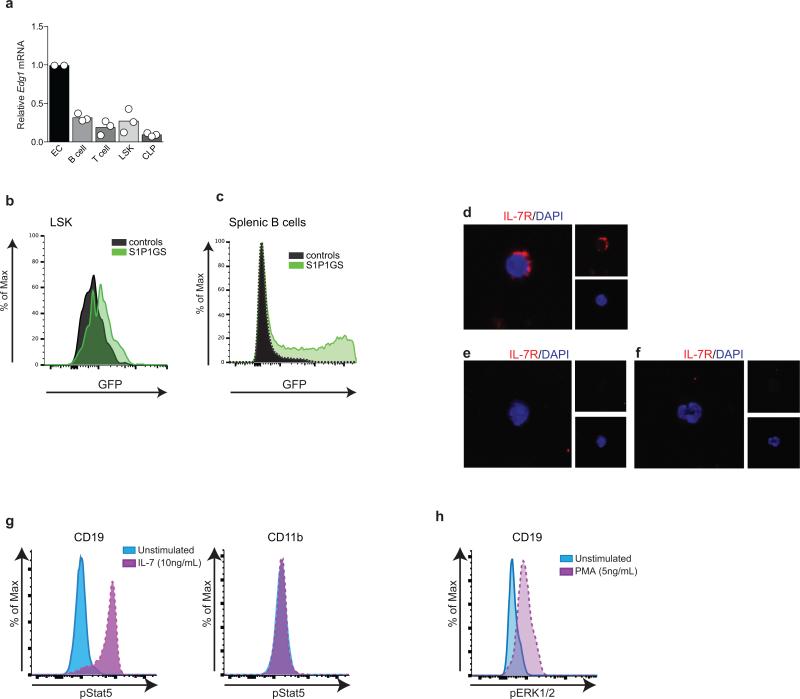
Real-time RT-PCR analysis found that S1pr1 mRNA is expressed by CLP and confirmed a previous report of its expression by LSK (Extended Data Fig. 8a)19. Immunofluorescence analysis of Lin− Sca1+ BM cells from WT mice showed stable association of ApoM with the cell surface (Fig. 2g). To determine if S1P1 is active in BM progenitor cells in vivo, we used S1P1 GFP signaling mice, which show nuclear GFP signal upon receptor activation (Extended Data Fig. 8b-f)4 and found that CLP and LSK show active S1P1 signaling (Fig. 2h,i).
We next examined the signal transducer and activator of transcription 5 (Stat5) pathway, which is activated by IL-7R signaling and regulates lymphocyte development, proliferation, and differentiation25,26. Phosphoflow analysis (Extended Data Fig. 8g, h) revealed significantly increased phospho-Stat5 in Apom−/− CLP compared to WT cells (Fig. 2j). Conversely, extracellular signal-regulated kinases 1 and 2 (Erk1/2) antagonizes the proliferative signals induced by Stat526. CLP from mice lacking ApoM-S1P had significantly less phospho-Erk1/2 than WT CLP (Fig. 2k). Collectively, these data suggest that ApoM-S1P directly interacts with BM lymphocyte progenitors and activates the S1P1/ ERK pathway to restrain their proliferation.
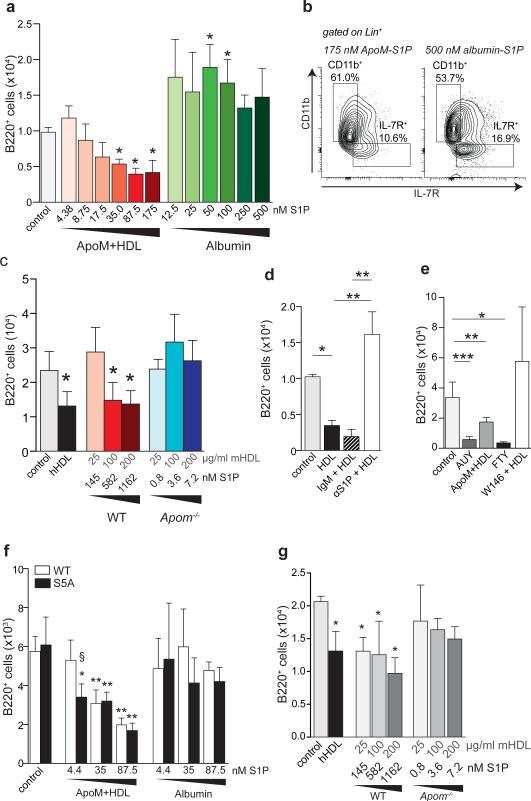
To test if ApoM+HDL modulated lymphocyte development directly, we utilized in vitro lymphopoiesis assays. Using Lin− cells from WT BM, we observed that the generation of B220+ cells (pre-, pro-, and immature B lymphocytes) was strongly suppressed by ApoM+HDL but not by albumin-bound S1P (Fig 3a,b; Extended Data Fig 9a). HDL from Apom−/− mice, which lacks S1P (ApoM−HDL) (Extended Data Fig 9b) did not suppress lymphopoiesis (Fig. 3c). ApoM+HDL-mediated suppression of lymphopoiesis was blocked by preincubation of HDL with an anti-S1P IgM28 but not by an irrelevant IgM (Fig. 3d). These findings suggest that ApoM+HDL-bound S1P is critical to restrain lymphocyte progenitor differentiation and proliferation.
Figure 3. ApoM-S1P activation of S1P1 suppresses lymphocyte progenitor generation in vitro.
a, B220+ cells generated from WT Lin− BM after incubation with increasing concentrations of ApoM+HDL S1P or albumin-S1P. b, Representative flow cytometry plots of IL-7Rα+ versus CD11b+ cells generated in the presence of 175 nM ApoM-S1P or 500 nM albumin-S1P. c, B220+ cell numbers generated after culture in the presence of human HDL (hHDL; 100 μg/ml), or increasing concentrations of mouse ApoM+HDL (WT) or ApoM−HDL (Apom−/−). d, B220+ cells generated after incubation with ApoM+HDL (50 μg/mL), ApoM+HDL + IgM, or ApoM+HDL + αS1P. e, B220+ cells generated in the presence of vehicle, AUY954 (10 nM), FTY720p (10 nM), 100 μg/ml ApoM+HDL, or W146 (100 nM) + 100 μg/ml HDL. f, B220+ cells generated from WT or S1P1S5A (S5A) Lin− BM cells after incubation in the presence of increasing concentrations of ApoM+HDL-S1P or albumin-S1P. g, Number of B220+ cells generated from S5A Lin− BM incubated with increasing concentrations of ApoM+HDL (WT) or ApoM-HDL (Apom−/−). (a-c) n = 5; (d, e) n = 6 and data are compiled from two independent experiments. (f & g) WT, n = 5; S5A, n = 3 and data are representative of two experiments. *p < 0.05; **p <0.005; ***p < 0.001 versus control or vehicle values. Bars represent mean ± SD.
To determine the involvement of S1P1, cultures were incubated with AUY954 or phosphorylated FTY720 (FTY720p), resulting in significantly decreased numbers of B220+ cells (Fig. 3e). However, incubation of Lin− BM cells with W146, a selective S1P1 antagonist, abrogated the suppressive effect of ApoM+HDL. Next, we used Lin− BM from S1P S5A1 mice, which express a mutated S1P1 that is internalization defective, resulting in extended surface residency and sustained signaling13,17,27. S1P S5A1 BM cells were more sensitive to ApoM-S1P than WT BM, since lower S1P concentrations were sufficient to repress B220+ development (Fig. 3f). Despite greater S1P sensitivity, albumin-S1P was unable to suppress lymphopoiesis by S1P S5A1 cells, similar to WT cells. ApoM−HDL did not suppress B220+ generation from S1P S5A1 BM cells (Fig. 3g). Collectively, these findings support the hypothesis that ApoM+HDL activation of S1P1 on lymphocyte progenitors inhibits their proliferation.
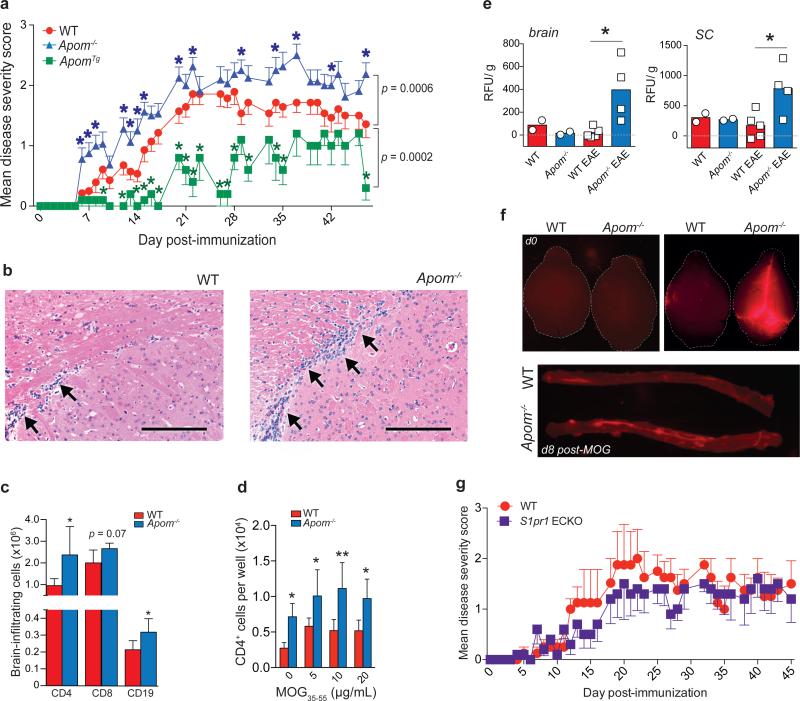
We hypothesized that modulation of lymphocyte compartment size by ApoM+HDL could impact the magnitude of immune responses. The experimental autoimmune encephalomyelitis (EAE) model recapitulates many aspects of multiple sclerosis (MS) pathology, including increased BM cell proliferative capacity, blood brain barrier (BBB) disruption, and autoreactive immune cell CNS infiltration5. Interestingly, increased plasma HDL correlates with decreased acute inflammation in MS patients, although the mechanism and the role of specific HDL populations are unknown28,29. To ascertain whether the expanded lymphocyte compartment in Apom−/− mice could affect the extent and intensity of the adaptive immune response, we induced EAE in WT, Apom−/− mice, and mice overexpressing a human ApoM transgene (ApomTg)3 by immunization with myelin oligoglycoprotein (MOG35-55) peptide. Mice lacking ApoM developed symptoms earlier and exhibited more severe CNS pathology compared to WT mice (Figure 4a). Remarkably, ApomTg mice developed milder symptoms, supporting a protective role for ApoM-S1P (Figure 4a). More severe inflammation in the CNS was evident at day 16 post-immunization in Apom−/− brains as compared to WT counterparts (Figure 4b) and increased lymphocytes were found in Apom−/− brains at the peak of disease (Figure 4c) Lymphocytes from MOG-immunized Apom−/− mice were highly activated, as demonstrated by increased splenocyte proliferative responses to ex vivo MOG restimulation (Figure 4d). Thus, the increase in BM proliferation of lymphocyte progenitors and increased circulating lymphocytes in Apom−/− mice resulted in an exaggerated autoimmune neuroinflammatory response, whereas overexpression of ApoM was protective.
Figure 4. ApoM expression affects EAE disease onset and severity.
a, Mean clinical EAE scores of WT, Apom−/−, or ApomTg mice. Symbols represent means ± s.e.m. WT, n = 14; Apom−/−, n = 16; ApomTg, n = 5. Data from WT and Apom−/− mice are representative of three independent experiments. *p ≤ 0.05 compared to WT value as determined by Mann-Whitney U-test. b, Representative photomicrographs of hematoxylin and eosin staining of brains from WT or Apom−/− mice at d16 post-MOG35-55 immunization. Scale bar, 100μm. c, Numbers of brain-infiltrating CD4, CD8, and CD19 cells from CNS of WT and Apom−/− EAE mice at day 24 post-immunization. d, Number of CD4 T cells from splenocytes of MOG35-55-immunized WT or Apom−/− EAE mice following ex vivo restimulation with increasing concentrations of MOG35-55 peptide. (c & d) Bars represent means ± SD. *p < 0.05, **p < 0.01 compared to WT. Experiments were performed at least twice with cells from n = 5 / arm. e, Quantification of TMR-dextran fluorescence in brain and spinal cord after 16h of circulation in WT or Apom−/− mice at d0 or d8 post-MOG35-55 immunization. Bars represent means and symbols represent values from individual mice. Data are combined from two experiments. f, Representative photographs of whole brains or spinal cords quantified in (e). g, Mean clinical EAE scores of S1pr1 ECKO and WT littermates. Symbols represent means ± s.e.m. n = 5 per arm and data are representative of two experiments performed.
Previously, our laboratory has reported that the loss of ApoM results in enhanced pulmonary vascular leakage3. To determine if altered vascular barrier function was contributing to increased EAE severity, WT and Apom−/− mice were injected intravenously with tetramethylrhodamine (TMR)-labeled dextran (70 kD) before or eight days post-MOG35-55 immunization to assess BBB functionality. Before immunization, no differences in dextran extravasation were evident in brain or spinal cord (Figure 4e and f; Extended Data Fig 10a). Post-immunization, Apom−/− brains and spinal cords displayed significantly increased vascular leakage. This was dependent upon the immune response, since pertussis toxin alone was insufficient to induce vascular leakage (Extended Data Fig 10b). Thus, the BBB was intact in mice lacking ApoM before MOG35-55 immunization and induction of an immune response was necessary for the generation of EAE and associated BBB breakdown.
S1P1 ECKO mice have increased pulmonary vascular leakage (Extended data Fig 10c); however, deletion of endothelial S1pr1 did not influence EAE disease severity (Figure 4g), suggesting that alterations in vascular barrier function are not sufficient to modulate autoimmune responses in the CNS. Similarly, S1P1 expression by astrocytes has been shown to affect EAE severity30. Since neurovascular leakage would be a necessary antecedent for plasma ApoM-S1P to gain access to astrocytes, it seems unlikely that the increased disease severity seen in Apom−/− mice is due to direct ApoM effects on neural cells. Collectively, these data strongly suggest that ApoM-S1P signaling in lymphocytes is a key factor in the increased EAE pathology displayed by Apom−/− mice.
In summary, these data reveal an unexpected mechanism whereby ApoM+HDL specifically restrains BM lymphopoiesis by inducing S1P / S1P1 receptor signaling in BM progenitors, thereby limiting the lymphocyte compartment. These findings also suggest that unique functions of S1P are imparted by its chaperone, ApoM+HDL, and that ApoM+HDL-dependent S1P/S1P1 signaling induces distinct physiological outcomes. While dispensable for lymphocyte trafficking, ApoM-S1P attenuation of lymphopoiesis under homeostasis may be an important regulator of the lymphocyte life cycle, and therefore have a role in autoimmune responses. Our studies indicate that ApoM+HDL-mediated regulation of lymphocyte ontogeny impacts the extent and intensity of autoimmune neuroinflammation in the EAE model. Furthermore, chaperone-dependent S1P signaling may afford the development of novel strategies for the control of immune responses.
Methods
Animals
Apom−/− and ApoMTg mice were crossed at least 9 generations to the C57BL/6 genetic background3,31. C57BL/6 mice purchased from Jackson Laboratory were used as wild-type controls. To generate mice that over-express S1P1, mice expressing the S1p1f/stop/f transgene were crossed to mice expressing the tamoxifen-inducible Rosa26-Cre-ERT2 to yield S1p1f/stop/f Rosa26-Cre-ERT2 animals15. To generate mice with endothelial cell-specific deletion of S1pr1, mice with floxed S1p1 genes (S1pr1fl/fl) were crossed with mice expressing a tamoxifen-inducible Cre under the control of the VE-cadherin gene (Cdh5-Cre-ERT2)15,32. For both S1pr1 over-expressing mice (S1pr1 OE) and endothelial cell-specific deletion (ECKO), Cre negative littermates were used as controls. To induce deletion of the floxed S1p1r or floxed “stop” sequence, mice were treated with tamoxifen by oral gavage, 4 mg every third or fifth day for a total of three treatments. S1pr1 OE mice were analyzed 3-4 days after the final tamoxifen administration; ECKO mice were analyzed ≥ 10 days after the final tamoxifen administration. S1P1 GFP signaling mice mice were generated as previously described4. Briefly, mice expressing a transcriptional unit consisting of the S1P1 C-terminus fused to tTA (tetracycline transcriptional activator) and β-arrestin fused to TEV (tobacco etch virus) protease knocked in to the endogenous S1P1 locus were crossed with mice containing a histone-GFP reporter gene under the control of a tTA-responsive promoter. Mice expressing one allele of both the S1pr1Ki and the GFP alleles were considered S1P1 GFP signaling mice. Littermates expressing only the GFP allele without the S1P1 knock-in were considered controls. For all bone marrow studies, animals were sacrificed and tissues collected between 12 P.M. and 3 P.M to limit circadian effects. No randomization method was used and investigators were blinded to the genotype of animals during data analysis. The minimum number of animals per group was four and for all inducible Cre strains wild-type littermate controls were used. Male and female mice were used as age-matched controls for all studies except for EAE experiments, where only female animals were used. No animals were excluded from the analysis. Animals were housed in a specific pathogen-free facility and provided food and water ad libitum. All animal protocols were approved by the IACUC of Weill Cornell Medical College.
Verification of S1P1 mRNA over-expression and floxed “stop” excision
After completion of the tamoxifen treatment regimen, RNA was extracted from whole bone marrow with Trizol according to the manufacturer's instructions, and TaqMan real-time multiplex RT-PCR performed as described below to assess over-expression of S1pr1 mRNA. For extraction of genomic DNA from the same samples, back extraction buffer (1M Tris, pH 8.0, 4M guanidine thiocyanate, 50mM sodium citrate) was added to the remaining organic and interphases, vortexed, and incubated for 10 minutes at room temperature. Samples were then centrifuged at 4°C for 15 minutes at 12,000 × g and the aqueous phase transferred to a new tube. DNA was precipitated with 400 μl isopropanol and samples centrifuged again at 4°C for 15 minutes at 12,000 × g. Supernatant was removed, samples washed with 75% ethanol and the DNA pellet was resuspended in H2O. PCR was performed using 20 ng of DNA, the following primers: 5’: gtt cgg ctt ctg gcg tgt ga; 3’: cca ggt cct cct cgg aga tc; and the reaction conditions: 95°C/30”, 56°C/30”, 72°C/1” for 30 cycles. Amplification of the intact floxed stop cassette yielded a 1.4 bp fragment and when deleted, a 308 bp fragment.
Blood and lymph: cell and plasma collection
Mice were euthanized with CO2. Blood was recovered via terminal cardiac puncture and collected in tubes containing 35 μl 0.1M EDTA. 500 μl of whole blood was then removed to a new tube, centrifuged at 2,000 × g for 15 minutes, and plasma removed and stored at -20°C. Cells were then subjected to ammonium chloride (ACK) erythrocytelysis, washed with PBS, and stained with eFluor718 fixable viability dye (eBioscience) according to manufacturer's instructions. Lymph was recovered from the cisterna chyli, as previously described2,33, and collected in 5 μl acid citrate-dextrose. Total lymph volume was recorded before the entire sample was centrifuged at 2,000 × g for 15 minutes to isolate plasma. Plasma was then removed and cells were washed with PBS before staining with the eFluor718 viability dye. After a PBS wash, blood and lymph cells were then briefly fixed for 30 minutes in 0.1% paraformaldehyde (PFA), washed, and stained with antibody cocktails for flow cytometry, as described below34.
Tissue cell isolation
Single-cell suspensions were created from spleen, thymus, and lymph nodes (two inguinal and brachial lymph nodes per mouse) by gently disaggregating tissue between frosted glass slides. Bone marrow cells were collected after removing the epiphyses and a brief centrifugation in a 1.5mL tube. Cells were then washed with 1% FBS in PBS and subjected to ACK lysis buffer. After another PBS wash, cells were stained with eFluor718 viability dye. For some studies, such as cell sorting, cells were stained for and analyzed by flow cytometry unfixed. For except for studies requiring live sorted cells, samples were gently fixed with 0.1% PFA for 10 minutes then washed with 1% FBS in PBS, unless noted otherwise. Although absolute numbers were lower after fixation, this did not have a dramatic effect on staining patterns and gave results similar to those obtained using unfixed cells.
Flow cytometry
After fixation, cells were washed with 1% FBS in PBS (flow buffer; FB) and Fc receptors blocked with TruStain FcX (Biolegend) in 3% FBS overnight at 4°C. Cells were then aliquoted and stained in their respective antibody cocktails for 30 minutes on ice. After washing with FB, liquid counting beads (BD) were added to each sample and data were obtained on a BD LSRII (Becton Dickson) and analyzed using FlowJo software (Tree Star, Inc.).
Antibodies were purchased from BioLegend (BL), eBioscience (eB), Southern Biotech (SB), or Becton Dickson (BD). For the determination of blood and lymph cell populations the following clones and antibody-fluorophore conjugates were used: CD4-PE (RM4-4, BL), CD8-PerCP/eFluor710 (H35-17.2; eB), CD19-eFluor450 (ID3; eB), CD11b-APC-eFluor780 (M1/70; eB), Ly6C-FITC (HK1.4; SB), Ly6G-PE-Cy7 (1A8; BL), and CD115-APC (AFS98; BL). For determination of lymph node and splenocyte populations: CD4-APC-Cy7 (GK1.5; BL), CD8-eFluor450 (H35-17.2; eB), B220-AF700 (RA3-6B2; eB), CD62L- PerCP-Cy5.5 (MEL-14; BL), and CD69- PE-Cy7 (H1.2F3; eB). For determination of thymocyte populations: CD3-APC-Cy7 or -AF700 (17A2; eB), CD4-PE (RM4-4, BL), CD8-APC (53-6.7, eB), CD62L- PerCP-Cy5.5 (MEL-14; BL), CD69- PE-Cy7 (H1.2F3; eB), CD44-AF700 or -PECy7 (IM7; eB), CD25-AF488 (3C7; eB), cKit-PerCP-eFluor710 or -APC-eFluor780 (CD117; 2B8; eB). DN1 (ETP) were defined as CD4− CD8− CD3− CD44+ CD25− cKit+; DN2 were defined as CD4− CD8− CD3− CD44+ CD25+; DN3 were defined as CD4− CD8− CD3− CD44lo/- CD25+; DN4 were defined as CD4− CD8− CD3− CD44− CD25−. For determination of bone marrow B cell populations: B220-AF700, cKit-APC-eFluor780, CD19-PE-Cy7, Flt3-PE, CD24-BV421, CD43-AF488, IgM-PerCP-Cy5.5, IgD-APC. Pro-B cells were defined as B220+ cKit+ CD19+ Flt3− CD24+ IgM−; pre-B cells were defined as B220+ cKit− CD19+ Flt3− CD24+ IgM−; immature B cells were defined as B220+ cKit− CD19+ Flt3− CD24+ IgM+, and mature B cells were defined as B220+ cKit− CD19+ Flt3− CD24lo/- IgM+/- IgD+. To quantify bone marrow cell populations with or without BrdU 18-20,35-37: Lineage (Lin) cocktail-eFluor450 (17A2, RA3-6B2, M1/70, Ter-119, RB6-8C5; eB), Flt3-PE (CD135; A2F10; eB), cKit-PerCP-eFluor710 or -APC-eFluor780 (CD117; 2B8; eB), Sca-1-PE-Cy7 (Ly6A/E; D7; eB), IL-7Rα-APC-eFluor780, -FITC, or BV421 (CD127; A7R34; eB or SB/199; BD), CD34-APC (RAM34; BD), FcγRII/III-AF700 (93; eB), BrdU-PerCP-eFluor710 (BU20A; eB). For low abundance markers (cKit, Sca1, IL-7Rα, CD34, FcγRII/III, CD25, or CD44), fluorescence minus one (FMO) controls were used to set staining gates.
For S1P1 staining, tibiae bone marrow were spun into a tube containing 35 μl EDTA, then immediately fixed with 0.1% PFA on ice for 1 hour. After washing with 100nM HEPES in PBS, nonspecific interactions were blocked with anti-CD16/32 at room temperature for 15 minutes. Cells were then aliquoted for anti-S1P1 or isotype staining (R & D) overnight at 4°C. The next day, cells were washed twice with PBS-HEPES and stained to identify bone marrow populations.
Phosphoflow for phospho-Stat5 and phospho-Erk1/2
Whole bone marrow cells were resuspended in Lyse/Fix buffer (BD Biosciences) and processed according to manufacturer's instructions. To permeabilize, 100% methanol pre-cooled at -80° was added and cells vortexed for 15 seconds before 45 minute incubation on ice. After washing with 3% FBS in PBS, cells were incubated in Fc block (anti-CD16/32) and Innovex Biosciences peptide Fc block at room temperature for 20 minutes before incubation with antibody cocktails. For detection of phospho epitopes in CLP, the following antibodies were used: Lineage cocktail-PE, cKit-PerCP-eFluor 710, Sca1-PE-Cy7, and CD127-BV421. Anti-p-Stat5 (pY694) and p-Erk1/2 (pT202/pY204) were conjugated to AF488. As controls, splenocytes were isolated from WT mice and incubated with IL-7 (10 ng/mL; pSTAT5) or PMA (5 ng/mL; pERK1/2) or left unstimulated. After 15 minutes, Lyse/Fix buffer with 30% FBS was immediately added to cells to preserve the phosphor epitopes. Cells were then processed as described above for BM samples. CD11b+ cells were considered the negative control for pSTAT5 in response to IL-7 stimulation. CD19+ cells were considered the positive controls for pSTAT5 and pERK1/234,38.
Drug administration
FTY720 (fingolimod/Gilenya™) was administered p.o. at a single dosage of 0.5 mg/kg in 200 μl of 2% 2-hydroxypropyl-β-cyclodextran (HβC; Sigma-Aldrich). AUY954 was dissolved in DMSO and administered p.o. at a single dosage of 3 mg/kg in 200 μl of 2% HβC. Both FTY720 and AUY954 were kind gifts from Novartis Pharma, AG (Basel, Switzerland). SEW2871 (Cayman Chemical, Ann Arbor, MI) was dissolved in 1:4 Tween-20 and ethanol, then administered twice at 0h and 12h at a dosage of 20 mg/kg p.o. in 200 μl of HβC before sacrifice at 24h. For all studies, control animals were treated with the appropriate vehicle.
Albumin ELISA
Albumin concentrations in blood and lymph plasmas were determined using the mouse albumin ELISA kit from Bethyl Labs, according to manufacturer's instructions. Blood plasma was diluted 1:1.6 × 10⁶ and lymph plasma 1:8 × 10⁵ prior to analyses.
ApoM and ApoA1 immunoblots
1 μl of mouse blood plasma was first diluted in 10 μl PBS, then diluted serially 1:1 in PBS, and 1 μl of diluted lymph plasma was further diluted in 10 μl PBS. Samples were then denatured by boiling in SDS sample buffer and separated on a 12% denaturing gel. After transfer to PVDF membrane, blots were incubated overnight at 4°C with 1:1000 dilution of antibodies against ApoM (rabbit anti-human; Genetex) or ApoA1 (goat anti-mouse; AbCam) in 5% milk in Tween-20 tris-buffered saline (TBS-T). Secondary antibodies were incubated at 1:10,000 dilution in 1% TBS-T for one hour at room temperature. For approximation of ApoM concentrations, bands for the blood plasma dilution were analyzed by densitometry using ImageJ software (NIH) to create a standard curve. Undiluted blood plasma ApoM concentrations were assumed to be approximately 900 nM. Densitometric values obtained for ApoM bands from lymph plasma were compared to the standard curve and an approximate concentration calculated, which was then normalized to lymph volume. ApoA1 was used as an internal control.
Sphingosine 1-phosphate (S1P) quantitation
Bioactive sphingolipids were extracted from blood, lymph, or HDL preparations by a single phase ethyl acetate:isopropanol:water process and quantitated by electrospray ionization-tandem mass spectrometry (ESI-MS/MS) as described previously39.
Integrin blockade
Mice were injected intraperitoneally with 100 μg of anti-integrin α4 (BD Pharmingen, clone M17/4) and 100 μg of anti-integrin αL (Millipore, clone PS/2)40 in a total of 200 μl. Fourteen hours later, mice were sacrificed and brachial and inguinal lymph nodes collected. A single cell suspension was then analyzed by flow cytometry.
Administration and quantitation of 5’-Bromo-2’-deoxyuridine (BrdU)
BrdU was solubilized in 10 mN NaOH / H2O. 4 mg BrdU (Sigma) in 200 μl PBS was injected intraperitoneally into each mouse 2.5-3 hours before sacrifice37,41,42. Control mice were injected with 200 μl of PBS alone. For quantitation of BrdU incorporation, after isolation and RBC lysis, cell suspensions were fixed in 4% paraformaldehyde (BD) at room temperature for 10 minutes, then washed in 5% FBS followed by PBS. Cells were permeabilized in 100 μl of 0.125% Dawn dishwashing detergent (Procter and Gamble) in 1x PBS for 15 minutes at room temperature, then washed twice with 1% FBS in PBS. Cells were resuspended in DNase buffer (10% FBS in 1 mM CaCl2 and 0.1 mM MgCl2) containing 150U of DNase per sample and incubated at 37°C for 45 minutes before washing twice in PBS. Samples were then resuspended in Fc blocking buffer and incubated with antibody cocktail for analysis by flow cytometry.
Cell cycle analysis using Hoechst 33342 DNA incorporation
Freshly isolated cells were stained with antibody cocktail (anti-Lineage, -cKit, and -Sca1), washed, then resuspended in 10 μg/mL Hoechst 33342 (Life Technologies) in 1x PBS and incubated at room temperature for 45 minutes before fixation with 0.1% PFA and flow cytometric analysis.
Bone marrow IL-7 quantitation
Complete bone marrow (BM) was collected in 5μl 0.1M EDTA, then gently triturated in 200 μl PBS. Cell suspensions were then centrifuged at 2000g for 5 minutes at 4°C, then supernatants were removed to a new tube and stored at -80°C until analysis. IL-7 expression was quantified by ELISA according to manufacturer's instructions (R & D).
Multiplex quantitative real-time RT-PCR
B cells were isolated from whole spleen single cell suspensions using the EasySep mouse CD19 positive selection kit (StemCell Technologies), followed by the EasySep mouse T cell isolation kit for negative selection of T cells. Bone marrow from WT mice was subjected to negative selection for Lin− cells, then LSK (Lin− cKit+ Sca1+) and CLP (Lin KitloScalo IL-7Rα+ Flt3+) were collected by FACS. RNA was isolated using Trizol and concentrated using the RNA Clean and Concentrator kit (Zymo Research). Real-time RT and TaqMan PCR were performed using the TaqMan RNA-to CT 1-step kit (Life Technologies), and primers specific for mouse S1pr1. Reactions were normalized to expression of the housekeeping gene Nidogen within the same tube using the ΔΔ2Ct method43 and data are represented as fold change compared to expression by splenic B cells.
Ex vivo ApoM staining of BM cells
Bone marrow was spun into a tube containing 35 μl EDTA and the femurs flushed with, and resuspended. Cells were fixed with 0.1% paraformaldehyde at room temperature for 30 minutes and washed with PBS. Non-specific interactions were first blocked by incubation with Innovex Biosciences peptide Fc block at room temperature for 15 minutes, then 10% fatty-acid-free bovine serum albumin, Fraction V (FAF-BSA), 5% milk, and anti-CD16/32 were added to 1 mL for an additional 10 minutes. This was used in place of the suggested separation medium when cells were processed for lineage negative depletion, followed by Sca1 positive selection (both kits from Stemcell Technologies). Cells were then washed twice with BSA/milk by gentle mixing, then returning them to the magnet and pouring off liquid. Two drops of peptide Fc block with anti-CD16/32 were added to each tube and incubated at room temperature for five minutes. An aliquot of cells was set aside for staining with secondary antibody alone; the remainder was incubated with 1:200 dilution of rabbit anti-ApoM (GeneTex #62234) for 30 minutes at room temperature. Cells were washed on the magnetic column three times with BSA/milk before incubation with a 1:5000 dilution of donkey anti-rabbit AF546 (Life Technologies) for 30 minutes at room temperature. After washing again on the magnetic column, cells were incubated in PBS containing DAPI before imaging with an Olympus Fluoview Fv10i confocal microscope using the 60x water objective. Intensities for the blue and red channel were adjusted for the Apom−/− cells in accordance with their spectra and, once set, the same settings were used for the WT images. Thus, channel intensity correction was the same for each sample and no gamma correction was used.
Ex vivo IL-7Rα staining of BM cells from S1P1 GFP signaling mice
Bone marrow was spun into a tube containing 35 μl EDTA and the femurs flushed with, and resuspended in, 0.1% paraformaldehyde. Cells were fixed at room temperature for 12 minutes and washed with 1% FBS in PBS before being subjected to lineage depletion followed by Sca1 positive selection. Cells were then stained with either Lin cocktail or biotinylated anti-IL-7Rα primary antibody (clone SB/199; BD) followed by streptavidin-AF596 secondary antibody (Jackson Immunoresearch). All cells were incubated in DAPI in PBS before imaging by confocal microscopy, as described above.
In vitro hematopoiesis and lymphopoiesis
Lineage negative (Lin−) BM cells from WT or S5A mice were isolated using a negative selection magnetic bead kit (StemCell Technologies). In some experiments, CLPs from WT mice were sorted by FACS. 5,000 cells were then incubated in 350μl methylcellulose medium HPP-SP1 (MC; HemoGenix)) containing IL-3, IL-6, stem cell factor (SCF), thrombopoietin (TPO), Flt3L, BSA, and 5% FBS and supplemented with 10 ng/mL rmIL-7 (Peprotech). Control wells contained only this complete medium. Data from at least two duplicate wells per experimental condition were averaged. Cells from each mouse were assayed individually and not pooled. The stock solution of W146 was prepared in filtered Na2CO3 buffer and sonicated until dissolved, then added to MC at a final concentration of 1μM. AUY954 was dissolved in DMSO and diluted in MC for a final concentration of 100nM and 0.001% DMSO. FTY720p was dissolved in 1x PBS and added to MC. The vehicle control for the in vitro agonist/antagonist studies was 0.001% DMSO. Human and mouse HDLs were isolated by ultracentrifugation of plasma from healthy donors or mice as previously described and added to MC at the concentrations indicated44-46. The content of S1P in HDL preparations was determined by HPLC and LS/MS/MS as described above46. For S1P neutralization by anti-S1P antibody, 50 μg/mL HDL was incubated with 25 μg/mL of either anti-S1P antibody (Alfresa Pharma Corp, Tokyo, Japan) or mouse IgM (Bethyl Labs) at 37°C for 1 hour, then added to the MC47. Albumin-S1P was prepared by reconstituting stock S1P (in ethanol) in 0.1% fatty acid-free BSA (FAF-BSA; Fisher), then sonicating for 20 seconds. Dilutions were then made in 0.1% FAF-BSA before adding to MC. All MC incubations of Lin− cells were incubated for 10 days at 37°C and 5% CO2.
Flow cytometric analysis of in vitro incubations
For cell collection, 500 μl of PBS was added to each well, incubated for 10 minutes, then gently triturated to resuspend the cell culture/MC mixture. Resuspended cells were removed to a 1.5mL microcentrifuge tube and cells remaining in the well were collected with an additional 500 μl of PBS. Cells were then centrifuged at 700 × g for 10 minutes at 4°C, washed once with PBS, then processed for incubation with antibody cocktail and flow cytometric analysis as described above.
Induction of EAE
EAE was induced by subcutaneous injection on both flanks and base of the tail of 200 μg myelin oligoglycoprotein (MOG35-55) peptide (Alpha Diagnostic Intl. Inc.) emulsified in 200 μl of complete Freund's adjuvant (Difco). 200 ng of Bordatella pertussis toxin (List Biological Laboratories, Inc.) was injected intraperitoneally in 200 μl on the day of immunization and 48 hours later5,13. Clinical scores were determined based on the following scale: 0, normal; 1, tail weakness; 2, tail paralysis and hind limb weakness; 3, complete hind limb paralysis; 4, hind limb paralysis with forelimb weakness and 5, moribund or death13. For histopathological analysis of brain tissue sections, brains were removed and fixed in 10% neutral-buffered formalin overnight at room temperature. After washing in PBS, brains were placed in 70% ethanol before paraffin embedding. Tissue sections were then stained with hematoxylin and eosin (Histoserve, Inc.).
Isolation of CNS-infiltrating immune cells
Brains from WT and Apom−/− mice were minced, then digested in a mixing incubator for one hour at 37°C and 1300 rpm in a cocktail of Liberase (1U/1ml; Roche) and DNase (1 mg/ml; Sigma) in Hank's balanced salt solution (HBSS). Tissues were further disaggregated by repeated passage through an 18G needle, then brought to 1 ml with HBSS. Leukocytes were isolated on a discontinuous Percoll gradient according to Pino and Cardona 48 and analyzed by flow cytometry.
In vitro lymphocyte restimulation
Spleens from WT or Apom−/− mice were isolated 9 days post-MOG35-55 peptide immunization. After disaggregation and erythrocyte lysis with ammonium chloride, cells were cultured in 96-well plates at a density of 5 × 10⁵ cells with increasing concentrations of MOG35-55 peptide. After 96 hours of incubation, numbers of CD4+ cells were quantified by flow cytometry13.
Evans Blue dye extravasation measure of vascular permeability
Pulmonary vascular leakage was measured by Evans Blue dye (EBD) accumulation assay. EBD (0.5% in PBS) was injected via tail vein 90 minutes before tissue harvest. Pulmonary vasculature was perfused with 5 mL PBS through the right ventricle, while allowing the perfusate to drain from an incision in the left ventricle. Lungs were then weighed and dried at 56°C overnight. Dry lung weight was measured again, and EBD was dissolved in formamide at 37°C for 24 hours and quantitated spectrophotmetrically at 620 and 740 nm.
Tetramethylrhodamine (TMR) dextran brain and spinal cord vascular permeability
Eight days post-MOG immunization, MOG-immunized mice, mice injected with pertussis toxin alone, or unimmunized mice were injected via tail vein with 100 μl of 25 mg/mL TMR-dextran in 1 mM CaCL2. After 18h, mice were sacrificed by CO2 and perfused with approx. 10 mL PBS. Brain and spinal cord were removed and protected from light from this point. After weighing, tissues were homogenized in 1% Triton X-100 in PBS then spun at 4°C for 25 minutes at 20,000 × g. Supernatants were transferred to new tubes until fluorometric analysis at 540/590.
Statistical analyses
Statistical analyses were performed using GraphPad Prism software v6.0. Two-tailed Student's t-test was used for direct comparison of two groups. Analysis of variance (ANOVA) followed by Dunnett's for comparison to control group or Tukey's to compare all groups was used to determine significance between three or more test groups. Differences in EAE clinical scores were determined using the Mann-Whitney U-test for analysis of the area under the curve and at individual time points. For all analyses, α was set to 0.05 and p values ≤ 0.05 were considered significantly different.
Extended Data
Extended Data Fig 1. Blood and lymph ApoM and albumin in WT and Apom−/− mice and blood cell numbers in S1pr1 global and ECKO mice.
a, Concentrations of blood and lymph sphingosine 1-phosphate (S1P) were determined by LC-MS/MS. Bars represent means ± SD. n = 4 as described in Materials and Methods. b, Western blots of ApoA1 and ApoM in lymph of WT mice. 1 μl of WT blood plasma was serially diluted 1:1, and 1 μl of diluted lymph plasma from 5 animals was analyzed for ApoA1 and ApoM protein levels. c, Determination by ELISA of albumin concentrations in the blood and lymph of WT or ApoM−/− (KO) mice. Bars are mean ± SD. WT, n = 5; ApoM−/− , n = 7 d, Quantification of CD4, CD8, and CD19 cells in the blood of wild-type (WT), S1pr1f/f Rosa26-Cre-ERT2 (global) or S1pr1f/f Cdh5-Cre-ERT2 (ECKO) mice. Bars are mean ± SD. WT, n = 5; global or ECKO, n = 6. *p < 0.05; **p < 0.005, as compared to WT values.
Extended Data Fig 2. Cell populations of the lymph node, thymus, and spleen are largely similar in Apom−/− and WT mice.
a, Quantification of CD4, CD8, and CD19 cells in two brachial and two inguinal lymph nodes combined. Data are compiled from five experiments. b, Quantitation of CD4 single positive (SP), CD8 SP, CD4+CD8+ double positive (DP), and total CD4−CD8− double negative (DN) cells in thymi of WT or Apom−/− mice. Data are compiled from three experiments. c, Quantitation of CD4, CD8, and CD19 cells in spleens of WT or Apom−/− mice. Data are compiled from three experiments. (a-c) Bars represent means and circles represent values obtained from individual mice. *p < 0.05. d, Total spleen weights (grams of wet weight) from WT or Apom−/− mice. n = 6. Bars represent means ± SD.
Extended Data Fig 3. Surface expression of the maturation markers CD62L and CD69 and lymph node egress are unchanged in Apom−/− mice.
Surface expression of the lymphocyte maturation markers CD62L and CD69 was determined by flow cytometry and representative histograms are shown of staining by a, lymph node cells, b, thymocytes, or c, splenocytes quantified in Supplemental Fig 3 from WT (red) and Apom−/− (blue) mice. d, Percent of CD4+, CD8+, and CD19+ cells remaining in brachial and inguinal lymph nodes 14 hours after administration of α4 and αL integrin-blocking antibodies. Symbols represent mean value acquired from three mice in independent experiments; bars represent means.
Extended Data Fig 4. ApoM expression is not required for the lymphopenia response to treatment with FTY720 or the S1P1-specific agonists AUY954 and SEW 2871.
WT (red) and Apom−/− (blue) mice were treated with a single dose of FTY720 (0.5 mg/kg p.o.), and samples collected at 0, 2, or 24 hours post-treatment. CD4, CD8, and CD19 cells from a, blood, b, lymph, c, lymph node, and d, spleen, and CD4 SP, CD8 SP, CD4+CD8+ DP, and CD4−CD8− DN from thymus (e) were quantitated by flow cytometry. Symbols represent means ± SD and graphs are of data compiled from two experiments. 0 hours, n = 5; 2 hours, n = 6 24 hours, n = 4 f, WT and Apom−/− mice were treated with AUY954 (AUY; 1 mg/kg), g, SEW2871 (SEW; 20 mg/kg), or respective vehicle controls. 24 hours post-treatment, CD4, CD8, and CD19 cells in the blood were quantitated by flow cytometry. Bars represent means ± SD. n = 4 for all treatment groups and data are representative of two experiments.
Extended Data Fig 5. Multiparameter flow cytometry gating scheme for determination of CLP and other bone marrow populations.
a, Cells are first gated as Lineage (Lin−) and IL-7Rα+. Cells are then gated by Flt3 (Flk2/CD135) versus IL-7Rα expression, then further gated by cKit versus Sca1 expression to define common lymphoid progenitors (CLP). Representative staining examples of WT (top) or Apom−/− (bottom) BM cells are shown. b, Representative flow cytometric plot and c, quantitation of B220+CD11b− and CD11b+B220− cells generated from CLP in vitro. CLP, gated according to the gating hierarchy shown in (a), were sorted from BM of WT mice and incubated in methylcellulose medium containing growth factors to support both lymphoid and myeloid lineage development. Cells were analyzed for B220 and CD11b expression after 12d of culture. n = 6. d, Percent BrdU incorporation by LSK (left) or CLP (right) in BM of WT (red) or Apom−/− (blue) mice in two independent experiments (A and B). *p < 0.05 versus WT; **p = 0.006 versus WT; ***p = 0.0009 versus WT. Equality of variance was determined by an F test. Bars represent means and circles represent values obtained from individual mice. e, IL-7 protein in bone marrow supernatants from WT and Apom−/− mice were quantified by ELISA. n = 6 combined from two studies. Bars represent mean ± SD. f, Representative histogram of IL-7Rα (CD127) expression on the surface of WT (red) or Apom−/− (blue) CLP. The fluorescence minus one (FMO) control is represented by the grey filled histogram.
Extended Data Fig 6. Treatment with the S1P1 modulator FTY720 or the S1P1- specific agonist AUY954 suppresses BrdU incorporation by LSK and CLP in Apom−/− bone marrow.
Percent BrdU incorporation 24 hours post-treatment with (a) 0.5 mg/kg FTY720 or (b) 1.0 mg/kg AUY954. (a) WT, n = 4; Apom−/−, n = 5 for vehicle-treated and WT, n = 7; Apom−/−, n = 8 for FTY720-treated groups. (b) Vehicle-treated, n = 3; AUY954-treated, n = 6.. Bars represent means ± SD and data are compiled from two experiments. *p < 0.05 versus WT; §p < 0.05 versus vehicle-treated control.
Extended Data Fig 7. Over-expression of S1P1 results in marked decreases in lymphocyte populations in the thymus and secondary lymphoid organs.
a, Representative flow cytometry plots and quantitative MFI of S1P1 expression by Lin− cells from S1pr1 OE and WT littermates. n = 3. b, Relative expression levels of S1pr1 mRNA in bone marrow cells of S1pr1 OE mice relative to WT mice, as determined by multiplex qRT-PCR. c, Representative agarose gel of Cre activation and excision of the floxedsStop cassette as assessed by PCR of genomic DNA from bone marrow cells of S1pr1 OE, lox/stop/lox littermate, or WT littermate. Arrows indicate amplified DNA fragments corresponding to undeleted or deleted segments
Four days after the final dose of tamoxifen, CD4+, CD8+, and CD19+ cells in (d) brachial and inguinal lymph nodes and (e) spleen, and (f) thymic CD4+CD8+ double positive (DP), CD4 and CD8 single positive (CD4 or CD8 sp), total double negative (DN), and double negative subpopulations DN2, DN3, and DN4 were quantified by flow cytometry in S1pr1 OE mice and WT littermates. Bars represent means ± SD; S1pr1 OE, n = 6; WT, n = 7 and data are compiled from two experiments.
Extended Data Fig 8. GFP expression by BM cells and splenocytes of S1P1 GFP signaling mice and stimulation of STAT5 or ERK1/2 phosphorylation in splenocytes.
a, Relative expression levels of S1pr1 mRNA in LSK and CLP from bone marrow, or splenic B or T cells of WT mice relative to mouse endothelial cells, as determined by multiplex qRT-PCR. Bars represent means and circles represent values obtained from individual mice. b, Representative histograms of GFP expression by LSK from BM of S1P1 GFP signaling mice (S1P1GS; green) or control (black) mice. c, Representative histogram of GFP expression by splenic B cells (CD19) from S1P1 GFP signaling mice (green) or control (black) mice, demonstrating high in vivo GFP expression. d, Representative immunofluorescence image of IL-7Rα+ cell with CLP morphology from BM of littermate control of S1P1 GFP signaling mice. Cells were subjected to the same selection process before immunofluorescence staining. IL-7Rα, red; blue, DAPI, (e and f) Staining of BM cells from S1P1 GFP signaling mouse littermate controls demonstrates IL-7Rα staining specificity: cells with (e) CLP morphology stained with secondary alone or (f) myeloid cell morphology from BM stained with anti-IL-7Rα exhibit no IL-7Rα positivity. IL-7Rα, red; blue, DAPI. g, pSTAT5 staining after in vitro stimulation of WT splenocytes with IL-7 (10 ng/mL) for 15 minutes. CD19+ cells serve as positive controls for pSTAT5 staining. CD11b+ cells serve as negative controls, since they do not have IL-7R and therefore do not respond to IL-7 stimulation with STAT5 phosphorylation. h, pERK1/2 staining after in vitro stimulation of WT splenocytes with PMA (5 ng/mL) for 15 minutes. CD19+ cells serve as positive controls for pERK1/2 staining.
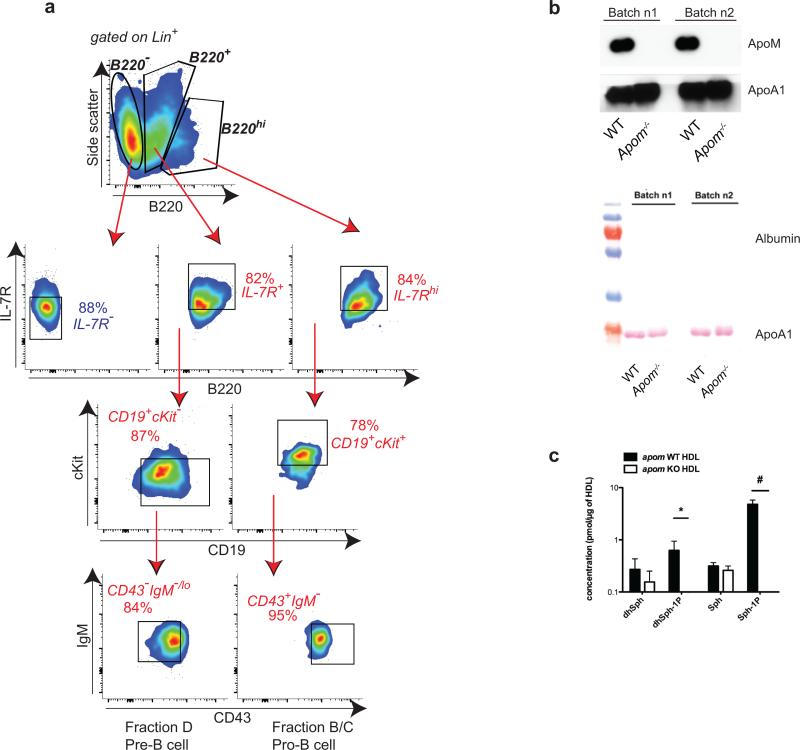
Extended Data Fig 9. In vitro lymphopoiesis in the presence of ApoM+HDL generates B cells at different stages of development.
a, Phenotyping of B220+ cell populations generated from WT Lin− BM after eight days of culture in methylcellulose medium. Initially, cells were gated as B220−, B220+, or B220hi. From populations expressing B220, pro-B cell (Hardy fractions B/C) and pre-B cell (Hardy fraction D) equivalents were identified. Pro-B cells were defined as IL-7Rhi, CD19+, cKit+, CD43+, and IgM−. Pre-B cells were defined as IL-7R+, CD19+, cKit−, CD43−, and IgM−/lo. b, Western blot analysis of two batches of mouse HDL (Batches n1 and n2) isolated from WT or Apom−/− mice showing the absence of contaminating albumin. c, Liquid chromatography tandem mass spectrometric (LC-MS/MS) analysis of HDL isolated from pooled plasmas of WT or Apom−/− mice. *p <0.05, #p < 0.005. n = 3. dhSph, dihydrosphingosine; dhSph-1P, dihydro-sphingosine 1-phosphate; Sph, Sphingosine; Sph-1P, Sphingosine 1-phosphate.
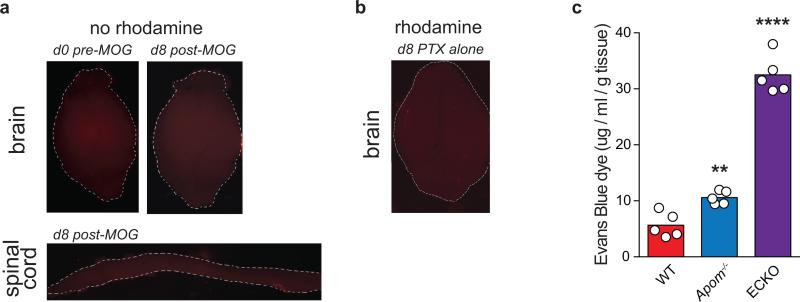
Extended Data Fig 10.
a, Representative photographs of auto-fluorescence in whole brains or spinal cord in WT mice at d0 or d8 post-MOG35-55 immunization. No rhodamine denotes tissues from animals that were not injected with TMR-dextran. b, Representative photograph of whole brain 16h after TMR-injection of a mouse injected with pertussis toxin (PTX) alone, without accompanying MOG35-55 immunization. c, Pulmonary vascular permeability as determined by Evans Blue dye extravasation in wild-type (WT), Apom−/−, and S1P1 EC-specific knockout (ECKO) mice . Bars represent means and circles represent values from individual animals. **p < 0.005, ****p < 0.0001, as compared to WT controls.
Acknowledgments
The authors thank Carl Nathan, Gary Koretzky and Ralph Nachman for critical comments, Christina Christoffersen and Lars Bo Nielsen for the Apom−/− and ApomTg mice and discussions, Volker Brinkmann and Novartis Pharma, A.G. for the kind gifts of FTY720 and AUY954, Marie Sanson for the help with HDL purification, Yinxiang Huang for help with the EAE model and Jason McCormick for assistance with FACS. V.A.B. is a Leon Levy Research Fellow of the Weill Cornell Medical College Brain and Mind Institute. Research was supported by grants to V.A.B. (NIH F32 CA14211 and NYS C026878), T. H. (NIH HL67330, HL70694, HL89934, and Fondation LeDucq), R.L.P (Intramural program of the NIDDK, NIH, and Fondation LeDucq), M.H. and L.S. (Fondation LeDucq) the Lipidomics Shared Resource, Hollings Cancer Center, Medical University of South Carolina (P30 CA138313) and the Lipidomics Core in the SC Lipidomics and Pathobiology COBRE (P20 RR017677).
Footnotes
Author contributions
V.A.B. designed and performed the experiments, analyzed and interpreted data, and wrote the manuscript. S.G., E.E., C.L., and S.S. performed experiments and analyzed data. Y.H., L.S., and M.H.H. contributed to EAE studies. R.L.P and M.K. contributed to the reporter mice studies. T.H. supervised the overall project, designed experiments, interpreted data, and wrote the manuscript. All authors read and commented on the manuscript.
The authors declare no competing financial interests.
References
- 1.Cyster JG, Schwab SR. Sphingosine-1-phosphate and lymphocyte egress from lymphoid organs. Annu. Rev. Immunol. 2012;30:69–94. doi: 10.1146/annurev-immunol-020711-075011. [DOI] [PubMed] [Google Scholar]
- 2.Schwab SR, et al. Lymphocyte sequestration through S1P lyase inhibition and disruption of S1P gradients. Science. 2005;309:1735–1739. doi: 10.1126/science.1113640. [DOI] [PubMed] [Google Scholar]
- 3.Christoffersen C, et al. Endothelium-protective sphingosine-1-phosphate provided by HDL-associated apolipoprotein M. Proc. Natl. Acad. Sci. U.S.A. 2011;108 doi: 10.1073/pnas.1103187108. [DOI] [PMC free article] [PubMed] [Google Scholar]
- 4.Kono M, et al. Sphingosine-1-phosphate receptor 1 reporter mice reveal receptor activation sites in vivo. J. Clin. Invest. 2014;124:2076–2086. doi: 10.1172/JCI71194. [DOI] [PMC free article] [PubMed] [Google Scholar]
- 5.Furlan R, Cuomo C, Martino G. Animal models of multiple sclerosis. Methods Mo.l Biol. 2009;549:157–173. doi: 10.1007/978-1-60327-931-4_11. [DOI] [PubMed] [Google Scholar]
- 6.Hannun Y, Obeid L. Principles of bioactive lipid signalling: lessons from sphingolipids. Nat. Rev. Mol. Cell Biol. 2008;9:139–150. doi: 10.1038/nrm2329. [DOI] [PubMed] [Google Scholar]
- 7.Chun J, Hla T, Lynch KR, Spiegel S, Moolenaar WH. International Union of Basic and Clinical Pharmacology. LXXVIII. Lysophospholipid receptor nomenclature. Pharmacol. Rev. 2010;62:579–587. doi: 10.1124/pr.110.003111. [DOI] [PMC free article] [PubMed] [Google Scholar]
- 8.Faber K, Axler O, Dahlbäck B, Nielsen LB. Characterization of apoM in normal and genetically modified mice. J. Lipid Res. 2004;45:1272–1278. doi: 10.1194/jlr.M300451-JLR200. [DOI] [PubMed] [Google Scholar]
- 9.Christoffersen C, et al. Isolation and characterization of human apolipoprotein M-containing lipoproteins. J. Lipid Res. 2006;47:1833–1843. doi: 10.1194/jlr.M600055-JLR200. [DOI] [PubMed] [Google Scholar]
- 10.Kimura T, et al. Sphingosine 1-phosphate may be a major component of plasma lipoproteins responsible for the cytoprotective actions in human umbilical vein endothelial cells. J. Biol. Chem. 2001;276:31780–31785. doi: 10.1074/jbc.M104353200. [DOI] [PubMed] [Google Scholar]
- 11.Allende ML, Dreier JL, Mandala S, Proia RL. Expression of the sphingosine 1-phosphate receptor, S1P1, on T-cells controls thymic emigration. J. Biol. Chem. 2004;279:15396–15401. doi: 10.1074/jbc.M314291200. [DOI] [PubMed] [Google Scholar]
- 12.Brinkmann V, et al. Fingolimod (FTY720): discovery and development of an oral drug to treat multiple sclerosis. Nat. Rev. Drug Discov. 2010;9:883–897. doi: 10.1038/nrd3248. [DOI] [PubMed] [Google Scholar]
- 13.Garris CS, et al. Defective sphingosine 1-phosphate receptor 1 (S1P1) phosphorylation exacerbates TH17-mediated autoimmune neuroinflammation. Nat. Immunol. 2013;14:1166–1172. doi: 10.1038/ni.2730. [DOI] [PMC free article] [PubMed] [Google Scholar]
- 14.Liu G, Yang K, Burns S, Shrestha S, Chi H. The S1P1 mTOR axis directs the reciprocal differentiation of TH1 and Treg cells. Nat. Immunol. 2010 doi: 10.1038/ni.1939. [DOI] [PMC free article] [PubMed] [Google Scholar]
- 15.Jung B, et al. Flow-Regulated Endothelial S1P Receptor-1 Signaling Sustains Vascular Development. Dev. Cell. 2012;23:600–610. doi: 10.1016/j.devcel.2012.07.015. [DOI] [PMC free article] [PubMed] [Google Scholar]
- 16.Jo E, et al. S1P1-selective in vivo-active agonists from high-throughput screening: off-the-shelf chemical probes of receptor interactions, signaling, and fate. Chem.Biol. 2005;12:703–715. doi: 10.1016/j.chembiol.2005.04.019. [DOI] [PubMed] [Google Scholar]
- 17.Thangada S, et al. Cell-surface residence of sphingosine 1-phosphate receptor 1 on lymphocytes determines lymphocyte egress kinetics. J. Exp. Med. 2010;207:1475–1483. doi: 10.1084/jem.20091343. [DOI] [PMC free article] [PubMed] [Google Scholar]
- 18.Yvan-Charvet L, et al. ATP-binding cassette transporters and HDL suppress hematopoietic stem cell proliferation. Science. 2010;328:1689–1693. doi: 10.1126/science.1189731. [DOI] [PMC free article] [PubMed] [Google Scholar]
- 19.Massberg S, et al. Immunosurveillance by hematopoietic progenitor cells trafficking through blood, lymph, and peripheral tissues. Cell. 2007;131:994–1008. doi: 10.1016/j.cell.2007.09.047. [DOI] [PMC free article] [PubMed] [Google Scholar]
- 20.Kondo M, Weissman IL, Akashi K. Identification of clonogenic common lymphoid progenitors in mouse bone marrow. Cell. 1997;91:661–672. doi: 10.1016/s0092-8674(00)80453-5. [DOI] [PubMed] [Google Scholar]
- 21.Beck TC, Gomes AC, Cyster JG, Pereira JP. CXCR4 and a cell-extrinsic mechanism control immature B lymphocyte egress from bone marrow. J. Exp. Med. 2014 doi: 10.1084/jem.20140457. [DOI] [PMC free article] [PubMed] [Google Scholar]
- 22.Westerterp M, et al. Regulation of hematopoietic stem and progenitor cell mobilization by cholesterol efflux pathways. Cell Stem Cell. 2012;11:195–206. doi: 10.1016/j.stem.2012.04.024. [DOI] [PMC free article] [PubMed] [Google Scholar]
- 23.Armstrong AJ, Gebre AK, Parks JS, Hedrick CC. ATP-binding cassette transporter G1 negatively regulates thymocyte and peripheral lymphocyte proliferation. J. Immunol. 2010;184:173–183. doi: 10.4049/jimmunol.0902372. [DOI] [PMC free article] [PubMed] [Google Scholar]
- 24.Feng H, et al. Deficiency of scavenger receptor BI leads to impaired lymphocyte homeostasis and autoimmune disorders in mice. Arterioscler. Thromb. Vasc. Biol. 2011;31:2543–2551. doi: 10.1161/ATVBAHA.111.234716. [DOI] [PMC free article] [PubMed] [Google Scholar]
- 25.Mazzucchelli R, Durum SK. Interleukin-7 receptor expression: intelligent design. Nat. Rev. Immunol. 2007;7:144–154. doi: 10.1038/nri2023. [DOI] [PubMed] [Google Scholar]
- 26.Clark MR, Mandal M, Ochiai K, Singh H. Orchestrating B cell lymphopoiesis through interplay of IL-7 receptor and pre-B cell receptor signalling. Nat. Rev. Immunol. 2014;14:69–80. doi: 10.1038/nri3570. [DOI] [PMC free article] [PubMed] [Google Scholar]
- 27.Oo ML, et al. Engagement of S1P1-degradative mechanisms leads to vascular leak in mice. J. Clin. Invest. 2011;121:2290–2300. doi: 10.1172/JCI45403. [DOI] [PMC free article] [PubMed] [Google Scholar]
- 28.Weinstock-Guttman B, et al. Serum lipid profiles are associated with disability and MRI outcomes in multiple sclerosis. J. Neuroinflammation. 2011;8:127. doi: 10.1186/1742-2094-8-127. [DOI] [PMC free article] [PubMed] [Google Scholar]
- 29.Weinstock-Guttman B, Zivadinov R, Ramanathan M. Inter-dependence of vitamin D levels with serum lipid profiles in multiple sclerosis. J. Neurol. Sci. 2011;311:86–91. doi: 10.1016/j.jns.2011.07.024. [DOI] [PubMed] [Google Scholar]
- 30.Choi JW, et al. FTY720 (fingolimod) efficacy in an animal model of multiple sclerosis requires astrocyte sphingosine 1-phosphate receptor 1 (S1P1) modulation. Proc. Natl. Acad. Sci. U.S.A. 2010;108:751–756. doi: 10.1073/pnas.1014154108. [DOI] [PMC free article] [PubMed] [Google Scholar]
- 31.Christoffersen C, et al. Effect of apolipoprotein M on high density lipoprotein metabolism and atherosclerosis in low density lipoprotein receptor knock-out mice. J. Biol. Chem. 2008;283:1839–1847. doi: 10.1074/jbc.M704576200. [DOI] [PubMed] [Google Scholar]
- 32.Pitulescu ME, Schmidt I, Benedito R, Adams RH. Inducible gene targeting in the neonatal vasculature and analysis of retinal angiogenesis in mice. Nat. Protoc. 2010;5:1518–1534. doi: 10.1038/nprot.2010.113. [DOI] [PubMed] [Google Scholar]
- 33.Matloubian M, et al. Lymphocyte egress from thymus and peripheral lymphoid organs is dependent on S1P receptor 1. Nature. 2004;427:355–360. doi: 10.1038/nature02284. [DOI] [PubMed] [Google Scholar]
- 34.Kalaitzidis D, Neel BG. Flow-cytometric phosphoprotein analysis reveals agonist and temporal differences in responses of murine hematopoietic stem/progenitor cells. PloS one. 2008;3:e3776. doi: 10.1371/journal.pone.0003776. doi:10.1371/journal.pone.0003776. [DOI] [PMC free article] [PubMed] [Google Scholar]
- 35.Ding L, Morrison SJ. Haematopoietic stem cells and early lymphoid progenitors occupy distinct bone marrow niches. Nature. 2013;495:231–235. doi: 10.1038/nature11885. [DOI] [PMC free article] [PubMed] [Google Scholar]
- 36.Akashi K, Traver D, Miyamoto T, Weissman IL. A clonogenic common myeloid progenitor that gives rise to all myeloid lineages. Nature. 2000;404:193–197. doi: 10.1038/35004599. [DOI] [PubMed] [Google Scholar]
- 37.Passegue E, Wagers AJ, Giuriato S, Anderson WC, Weissman IL. Global analysis of proliferation and cell cycle gene expression in the regulation of hematopoietic stem and progenitor cell fates. J. Exp. Med. 2005;202:1599–1611. doi: 10.1084/jem.20050967. [DOI] [PMC free article] [PubMed] [Google Scholar]
- 38.Krutzik PO, Clutter MR, Nolan GP. Coordinate analysis of murine immune cell surface markers and intracellular phosphoproteins by flow cytometry. J. Immunol. 2005;175:2357–2365. doi: 10.4049/jimmunol.175.4.2357. [DOI] [PubMed] [Google Scholar]
- 39.Bielawski J, et al. Comprehensive quantitative analysis of bioactive sphingolipids by high-performance liquid chromatography-tandem mass spectrometry. Meth. Mol. Biol. 2009;579:443–467. doi: 10.1007/978-1-60761-322-0_22. [DOI] [PubMed] [Google Scholar]
- 40.Pham THM, Okada T, Matloubian M, Lo CG, Cyster JG. S1P1 receptor signaling overrides retention mediated by G alpha i-coupled receptors to promote T cell egress. Immunity. 2008;28:122–133. doi: 10.1016/j.immuni.2007.11.017. [DOI] [PMC free article] [PubMed] [Google Scholar]
- 41.Tough DF, Sprent J, Stephens GL. Measurement of T and B cell turnover with bromodeoxyuridine. Curr. Protoc. Immunol. 2007 doi: 10.1002/0471142735.im0407s77. Chapter 4, Unit 4.7. [DOI] [PubMed] [Google Scholar]
- 42.Wright DE, et al. Cyclophosphamide/granulocyte colony-stimulating factor causes selective mobilization of bone marrow hematopoietic stem cells into the blood after M phase of the cell cycle. Blood. 2001;97:2278–2285. doi: 10.1182/blood.v97.8.2278. [DOI] [PubMed] [Google Scholar]
- 43.Brown C, Blaho V, Loiacono C. Susceptibility to experimental Lyme arthritis correlates with KC and monocyte chemoattractant protein-1 production in joints and requires neutrophil recruitment via CXCR2. J. Immunol. 2003;171:893–901. doi: 10.4049/jimmunol.171.2.893. [DOI] [PubMed] [Google Scholar]
- 44.Hammad SM, et al. Blood sphingolipidomics in healthy humans: impact of sample collection methodology. J. Lipid Res. 2010;51:3074–3087. doi: 10.1194/jlr.D008532. [DOI] [PMC free article] [PubMed] [Google Scholar]
- 45.Hammad SM, Al Gadban MM, Semler AJ, Klein RL. Sphingosine 1-phosphate distribution in human plasma: associations with lipid profiles. J. Lipids. 2012;2012:180705. doi: 10.1155/2012/180705. [DOI] [PMC free article] [PubMed] [Google Scholar]
- 46.Min JK, Yoo HS, Lee EY, Lee WJ, Lee YM. Simultaneous quantitative analysis of sphingoid base 1-phosphates in biological samples by o-phthalaldehyde precolumn derivatization after dephosphorylation with alkaline phosphatase. Anal. Biochem. 2002;303:167–175. doi: 10.1006/abio.2002.5579. [DOI] [PubMed] [Google Scholar]
- 47.Wolfrum C, Poy MN, Stoffel M. Apolipoprotein M is required for prebeta-HDL formation and cholesterol efflux to HDL and protects against atherosclerosis. Nat. Med. 2005;11:418–422. doi: 10.1038/nm1211. [DOI] [PubMed] [Google Scholar]
- 48.Pino PA, Cardona AE. Isolation of brain and spinal cord mononuclear cells using percoll gradients. J. Vis. Exp. 2011 doi: 10.3791/2348. doi:10.3791/2348. [DOI] [PMC free article] [PubMed] [Google Scholar]


