Abstract
Drug resistance invariably limits the clinical efficacy of targeted therapy with kinase inhibitors against cancer1,2. Here we show that targeted therapy with BRAF, ALK, or EGFR kinase inhibitors induces a complex network of secreted signals in drug-stressed melanoma and lung adenocarcinoma cells. This therapy-induced secretome (TIS) stimulates the outgrowth, dissemination, and metastasis of drug-resistant cancer cell clones and supports the survival of drug-sensitive cancer cells, contributing to incomplete tumour regression. The vemurafenib reactive secretome in melanoma is driven by down-regulation of the transcription factor FRA1. In situ transcriptome analysis of drug-resistant melanoma cells responding to the regressing tumour microenvironment revealed hyperactivation of multiple signalling pathways, most prominently the AKT pathway. Dual inhibition of RAF and PI3K/AKT/mTOR pathways blunted the outgrowth of the drug-resistant cell population in BRAF mutant melanoma tumours, suggesting this combination therapy as a strategy against tumour relapse. Thus, therapeutic inhibition of oncogenic drivers induces vast secretome changes in drug-sensitive cancer cells, paradoxically establishing a tumour microenvironment that supports the expansion of drug-resistant clones, but is susceptible to combination therapy.
Kinase inhibitors such as vemurafenib, erlotinib or crizotinib have shown clinical efficacy in melanoma with BRAF mutations, or in lung adenocarcinoma with EGFR mutations or ALK translocations, respectively3–6. Though complete responses are rare, the vast majority of patients show partial tumour regression or disease stabilization. However, drug resistance invariably develops and most patients progress within 6–12 months3–16, representing a common complication of targeted therapies that hampers long-term treatment success. The rapid emergence of clinical drug resistance may be facilitated by a small number of pre-existing cancer cells that are intrinsically resistant or poised to quickly adapt to drug treatment17–19. How these minority clones of drug-resistant cells react to the dramatic changes in the microenvironment during tumour regression is not known. A better understanding of this process could lead to treatments that improve the efficacy of current targeted anti-cancer drugs.
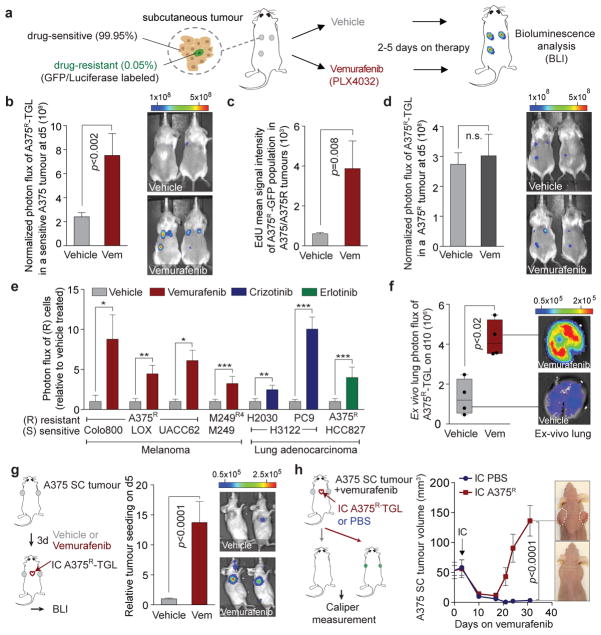
In order to model therapeutic targeting of heterogeneous tumour cell populations in vivo, we mixed a small percentage of vemurafenib-resistant A375 human melanoma cells (A375R), labelled with a TK-GFP-Luciferase vector (TGL), together with a majority of non-labelled, vemurafenib-sensitive A375 cells, and injected the admixture (A375/A375R, 99.95/0.05%) subcutaneously in mice (Extended Data Fig. 1a). After the tumours were established, we treated the mice with vemurafenib or vehicle, and monitored the growth of resistant cells by bioluminescent imaging (BLI) in vivo (Fig. 1a). While vemurafenib treatment decreased the volume of sensitive tumours (A375 alone) (Extended Data Fig. 1b), the number of admixed resistant cells in regressing tumours (A375/A375R) significantly increased compared to vehicle-treated controls (Fig. 1b). GFP staining confirmed increased numbers of resistant cells in regressing tumours, and EdU or BrdU staining confirmed their increased proliferation rate compared to the vehicle treated controls (Fig. 1c, Extended Data Fig. 1c, d). Tumours comprised of only resistant cells showed no growth difference when treated with vehicle or vemurafenib (Fig. 1d), indicating that the growth advantage of resistant cells in regressing tumours was not caused by direct effects of vemurafenib on cancer or stromal cells.
Figure 1. The regressing tumour microenvironment stimulates the outgrowth, infiltration and metastasis of drug-resistant clones.
a, Schematic of the experimental setup. b, Bioluminescent signal of drug-resistant A375R-TGL cells in vemurafenib-sensitive, A375 tumours, treated with vehicle or vemurafenib for 5 days (vehicle, n = 36; vemurafenib, n = 15 tumours). c, EdU incorporation in A375R-TGL cells in A375/A375R-TGL tumours treated with vehicle or vemurafenib for 4 days, as determined by FACS (vehicle, n = 8; vemurafenib, n = 6 tumours). d, Bioluminescent signal of A375R-TGL tumours alone, treated with vehicle or vemurafenib for 5 days (vehicle, n = 38; vemurafenib, n = 15 tumours). e, Bioluminescent signal of TGL-expressing drug-resistant cancer cells (A375R, M249R4, PC9, H2030) in drug-sensitive tumours (Colo800, LOX, UACC62, M249, H3122, HCC827) treated with vehicle or drugs (vemurafenib, crizotinib, erlotinib) for 5 days (n (from left to right on the graph, in this order) = 6, 7, 12, 12, 9, 9, 25, 26, 9, 12, 12, 12, 16, 11 tumours). f, Spontaneous lung metastasis by A375R cells in mice bearing A375/A375R-TGL tumours treated with vehicle or vemurafenib (10 days), visualized by BLI (n = 4). g, Seeding of A375R-TGL cells from the circulation to unlabelled, subcutaneous A375 tumours of mice treated with vehicle or vemurafenib. Signal in the tumour was quantified by BLI (vehicle, n = 30; vemurafenib, n = 34 tumours; three independent experiments combined). h, Treatment response, determined by tumour size, of subcutaneous A375 tumours allowed to be seeded by A375R−TGL cells from the circulation or mock injected (vehicle, n = 16; vemurafenib, n = 8 tumours). Data in b–e,g,h, are average; error bars represent s.e.m; data in f, center line is median, whiskers are min. to max. P values shown were calculated using a two-tailed Mann-Whitney test (* p<0.05, ** p<0.01, *** p<0.001, n.s.= not significant).
Treatment of mixed A375/A375R tumours with dabrafenib, another BRAF inhibitor (RAFi), or doxycycline-induced knockdown of BRAF had similar effects (Extended Data Fig. 1e–g). In line with these findings, A375R cells co-implanted with other vemurafenib-sensitive melanoma cell lines (Colo800, LOX, and UACC62) also showed an up to 8-fold growth increase compared to vehicle-treated control groups (Fig. 1e). Growth acceleration of the resistant population in a regressing tumour was also observed in the patient-derived8 melanoma cell line M249 and its vemurafenib-resistant derivative M249R4, driven by an NRAS mutation, a clinically relevant resistance mechanism (Fig. 1e, Extended Data Fig. 1h). In immunocompetent mice, vemurafenib treatment of tumours formed by melanoma cell lines derived from BRAFV600E/CDKN2A−/−/PTEN−/− mice (YUMM1.1, YUMM1.7) also promoted growth of the admixed vemurafenib-resistant cells (YUMM 1.7R, B16) (Extended Data Fig. 1i, j).
Crizotinib or erlotinib treated mice harbouring tumours formed by ALK-driven (H3122) or EGFR-driven (HCC827) human lung adenocarcinoma cells, respectively, admixed with minority clones of intrinsically resistant cells from the same cell lineage (lung adenocarcinoma cells H2030, PC9) or melanoma cells (A375R) also led to increased outgrowth of the resistant cells (Fig. 1e, Extended Data Fig. 1k–m). Local growth acceleration of resistant cells in the regressing subcutaneous tumours resulted in higher lung metastatic burden (Fig. 1f). Thus, drug-resistant cancer cells benefit from therapeutic targeting of surrounding drug-sensitive cells.
Circulating tumour cells (CTCs) can infiltrate and colonize tumours. This phenomenon, termed self-seeding20, may contribute to the distribution of resistant clones to multiple metastatic sites. Mice implanted with sensitive A375 tumours were treated with vehicle or vemurafenib, and intracardially injected with TGL-labelled A375R cells (Fig. 1g). A375R cells were more efficiently attracted to vemurafenib-treated regressing tumours compared to vehicle-treated controls with 95% (21/22) and 12.5% (2/16) efficiency, respectively, exhibiting substantial accumulation of resistant cells in regressing tumours by day 5 (Fig. 1g, Extended Data Fig. 1n). To evaluate the contribution of seeding by resistant CTCs to disease relapse, we intracardially injected resistant A375R cells or vehicle into tumour bearing mice and compared the tumour volume during vemurafenib treatment (Fig. 1h). Whereas the unseeded tumours in the control group showed extensive tumour regression, seeding by A375R cells led to rapid tumour relapse (Fig. 1h). These results suggest that tumours regressing on targeted therapy are potent attractors of resistant CTCs that may contribute to rapid tumour progression.
Tumours consist of a complex microenvironment composed of immune, stromal, and cancer cells21. Soluble mediators from this microenvironment can foster cancer growth and therapy resistance13,14,22–24. Considering that drug-sensitive cancer cells are the main population affected by targeted therapy, we hypothesized that signals derived from sensitive cancer cells in response to kinase inhibitors drive the outgrowth of drug-resistant cells. To test this hypothesis, we established an in vitro co-culture system and monitored the growth of TGL-expressing resistant cells (A375R, H2030) in the absence or presence of sensitive cells treated with kinase inhibitors or vehicle (Fig. 2a). Mimicking our in vivo findings, co-culture with vemurafenib-, crizotinib-, or erlotinib-treated sensitive cells significantly enhanced the growth of resistant cancer cells (Fig. 2a, Extended Data Fig. 2a–c).
Figure 2. The secretome of RAF and ALK inhibitor treated tumour cells increases proliferation and migration of drug-resistant cells and supports the survival of drug-sensitive cells.
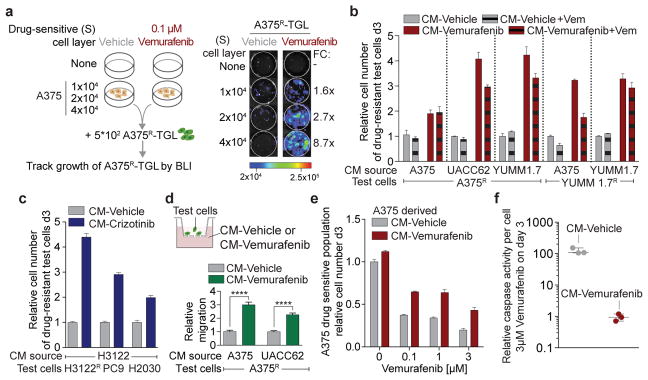
a, Schematic (left) and representative BLI images (right) after 7 days of co-culture. Average fold change (FC) of BLI signal from A375R-TGL cells in vemurafenib treated wells relative to vehicle treated control wells is depicted on the right (n = 4 biological replicates). b, c, Conditioned media (CM) was derived from drug-sensitive cells, treated with vehicle, vemurafenib, or crizotinib. Drug resistant cells were grown in this CM and the cell number was determined on day 3. Drug-sensitive and drug-resistant cell lines and drugs used to generate CM as indicated. b, (n = 3 biological replicates). c, (n = 6 biological replicates). d, Schematic diagram of the migration assay (upper panel) and relative migration of A375R cells towards CM from different sources as indicated (lower panel, n = 10 FOV). P values were calculated using a two-tailed Mann-Whitney test (**** p<0.0001). e, Survival assay of drug-sensitive A375 cells cultured in CM and treated with vemurafenib, assessed on day 3(n = 3 biological replicates). f, Apoptosis rate of A375 cells cultured in CM and treated with vemurafenib (3μM) (n = 3 biological replicates). Data are presented as average; error bars represent s.e.m.
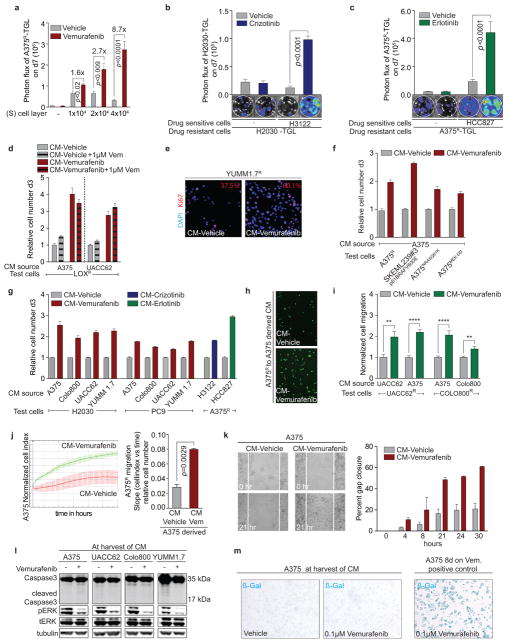
We derived conditioned media (CM) from vemurafenib-sensitive melanoma cells cultured in the absence (CM-vehicle) or presence of vemurafenib (CM-vemurafenib). CM-vemurafenib accelerated the proliferation of drug-resistant cells, with different clinically relevant resistance mechanisms, as determined by cell viability assays and Ki67 staining (Fig. 2b, Extended Data Fig. 2d–f). Similarly, CM from crizotinib- or erlotinib-treated sensitive lung adenocarcinoma cells stimulated proliferation of lung adenocarcinoma cells with intrinsic or acquired resistance (Fig. 2c) and across different cell lineages (Extended Data Fig. 2g). In addition, CM-vemurafenib elicited increased cell migration in trans-well migration and monolayer gap-closing assays (Fig. 2d, Extended Data Fig. 2h–j). CM-vemurafenib was also active on vemurafenib-sensitive cancer cells, increasing survival and suppressing the apoptotic caspase activity up to 100-fold in these cells when treated with vemurafenib in vitro (Fig. 2e, f). Since all biologically active CM were harvested prior to cell death or senescence, it is likely that the secretome is actively produced as a result of oncogene inhibition (Extended Data Fig. 2l, m). These results demonstrate that BRAF, ALK, and EGFR mutant cells respond to therapeutic stress under targeted therapy by secreting factors that support the survival of drug sensitive cells and accelerate the growth of drug-resistant minority clones. The effects of this reactive secretome may augment previously reported resistance mechanisms including relief of feedback inhibition of intracellular signaling11,25, up-regulation of receptor tyrosine kinases26, or the supply of stromal cytokines14 that protect the drug-sensitive cells.
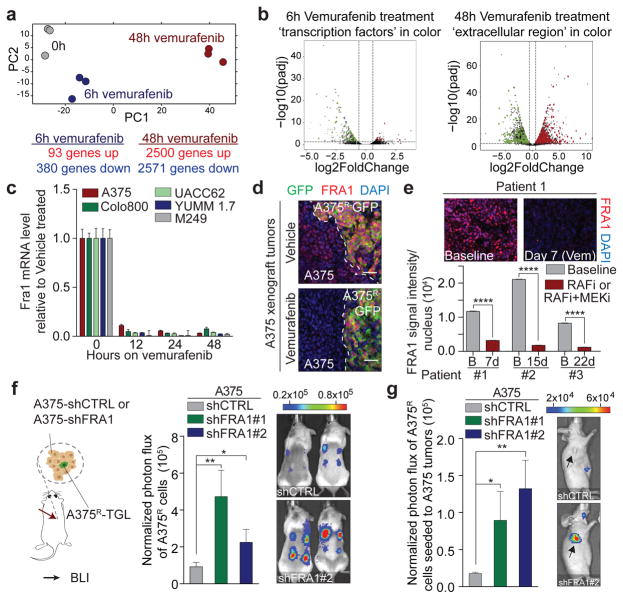
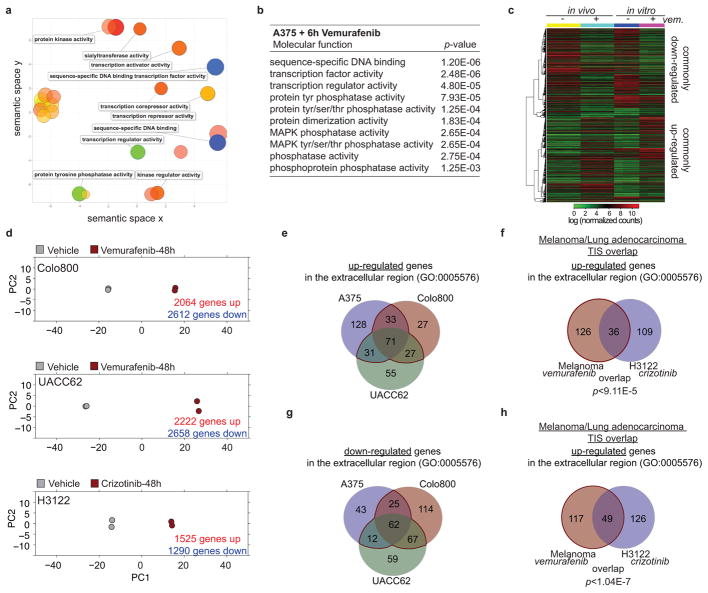
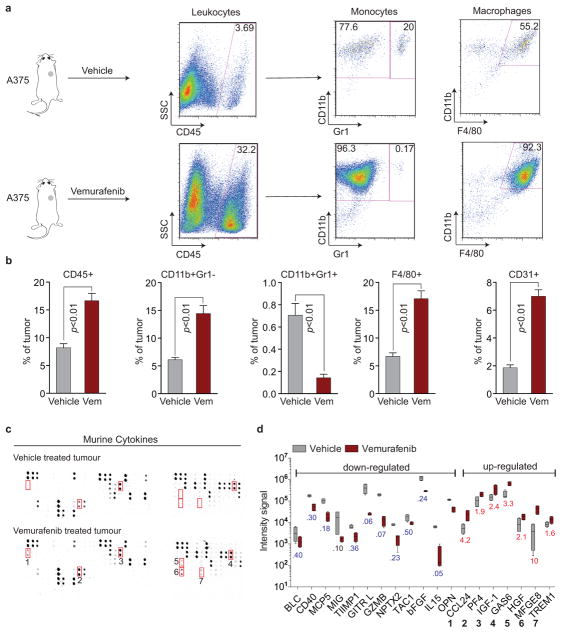
To identify relevant components and regulators of the reactive secretome, we analysed gene expression changes in sensitive A375 melanoma cells at different time points after vemurafenib exposure in vitro. After 6h on vemurafenib, 473 genes showed altered expression and pathway analysis revealed that these genes were enriched for transcriptional regulators (Fig. 3a, b, Extended Data Fig. 3a, b, Supplementary Table 1). After 48h, more than one third of the transcriptome was differentially expressed (>5000 genes; 405 genes encoding for proteins in the extracellular region GO:0005576), significantly overlapping with the gene expression changes of A375 tumours in vivo after 5 days of vemurafenib treatment (Fig. 3a, b, Extended Data Fig. 3c). Similar extensive gene expression changes were observed in Colo800 and UACC62 melanoma cells treated with vemurafenib and H3122 lung adenocarcinoma cells treated with crizotinib (Extended Data Fig 3d). Despite different cell lineages, different oncogenic drivers, and different targeted therapies we observed a significant overlap between the secretome of melanoma and lung adenocarcinoma cells (p<9.11E–5) (Extended Data Fig. 3e–h, Supplementary Table 1). Furthermore, changes in the secretome of vemurafenib-sensitive melanoma cells coincided with changes in the immune cell composition (Extended Data Fig. 4a, b), and with changes of soluble mediators derived from murine stromal cells such as IGF1 and HGF (Extended Data Fig. 4c, d). These data indicate a therapy-induced secretome (TIS), a response that consists of many up- and down-regulated secreted factors, permeates the regressing tumour microenvironment and stimulates cancer cells, likely also stromal cells.
Figure 3. FRA1 down-regulation during RAFi treatment drives the reactive secretome.
a, Principal component analysis of drug-sensitive A375 cells treated in vitro with vehicle or vemurafenib for 6h or 48h. b, Volcano plots show genes significantly deregulated by vemurafenib treatment after 6h (left) or 48h (right). Transcription factors (TF) and gene products in the extracellular region are depicted in green (down-regulated) and red (up-regulated) (n = 3 tumours) c, Relative mRNA levels of FRA1 during vemurafenib exposure [0.1–1 μM]. d, Representative IF staining of A375/A375R tumours for GFP (A375R, green) and FRA1 (red) after vehicle or vemurafenib treatment (5 days). e, Representative IF staining for FRA1 (red) of melanoma biopsy sections of patient #1. Below, nuclear FRA1 staining was quantified in three melanoma patients before and early-on therapy. f, Bioluminescent signal of A375R-TGL cells 6 days after subcutaneous co-implantation with A375 cells expressing control or two independent short hairpins for FRA1 (n = 16 tumours) g, Seeding of A375R-TGL cells to unlabelled tumours expressing control or two independent short hairpins for FRA1, determined by BLI (vehicle, n = 10; shFRA1#1, n = 10; shFRA1#2, n = 8 tumours). Data are presented as average; error bars represent s.e.m. P values shown were calculated using Student’s t-test (* p<0.05, ** p<0.01, **** p<0.0001).
To identify molecular drivers of the A375-TIS in response to vemurafenib, we integrated the data of differentially expressed transcription factors after 6h of vemurafenib treatment with the transcription factor binding motifs that were enriched at the promoters of differentially expressed genes in the secretome after 48h (Fig. 3a, b). This analysis highlighted FRA1 (FOSL1), a member of the AP1 transcription factor complex and effector of the ERK pathway27, as one of the putative upstream regulators of the TIS (Extended Data Fig. 5a). FRA1 was down-regulated in all drug-sensitive cells, but not in resistant cells, treated with vemurafenib, crizotinib, and erlotinib (Fig. 3c, d, Extended Data Fig. 5b–d). Biopsies from melanoma patients early during RAFi treatment confirmed vemurafenib-induced FRA1 down-regulation in clinical samples (Fig. 3e, Extended Data Fig. 5e, Extended Data Table 1).
In order to test the functional role of FRA1 in modulating the TIS, we used RNAi to inhibit FRA1 expression. Co-culture and conditioned media assays using A375-shFRA1 cells showed similar growth accelerating and chemotactic activity on A375R cells as vemurafenib treatment (Extended Data Fig. 6a–d). In line with these results, FRA1 knockdown in A375 cells induced transcriptional changes similar to those induced by vemurafenib (Extended Data Fig. 6e). A375R cells co-implanted with A375-shFRA1 or UACC62-shFRA1 cells also demonstrated increased growth in vivo (Fig. 3f, Extended Data Fig. 6f). A375-shFRA1 tumours attracted significantly more resistant cells from the circulation than tumours expressing the control vector (Fig. 3g). Thus, FRA1 down-regulation drives the induction of the tumour-promoting secretome of vemurafenib-treated cancer cells.
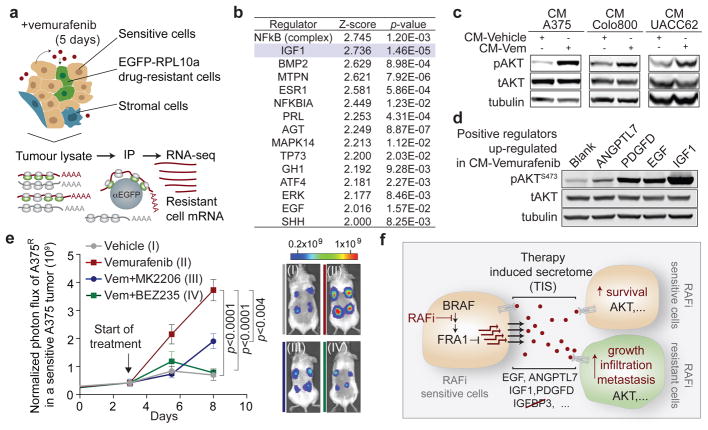
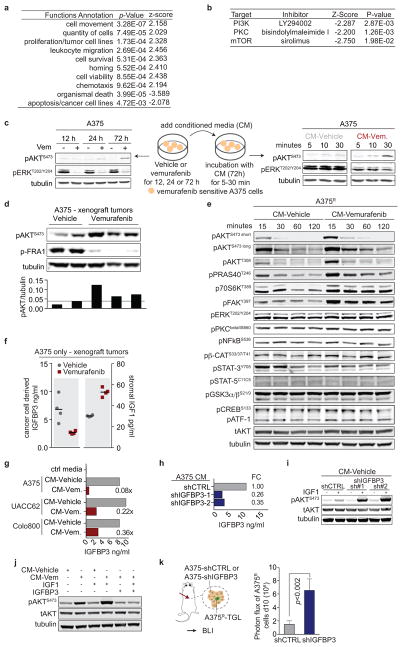
To determine the effect of the reactive secretome on the drug-resistant tumour subpopulation in a regressing tumour, we expressed the ribosomal protein L10a fused with green fluorescent protein (EGFP-RPL10a) in A375R cells, allowing the specific retrieval of transcripts from A375R cells by polysome immunoprecipitation for subsequent RNAseq analysis28 (Fig. 4a). In line with the in vivo phenotype of accelerated growth, the gene expression pattern of resistant cells in the regressing microenvironment was enriched for biological processes involved in cell viability, proliferation, and cell movement (Extended Data Fig. 7a). Pathway analysis of the expression data suggested activation of several pathways including PI3K/AKT, BMP-SMAD and NFkB (Fig. 4b). The hyperactivity of the PI3K/AKT pathway in this context also suggested a potential vulnerability of the cells to PI3K/mTOR inhibitors (Extended Data Fig. 7b). The pathway analysis-based prediction of PI3K/AKT activation was also reflected at the protein level in both resistant and sensitive cells in the presence of CM-vemurafenib in vitro and under vemurafenib treatment in vivo (Fig. 4c, Extended Data Fig. 7c, d). Moreover, PI3K/AKT emerged as the dominant TIS responsive pathway in a targeted immunoblot analysis of survival pathways in vitro (Extended Data Fig. 7e).
Figure 4. The therapy-induced secretome in melanoma promotes relapse by activating the AKT pathway in resistant cells.
a, Schematic diagram showing the isolation of polysome-associated transcripts from resistant cells by translating ribosome affinity profiling (TRAP) from tumours during treatment. b, Ingenuity upstream regulator analysis of gene expression profiles from A375R cells responding to a regressing tumour microenvironment (5 days of treatment; n = 3 tumours) c, Phosphorylation status of AKTS473 in A375R cells, stimulated for 15 min with various CM, as indicated by immunoblotting. d, Phosphorylation status of AKTS473 in A375R cells after stimulation with positive regulators of the AKT pathway, up-regulated in the melanoma-TIS; ANGPTL7 (5ug/ml, 30 min; up-regulated in A375, Colo800, UACC62), PDGFD (10ng/ml, 10 min; up-regulated in Colo800), EGF (10ng/ml, 10 min; up-regulated in A375), and IGF1 (10ng/ml, 10 min; up-regulated in UACC62). e, Mice bearing A375/A375R-TGL tumours were treated with drugs, growth of A375R cells was followed by BLI (vehicle, n = 14; vemurafenib, n = 16; vemurafenib+BEZ235, n = 16; vemurafenib+MK2206, n = 8 tumours). f, Graphical summary of the findings. Data are presented as average; error bars represent s.e.m. P values shown were calculated using a two-tailed Mann-Whitney test.
The TIS contained many mediators directly or indirectly activating the AKT pathway. Positive mediators that were up-regulated during therapy included IGF1, EGF, ANGPTL7, and PDGFD, each of which activated the AKT pathway in vitro (Fig. 4d). IGF1, one of the most potent activators of the AKT pathway is also abundantly expressed in the tumor stroma and is further up-regulated during targeted therapy (Extended Data Fig. 4c, 7f). In addition, levels of IGFBP-3, a negative regulator of IGF1, were markedly reduced in the TIS of all investigated cell lines, favoring increased AKT pathway activation in the presence of IGF1 and stimulation of proliferation of resistant cells in vivo (Extended Data Fig. 7f–k).
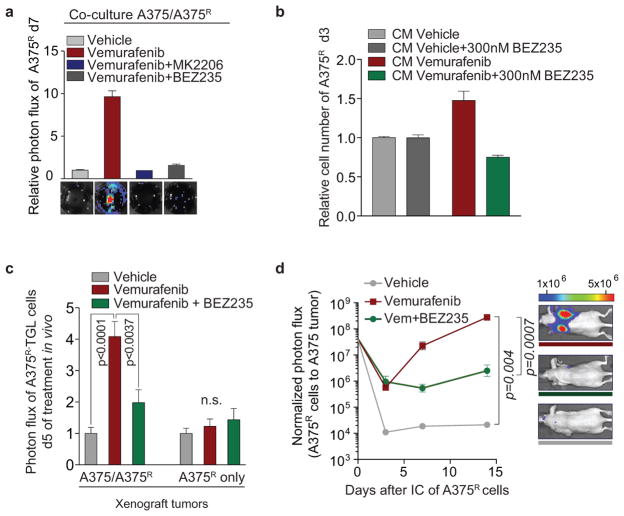
To test the role of AKT activation as a mediator of TIS-induced tumour proliferation, we combined vemurafenib with AKT/PI3K/mTOR inhibitors. In co-culture and proliferation experiments using CM, dual inhibition of the MAPK and AKT pathway diminished the growth benefit of the TIS (Extended Data Fig. 8a, b). We then treated mice with A375/A375R or A375R tumours with vemurafenib and AKT (MK2206) or PI3K/mTOR inhibitors (BEZ235). The combined inhibition of MAPK and PI3K/AKT/mTOR pathways significantly blunted the outgrowth of vemurafenib-resistant cells in the A375/A375R tumours (Fig. 4h). The growth inhibition was specific for the amplified proliferation in the regressing tumour microenvironment and had no effects on the growth of resistant cells alone (Extended Data Fig. 8c). Furthermore, the outgrowth of resistant A375R cells in tumour seeding assays was significantly reduced when regressing tumours were co-treated with BEZ235 (Extended Data Fig. 8d). Thus, the TIS induced proliferation is susceptible to therapeutic targeting.
The limited effectiveness of targeted therapies has been attributed to intracellular feedback loops and specific cytokines that support the survival of drug-sensitive cells. From these residual tumours, clones emerge that are intrinsically resistant to targeted therapy and are ultimately responsible for clinical relapse. Our work demonstrates that targeted inhibition of a cancer driver pathway can paradoxically promote these two aspects of drug resistance via induction of a complex, reactive secretome. This therapy-induced secretome (TIS) does not only enhance the survival of drug-sensitive cells, but also acutely accelerates the expansion and dissemination of drug-resistant clones. Rather than a cell death byproduct29,30, the TIS is a live cell response to inhibition of an oncogenic driver pathway, mediated by a concrete transcriptional program, and defined by specific alterations of intracellular signalling networks (Fig. 4g).
Our identification of AKT signalling as a mediator of TIS-induced tumour progression in BRAF-driven melanoma is in line with AKT activation in tumours observed in the clinic during vemurafenib treatment16. Patients treated with BRAF inhibitor rarely show full tumour regression3,4, and the remaining drug responsive tumour cells may remain a source of TIS for the duration of the treatment. Our results provide a rationale for combining PI3K/AKT/mTOR pathway inhibitors with inhibitors of the MAPK pathway in the treatment of these tumours. However, the breadth of the TIS and the generality of our findings across different cell lineages, drugs (vemurafenib, crizotinib, and erlotinib), and resistance mechanisms suggest that durable responses may require the combination of this type of agents with a radically different therapeutic modality.
Online-only Methods
Cell Culture
A375, M2498, and B16 cells were cultured in DMEM media; Colo800, UACC62, SKMEL239-clone#3, LOX, PC9, H2030, H3122, and HCC827 cells were cultured in RPMI media. YUMM 1.1 and YUMM 1.7 were cultured in DMEM/F12 media. GPG29 and 293T cells were used for retrovirus and lentivirus production, respectively. Both were maintained in DMEM media. All media contained 10% fetal bovine serum (FBS), 2mM L-Glutamine, 100IU/ml penicillin/streptomycin, and 1μg/ml amphotericin B, the media for GPG29 contained in addition 0.3mg/ml G418, 20ng/ml doxycycline, and 2μg/ml puromycin. All cells were grown in a humidified incubator at 37°C with 5% CO2 and were tested regularly for mycoplasma contamination. All cell lines used were negative for mycoplasma.
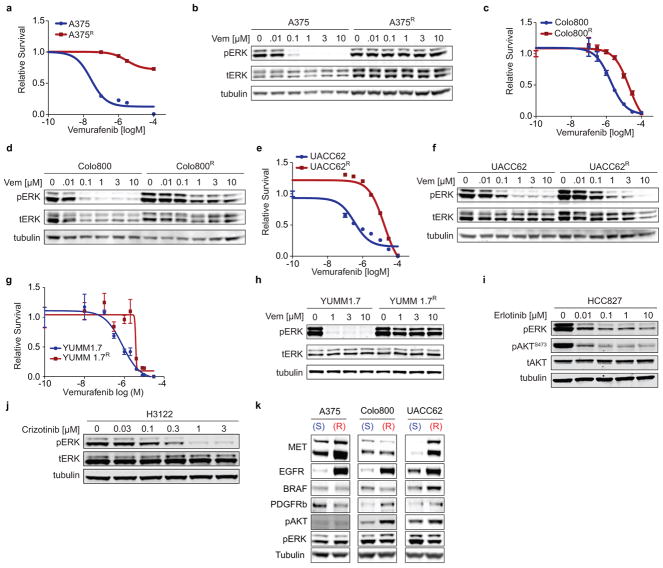
To generate vemurafenib-resistant melanoma cell lines, vemurafenib-sensitive cell lines were seeded at low density and exposed to 1–3μM vemurafenib (LC-Labs). After approximately 8 weeks of continuous vemurafenib exposure we derived resistant cell clones that were maintained on vemurafenib (1μM vemurafenib for M249R4, Colo800R, LOXR, UACC62R; 2μM vemurafenib for A375R, YUMM 1.7R). The same protocol was performed to generate a crizotinib resistant cell line from H3122 lung adenocarcinoma cells, which were selected and maintained with 300nM crizotinib. Drug-sensitive and resistant melanoma cell lines from A375, Colo800, UACC62 and YUMM 1.7 and the drug sensitive lung adenocarcionoma cell lines H3122 and HCC827 were exposed to increasing doses of vemurafenib and the number of cells was determined after 3 days and pERK levels after 1h of vemurafenib, crizotinib or erlotinib exposure (Extended Data Fig 9a–j). Receptor status was determined by Western blot and showed an increase in EGFR expression levels in all resistant lines examined as well as an increase in MET receptor expression in A375R and UACC62R cells compared to their parental, drug-sensitive cells (Extended Data Fig. 9k).
For co-culture assays sensitive cells were plated in 12-well or 24-well plates and allowed to adhere over night in regular growth media. Media was then replaced with low serum (2% FBS) media containing vehicle, 0.1μM vemurafenib, 0.3μM crizotinib, or 0.01μM erlotinib. For control wells media containing vehicle or 0.1μM vemurafenib, 0.3μM crizotinib, or 0.01μM erlotinib was plated at the same time. After 48h TGL expressing, resistant cells were plated on top of the vehicle/drug treated cells or in media-only control wells. Media containing vehicle/drug was replenished every 48h. After 7 days luciferin [150μg/ml] was added to the wells and luciferase-signal of resistant cells was determined by BLI using a Xenogen Spectrum imaging machine (Perkin Elmer). Co-culture experiments were independently performed at least two times and a representative experiment is shown.
To generate conditioned media (CM) 2.3×10⁶ and 6.4×10⁶ drug-sensitive cells were plated on 15cm dishes in regular growth media and allowed to adhere over night. The media was then replaced by low serum media containing vehicle or vemurafenib (0.1μM for A375 cells, 1μM for all other cell lines), on dishes containing 2.3×10⁶ and 6.4×10⁶ drug-sensitive cells, respectively. The same procedure was followed for generation of conditioned media from H3122 (crizotinib, 0.3 or 1μM), or HCC827 (erlotinib 0.01μM) lung adenocarcinoma cells. After 72h cells on both plates had reached equal confluency of ~80% and CM was harvested, centrifuged at 1000 rpm for 5min, filtered, and aliquots were stored at −80°C until further use. Key proliferation and migration experiments yielded the same results when performed with CM in which the same number of drug-sensitive cells (3.2×10⁶) was plated initially, which resulted in higher cell confluency in the vehicle-treated dish at time of CM harvest.
Proliferation/Survival/Apoptosis assays
1000–3000 cells were plated in a 96-well plate, allowed to adhere over night, and then incubated with either fresh or conditioned media containing vemurafenib or additional drugs as indicated. After 72h, the number of cells was determined using a CelltiterGlo assay and the Caspase 3/7 activity using a CaspaseGlo assay (Promega) according to the manufacturer’s instructions. Caspase 3/7 activity was normalized to the number of cells present. All experiments with melanoma test cells and melanoma conditioned media were performed at least three times, experiments with lung adenocarcinoma cell lines were performed at least two times. Representative experiments are shown.
Boyden Chamber Transwell Migration assay/Gap closure assay
Transwell migration assays were performed as described previously with minor modifications31. Briefly, serum starved cells (0.2% FBS, over night) were labelled with cell tracker green (Invitrogen, CA) for 30min at 37°C and allowed to recover for 1h. Cells (25,000 – 50,000) were then seeded onto membrane inserts with 8μm pores and fluorescence blocking filters (Falcon). The number of cells migrated through the pores of the membrane was scored after 5–24h using an Evos microscope (AMG). Gap closing assay was performed according to standard protocols. Briefly, cells were seeded and grown until confluent. A tip was used to generate a gap, cells were washed and CM was added. Images were acquired over time to monitor for cap closure in different conditions. All experiments were performed independently at least two times. Representative experiments are shown.
XCelligence migration assay
Experiments were performed using the xCELLigence RTCA DP instrument (Roche Diagnostics GmbH, Mannheim, Germany) placed in a humidified incubator at 37°C with 5% CO2. Cell migration experiments were performed using modified 16-well plates (CIM-16, Roche Diagnostics GmbH, Mannheim, Germany) according to the manufacturer’s instructions. The experiment was performed two times. A representative experiment is shown.
Animal studies
All experiments using animals were performed in accordance to our protocol approved by MSKCC’s Institutional Animal Care and Use Committee (IACUC). 5 – 7 week old, female NOD-SCID NCR (NCI) or athymic NCR-NU-NU (NCI) mice were used for animal experiments with human cell lines. Primary YUMM 1.1 and YUMM1.7 cell lines were isolated from melanomas developed in mice (Tyr::CreER; BrafCA; Cdkn2a−/− Ptenlox/lox) treated with 4-hydroxytamoxifen and were subsequently implanted in female C57BL/6J (JAX) mice aged between 5–7 weeks. Tumour formation, outgrowth and metastasis were monitored by bioluminescent imaging (BLI) of TK-GFP-luciferase (TGL) labelled tumour cells as described previously22. Briefly, anesthetized mice (Ketamine 150mg/kg Xylazine 15 mg/kg or isoflurane) were injected retro-orbitally with D-Luciferin (150mg/kg) and imaged with IVIS Spectrum Xenogen machine (Caliper Life Sciences). Bioluminescence analysis was performed using Living Image software, version 4.4. For co-implantation assays mice were anesthetized (Ketamine 150mg/kg Xylazine 15 mg/kg) and 1×10³ TGL-labelled resistant tumour cells were injected subcutaneously with 2×10⁶ sensitive tumour cells in 50μl growth factor reduced Matrigel/PBS (Corning) for the control groups in which the effects of drug treatment on resistant cells alone were tested, 2×10⁶ resistant cells were injected in growth factor reduced Matrigel/PBS (1:1) (BD Biosciences). Two to four sites on the flanks were injected per mouse. After tumours reached a size of 50–150mm3, the BLI signal of resistant cells was determined. To compensate for minor growth differences of the GFP+ resistant cell population between mice, the mice were assigned to the cohorts so that the overall BLI intensity (and consequently the cell number) was equal in the treatment and control group. Each group received vehicle or drug treatment as indicated (Vemurafenib/PLX4032, 25 mg/kg bid for YUMM1.1 and YUMM 1.7 tumours and 75 mg/kg bid for all other tumours, LC-Labs or Selleckchem; crizotinib, 100mg/kg/qd, LC-Labs; erlotinib, 50mg/kg/qd, LC-Labs; MK-2206, 100 mg/kg qd, Chemietek; BEZ235, 50mg/kg qd, LC-Labs). Growth of the resistant population in the different groups was monitored by BLI, quantified and normalized to BLI signal at start of treatment. Tumour seeding and metastasis assays were performed as described with minor modifications20. Briefly, sensitive tumour cells were injected subcutaneously on two sites per mouse. Once tumours were established (50–150mm3) mice were treated with vehicle or vemurafenib (75mg/kg bid) for 3 days and 1×10⁵ TGL-labelled drug-resistant cells were injected in the left cardiac ventricle. Treatment was continued and metastatic burden and tumour seeding were determined in vivo and ex vivo by BLI. Tumour volume was determined using caliper measurements and calculated using the following formula: Tumour volume = (D*d2)/2. All experiments with A375 cells were independently performed at least three times, except animal experiments in Fig. 3. which were performed two times. All other animal experiments were independently performed at least two times. Representative experiments are shown, except where noted and an average of three experiments are presented.
Gene expression analysis
Whole RNA was isolated from cells using RNAeasy Mini Kit (QIAGEN). Transcriptor First Strand cDNA synthesis kit (Roche) was used to generate cDNA. Differential RNA levels were assessed using Taqman gene expression assays (Life technologies). Assays used for human genes are: Hs04187685, Hs00365742, Hs00605382, Hs00601975, Hs01099999, Hs00959010, Hs01029057, Hs00234244, Hs00905117, Hs00180842, Hs00989373, Hs00234140, Hs00195591, Hs00207691, Hs99999141, Hs01117294, Mm00607939, Mm99999915, Mm04207958. Relative gene expression was normalized to internal control genes: B2M (Hs99999907_m1), GAPDH (Hs99999905_m1), and ACTB (Mm00607939_s1). Quantitative PCR reactions were performed on a VIIA7 Real-Time PCR system and analysed using VIIA7 software (Life Technologies). All data points represent at least 4 technical replicates and experiments were performed independently three times. A representative experiment is shown.
Cancer-cell-specific translational ribosome affinity purification (TRAP) and sequencing
To investigate the gene expression changes specifically of drug-sensitive tumours during vemurafenib treatment or gene expression changes of resistant cells exposed to a regressing tumour microenvironment A375 and A375R cells, respectively, were modified to express EGFP-RPL10a. Tumours derived from implanted A375-EGFP-RPL10a and A375R-EGFP-RPL10a cells (were homogenized and processed with the TRAP protocol as previously described28,32,33 with the following modifications: fresh tumour was homogenized with a Model PRO 200 homogenizer at Speed 5 for 4 cycles of 15sec, RNasin Plus RNase inhibitor (Promega, Cat No: N2615) was used as RNase inhibitor, and anti-GFP antibody coated sepharose beads (GE Healthcare) were used for immunoprecipitation. Polysome-associated RNA was purified with RNAqeuous micro kit (Life Technologies, Cat No: AM1931). Ribogreen and the Agilent BioAnalyzer technologies were used to quantify and control the quality of RNA; 500ng RNA (RIN > 8.5) from each sample was used for library construction with TruSeq RNA Sample Prep Kit v2 (Illumina) according to the manufacturer’s instructions. The samples were barcoded and run on a Hiseq 2000 platform in a 50bp/50bp or 75bp/75bp paired-end run, using the TruSeq SBS Kit v3 (Illumina). An average of 40 million paired reads were generated per sample.
RNA-Seq analysis
For drug-sensitive A375, Colo800, UACC63, H3122 cells in vitro, raw paired-end sequencing reads were mapped to human genome (Build hg19) with STAR2.3.0e34 using standard options. Uniquely mapped reads were counted for each gene using HTSeq v0.5.435 with default settings. Read counts of each sample were normalized by library size using the “DESeq”35 package of Bioconductor. Differential gene expression analysis between any two conditions was performed based on a model utilizing the negative binomial distribution35. Genes with FDR<0.05, fold change larger than 1.5 or smaller than 0.667 fold, and average read counts larger than 10 were treated as differentially expressed genes. RNA-Seq data from in vivo xenograft TRAP samples were processed with the following modifications to avoid potential mRNA contamination from host mouse tissue: raw sequencing reads were mapped to a hybrid genome consisting indexes of both human (Build hg19) and mouse (Build mm9) genomes. Only reads that uniquely mapped to human genome indexes were preserved and counted using HTSeq v0.5.435.
Bioinformatics analysis
Heatmap visualization of data matrices was performed using the “gplots” package of R. Principle component analysis of RNA-Seq results was performed with the variance stabilizing transformation methods in “DESeq” package of Bioconductor and the first two principal components were plotted. Volcano plots were derived from “DESeq”-based differential gene expression analysis. Differentially expressed genes with transcription factor activity (GO:00037000) at 6h of vemurafenib treatment and gene products located in the extracellular region (GO:00005576) at 48h of vemurafenib treatment were identified using the Database for Annotation, Visualization and Integrated Discovery (DAVID)36 v6.7 (http://david.abcc.ncifcrf.gov/) and enriched GO terms were visualized using REVIGO37 (http://revigo.irb.hr). Enriched transcriptional regulators for the list of differentially expressed gene products in the extracellular region were predicted with DAVID v6.7 and this list compared to the gene expression levels of transcription factors after 6h of vemurafenib treatment in A375 cells. Upstream regulators, functions associated with the gene expression profile and potential drug vulnerabilities were determined by IPA analysis on differentially expressed genes from A375R –EGFP-RPL10a cells in different tumour microenvironments in vivo.
Immunoblotting
RIPA buffer (Cell Signaling) was used for cell lysis, according to the manufacturer’s instructions, and the protein concentrations were determined by BCA Protein Assay Kit (Pierce). Proteins were separated by SDS-PAGE using Bis-Tris 4–12% gradient polyacrylamide gels in the MOPS buffer system (Invitrogen) and transferred to nitrocellulose membranes (BioRad) according to standard protocols. Membranes were immunoblotted with antibodies against pERKT202/Y204 (#4370), tERK (#4696), pAKTS473 (#4060), pAKTT308 (#4056), tAKT (#2920), EGFR (#4267), MET (#8198), PDGFRb (#3169), pFRA1 (#3880), Caspase3 (#9662), pPRAS40T246 (#13175), p70S6KT389 (#9205), pFAKY397 (#3283), pPKCbetaIIS660 (#9371), pNFκBS536 (#3033), pβ-CateninS33/37/T41 (#9561), pSTAT-3Y705 (#9145), pSTAT-5C11C5 (#9359), pGSK3α/βS21/9 (#9327), pCREBS133/pATF-1 (#9196) (Cell Signaling, 1:1,000), FRA1 (sc-605, Santa Cruz Biotechnology, 1:200), and Tubulin (T6074, Sigma-Aldrich, 1:5,000) in Odyssey™ blocking buffer (LI-COR). Following primary antibody incubation, membranes were probed with IRDye 800CW donkey-anti-mouse IgG (LI-COR) or IRDye 680RD goat-anti-rabbit IgG (LI-COR) secondary antibody (1:20,000) and imaged using the LI-COR Odyssey system. All Immunoblots were performed independently at least two times. Tubulin served as a loading control.
Plasmids, recombinant proteins, ELISA
Identifiers for shRNAs used in this study are: V3LHS-644610 (shFRA1#1), V3LHS-644611 (shFRA1#2), V3LHS-320021 (shIGFBP3#1), V2LHS-111629 (shIGFBP3#2) (Dharmacon, GE Lifesciences). IGFBP3 ELISA (Raybiotech) was performed according to the manufacturer’s instructions with 50ug tumour lysate and conditioned media was diluted 1:5. Recombinant proteins were used at the following conditions: 10ng/ml IGF1 (Invitrogen), 10ng/ml EGF (Invitrogen), 10ng/ml PDGFD (R&D Systems), 2μg/ml IGFBP3 (Prospec) for 15min, or 5ug/ml ANGPTL7 (R&D Systems) for 30min.
Patient samples
Melanoma tissues were obtained from clinical trial patients or patients under standard clinical management with approval of the UCLA Institutional Review Board. Patient-informed consent was obtained for the research performed in this study.
Immunofluorescence
Tissues for BrdU-immunofluorescence staining were obtained after overnight fixation with PFA 4% at 4°C, embedded in OCT compound (VWR) and stored at −80°C. 10μm thick cryosections on glass slides were used for immunofluorescence staining according to standard protocols. Tissue for all other immunofluorescence from xenograft tumours was obtained after fixation with PFA 4% at 4°C and a series of dehydration steps from 15% to 30% sucrose, as described previously38. Briefly, tumours were sliced using a sliding microtome (Fisher). Tumour slices (80μm) were blocked floating in NGS 10%, BSA 2%, Triton 0.25% in PBS for 2h at room temperature (RT). Primary antibodies were incubated overnight at 4°C in the blocking solution and the following day for 30min at RT. After washes in PBS-Triton 0.25%, secondary antibodies were added in the blocking solution and incubated for 2h. After extensive washing in PBS-Triton 0.25%, nuclei were stained with Bis-Benzamide for 5min at RT, tumour slices were washed and transferred to glass slides. Slices were mounted with ProLong Gold anti fade reagent (Invitrogen). Primary antibodies: GFP (GFP-1020, Aves Labs, 1:1000), Collagen IV (AP756, Millipore, 1:500), BrdU (ab6326, Abcam, 1:250), FRA1 (sc605, Santa Cruz, 1:200). Secondary antibodies: Alexa-Fluor anti-chicken488, anti-rabbit555, anti-rat555 (Invitrogen). Stained sections were visualized using a Carl Zeiss Axioimager Z1 microscope or with a Leica SP5 upright confocal microscope using 10X or 20X objectives. Images were analysed with ImageJ, and Metamorph software.
Flow cytometry
Flow cytometry was performed as described previously22, with minor modifications. Briefly, whole tumours were dissected, cut into smaller sections and dissociated for 1–3h with 0.5% collagenase Type III (Worthington Biochemical) and 1% Dispase II (Roche) in PBS. Resulting single cells suspensions were washed with PBS supplemented with 2% FBS and filtered through a 70 μm nylon mesh. The resulting single cell suspension was incubated for 10 min at 4°C with anti-mouse Fc-block CD16/32 antibody (2.4G2 BD) in PBS supplemented with 1% BSA. Cells were subsequently washed with PBS/BSA and stained with control antibodies or antibodies to detect immune cells diluted in PBS supplemented with 0.5% BSA and 2mM EDTA. The following antibodies against mouse antigens were used: CD45-PE-Cy7 (Clone 30-F11, BD Pharmingen, 1:200), CD11b-APC (Clone: M1/70, BD Pharmingen, 1:100), Gr1-PE (MACS, 1:10), CD31-APC (Clone: 390, eBioscience, 1:100), F4/80-PE (Clone: BM8, eBioscience, 1:50). To determine the level of EdU incorporation in A375R resistant cells within vehicle or vemurafenib treated A375/A375R tumours EdU (50m/kg, Life Technologies) was injected i.p. After 2h tumours were harvested, single cell suspensions generated as described above and further processed according to the manufacturer’s protocol (Click-iT® Plus EdU Alexa Fluor® 647 Flow Cytometry Assay Kit, Life technologies). Data was acquired using a FACS Calibur (BD Biosciences). All experiments were performed independently at least two times. Representative experiments are shown.
Antibody arrays
Cytokines and cytokine receptors of murine stromal and immune cells, in A375 tumours treated with vehicle or vemurafenib for 5 days, were measured using the Mouse Cytokine Array G2000 (RayBio, AAH-CYT-G2000-8, detecting 174 proteins), according to the recommended protocols. Briefly, tumours were homogenized with a Mini Immersion Blender (Pro Scientific) in Raybio Lysis buffer with protease inhibitors. Lysates were centrifuged for 5 min at 10,000xg, the supernatant was harvested and protein concentration was measured using the BCA Assay Kit (Pierce). 150μg protein was hybridized on the antibody arrays overnight at 4°C. IRDye labeled streptavidin (LI-COR) at a dilution of 1:5,000 was used for the detection, slides were scanned using a Odyssey CLx scanner (LI-COR) and analysed using Image Studio 2.0 software. The results were then normalized using internal controls, and the relative protein levels determined across four biological replicates.
Senescence β-galactosidase staining
A375 cells were grown in low-serum media and treated with vehicle or vemurafenib (0.1μM) for 3 or 8 days, β-galactosidase staining was performed according to the manufacturer’s instructions (Cell Signachaaling). All experiments were performed independently three times. Representative experiments are shown.
Statistical analysis
Data are generally expressed as mean ± error of the mean (s.e.m.), or in box plots where the centreline is median, whiskers are min. to max. Group sizes were determined based on the results of preliminary experiments and no statistical method was used to predetermine sample size. Group allocation and outcome assessment was not performed in a blinded manner. All samples that met proper experimental conditions were included in the analysis. Statistical significance was determined by using a two-tailed Mann-Whitney test or Student’s t-test using Prism 6 software (GraphPad Software), or using a hypergeometric variability test (http://www.geneprof.org). Significance was set at P < 0.05.
Extended Data
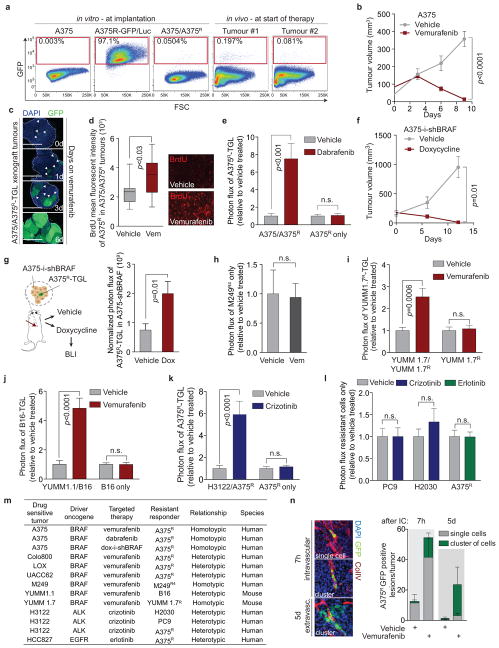
Extended Data Figure 1. Targeted therapy or oncogene knockdown leads to regression of sensitive melanoma and lung adenocarcinoma tumours but accelerates the proliferation and seeding of residual drug-resistant cells in vivo.
a, FACS analysis of sensitive A375 and vemurafenib-resistant A375R cells expressing TK-GFP-Luciferase (TGL), at tumour implantation and after two weeks at start of therapy (n = 8 tumours) Plots depict representative images. b, Tumour volume of A375 cells treated with vehicle or vemurafenib over time (vehicle, n = 8; vemurafenib, n = 12 tumours). c, Representative sections of A375/A375R-TGL tumours at 0, 1, 3, and 6 days of vemurafenib treatment analysed with immunofluorescence (IF) against GFP. Arrows indicate emerging clusters of GFP+ resistant cells. Scale bar: 2mm. d, Quantification of BrdU incorporation into vemurafenib-resistant A375R-TGL cells in A375/A375R tumours treated with vehicle or vemurafenib for 6 days (vehicle, n = 13 fields of vision (FOV) of 3 tumours; vemurafenib n = 18 FOV of 4 tumours). e, Fold change of photon flux of TGL-expressing A375R cells in A375 tumours or A375R tumours alone treated with vehicle or dabrafenib for 8 days (A375/A375R: vehicle, n = 15; dabrafenib, n = 14; A375R: vehicle, n = 8; dabrafenib, n = 7 tumours). f, Tumour volume of doxycycline-inducible BRAF knockdown A375-i-shBRAF-derived xenograft tumours treated with vehicle or doxycycline over time (vehicle, n = 5; doxycycline, n = 4 tumours). g, Photon flux of TGL-expressing A375R cells mixed in A375-i-shBRAF tumours treated with vehicle or doxycycline (vehicle, n = 10; doxycycline, n = 11 tumours). h, Fold change of photon flux of TGL-expressing vemurafenib-resistant M249R4 tumours treated with vehicle or vemurafenib (n = 16 tumours). i–k. Co-implantation assay of tumours treated with vehicle or corresponding targeted therapy with BLI quantification after 5–8 days. i, Fold change of photon flux of TGL-expressing vemurafenib-resistant YUMM1.7R cells mixed in unlabelled, vemurafenib-sensitive YUMM1.7 tumours or YUMM1.7R tumours alone (YUMM1.7/YUMM1.7R: n = 24; YUMM1.7R: n = 20 tumours ). j, Fold change of photon flux of TGL-expressing, intrinsically vemurafenib resistant B16 cells mixed in vemurafenib-sensitive YUMM1.1 tumours or B16 tumours alone (YUMM1.1/B16: vehicle, n = 12; vemurafenib, n = 16; B16: n = 20 tumours) k, A375R mixed in crizotinib-sensitive H3122 cells or A375R tumours alone (H3122/A375R: vehicle, n = 14; crizotinib, n = 13; A375R: n = 12 tumours). l, Photon flux of tumours established from intrinsically resistant drug resistant cells alone, treated with vehicle, crizotinib or erlotinib (crizotinib resistant PC9, H2030 or erlotinib resistant A375R) (n (from left to right on the graph, in this order) = 12, 12, 7, 12, 16, 16 tumours, respectively). m, Summary table of the model systems and conditions used in vivo. n, On the left, representative IF images of vemurafenib treated, sensitive tumours 7h or 5d after intracardiac injection with A375R-TGL cells; sections stained for GFP (A375R, green), collagen type IV (blood vessels, red), and DAPI (nuclei, blue). On the right, quantification of A375R single cells and cell clusters (≥2 cells) infiltrating an A375 tumour treated with vehicle or vemurafenib after intracardiac injection of A375R cells (GFP+ cells were scored in at least 10 whole sections of at least 4 tumours). Data in b, e–l, n are presented as averages, error bars represent s.e.m., in f, center line is median, whiskers are min to max. P values shown were calculated by a two-tailed Mann-Whitney test (n.s.=not significant).
Extended Data Figure 2. The secretome of vemurafenib-treated melanoma and crizotinib- or erlotinib-treated lung adenocarcinoma cells stimulates the proliferation and migration of drug resistant cells in vitro and occurs prior to apoptosis and senescence.
a, Quantification of the co-culture assay, depicted in Fig. 2a, 7 days after addition of resistant A375R-TGL cells (n = 4 biological replicates). P values were calculated using a Student’s t-test. b, c, Drug sensitive cells were pre-treated with vehicle or drug (crizotinib or erlotinib) for 48h before 5×10² TGL-expressing, drug-resistant cells were added. Growth was monitored by BLI and quantified 7 days after addition of the resistant cell population, (n = 8 biological replicates), P values were calculated using a Student’s t-test. b, Quantification and representative images of TGL-expressing H2030 cells alone or co-cultured with crizotinib sensitive H3122 cells and treated with vehicle or crizotinib c, Quantification and representative images of TGL-expressing A375R cells alone or co-cultured with erlotinib sensitive HCC827 cells and treated with vehicle or erlotinib. d, Relative number of vemurafenib-resistant LOXR cells after 3 days in the presence of CM derived from A375 and UACC62 cells (n = 3 biological replicates). e, Representative IF for Ki67 in drug-resistant YUMM1.7R cells cultured in CM from YUMM1.7 cells. f, Relative number of vemurafenib-resistant melanoma cells with different, clinically relevant resistance mechanisms after 3 days in the presence of CM derived from A375 cells. SKMEL239#3 expressing the p61 BRAFV600E splice variant, A375 expressing NRASQ61K or the constitutively active MEK variant MEK-DD (n = 5 biological replicates). g, Relative cell number of intrinsically vemurafenib resistant lung adenocarcioma cells (H2030, PC9) or crizotinib and erlotinib resistant melanoma cells (A375R) after 3 days cultured in the presence of CM from vemurafenib-treated melanoma or crizotinib- and erlotinib-treated lung adenocarcinoma (n = 6 in all, except for A375R with HCC827-CM, n = 4 biological replicates). h, Representative image of A375R cells migrated towards A375-derived CM-vehicle or CM-vemurafenib. i, Relative migration towards CM from different sources and different resistant test cells as indicated (n = 10 FOV). P values were calculated using a two-tailed Mann-Whitney test (** p<0.01, **** p<0.0001). j, Representative graph and quantification of real-time migration of A375R cells in the presence of CM derived from A375 cells as measured by the xCELLigence System (n = 4 biological replicates). P-value shown was calculated using a two-tailed Mann-Whitney test. k, Monolayer gap closing assay of A375R cells in the presence of CM derived from A375 cells with representative light microscopy images and quantification of gap closure over time. l, Immunoblotting for cleaved caspase-3 and phosphorylated ERK protein levels in vemurafenib-sensitive melanoma cell lines after 72h of vemurafenib treatment. m, β-galactosidase staining of A375 cells treated with vemurafenib for 72h or 8 days. Data are presented as averages, error bars represent s.e.m.
Extended Data Figure 3. The therapy-induced secretome of sensitive cells overlaps significantly in melanoma and lung adenocarcinoma cells and appears after gene expression changes enriched for transcriptional regulators.
a–b, GO analysis (revigo.irb.hr) of gene expression changes after 6h of vemurafenib treatment of A375 cells with (a) spatial representation of enriched GO terms and (b) the molecular functions significantly affected. c, Heat map, representing the expression levels of commonly up- and down-regulated genes in vemurafenib-treated A375-derived xenograft tumours (5 days) and A375 cells in vitro (48h). d, Principal component analysis of vemurafenib-sensitive Colo800 and UACC62 melanoma cells and crizotinib-sensitive H3122 lung adenocarcinoma cells treated in vitro with vehicle or vemurafenib or crizotinib for 48h. e, Venn Diagram indicating the overlap of genes in the extracellular region (GO:0005576) up-regulated after 48h of vemurafenib treatment in A375, Colo800, and UACC62 melanoma cell lines. f, Venn Diagram indicating the overlap of genes in the extracellular region (GO:0005576) up-regulated after 48h of vemurafenib treatment in at least 2/3 melanoma models and after 48h of crizotinib treatment in the H3122 lung adenocarcinoma cell line. g, Venn Diagram indicating the overlap of genes in the extracellular region (GO:0005576) down-regulated after 48h of vemurafenib treatment in A375, Colo800, and UACC62 melanoma cell lines. f, Venn Diagram indicating the overlap of genes in the extracellular region (GO:0005576) up-regulated after 48h of vemurafenib treatment in at least 2/3 melanoma models and after 48h of crizotinib treatment in the H3122 lung adenocarcinoma cell line. P values shown were calculated using a Hypergeometric probability test.
Extended Data Figure 4. Vemurafenib treatment induces widespread changes in the intra-tumour immune cell composition and stromal cytokine composition in tumours regressing during targeted therapy.
a–b, Fluorescence-activated cell sorting (FACS) analysis of murine immune cell populations in A375-derived xenograft tumours treated with vehicle or vemurafenib for 5 days. a, Representative image and b, quantification of intra-tumour composition of indicated immune cell populations (vehicle, n = 4; vemurafenib, n = 6 tumours). c–d, Cytokine array of murine stroma-derived cytokines within A375-derived xenograft tumours treated with vehicle or vemurafenib for 5 days. c, Representative image and d, quantification of down- and up-regulated cytokines (n = 4 tumours). P values shown were calculated by a two-tailed Mann-Whitney test. Data are averages, error bars represent s.e.m.
Extended Data Figure 5. Targeted therapy induces down-regulation of FRA1 in drug-sensitive tumour cells.
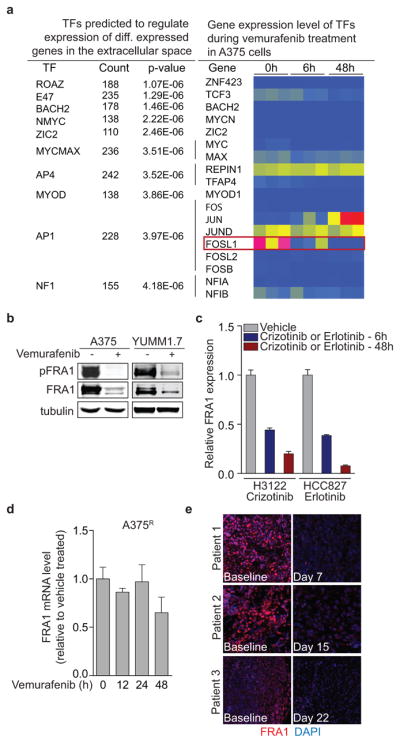
a, List of transcription factors predicted to regulate the vemurafenib-induced reactive secretome in A375 cells, and a heat map of the corresponding transcription factor gene expression levels in these cells. Red represents high, yellow medium and blue low relative expression on the colour scale. b, Immunoblotting of phosphorylated and total FRA1 protein levels in A375 and YUMM1.7 melanoma cell lines treated with vemurafenib for 24h. c, Relative mRNA levels of FRA1 in H3122 cells treated with crizotinib (500nM) and HCC827 treated with erlotinib (10nM) at different time points (n = 4 technical replicates) d, Relative mRNA levels of FRA1 in A375R cells treated with vemurafenib at different time points (n = 4 technical replicates). e, Immunofluorescence staining of FRA1 (red) and DAPI (blue) in biopsies from melanoma patients before and after vemurafenib treatment (clinical information can be found in Extended Data Table 1).
Extended Data Figure 6. The secretome of melanoma cells with FRA1 knockdown stimulates proliferation and migration of A375R cells in vitro and in vivo.
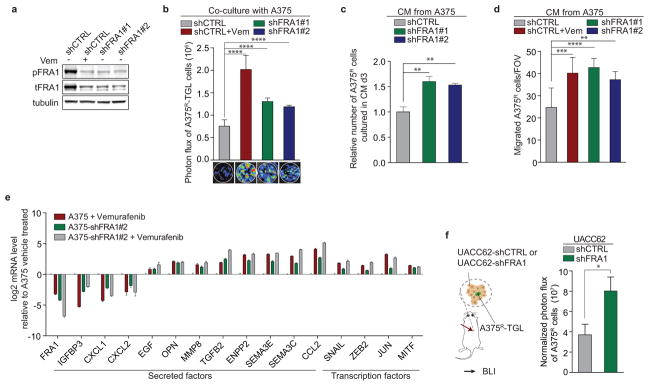
a, Immunoblotting of phosphorylated and total FRA1 protein levels in A375 cells transduced with control shRNA, with or without additional vemurafenib treatment, or shRNAs targeting FRA1. b, Photon flux and representative BLI images of TGL-expressing A375R cells co-cultured with A375 cells expressing control shRNA (with or without vemurafenib treatment) or FRA1-targeting shRNAs after 7 days (n = 9 biological replicates). c, Relative number of A375R cells after 3 days in the presence of CM derived from A375 cells transduced with control shRNA, with or without additional vemurafenib treatment, or FRA1 shRNAs (n = 3 biological replicates). d, Migration of A375R cells towards CM derived from A375 cells transduced with control shRNA (with or without vemurafenib treatment) or FRA1 shRNAs using a Boyden Chamber Assay (shCTRL, n = 15; all other groups n = 10 FOV) e, Relative mRNA levels of selected secreted factors and TF’s of A375 cells expressing control (shCTRL) or a hairpin targeting FRA1 (shFRA1#1), treated with vehicle or vemurafenib (24h). f, Bioluminescent signal of A375R-TGL cells 8 days after subcutaneous co-implantation with UACC62 cells expressing a control or a short hairpin for FRA1 (shCTRL, n = 12; shFRA1, n = 20 tumours). Data are averages, error bars represent s.e.m. P values were calculated by Student’s t-test, ***p<0.01, ***p<0.001, ****p<0.0001.
Extended Data Figure 7. The therapy-induced secretome (TIS) includes up-regulated positive regulators and a loss of negative regulators of the PI3K/AKT/mTOR pathway, which is activated in sensitive and resistant cells in vitro and in vivo.
a, Enriched biological processes and b, inferred drug vulnerabilities as determined by Ingenuity pathway analysis of gene expression data from vemurafenib-resistant A375R cells responding to signals from the reactive tumour microenvironment of a tumour regressing during targeted therapy in vivo (for experimental setup see Fig. 1a and the methods section). c, Left, immunoblotting of phosphorylated AKTS473 and phosphorylated ERK protein levels in A375 cells treated with vehicle or vemurafenib at different time points during the generation of conditioned media (CM). Right, immunoblotting of phosphorylated AKTS473 and phosphorylated ERK protein levels in A375 cells after short-term exposure to CM derived from A375 cells treated with vehicle or vemurafenib. d, Immunoblotting of phosphorylated AKTS473 and phosphorylated FRA1 protein levels in A375-derived xenograft tumours treated with vehicle or vemurafenib for 5 days. Normalized quantification of phospho-AKTS473/tubulin in the bottom panel. e, Immunoblotting of a range of pathways nodes in A375R cells treated with CM-vehicle or CM-vemurafenib, derived from A375 cells, for 15, 30, 60, or 120min. f, Cancer cell-derived IGFBP3 levels (left) and murine stromal IGF1 levels (right) in A375-derived xenograft tumours treated with vehicle or vemurafenib for 5 days as determined by ELISA (n = 4 tumours) g, Cancer cell-derived IGFBP3 levels in CM from indicated melanoma cell lines treated with vehicle or vemurafenib as determined by ELISA (n = 3 technical replicates of at least 2 CM). h, IGFBP3 levels in CM derived from A375 cells expressing control or shRNAs targeting IGFBP3 as determined by ELISA (n = 3 technical replicates). i, Immunoblotting of phosphorylated AKTS473 in A375R cells after incubation with CM of A375 cells expressing control or a short hairpin targeting IGFBP3. j, Phosphorylation status of AKTS473 in A375R cells after incubation for 15 min with CM, IGF1, and IGFBP3 as indicated. k, Bioluminescent signal of A375R-TGL cells 10 days after co-implantation with A375 cells expressing a control hairpin (shCTRL) or a hairpin targeting IGFBP3 (shIGFBP3#1) (n = 10 tumours). P values shown were calculated by a two-tailed Mann-Whitney test. Data are averages, error bars represent s.e.m.
Extended Data Figure 8. Dual inhibition of RAF and the AKT/mTOR pathway blunts the effects of the regressing tumour environment on the resistant cell population.
a, Relative photon flux and representative BLI images of GFP/luciferase expressing A375R cells co-cultured with A375 cells and treated with vehicle, vemurafenib, or the combination of vemurafenib and either MK2206 (AKTi, 2μM) or BEZ235 (PI3K/mTORi, 300nM) for 7 days (n = 2–3 biological replicates). b, Relative number of A375R cells after 3 days in the presence of CM-vehicle or CM-vemurafenib with additional BEZ235 (300nM) (n = 3 biological replicates). c, Mice bearing tumours consisting of A375/A375R cells or A375R cells alone were treated with drugs as indicated. Bioluminescent signal of TGL-expressing A375R cells was determined on day 5 of treatment (n = 16, 16, 12, 12, 12, 16 tumours, respectively). d, Mice bearing tumours consisting of unlabelled A375 cells were pre-treated for 3 days with drugs as indicated and 1×10⁵ TGL-expressing A375R cells were inoculated in the arterial circulation. Drug treatment was continued and seeding of resistant cells to the primary tumour was quantified by BLI. Representative BLI images on the right (vehicle, n = 4; vemurafenib n = 10, vemurafenib+BEZ235, n = 10 tumours). P values were calculated by a two-tailed Mann-Whitney test. Data are averages, error bars represent s.e.m.
Extended Data Figure 9. Characterization of cell lines in response to targeted therapy.
a–h, Relative survival of human melanoma cell lines (A375, Colo800, UACC62) (a,c,e), and the murine melanoma cell line YUMM1.7 (g) and corresponding vemurafenib-resistant derivatives (A375R, Colo800R, UACC62R, YUMM1.7R) under increasing concentrations of vemurafenib. Immunoblotting of phosphorylated ERK protein levels in indicated melanoma cell lines in the presence of increasing concentrations of vemurafenib (b,d,f,h). i, Immunoblotting of protein levels of MET, EGFR, BRAF, PDGFRβ, phosphorylated AKT, and phosphorylated ERK in vemurafenib-sensitive and -resistant pairs of human melanoma cell lines (A375, Colo800, UACC62). j, Immunoblotting of phosphorylated ERK and phosphorylated AKTS473 protein levels in HCC827 lung adenocarcinoma cells in the presence of increasing concentrations of erlotinib. k, Immunoblotting of phosphorylated ERK protein levels in H3122 lung adenocarcinoma cells in the presence of increasing concentrations of crizotinib.
Extended Data Table 1.
Clinical data for tissue donor subjects
| Study site | Pt # | Bx samples | Age & Sex | Stage | Dose (mg) | BOR | PFS (days) | Bx site |
|---|---|---|---|---|---|---|---|---|
| UCLA | 1 TG | Baseline Day 7 |
51M | M1c | 960 bid vemurafenib | −21% | 108 | SC, scalp SC, scalp |
| 2 JCC | Baseline Day 15 |
44M | M1c | 960 bid vemurafenib +60 qd cobimetinib |
−63% | Current response | SC, abdomen SC, abdomen |
|
| 3 YAU | Baseline Day 22 |
26F | M1c | 960 bid vemurafenib +60 qd cobimetinib |
−46% | 145 | Dermal/SC, abdomen Dermal/SC, clavicle |
Abbreviations: Bx, biopsy; BOR, best overall response; PFS, progression free survival; UCLA, University of California, Los Angeles; Pt, patient; M, male; F, female; bid, twice a day; qd, daily; SC, subcutaneous.
Supplementary Material
Acknowledgments
We thank members of the Massagué lab for insightful discussions. L. Sevenich and L. Akkari for technical advice. This work was supported by grants from the AACR (SU2C) to RSL, the MSK Metastasis Research Center, the NIH (CA163167 and CA129243), the Congressionally Directed Medical Research Program of the Department of Defense, the Howard Hughes Medical Institute, and the by Cancer Center Support Grant P30 CA008748 to JM. ACO was an Erwin Schroedinger Fellowship awardee (J3013, FWF, Austrian Science Fund). ALJ was a Medical Research Fellow of the Howard Hughes Medical Institute. SV is supported by the Medical Research Council.
Footnotes
Supplementary information is available in the online version of the paper.
Author contributions A.C.O. and J.M. conceived the project, designed the experiments and wrote the paper. A.C.O. performed experiments and computational analysis. A.L.J., Y.Z., W.S., and T.W. assisted with experiments. Y.Z. and S.V. performed computational analysis. M.W.B. provided cell lines. X.K., H.S., R.S.L. provided patient samples. N.R. provided clinical expertise, cell lines and drugs. All authors interpreted data, discussed results, and revised the manuscript.
All RNAseq data has been deposited in the Gene Expression Omnibus database under accession number GSE64741.
The authors declare no competing financial interests.
Readers are welcome to comment on the online version of the paper.
References
- 1.Engelman JA, Settleman J. Acquired resistance to tyrosine kinase inhibitors during cancer therapy. Current opinion in genetics & development. 2008;18:73–79. doi: 10.1016/j.gde.2008.01.004. [DOI] [PubMed] [Google Scholar]
- 2.Holohan C, Van Schaeybroeck S, Longley DB, Johnston PG. Cancer drug resistance: an evolving paradigm. Nature reviews. Cancer. 2013;13:714–726. doi: 10.1038/nrc3599. [DOI] [PubMed] [Google Scholar]
- 3.Chapman PB, et al. Improved survival with vemurafenib in melanoma with BRAF V600E mutation. The New England journal of medicine. 2011;364:2507–2516. doi: 10.1056/NEJMoa1103782. [DOI] [PMC free article] [PubMed] [Google Scholar]
- 4.Sosman JA, et al. Survival in BRAF V600-mutant advanced melanoma treated with vemurafenib. The New England journal of medicine. 2012;366:707–714. doi: 10.1056/NEJMoa1112302. [DOI] [PMC free article] [PubMed] [Google Scholar]
- 5.Shaw AT, Engelman JA. ALK in lung cancer: past, present, and future. Journal of clinical oncology: official journal of the American Society of Clinical Oncology. 2013;31:1105–1111. doi: 10.1200/JCO.2012.44.5353. [DOI] [PMC free article] [PubMed] [Google Scholar]
- 6.Zhou C, et al. Erlotinib versus chemotherapy as first-line treatment for patients with advanced EGFR mutation-positive non-small-cell lung cancer (OPTIMAL, CTONG-0802): a multicentre, open-label, randomised, phase 3 study. The Lancet. Oncology. 2011;12:735–742. doi: 10.1016/S1470-2045(11)70184-X. [DOI] [PubMed] [Google Scholar]
- 7.Villanueva J, et al. Acquired resistance to BRAF inhibitors mediated by a RAF kinase switch in melanoma can be overcome by cotargeting MEK and IGF-1R/PI3K. Cancer cell. 2010;18:683–695. doi: 10.1016/j.ccr.2010.11.023. [DOI] [PMC free article] [PubMed] [Google Scholar]
- 8.Nazarian R, et al. Melanomas acquire resistance to B-RAF(V600E) inhibition by RTK or N-RAS upregulation. Nature. 2010;468:973–977. doi: 10.1038/nature09626. [DOI] [PMC free article] [PubMed] [Google Scholar]
- 9.Poulikakos PI, et al. RAF inhibitor resistance is mediated by dimerization of aberrantly spliced BRAF(V600E) Nature. 2011;480:387–390. doi: 10.1038/nature10662. [DOI] [PMC free article] [PubMed] [Google Scholar]
- 10.Wagle N, et al. Dissecting therapeutic resistance to RAF inhibition in melanoma by tumor genomic profiling. Journal of clinical oncology: official journal of the American Society of Clinical Oncology. 2011;29:3085–3096. doi: 10.1200/JCO.2010.33.2312. [DOI] [PMC free article] [PubMed] [Google Scholar]
- 11.Lito P, et al. Relief of profound feedback inhibition of mitogenic signaling by RAF inhibitors attenuates their activity in BRAFV600E melanomas. Cancer cell. 2012;22:668–682. doi: 10.1016/j.ccr.2012.10.009. [DOI] [PMC free article] [PubMed] [Google Scholar]
- 12.Shi H, et al. Melanoma whole-exome sequencing identifies V600EB-RAF amplification-mediated acquired B-RAF inhibitor resistance. Nature Communications. 3(1):724–728. doi: 10.1038/ncomms1727. [DOI] [PMC free article] [PubMed] [Google Scholar]
- 13.Wilson TR, et al. Widespread potential for growth-factor-driven resistance to anticancer kinase inhibitors. Nature. 2012;487:505–509. doi: 10.1038/nature11249. [DOI] [PMC free article] [PubMed] [Google Scholar]
- 14.Straussman R, et al. Tumour micro-environment elicits innate resistance to RAF inhibitors through HGF secretion. Nature. 2012;487:500–504. doi: 10.1038/nature11183. [DOI] [PMC free article] [PubMed] [Google Scholar]
- 15.Johannessen CM, et al. A melanocyte lineage program confers resistance to MAP kinase pathway inhibition. Nature. 2013;504:138–142. doi: 10.1038/nature12688. [DOI] [PMC free article] [PubMed] [Google Scholar]
- 16.Shi H, et al. A novel AKT1 mutant amplifies an adaptive melanoma response to BRAF inhibition. Cancer discovery. 2014;4:69–79. doi: 10.1158/2159-8290.CD-13-0279. [DOI] [PMC free article] [PubMed] [Google Scholar]
- 17.Diaz LA, Jr, et al. The molecular evolution of acquired resistance to targeted EGFR blockade in colorectal cancers. Nature. 2012;486:537–540. doi: 10.1038/nature11219. [DOI] [PMC free article] [PubMed] [Google Scholar]
- 18.Shi H, et al. Acquired resistance and clonal evolution in melanoma during BRAF inhibitor therapy. Cancer discovery. 2014;4:80–93. doi: 10.1158/2159-8290.CD-13-0642. [DOI] [PMC free article] [PubMed] [Google Scholar]
- 19.Sharma SV, et al. A chromatin-mediated reversible drug-tolerant state in cancer cell subpopulations. Cell. 2010;141:69–80. doi: 10.1016/j.cell.2010.02.027. [DOI] [PMC free article] [PubMed] [Google Scholar]
- 20.Kim MY, et al. Tumor self-seeding by circulating cancer cells. Cell. 2009;139:1315–1326. doi: 10.1016/j.cell.2009.11.025. [DOI] [PMC free article] [PubMed] [Google Scholar]
- 21.Villanueva J, Herlyn M. Melanoma and the tumor microenvironment. Current oncology reports. 2008;10:439–446. doi: 10.1007/s11912-008-0067-y. [DOI] [PMC free article] [PubMed] [Google Scholar]
- 22.Acharyya S, et al. A CXCL1 paracrine network links cancer chemoresistance and metastasis. Cell. 2012;150:165–178. doi: 10.1016/j.cell.2012.04.042. [DOI] [PMC free article] [PubMed] [Google Scholar]
- 23.Sun Y, et al. Treatment-induced damage to the tumor microenvironment promotes prostate cancer therapy resistance through WNT16B. Nat Med. 2012;18:1359-+. doi: 10.1038/Nm.2890. [DOI] [PMC free article] [PubMed] [Google Scholar]
- 24.Lee HJ, et al. Drug Resistance via Feedback Activation of Stat3 in Oncogene-Addicted Cancer Cells. Cancer cell. 2014;26:207–221. doi: 10.1016/j.ccr.2014.05.019. [DOI] [PubMed] [Google Scholar]
- 25.Lito P, Rosen N, Solit DB. Tumor adaptation and resistance to RAF inhibitors. Nature medicine. 2013;19:1401–1409. doi: 10.1038/nm.3392. [DOI] [PubMed] [Google Scholar]
- 26.Sun C, et al. Reversible and adaptive resistance to BRAF(V600E) inhibition in melanoma. Nature. 2014;508:118–122. doi: 10.1038/nature13121. [DOI] [PubMed] [Google Scholar]
- 27.Joseph EW, et al. The RAF inhibitor PLX4032 inhibits ERK signaling and tumor cell proliferation in a V600E BRAF-selective manner. Proceedings of the National Academy of Sciences of the United States of America. 2010;107:14903–14908. doi: 10.1073/pnas.1008990107. [DOI] [PMC free article] [PubMed] [Google Scholar]
- 28.Heiman M, et al. A translational profiling approach for the molecular characterization of CNS cell types. Cell. 2008;135:738–748. doi: 10.1016/j.cell.2008.10.028. [DOI] [PMC free article] [PubMed] [Google Scholar]
- 29.Fuchs Y, Steller H. Programmed cell death in animal development and disease. Cell. 2011;147:742–758. doi: 10.1016/j.cell.2011.10.033. [DOI] [PMC free article] [PubMed] [Google Scholar]
- 30.Kurtova AV, et al. Blocking PGE-induced tumour repopulation abrogates bladder cancer chemoresistance. Nature. 2014 doi: 10.1038/nature14034. [DOI] [PMC free article] [PubMed] [Google Scholar]
- 31.Tavazoie SF, et al. Endogenous human microRNAs that suppress breast cancer metastasis. Nature. 2008;451:147–U143. doi: 10.1038/Nature06487. [DOI] [PMC free article] [PubMed] [Google Scholar]
- 32.Doyle JP, et al. Application of a translational profiling approach for the comparative analysis of CNS cell types. Cell. 2008;135:749–762. doi: 10.1016/j.cell.2008.10.029. [DOI] [PMC free article] [PubMed] [Google Scholar]
- 33.Zhang XH, et al. Selection of bone metastasis seeds by mesenchymal signals in the primary tumor stroma. Cell. 2013;154:1060–1073. doi: 10.1016/j.cell.2013.07.036. [DOI] [PMC free article] [PubMed] [Google Scholar]
- 34.Dobin A, et al. STAR: ultrafast universal RNA-seq aligner. Bioinformatics. 2013;29:15–21. doi: 10.1093/bioinformatics/bts635. [DOI] [PMC free article] [PubMed] [Google Scholar]
- 35.Anders S, Huber W. Differential expression analysis for sequence count data. Genome biology. 2010;11:R106. doi: 10.1186/gb-2010-11-10-r106. [DOI] [PMC free article] [PubMed] [Google Scholar]
- 36.Huang da W, Sherman BT, Lempicki RA. Systematic and integrative analysis of large gene lists using DAVID bioinformatics resources. Nature protocols. 2009;4:44–57. doi: 10.1038/nprot.2008.211. [DOI] [PubMed] [Google Scholar]
- 37.Supek F, Bosnjak M, Skunca N, Smuc T. REVIGO summarizes and visualizes long lists of gene ontology terms. PloS one. 2011;6:e21800. doi: 10.1371/journal.pone.0021800. [DOI] [PMC free article] [PubMed] [Google Scholar]
- 38.Valiente M, et al. Serpins promote cancer cell survival and vascular co-option in brain metastasis. Cell. 2014;156:1002–1016. doi: 10.1016/j.cell.2014.01.040. [DOI] [PMC free article] [PubMed] [Google Scholar]
Associated Data
This section collects any data citations, data availability statements, or supplementary materials included in this article.


