

Abstract
The efficacy of an intravenously administered chemotherapeutic for treatment of a solid tumor is dependent on a sequence of steps, including circulation, extravasation by the enhanced permeability and retention effect, transport in the tumor microenvironment, the mechanism of cellular uptake and trafficking, and the mechanism of drug action. These steps are coupled since the time dependent concentration in circulation determines the concentration and distribution in the tumor microenvironment, and hence the amount taken up by individual cells within the tumor. Models have been developed for each of the steps in the delivery process although their predictive power remains limited. Advances in our understanding of the steps in the delivery process will result in refined models with improvements in predictive power and ultimately allow the development of integrated models that link systemic administration of a drug to the probability of survival. Integrated models that predict outcomes based on patient specific data could be used to select the optimum therapeutic regimens. Here we provide an overview of current models for the steps in the delivery process and highlight knowledge gaps that are key to developing integrated models.
Keywords: chemotherapy, drug delivery, mathematical models, pharmacokinetics, enhanced permeability and retention effect, tumor growth, survival models
Graphical abstract

1. Introduction
The systemic delivery of a drug to a solid tumor for cancer therapy involves several steps which occur in series and ultimately determine drug efficacy (Fig. 1). On administration, the time dependent drug concentration in blood is described by the pharmacokinetics. In many cases simple one-compartment or two-compartment models can be used to describe the blood concentration of the drug or delivery system. The extravasation of a drug from circulation at a tumor site is usually determined by the enhanced permeability and retention (EPR) effect. Following extravasation, a drug can undergo passive transport in the extracellular matrix before uptake by cells in the tumor microenvironment. Convection may also contribute to transport in the extracellular matrix if there is interstitial flow. After internalization the drug is delivered to the appropriate compartment by intracellular trafficking. For pro-drugs or nanomedicines, drug release represents an additional step in the drug delivery process. Drug delivery to a tumor cell may induce apoptosis or inhibit proliferation, thereby modulating tumor growth rate and hence tumor size. Modulating tumor growth impacts the ultimate probability of survival.
Figure 1.

The systemic delivery and action of a drug or drug delivery vehicle to treat a solid tumor involves several steps. Following injection, the time dependent distribution of the drug in circulation is described by the pharmacokinetics. The extravasation of the drug from circulation at the tumor site is usually governed by the enhanced permeation and retention effect. On exiting circulation at the tumor site, transport in the extracellular matrix is followed by uptake in the target cells. The delivery of the drug to the target compartment in a cancer cell depends on the state of the drug (e.g. pro-drug, conjugated to an antibody or delivery vehicle by a linker, or contained in a liposome or other nanoparticle), the mechanism of uptake by the target cell, and the mechanism of action of the drug. Arresting or reversing tumor growth is dependent on the preceding steps. Survival is dependent primarily on the efficiency of the preceding steps, and may be coupled with other interventions such as radiation therapy or resection. Survival may be negatively impacted by unwanted side effects associated with uptake in normal tissue.
While this summary is simplistic and neglects a number of important factors, it represents the important steps that link the systemic administration of a drug to the probability of survival. Each step in the process is the subject of intense research including both experiment and modeling. Models include pharmacokinetic, physiological, numerical and analytical models, and span length scales from nanometers to meters (Table 1). Models for individual steps are frequently empirical but have been refined with input from pre-clinical or clinical trials to provide predictive power.
Table 1.
. Models for steps in the systemic delivery of a drug to a solid tumor.
| step | models | features | length scale |
|---|---|---|---|
| circulation |
|
vasculature/organs | total length: 105 km diameter: 5 μm – 1 cm |
| extravasation (EPR effect) |
|
typical vessel spacing (tumor) | 100 – 200 μm |
| typical vessel diameter (tumor) | 20 – 30 μm | ||
| paracellular defect (tumor) | ≤ 1 μm | ||
| total vessel length in tumor (150 mm mm−3) | 100 m | ||
| transport |
|
maximum diffusion length (half average distance between vessels) | 50 μm – 100 μm |
| uptake, trafficking | sub-cellular (endocytosis, phagocytosis, etc.) | 1 nm – 10 μm (cell) | |
| tumor growth |
|
cellular | 10 μm – 1 cm (tumor) |
Integration of physiologically-based pharmacokinetic models, with models of extravasation from the tumor vasculature, and models that describe transport, uptake, and trafficking in the tumor microenvironment, have the potential to model changes in tumor growth rate and ultimately, survivability. Here we assess the feasibility of integrating models for the individual steps in the drug delivery process (Figure 1) into models that can predict patient outcomes. We summarize the current models and highlight the knowledge gaps that are key to developing integrated models that can link administration to survival. In the future, with advances in our understanding of the steps in the delivery process and the development of more predictive models, it will be possible to use patient specific data to select drug and dosing regimens to optimize tumor growth trajectories and outcomes.
2. Pharmacokinetics
The uptake, distribution, and elimination of a drug are dependent on a wide range of physiological factors. To overcome the complexities in modeling these physiological interactions, the pharmacokinetics of a drug or drug delivery system are usually described by empirical models [1]. In many cases, the pharmacokinetics of a systemically administered drug can be analyzed using a one- or two-compartment model assuming first order rate constants (Fig. 2A) [1]. Analysis of the drug concentration in blood or plasma with time can be used to extract parameters such as Area Under the Curve (AUC), clearance rate, distribution volume, and elimination half-time. These models are relatively easy to use and an invaluable tool in providing global insight into the distribution and elimination of a drug.
Figure 2.
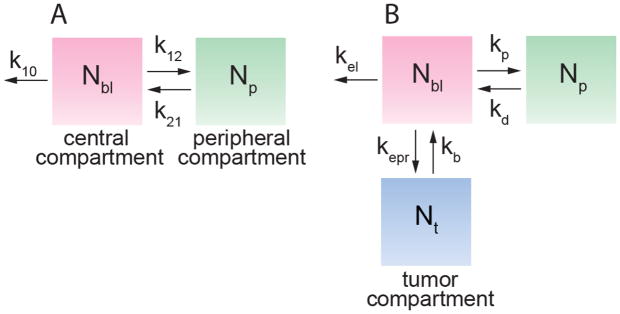
(A) Standard two compartment pharmacokinetic model with a central and peripheral compartments. Nbl and Np represent the amount of drug in blood (central compartment) and normal tissue (peripheral compartment), respectively. The first order rate constants k12 and k21 describe exchange between the two compartments, and k10 describes all processes leading to clearance from circulation, including elimination by the MPS and tumor accumulation. (B) Two compartment model with the addition of a tumor “compartment” defined in terms of the drug amount, where Nt is the amount of drug in the tumor, Nbl is the amount of drug in blood, and Np is the amount in peripheral tissue. Note that kp = k12, kd = k21. Exchange with the tumor is described by the rate constants kepr and kb, respectively. The rate constant kel to describe all other clearance processes.
While these empirical models are useful in developing therapeutic strategies and in comparing drugs, they have limited predictive power. The recent emergence of physiologically-based pharmacokinetics (PBPK) models holds promise for the prediction of pharmacokinetic parameters, and is an important step in the development of integrated cancer therapy models [2]. The classical two-compartment PK model divides the body into the vascular system and highly perfused tissues (the central compartment) and normal tissue (peripheral compartment). PBPK models consider blood perfusion throughout all organs and tissues of the body. The complexity of each organ compartment may vary from a simple perfusion rate limited model to more detailed models that take into account cellular and molecular level processes involved in drug binding and transport, such as plasma-protein binding affinities, membrane permeability, enzymatic stability, and transporter/pump activity [2]. These models can be patient specific by incorporating details of organ volume, blood flow, etc.
For many small molecules, the pharmokinetics are dictated by the intrinsic physicochemical properties of the drug, for example solubility, hydrophobicity/hydrophilicity, lipophilicity, charge, etc. Nanotechnology has provided the ability to decouple delivery and efficacy, allowing the fabrication of drug or gene delivery systems where the pharmacokinetics can be tuned independent of the therapeutic. For example, current nanomedicines such as Doxil and Abraxane have overcome problems with toxicity and low solubility [3]. Various strategies, such as pegylation, have been developed to increase circulation half-time [4–6]. However, the field is not sufficiently advanced to be able to predict pharmacokinetics based on the physico-chemical properties of the delivery system [7]. Establishing the relationship between physico-chemical properties and pharmacokinetics and developing design rules for delivery systems, will be key to predicting pharmacokinetics.
Summary
Current pharmacokinetic models applied to data from clinical trials or animal studies are able to provide insight into the circulation and biodistribution of specific drugs or drug delivery systems. Physiologically-based models have the potential to predict pharmacokinetic parameters. Length scales range from μm (capillary diameter) to km (vascular length) [8]. Establishing the relationships between physico-chemical properties and pharmacokinetic parameters will be key to developing predictive models for new nanomedicines. Since tumor accumulation is coupled to pharmacokinetic parameters, such as the concentration in circulation, developing predictive models is key to modeling tumor accumulation.
3. Extravasation and Tumor Accumulation by the Enhanced Permeation and Retention (EPR) Effect
Following systemic delivery, the accumulation of a drug at the tumor site is dependent on extravasation from the tumor vasculature. Extravasation can occur either by paracellular or transcellular transport. The tumor vasculature is characterized by a variety of abnormalities including irregular architecture, poor lymphatic drainage, loss of smooth muscle cells, local degradation of the extracellular matrix, and increased permeability of the endothelium (Fig. 3A) [9]. The increased permeability is important in mediating the uptake of a systemically administered drug in a solid tumor and is known as the enhanced permeation and retention (EPR) effect [9–12].
Figure 3.
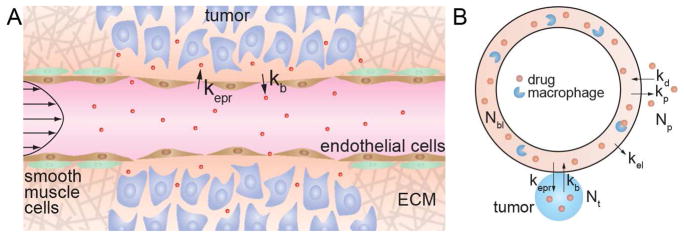
The influence of the EPR effect on tumor accumulation. (A) Schematic illustration of the EPR effect. The tumor vasculature is characterized by loss of smooth muscle cells, local degradation of the extracellular matrix, and increased permeability of the endothelium. The rate constants kepr and kb describe extravasation from circulation into the tumor, and intravasation back into the circulation, respectively. (B) Kinetic model for tumor accumulation by the EPR effect which includes a tumor compartment.
Despite its importance in modulating tumor accumulation, very little is known about the kinetics of the EPR effect. Accumulation of a drug or nanomedicine in a solid tumor by the EPR effect is dependent on the concentration in blood, and hence requires knowledge of the pharmacokinetics. In conventional pharmacokinetics models, extravasation of a drug at the tumor site is implicitly combined with other mechanisms of clearance from circulation, including renal clearance, uptake in other organs, clearance by the mononuclear phagocyte system (MPS), and enzymatic degradation, into the elimination rate constant k10 (Fig. 2). To distinguish tumor accumulation by the EPR effect from other elimination pathways, a recent model defines a tumor “compartment” and associated rate constants specifying drug accumulation and removal from the tumor (Fig. 3B) [13]. Drug extravasation into the tumor by the EPR effect is described by the rate constant kepr, and intravasation from the tumor back into circulation is described by kb. The rate constant kel describes clearance by the MPS and any other mechanisms.
Since the rate of tumor uptake by the EPR effect is repr = keprNbl, it is evident that tumor uptake is strongly dependent on the concentration in blood and hence on the circulation half-time. Similarly, the rate of intravasation back into circulation is rb = kbNt, and hence increases with increasing tumor uptake. For a drug molecule in circulation under pulsatile flow, the residence time of a drug molecule in the vicinity of a pore in the endothelium of the tumor vasculature is expected to be relatively short, and hence the probability of extravasation is expected to be low. Conversely, the residence time for a drug molecule in the vicinity of a pore on the tumor side of the endothelium is expected to be much higher since the rate of interstitial flow is much lower than blood flow. Consequently, the probability of extravasation is expected to lower than the probability of intravasation, kb > kepr.
While this model represents a major advance in allowing quantitative insight into the EPR effect, a detailed understanding of the rate constants kepr and kb will be key enabling predictions of tumor uptake. The rate constants have units of s−1 and are dependent on the length and leakiness of the tumor vasculature and hence are expected to be dependent on tumor type and exhibit patient-to-patient variations. Normalizing the rate constants to unit volume would allow comparison of different tumor sizes.
Kinetic models such as this can be used to fit pharmacokinetic and tumor accumulation data to obtain values for the rate constants that can then used to compare different tumor types or chemotherapeutics. Unfortunately time-dependent measurements of both the pharmacokinetics and tumor accumulation from human clinical trials are not available, and data from pre-clinical trials in animal models do not have sufficient detail.
Summary
The kinetics of extravasation from circulation of a drug or nanomedicine are key to connecting pharmacokinetic models to models for tumor growth and survivability. Recent models for the EPR effect provide a framework to link pharmacokinetics to tumor accumulation, but further refinements to incorporate spatial variability remain to be solved. Key feature sizes include, vessel diameter (≈ 20 μm), vessel spacing (≈ 100 μm), cut-off for paracellular transport (≈ 1 μm), and total tumor vasculature length (≈ 100 m) [13–18].
4. Transport, uptake, and trafficking
Drug efficacy, measured in terms of changes in tumor size or survival rate, is dependent on the amount of drug that extravasates from the vasculature and the fate of the drug after extravasation. The tumor microenvironment is characterized by densely packed tumor cells and tumor associated cells (macrophages, fibrobasts, etc.) embedded in extracellular matrix and bathed in interstitial fluid [18]. For drug delivery vehicles, the kinetics of drug release from the nanoparticle represent an additional step in the delivery process. Several approaches have been developed for diffusion controlled release of drugs from polymeric drug delivery vehicles [19–21].
Transport
Following extravasation, uptake of a drug or nanomedicine in target cells is preceded by transport in the tumor microenvironment. The transport process is determined by the architecture of tumor vasculature. MicroCT analysis of corrosion casts from 20 patients with colorectal adenocarcinoma revealed a median vascular density of about 5%, a median vessel diameter of about 20 μm, and a median vessel spacing of about 80 μm [14]. While the vessel diameter was independent of position in the tumor, the vessel spacing varied from about 50 μm at the tumor periphery to about 120 μm at the tumor core. Similar results have been obtained from analysis of xenografts in mouse models. Analysis of xenografts derived from poorly (LS147T) and highly (SW1222) differentiated human colorectal carcinomas, showed median vascular densities (with respect to the total tumor volume) of about 10% and 20%, respectively [14]. The average vessel diameter was about 20 μm for the LS147T xenograft, and about 30 μm for the SW1222 xenograft. The average vessel spacing was about 50 μm for the LS147T xenograft, and about 80 μm for the SW1222 xenograft. Since the vessel spacing in non-hypoxic regions is on the order of 100 μm, the diffusion length to reach cells furthest from the vessels is about 50 μm, however, transport to cells in hypoxic regions is significantly longer.
The transport of a drug is in the tumor microenvironment is analogous to a percolation process dependent on the porosity of the extracellular space. Transport is a balance between a source term (the input flux), determined by the EPR effect, and a sink term determined by the kinetics of binding and uptake in cells in the tumor microenvironment [18]. The penetration length of a drug or nanomedicine from a vessel is dependent on the interplay between the source and sink terms, both of which are dependent on the physico-chemical properties (size, charge, surface chemistry, etc.) of the drug. Simulations using coupled differential equations to describe diffusive transport have been used to model distribution of drugs and nanomedicines as a function of time in the tumor [22–24].
Uptake and trafficking
The mechanisms of cellular uptake, e.g. passive transport or endocytosis, are reasonably well understood [25–29]. However, very few models have been developed to simulate the kinetics of uptake and trafficking. With advances in molecular dynamics simulations, atomic scale simulations of uptake and comparison to experimental data will become a reality in the near future. The input parameter for uptake and trafficking is the time dependent concentration of a drug, obtained from transport models in the previous step. The required output parameters from models of uptake and trafficking are the rates of rates of proliferation and apoptosis. This is extremely challenging since the proliferation and apoptosis rates are dependent on time, cell type, and spatial location which determines local oxygen and nutrient concentrations.
Summary
Transport, uptake, and trafficking determine the drug distribution in the cells within a tumor and hence modulates the tumor growth rate. Developing accurate models for these processes is complicated by the complex 3D geometry. A particular challenge is developing models for proliferation and apoptosis in the cells within a tumor.
5. Tumor growth
The relationship between tumor size and disease progression has been studied for more than 150 years [30]. Tumor growth is a result of upregulated proliferation of cancer cells and is modulated by the supply of oxygen and nutrients. In most cases tumor growth is initially very fast with a rapid increase in tumor size, but at longer times the rate of growth decreases and the tumor size increases very slowly [31–33].
Assuming cell division is described by a first order rate constant k, then the number of cells at time t is given by N(t)=exp(kt) and the doubling time is td = ln2/k. The doubling time for growth of a 1 cm3 tumor containing 109 cells [34] over 10 years is 122 days. Analysis of the latter stages of tumor growth where growth is exponential, implies doubling times from a few months to a few years [35].
The Gompertz model empirically captures the initial exponential growth followed by a decrease in growth rate leading to a steady state tumor volume. This model assumes that the rate of tumor growth is dependent on the tumor volume V(t) and a time dependent growth rate (r(t)):
| (1) |
| (2) |
where ρ describes the rate of decrease of the growth rate. The solution to equations (1) and (2) gives:
| (3) |
The growth curve described by the Gompertz equation is sigmoidal with an initial exponential increase in tumor volume that reaches a maximum value (V0exp(r0/ρ)) at long times (Fig. 2). Although the Gompertz model is empirical, it can be fit to experimental data of tumor size versus time to predict future growth [36–38]. The Gompertz model has also been used to analyze the growth of tumor spheroids in vitro [32].
More physical models of tumor growth take into account the supply of oxygen and nutrients. In the simplest case, for a spherical avascular tumor and assuming that proliferation is limited by the supply of oxygen and nutrients to the tumor surface, and incorporating an apoptosis term, the rate of tumor growth can be written as [30]:
| (4) |
where α and β are constants. This is an application of the von Bertalanffy model [39] widely used to analyze fish growth rate data [40]. The solution also described a sigmoidal growth curve (Fig. 4):
| (5) |
Figure 4.

Empirical models for tumor growth. The Gomertz model and Bertalanffy model are characterized by sigmoidal tumor growth curves. Gompertz model with r0/ρ = 4.6 and ρ = 9.2. Bertalanffy model with α/β = 100 and β = 15.
More physiological approaches to describe tumor growth curves have drawn on more sophisticated models for ontogenetic growth. The base metabolic rate B of numerous species (both warm blooded and cold-blooded organisms) is empirically observed to be proportional to body mass M or volume with an exponent of 0.75, i.e. B = B0M3/4 [41]. This empirical observation has been captured in a quantitative model that takes into account a space filling branched network of vessels, with the capillary defining the smallest element, and minimizing the hydrodynamic resistance [42]. A quantitative model has been also been developed to describe ontogenetic growth, taking into account the metabolic energy needed to sustain existing tissue and the energy needed to create new tissue. The building block of this model is a single average cell, where the mass of the organism, m, is given by [31, 42]:
| (6) |
where the constants a and b can be related to physical properties of the single average cell. Notice the similarity to equation (6). This model also gives a sigmoidal time dependence of the mass of the biomass (Fig. 4) [31]. Analysis of in vitro growth of tumor spheroids and in vivo data in animal models and humans, has been used to suggest that tumor growth follows a universal growth law, with three adjustable parameters: the initial and final mass of the tumor, and the constant a [33]. The current challenge in this field is to bring physical insight into this universal behavior by combining models [43].
While these metabolic models provide valuable insight into tumor growth, further refinements must capture and patient-specific and tumor-specific differences in the architecture of the tumor vasculature. Ultimately, tumor growth models must also include terms to describe the decrease in tumor size associated with therapeutic interventions and hence coupling to models of transport and uptake.
Summary
There is a long history of modeling tumor growth rates. More recent models have taken into account metabolic limitations of tumor growth. Developing models of the decrease in tumor size following chemotherapy will require coupling to drug transport and uptake. In the context of existing tumor growth models, this will require insight into the processes embodied in the parameter b. Length scales vary from a single cell (≈ 10 μm) to the tumor size (≈ 1 cm).
6. Survival Rate Models
Survival rates quantify the probability of survival a certain time period after diagnosis [44]. Survival rates are inherently dependent on a large number of factors, the most important of which are disease-stage, age, ethnicity, lifestyle, and genetics. To compare data, care has to be taken to ensure that differences in the patient groups, tumors, and treatments do not confound the calculations. Analyses of patient survival data form the basis of all cancer survival models. Typically clinical data are summarized using either the life-table method, which plots the percent of patients surviving a particular time interval (typically months or years) as a function of time, or the Kaplan-Meier method, which charts the cumulative actual survival of individual patients against time (Fig. 5).
Figure 5.
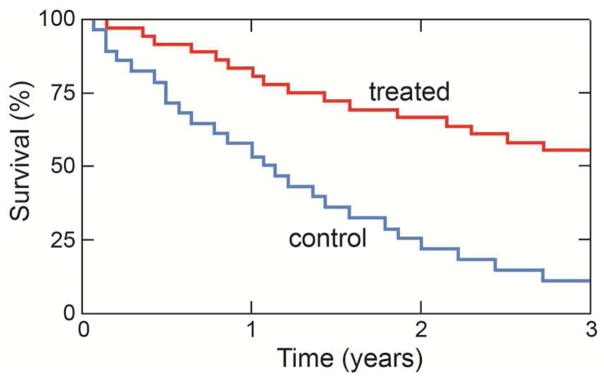
Kaplan-Meier plot of the survival data of two different groups of patients. Individual deaths are recorded on the plot, which shows that the three-year overall survival probability of one group (blue) is significantly lower than that of the other group (red).
Survival models are generally derived from fits to clinical survival data that make empirical assumptions about factors affecting survival in clinical setting. The aim of these models is primarily to aid the optimization of overall survival at phase III clinical trials based on available phase I/II data [45]. These empirical models are usually based on tumor metrics or unrelated factors.
Relationship between tumor metrics and survival rate
Longitudinal tumor metrics are commonly used in models to predict overall cancer survival. Early change in tumor size (ECTS), based on measurements of the largest diameters of a fixed number of lesions, remains the most important and reliable clinical tumor metric [46]. ECTS is easy to measure and compare to other longitudinal survival data and survival models.
Semi-parametric Cox proportional-hazard models are the standard epidemiological tool to analyze survival data, and are frequently employed in oncological studies to identify baseline prognostic factors and the relationships between biomarkers and overall survival [47]. Typical baseline prognostic factors are: tumor burden (tumor size and number of metastatic sites), molecular markers (e.g. serum albumin), oncological performance status (quantifying the general well-being of a patient), and disease history (previous diagnoses and treatments). These factors are typically added as covariates in addition to the tumor biomarkers [45]. Simulation studies typically parameterize a model using baseline factors and longitudinal tumor growth metrics (e.g. from a phase I or II clinical trial) and subsequently apply the model to predict overall survival in a later stage clinical trial or unrelated patient group [48].
Alternative variables and biomarkers to predict overall survival
Several variables that are unrelated to tumor metrics have been explored to predict overall survival. Systemic drug exposure defined by the area under the curve (AUC) from pharmacokinetic data, for example, has been shown to correlate strongly with overall survival [49], while a specific pharmacological biomarker measuring the effectiveness of a cancer drug has been shown to outperform tumor metric based models [50]. Other predictors include treatment side effects such as neutrophil count and blood pressure [51].
Advances in genomics methods have facilitated the search for molecular biomarkers [52]. Given the genetic heterogeneity of tumors, even of the same type, genetic biomarkers have been proposed and studied as predictors of patient survival [53, 54]. For example, studies utilizing mutations in genes associated to DNA repair have been successfully employed as biomarkers in predictive models of survival for breast cancer [55] as well as colorectal carcinoma [56]. These models are typically ‘trained’ on clinical datasets that combine classical tumor metrics with individual gene expression microarray information for a large number of patients (e.g. [57]) to identify genes that give good prediction of overall survival. Models are then verified on ‘testing’ data sets, derived in a similar manner from an unrelated group of patients with the same diagnosis. Given the large number of genetic variations in tumor cells, recent models have extended these approaches to include complex biomarkers that are groups of genes describing entire biological pathways [58] or meta-genes [59].
Summary
Models of cancer survival currently employ empirical Cox-regression, often based on complex clinical datasets that try to identify covariates that contribute significantly towards survival. Typical considerations are age, ethnicity, lifestyle, disease-stage at diagnosis, and genetics. Key problems with cancer survival modeling are the complexity of the disease, physical and genetic heterogeneity of tumors, and difficulty in identifying biomarkers that are strong predictors of overall survival. Indeed, a recent study found that most random gene expression signatures can be utilized as biomarkers for statistically significant prediction of breast cancer survival [60], but identifying strong predictors remains challenging. In addition survival times can vary strongly between individuals, especially in the presence of co-morbidities (e.g. diabetes, coronary heart disease, genetic factors, etc.). Predictive quantitative models of patient survival rates will require significant advances in our understanding of the relationship between tumor metrics and the concentration of molecular or genetic markers, and survival rates.
7. Conclusions
Systemic delivery of a chemotherapeutic agent is dependent on a sequence of steps including circulation, extravasation, transport in the tumor microenvironment, the mechanism of cellular uptake and trafficking, and the mechanism of drug action. Historically models for individual steps in the delivery process have had limited predictive power, however, progress in our understanding of the mechanisms involved suggest that predictive models may be realized in the near future. Ultimately, integration of the models for the individual steps in the delivery process could provide tools for guiding clinical management of chemotherapy.
Supplementary Material
Acknowledgments
This work was supported by the National Institutes of Health (U54CA151838 and R01CA170629).
Footnotes
Publisher's Disclaimer: This is a PDF file of an unedited manuscript that has been accepted for publication. As a service to our customers we are providing this early version of the manuscript. The manuscript will undergo copyediting, typesetting, and review of the resulting proof before it is published in its final citable form. Please note that during the production process errors may be discovered which could affect the content, and all legal disclaimers that apply to the journal pertain.
References
- 1.Gibaldi M, Perrier D. Pharmacokinetics. 3. Dekker; New York: 2006. [Google Scholar]
- 2.Rowland M, Peck C, Tucker G. Physiologically-Based Pharmacokinetics in Drug Development and Regulatory Science. Annu Rev Pharmacol. 2011;51:45–73. doi: 10.1146/annurev-pharmtox-010510-100540. [DOI] [PubMed] [Google Scholar]
- 3.Dawidczyk CM, Kim C, Park JH, Russell LM, Lee KH, Pomper MG, Searson PC. State-of-the-art in design rules for drug delivery platforms: Lessons learned from FDA-approved nanomedicines. Journal of controlled release: official journal of the Controlled Release Society. 2014;187C:133–144. doi: 10.1016/j.jconrel.2014.05.036. [DOI] [PMC free article] [PubMed] [Google Scholar]
- 4.Klibanov AL, Maruyama K, Beckerleg AM, Torchilin VP, Huang L. Activity of Amphipathic Poly(Ethylene Glycol)-5000 to Prolong the Circulation Time of Liposomes Depends on the Liposome Size and Is Unfavorable for Immunoliposome Binding to Target. Biochim Biophys Acta. 1991;1062:142–148. doi: 10.1016/0005-2736(91)90385-l. [DOI] [PubMed] [Google Scholar]
- 5.Hu CMJ, Zhang L, Aryal S, Cheung C, Fang RH, Zhang LF. Erythrocyte membrane-camouflaged polymeric nanoparticles as a biomimetic delivery platform. Proceedings of the National Academy of Sciences of the United States of America. 2011;108:10980–10985. doi: 10.1073/pnas.1106634108. [DOI] [PMC free article] [PubMed] [Google Scholar]
- 6.Rodriguez PL, Harada T, Christian DA, Pantano DA, Tsai RK, Discher DE. Minimal “Self” Peptides That Inhibit Phagocytic Clearance and Enhance Delivery of Nanoparticles. Science. 2013;339:971–975. doi: 10.1126/science.1229568. [DOI] [PMC free article] [PubMed] [Google Scholar]
- 7.Dawidczyk CM, Russell LM, Searson PC. Nanomedicines for cancer therapy: state-of-the-art and limitations to pre-clinical studies that hinder future developments. Frontiers in Chemistry - Chemical Engineering. 2014;2:e69. doi: 10.3389/fchem.2014.00069. [DOI] [PMC free article] [PubMed] [Google Scholar]
- 8.Aird WC. Phenotypic heterogeneity of the endothelium I. Structure, function, and mechanisms. Circ Res. 2007;100:158–173. doi: 10.1161/01.RES.0000255691.76142.4a. [DOI] [PubMed] [Google Scholar]
- 9.Jain RK. Delivery of molecular and cellular medicine to solid tumors. Advanced drug delivery reviews. 1997;26:71–90. doi: 10.1016/s0169-409x(97)00027-6. [DOI] [PubMed] [Google Scholar]
- 10.Maeda H. Macromolecular therapeutics in cancer treatment: the EPR effect and beyond. Journal of controlled release: official journal of the Controlled Release Society. 2012;164:138–144. doi: 10.1016/j.jconrel.2012.04.038. [DOI] [PubMed] [Google Scholar]
- 11.Fang J, Nakamura H, Maeda H. The EPR effect: Unique features of tumor blood vessels for drug delivery, factors involved, and limitations and augmentation of the effect. Advanced drug delivery reviews. 2011;63:136–151. doi: 10.1016/j.addr.2010.04.009. [DOI] [PubMed] [Google Scholar]
- 12.Jain RK, Stylianopoulos T. Delivering nanomedicine to solid tumors. Nat Rev Clin Oncol. 2010;7:653–664. doi: 10.1038/nrclinonc.2010.139. [DOI] [PMC free article] [PubMed] [Google Scholar]
- 13.Wong AD, Ye M, Ulmschneider MB, Searson PC. Quantitative Analysis of the Enhanced Permeation and Retention (EPR) Effect. Plos One. 2015;10:e0123461. doi: 10.1371/journal.pone.0123461. [DOI] [PMC free article] [PubMed] [Google Scholar]
- 14.Folarin AA, Konerding MA, Timonen J, Nagl S, Pedley RB. Three-dimensional analysis of tumour vascular corrosion casts using stereoimaging and micro-computed tomography. Microvascular research. 2010;80:89–98. doi: 10.1016/j.mvr.2010.03.007. [DOI] [PMC free article] [PubMed] [Google Scholar]
- 15.Konerding MA, Fait E, Gaumann A. 3D microvascular architecture of pre-cancerous lesions and invasive carcinomas of the colon. British journal of cancer. 2001;84:1354–1362. doi: 10.1054/bjoc.2001.1809. [DOI] [PMC free article] [PubMed] [Google Scholar]
- 16.Konerding MA, Malkusch W, Klapthor B, van Ackern C, Fait E, Hill SA, Parkins C, Chaplin DJ, Presta M, Denekamp J. Evidence for characteristic vascular patterns in solid tumours: quantitative studies using corrosion casts. British journal of cancer. 1999;80:724–732. doi: 10.1038/sj.bjc.6690416. [DOI] [PMC free article] [PubMed] [Google Scholar]
- 17.Primeau AJ, Rendon A, Hedley D, Lilge L, Tannock IF. The distribution of the anticancer drug Doxorubicin in relation to blood vessels in solid tumors. Clinical cancer research: an official journal of the American Association for Cancer Research. 2005;11:8782–8788. doi: 10.1158/1078-0432.CCR-05-1664. [DOI] [PubMed] [Google Scholar]
- 18.Minchinton AI, Tannock IF. Drug penetration in solid tumours. Nature reviews Cancer. 2006;6:583–592. doi: 10.1038/nrc1893. [DOI] [PubMed] [Google Scholar]
- 19.Siepmann J, Siepmann F. Modeling of diffusion controlled drug delivery. Journal of Controlled Release. 2012;161:351–362. doi: 10.1016/j.jconrel.2011.10.006. [DOI] [PubMed] [Google Scholar]
- 20.Weiser JR, Saltzman WM. Controlled release for local delivery of drugs: barriers and models. Journal of Controlled Release. 2014;190:664–673. doi: 10.1016/j.jconrel.2014.04.048. [DOI] [PMC free article] [PubMed] [Google Scholar]
- 21.Peppas NA, Narasimhan B. Mathematical models in drug delivery: How modeling has shaped the way we design new drug delivery systems. Journal of Controlled Release. 2014;190:75–81. doi: 10.1016/j.jconrel.2014.06.041. [DOI] [PubMed] [Google Scholar]
- 22.Goh YMF, Kong HL, Wang CH. Simulation of the delivery of doxorubicin to hepatoma. Pharmaceut Res. 2001;18:761–770. doi: 10.1023/a:1011076110317. [DOI] [PubMed] [Google Scholar]
- 23.Schmidt MM, Wittrup KD. A modeling analysis of the effects of molecular size and binding affinity on tumor targeting. Molecular cancer therapeutics. 2009;8:2861–2871. doi: 10.1158/1535-7163.MCT-09-0195. [DOI] [PMC free article] [PubMed] [Google Scholar]
- 24.Liu C, Krishnan, Xu XY. Towards an integrated systems-based modelling framework for drug transport and its effect on tumour cells. Journal of biological engineering. 2014;8:3. doi: 10.1186/1754-1611-8-3. [DOI] [PMC free article] [PubMed] [Google Scholar]
- 25.Cecchelli R, Berezowski V, Lundquist S, Culot M, Renftel M, Dehouck MP, Fenart L. Modelling of the blood-brain barrier in drug discovery and development. Nature Reviews Drug Discovery. 2007;6:650–661. doi: 10.1038/nrd2368. [DOI] [PubMed] [Google Scholar]
- 26.Conner SD, Schmid SL. Regulated portals of entry into the cell. Nature. 2003;422:37–44. doi: 10.1038/nature01451. [DOI] [PubMed] [Google Scholar]
- 27.Marsh M, McMahon HT. Cell biology - The structural era of endocytosis. Science. 1999;285:215–220. doi: 10.1126/science.285.5425.215. [DOI] [PubMed] [Google Scholar]
- 28.Soldati T, Schliwa M. Powering membrane traffic in endocytosis and recycling. Nat Rev Mol Cell Bio. 2006;7:897–908. doi: 10.1038/nrm2060. [DOI] [PubMed] [Google Scholar]
- 29.Dobson PD, Kell DB. Carrier-mediated cellular uptake of pharmaceutical drugs: an exception or the rule? Nature reviews Drug discovery. 2008;7:205–220. doi: 10.1038/nrd2438. [DOI] [PubMed] [Google Scholar]
- 30.Gerlee P. The Model Muddle: In Search of Tumor Growth Laws. Cancer Res. 2013;73:2407–2411. doi: 10.1158/0008-5472.CAN-12-4355. [DOI] [PubMed] [Google Scholar]
- 31.West GB, Brown JH, Enquist BJ. A general model for ontogenetic growth. Nature. 2001;413:628–631. doi: 10.1038/35098076. [DOI] [PubMed] [Google Scholar]
- 32.Chignola R, Schenetti A, Andrighetto G, Chiesa E, Foroni R, Sartoris S, Tridente G, Liberati D. Forecasting the growth of multicell tumour spheroids: implications for the dynamic growth of solid tumours. Cell Proliferat. 2000;33:219–229. doi: 10.1046/j.1365-2184.2000.00174.x. [DOI] [PMC free article] [PubMed] [Google Scholar]
- 33.Guiot C, Degiorgis PG, Delsanto PP, Gabriele P, Deisboeck TS. Does tumor growth follow a “universal law”? J Theor Biol. 2003;225:147–151. doi: 10.1016/s0022-5193(03)00221-2. [DOI] [PubMed] [Google Scholar]
- 34.Del Monte U. Does the cell number 109 still really fit one gram of tumor tissue? Cell Cycle. 2009;8:505–506. doi: 10.4161/cc.8.3.7608. [DOI] [PubMed] [Google Scholar]
- 35.Friberg S, Mattson S. On the growth rates of human malignant tumors: Implications for medical decision making. J Surg Oncol. 1997;65:284–297. doi: 10.1002/(sici)1096-9098(199708)65:4<284::aid-jso11>3.0.co;2-2. [DOI] [PubMed] [Google Scholar]
- 36.Norton L. Implications of Kinetic Heterogeneity in Clinical Oncology. Semin Oncol. 1985;12:231–249. [PubMed] [Google Scholar]
- 37.Norton L. A Gompertzian Model of Human-Breast Cancer Growth. Cancer Res. 1988;48:7067–7071. [PubMed] [Google Scholar]
- 38.Simpson-Herren L, Lloyd HH. Kinetic Parameters and Growth Curves for Experimental Tumor Systems. Cancer Chemoth Rep. 1970;1(54):143–174. [PubMed] [Google Scholar]
- 39.Bertalanffy L. Problems of organic growth. Nature. 1949;163:156–158. doi: 10.1038/163156a0. [DOI] [PubMed] [Google Scholar]
- 40.Essington TE, Kitchell JF, Walters CJ. The von Bertalanffy growth function, bioenergetics, and the consumption rates of fish. Can J Fish Aquat Sci. 2001;58:2129–2138. [Google Scholar]
- 41.Kleiber M. Body Size and Metabolic Rate. Physiol Rev. 1947;27:511–541. doi: 10.1152/physrev.1947.27.4.511. [DOI] [PubMed] [Google Scholar]
- 42.West GB, Brown JH, Enquist BJ. A general model for the origin of allometric scaling laws in biology. Science. 1997;276:122–126. doi: 10.1126/science.276.5309.122. [DOI] [PubMed] [Google Scholar]
- 43.Herman AB, Savage VM, West GB. A Quantitative Theory of Solid Tumor Growth, Metabolic Rate and Vascularization. Plos One. 2011;6 doi: 10.1371/journal.pone.0022973. [DOI] [PMC free article] [PubMed] [Google Scholar]
- 44.Hayat MJ, Howlader N, Reichman ME, Edwards BK. Cancer statistics, trends, and multiple primary cancer analyses from the surveillance, epidemiology, and end results (SEER) program. Oncologist. 2007;12:20–37. doi: 10.1634/theoncologist.12-1-20. [DOI] [PubMed] [Google Scholar]
- 45.Bruno R, Mercier F, Claret L. Model-based drug development in oncology: what’s next? Clinical pharmacology and therapeutics. 2013;93:303–305. doi: 10.1038/clpt.2013.8. [DOI] [PubMed] [Google Scholar]
- 46.Bruno R, Mercier F, Claret L. Evaluation of tumor size response metrics to predict survival in oncology clinical trials. Clinical pharmacology and therapeutics. 2014;95:386–393. doi: 10.1038/clpt.2014.4. [DOI] [PubMed] [Google Scholar]
- 47.Cox DR. Regression Models and Life-Tables. J R Stat Soc B. 1972;34:187. [Google Scholar]
- 48.Claret L, Girard P, Hoff PM, Van Cutsem E, Zuideveld KP, Jorga K, Fagerberg J, Bruno R. Model-based prediction of phase III overall survival in colorectal cancer on the basis of phase II tumor dynamics. Journal of clinical oncology: official journal of the American Society of Clinical Oncology. 2009;27:4103–4108. doi: 10.1200/JCO.2008.21.0807. [DOI] [PubMed] [Google Scholar]
- 49.Lu JF, Rasmussen E, Karlan BY, Vergote IB, Navale L, Kuchimanchi M, Melara R, Stepan DE, Weinreich DM, Sun YN. Exposure-response relationship of AMG 386 in combination with weekly paclitaxel in recurrent ovarian cancer and its implication for dose selection. Cancer chemotherapy and pharmacology. 2012;69:1135–1144. doi: 10.1007/s00280-011-1787-5. [DOI] [PMC free article] [PubMed] [Google Scholar]
- 50.Hansson EK, Ma G, Amantea MA, French J, Milligan PA, Friberg LE, Karlsson MO. PKPD Modeling of Predictors for Adverse Effects and Overall Survival in Sunitinib-Treated Patients With GIST. CPT: pharmacometrics & systems pharmacology. 2013;2:e85. doi: 10.1038/psp.2013.62. [DOI] [PMC free article] [PubMed] [Google Scholar]
- 51.Hansson EK, Amantea MA, Westwood P, Milligan PA, Houk BE, French J, Karlsson MO, Friberg LE. PKPD Modeling of VEGF, sVEGFR-2, sVEGFR-3, and sKIT as Predictors of Tumor Dynamics and Overall Survival Following Sunitinib Treatment in GIST. CPT: pharmacometrics & systems pharmacology. 2013;2:e84. doi: 10.1038/psp.2013.61. [DOI] [PMC free article] [PubMed] [Google Scholar]
- 52.Ludwig JA, Weinstein JN. Biomarkers in cancer staging, prognosis and treatment selection. Nature reviews Cancer. 2005;5:845–856. doi: 10.1038/nrc1739. [DOI] [PubMed] [Google Scholar]
- 53.Verhoog LC, Brekelmans CT, Seynaeve C, van den Bosch LM, Dahmen G, van Geel AN, Tilanus-Linthorst MM, Bartels CC, Wagner A, van den Ouweland A, Devilee P, Meijers-Heijboer EJ, Klijn JG. Survival and tumour characteristics of breast-cancer patients with germline mutations of BRCA1. Lancet. 1998;351:316–321. doi: 10.1016/s0140-6736(97)07065-7. [DOI] [PubMed] [Google Scholar]
- 54.Chia SK, Bramwell VH, Tu D, Shepherd LE, Jiang S, Vickery T, Mardis E, Leung S, Ung K, Pritchard KI, Parker JS, Bernard PS, Perou CM, Ellis MJ, Nielsen TO. A 50-gene intrinsic subtype classifier for prognosis and prediction of benefit from adjuvant tamoxifen. Clinical cancer research: an official journal of the American Association for Cancer Research. 2012;18:4465–4472. doi: 10.1158/1078-0432.CCR-12-0286. [DOI] [PMC free article] [PubMed] [Google Scholar]
- 55.van de Vijver MJ, He YD, van’t Veer LJ, Dai H, Hart AA, Voskuil DW, Schreiber GJ, Peterse JL, Roberts C, Marton MJ, Parrish M, Atsma D, Witteveen A, Glas A, Delahaye L, van der Velde T, Bartelink H, Rodenhuis S, Rutgers ET, Friend SH, Bernards R. A gene-expression signature as a predictor of survival in breast cancer. The New England journal of medicine. 2002;347:1999–2009. doi: 10.1056/NEJMoa021967. [DOI] [PubMed] [Google Scholar]
- 56.Luey N, Toon CW, Sioson L, Clarkson A, Watson N, Cussigh C, Kedziora A, Pincott S, Pillinger S, Evans J, Percy J, Engel A, Schnitzler M, Gill AJ. A Further Investigation of Combined Mismatch Repair and BRAFV600E Mutation Specific Immunohistochemistry as a Predictor of Overall Survival in Colorectal Carcinoma. Plos One. 2014;9:e106105. doi: 10.1371/journal.pone.0106105. [DOI] [PMC free article] [PubMed] [Google Scholar]
- 57.Miller LD, Smeds J, George J, Vega VB, Vergara L, Ploner A, Pawitan Y, Hall P, Klaar S, Liu ET, Bergh J. An expression signature for p53 status in human breast cancer predicts mutation status, transcriptional effects, and patient survival. Proceedings of the National Academy of Sciences of the United States of America. 2005;102:13550–13555. doi: 10.1073/pnas.0506230102. [DOI] [PMC free article] [PubMed] [Google Scholar]
- 58.Huang S, Yee C, Ching T, Yu H, Garmire LX. A novel model to combine clinical and pathway-based transcriptomic information for the prognosis prediction of breast cancer. PLoS computational biology. 2014;10:e1003851. doi: 10.1371/journal.pcbi.1003851. [DOI] [PMC free article] [PubMed] [Google Scholar]
- 59.Cheng WY, Ou Yang TH, Anastassiou D. Development of a prognostic model for breast cancer survival in an open challenge environment. Science translational medicine. 2013;5:181ra150. doi: 10.1126/scitranslmed.3005974. [DOI] [PubMed] [Google Scholar]
- 60.Venet D, Dumont JE, Detours V. Most random gene expression signatures are significantly associated with breast cancer outcome. PLoS computational biology. 2011;7:e1002240. doi: 10.1371/journal.pcbi.1002240. [DOI] [PMC free article] [PubMed] [Google Scholar]
Associated Data
This section collects any data citations, data availability statements, or supplementary materials included in this article.